KVM4NFV User Guide
Userguide Abstract
In KVM4NFV project, we focus on the KVM hypervisor to enhance it for NFV, by looking at the following areas initially-
- Minimal Interrupt latency variation for data plane VNFs:
- Minimal Timing Variation for Timing correctness of real-time VNFs
- Minimal packet latency variation for data-plane VNFs
- Inter-VM communication
- Fast live migration
Userguide Introduction
Overview
The project “NFV Hypervisors-KVM” makes collaborative efforts to enable NFV features for existing hypervisors, which are not necessarily designed or targeted to meet the requirements for the NFVI.The KVM4NFV scenario consists of Continuous Integration builds, deployments and testing combinations of virtual infrastructure components.
KVM4NFV Features
Using this project, the following areas are targeted-
- Minimal Interrupt latency variation for data plane VNFs:
- Minimal Timing Variation for Timing correctness of real-time VNFs
- Minimal packet latency variation for data-plane VNFs
- Inter-VM communication
- Fast live migration
Some of the above items would require software development and/or specific hardware features, and some need just configurations information for the system (hardware, BIOS, OS, etc.).
We include a requirements gathering stage as a formal part of the project. For each subproject, we will start with an organized requirement stage so that we can determine specific use cases (e.g. what kind of VMs should be live migrated) and requirements (e.g. interrupt latency, jitters, Mpps, migration-time, down-time, etc.) to set out the performance goals.
Potential future projects would include:
- Dynamic scaling (via scale-out) using VM instantiation
- Fast live migration for SR-IOV
The user guide outlines how to work with key components and features in the platform, each feature description section will indicate the scenarios that provide the components and configurations required to use it.
The configuration guide details which scenarios are best for you and how to install and configure them.
General usage guidelines
The user guide for KVM4NFV features and capabilities provide step by step instructions for using features that have been configured according to the installation and configuration instructions.
Scenarios User Guide
The procedure to deploy/test KVM4NFV scenarios in a nested virtualization or on bare-metal environment is mentioned in the below link. The kvm4nfv user guide can be found at docs/scenarios
http://artifacts.opnfv.org/kvmfornfv/docs/index.html#kvmfornfv-scenarios-overview-and-description
The deployment has been verified for os-nosdn-kvm-ha, os-nosdn-kvm-noha, os-nosdn-kvm_ovs_dpdk-ha, os-nosdn-kvm_ovs_dpdk-noha and os-nosdn-kvm_ovs_dpdk_bar-ha, os-nosdn-kvm_ovs_dpdk_bar-noha test scenarios.
For brief view of the above scenarios use:
http://artifacts.opnfv.org/kvmfornfv/docs/index.html#scenario-abstract
Using common platform components
This section outlines basic usage principals and methods for some of the commonly deployed components of supported OPNFV scenario’s in Danube. The subsections provide an outline of how these components are commonly used and how to address them in an OPNFV deployment.The components derive from autonomous upstream communities and where possible this guide will provide direction to the relevant documentation made available by those communities to better help you navigate the OPNFV deployment.
Using Danube Features
The following sections of the user guide provide feature specific usage guidelines and references for KVM4NFV project.
- <project>/docs/userguide/low_latency.userguide.rst
- <project>/docs/userguide/live_migration.userguide.rst
- <project>/docs/userguide/tuning.userguide.rst
FTrace Debugging Tool
About Ftrace
Ftrace is an internal tracer designed to find what is going on inside the kernel. It can be used for debugging or analyzing latencies and performance related issues that take place outside of user-space. Although ftrace is typically considered the function tracer, it is really a frame work of several assorted tracing utilities.
One of the most common uses of ftrace is the event tracing.
Note: - For KVM4NFV, Ftrace is preferred as it is in-built kernel tool - More stable compared to other debugging tools
Version Features
| Release | Features |
|---|---|
| Colorado |
|
| Danube |
|
Implementation of Ftrace
Ftrace uses the debugfs file system to hold the control files as well as the files to display output.
When debugfs is configured into the kernel (which selecting any ftrace option will do) the directory /sys/kernel/debug will be created. To mount this directory, you can add to your /etc/fstab file:
debugfs /sys/kernel/debug debugfs defaults 0 0
Or you can mount it at run time with:
mount -t debugfs nodev /sys/kernel/debug
Some configurations for Ftrace are used for other purposes, like finding latency or analyzing the system. For the purpose of debugging, the kernel configuration parameters that should be enabled are:
CONFIG_FUNCTION_TRACER=y
CONFIG_FUNCTION_GRAPH_TRACER=y
CONFIG_STACK_TRACER=y
CONFIG_DYNAMIC_FTRACE=y
The above parameters must be enabled in /boot/config-4.4.0-el7.x86_64 i.e., kernel config file for ftrace to work. If not enabled, change the parameter to y and run.,
On CentOS
grub2-mkconfig -o /boot/grub2/grub.cfg
sudo reboot
Re-check the parameters after reboot before running ftrace.
Files in Ftrace:
The below is a list of few major files in Ftrace.
current_tracer:This is used to set or display the current tracer that is configured.
available_tracers:This holds the different types of tracers that have been compiled into the kernel. The tracers listed here can be configured by echoing their name into current_tracer.
tracing_on:This sets or displays whether writing to the tracering buffer is enabled. Echo 0 into this file to disable the tracer or 1 to enable it.
trace:This file holds the output of the trace in a human readable format.
tracing_cpumask:This is a mask that lets the user only trace on specified CPUs. The format is a hex string representing the CPUs.
events:It holds event tracepoints (also known as static tracepoints) that have been compiled into the kernel. It shows what event tracepoints exist and how they are grouped by system.
Avaliable Tracers
Here is the list of current tracers that may be configured based on usage.
- function
- function_graph
- irqsoff
- preemptoff
- preemptirqsoff
- wakeup
- wakeup_rt
Brief about a few:
function:Function call tracer to trace all kernel functions.
function_graph:Similar to the function tracer except that the function tracer probes the functions on their entry whereas the function graph tracer traces on both entry and exit of the functions.
nop:This is the “trace nothing” tracer. To remove tracers from tracing simply echo “nop” into current_tracer.
Examples:
To list available tracers:
[tracing]# cat available_tracers
function_graph function wakeup wakeup_rt preemptoff irqsoff preemptirqsoff nop

Usage:
[tracing]# echo function > current_tracer
[tracing]# cat current_tracer
function

To view output:
[tracing]# cat trace | head -10

To Stop tracing:
[tracing]# echo 0 > tracing_on

To Start/restart tracing:
[tracing]# echo 1 > tracing_on;
Ftrace in KVM4NFV
Ftrace is part of KVM4NFV D-Release. KVM4NFV built 4.4-linux-Kernel will be tested by executing cyclictest and analyzing the results/latency values (max, min, avg) generated. Ftrace (or) function tracer is a stable kernel inbuilt debugging tool which tests real time kernel and outputs a log as part of the code. These output logs are useful in following ways.
- Kernel Debugging.
- Helps in Kernel code optimization and
- Can be used to better understand the kernel level code flow
Ftrace logs for KVM4NFV can be found here:
Ftrace Usage in KVM4NFV Kernel Debugging:
Kvm4nfv has two scripts in /ci/envs to provide ftrace tool:
- enable_trace.sh
- disable_trace.sh
Found at.,
$ cd kvmfornfv/ci/envs
Enabling Ftrace in KVM4NFV
The enable_trace.sh script is triggered by changing ftrace_enable value in test_kvmfornfv.sh script to 1 (which is zero by default). Change as below to enable Ftrace.
ftrace_enable=1
Note:
- Ftrace is enabled before
Details of enable_trace script
- CPU coremask is calculated using getcpumask()
- All the required events are enabled by,
- echoing “1” to $TRACEDIR/events/event_name/enable file
Example,
$TRACEDIR = /sys/kernel/debug/tracing/
sudo bash -c "echo 1 > $TRACEDIR/events/irq/enable"
sudo bash -c "echo 1 > $TRACEDIR/events/task/enable"
sudo bash -c "echo 1 > $TRACEDIR/events/syscalls/enable"
The set_event file contains all the enabled events list
- Function tracer is selected. May be changed to other avaliable tracers based on requirement
sudo bash -c "echo function > $TRACEDIR/current_tracer
- When tracing is turned ON by setting
tracing_on=1, thetracefile keeps getting append with the traced data untiltracing_on=0and then ftrace_buffer gets cleared.
To Stop/Pause,
echo 0 >tracing_on;

To Start/Restart,
echo 1 >tracing_on;
- Once tracing is diabled, disable_trace.sh script is triggered.
Details of disable_trace Script
In disable trace script the following are done:
- The trace file is copied and moved to /tmp folder based on timestamp
- The current tracer file is set to
nop - The set_event file is cleared i.e., all the enabled events are disabled
- Kernel Ftrace is disabled/unmounted
Publishing Ftrace logs:
The generated trace log is pushed to artifacts by kvmfornfv-upload-artifact.sh script available in releng which will be triggered as a part of kvm4nfv daily job. The trigger in the script is.,
echo "Uploading artifacts for future debugging needs...."
gsutil cp -r $WORKSPACE/build_output/log-*.tar.gz $GS_LOG_LOCATION > $WORKSPACE/gsutil.log 2>&1
KVM4NFV Dashboard Guide
Dashboard for KVM4NFV Daily Test Results
Abstract
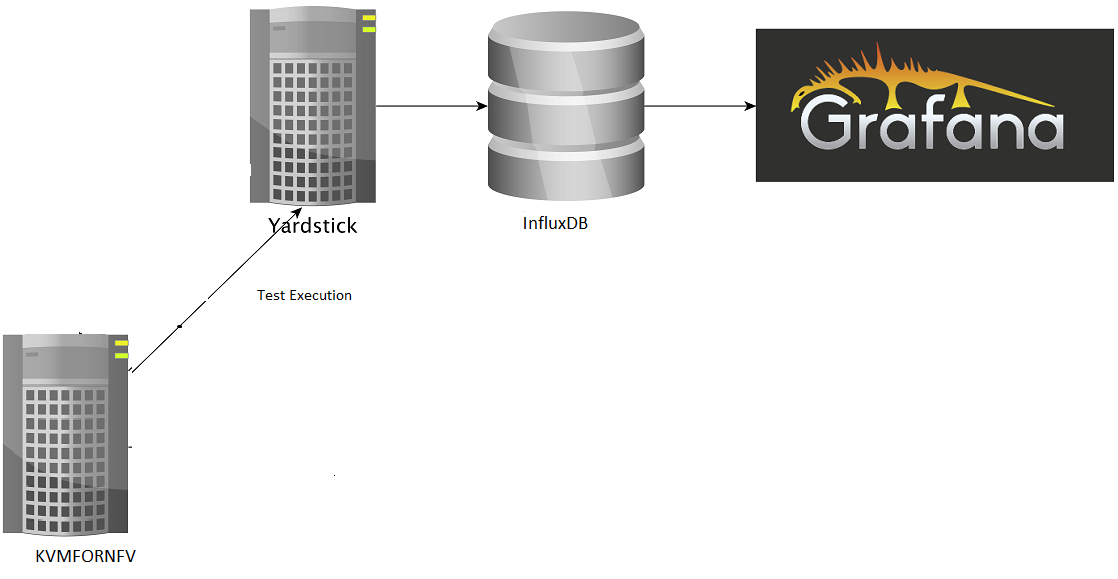
This chapter explains the procedure to configure the InfluxDB and Grafana on Node1 or Node2 depending on the testtype to publish KVM4NFV test results. The cyclictest cases are executed and results are published on Yardstick Dashboard(Grafana). InfluxDB is the database which will store the cyclictest results and Grafana is a visualisation suite to view the maximum,minimum and average values of the time series data of cyclictest results.The framework is shown in below image.
Version Features
| Release | Features |
|---|---|
| Colorado |
|
| Danube |
|
Installation Steps:
To configure Yardstick, InfluxDB and Grafana for KVM4NFV project following sequence of steps are followed:
Note:
All the below steps are done as per the script, which is a part of CICD integration of kvmfornfv.
For Yardstick:
git clone https://gerrit.opnfv.org/gerrit/yardstick

For InfluxDB:
docker pull tutum/influxdb
docker run -d --name influxdb -p 8083:8083 -p 8086:8086 --expose 8090 --expose 8099 tutum/influxdb
docker exec -it influxdb bash
$influx
>CREATE USER root WITH PASSWORD 'root' WITH ALL PRIVILEGES
>CREATE DATABASE yardstick;
>use yardstick;
>show MEASUREMENTS;

For Grafana:
docker pull grafana/grafana
docker run -d --name grafana -p 3000:3000 grafana/grafana
The Yardstick document for Grafana and InfluxDB configuration can be found here.
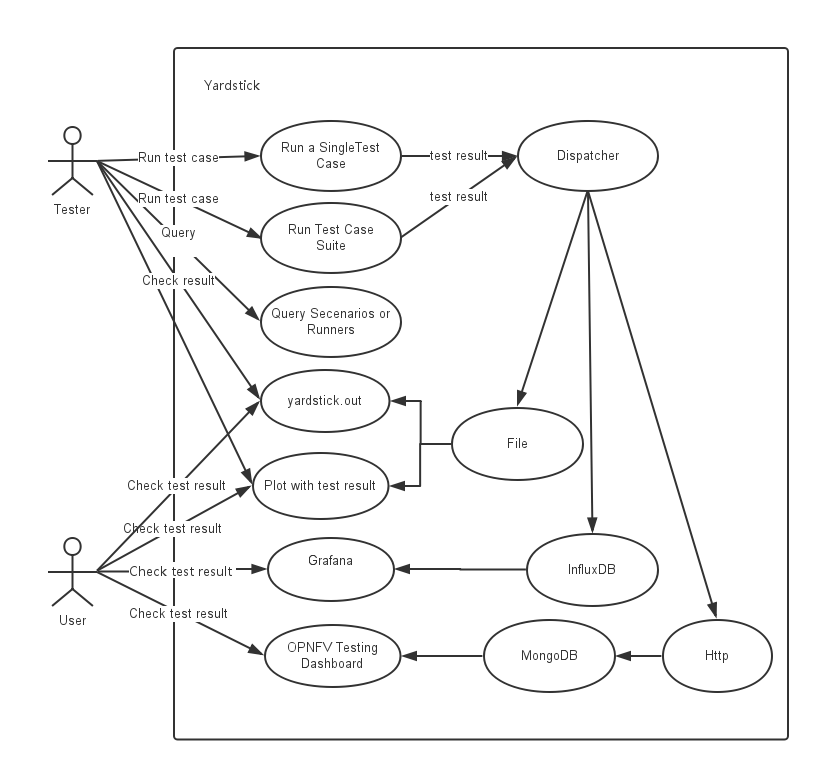
Configuring the Dispatcher Type:
Need to configure the dispatcher type in /etc/yardstick/yardstick.conf depending on the dispatcher methods which are used to store the cyclictest results. A sample yardstick.conf can be found at /yardstick/etc/yardstick.conf.sample, which can be copied to /etc/yardstick.
mkdir -p /etc/yardstick/
cp /yardstick/etc/yardstick.conf.sample /etc/yardstick/yardstick.conf
Dispatcher Modules:
Three type of dispatcher methods are available to store the cyclictest results.
- File
- InfluxDB
- HTTP
1. File: Default Dispatcher module is file. If the dispatcher module is configured as a file,then the test results are stored in a temporary file yardstick.out ( default path: /tmp/yardstick.out). Dispatcher module of “Verify Job” is “Default”. So,the results are stored in Yardstick.out file for verify job. Storing all the verify jobs in InfluxDB database causes redundancy of latency values. Hence, a File output format is prefered.
[DEFAULT]
debug = False
dispatcher = file

[dispatcher_file]
file_path = /tmp/yardstick.out
max_bytes = 0
backup_count = 0
2. Influxdb: If the dispatcher module is configured as influxdb, then the test results are stored in Influxdb. Users can check test resultsstored in the Influxdb(Database) on Grafana which is used to visualize the time series data.
To configure the influxdb, the following content in /etc/yardstick/yardstick.conf need to updated
[DEFAULT]
debug = False
dispatcher = influxdb

[dispatcher_influxdb]
timeout = 5
target = http://127.0.0.1:8086  ##Mention the IP where influxdb is running
db_name = yardstick
username = root
password = root
Dispatcher module of “Daily Job” is Influxdb. So, the results are stored in influxdb and then published to Dashboard.
3. HTTP: If the dispatcher module is configured as http, users can check test result on OPNFV testing dashboard which uses MongoDB as backend.
[DEFAULT]
debug = False
dispatcher = http

[dispatcher_http]
timeout = 5
target = http://127.0.0.1:8000/results
Detailing the dispatcher module in verify and daily Jobs:
KVM4NFV updates the dispatcher module in the yardstick configuration file(/etc/yardstick/yardstick.conf) depending on the Job type(Verify/Daily). Once the test is completed, results are published to the respective dispatcher modules.
Dispatcher module is configured for each Job type as mentioned below.
Verify Job: Default “DISPATCHER_TYPE” i.e. file(/tmp/yardstick.out) is used. User can also see the test results on Jenkins console log.
*"max": "00030", "avg": "00006", "min": "00006"*
Daily Job: Opnfv Influxdb url is configured as dispatcher module.
DISPATCHER_TYPE=influxdb
DISPATCHER_INFLUXDB_TARGET="http://104.197.68.199:8086"
Influxdb only supports line protocol, and the json protocol is deprecated.
- For example, the raw_result of cyclictest in json format is:
"benchmark": { "timestamp": 1478234859.065317, "errors": "", "data": { "max": "00012", "avg": "00008", "min": "00007" }, "sequence": 1 }, "runner_id": 23 }- With the help of “influxdb_line_protocol”, the json is transformed as a line string:
'kvmfornfv_cyclictest_idle_idle,deploy_scenario=unknown,host=kvm.LF,
installer=unknown,pod_name=unknown,runner_id=23,scenarios=Cyclictest,
task_id=e7be7516-9eae-406e-84b6-e931866fa793,version=unknown
avg="00008",max="00012",min="00007" 1478234859065316864'
Influxdb api which is already implemented in Influxdb will post the data in line format into the database.
Displaying Results on Grafana dashboard:
- Once the test results are stored in Influxdb, dashboard configuration file(Json) which used to display the cyclictest results
on Grafana need to be created by following the Grafana-procedure and then pushed into yardstick-repo
- Grafana can be accessed at Login using credentials opnfv/opnfv and used for visualizing the collected test data as shown in Visual
Understanding Kvm4nfv Grafana Dashboard
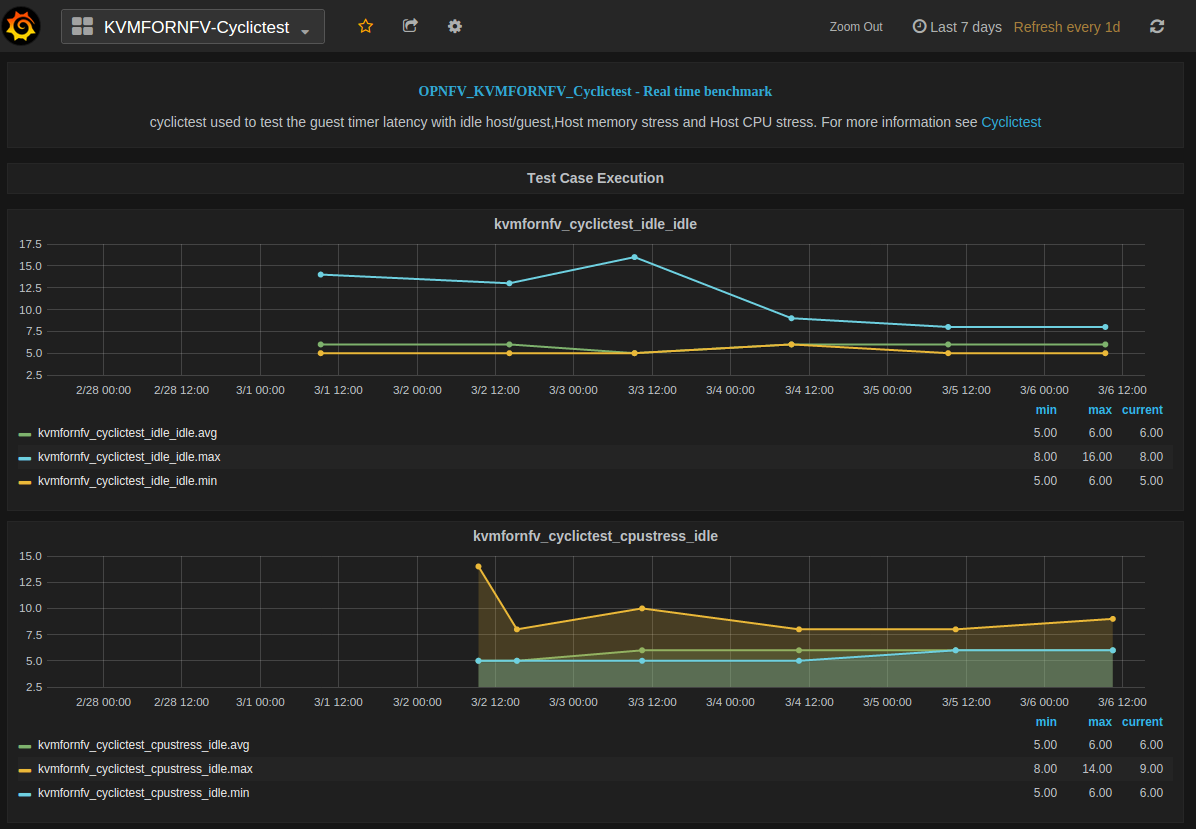
The Kvm4nfv dashboard found at http://testresults.opnfv.org/ currently supports graphical view of cyclictest. For viewing Kvm4nfv dashboarduse,
http://testresults.opnfv.org/grafana/dashboard/db/kvmfornfv-cyclictest

The login details are:

    Username: opnfv
    Password: opnfv
The JSON of the kvmfonfv-cyclictest dashboard can be found at.,

$ git clone https://gerrit.opnfv.org/gerrit/yardstick.git
$ cd yardstick/dashboard
$ cat KVMFORNFV-Cyclictest
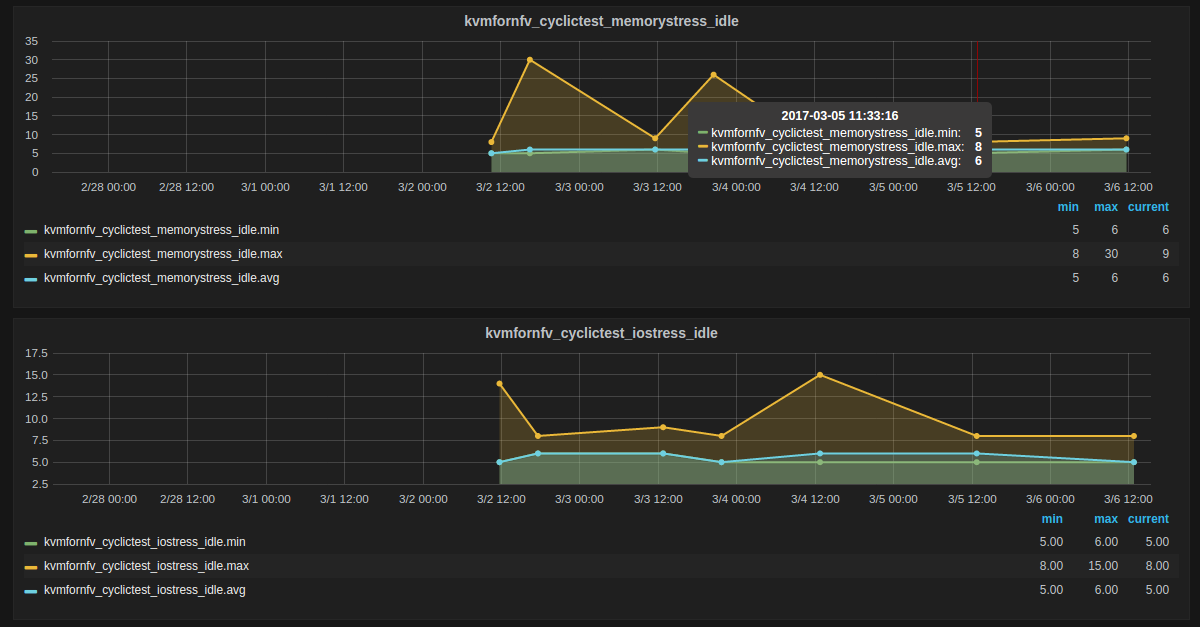
The Dashboard has four tables, each representing a specific test-type of cyclictest case,
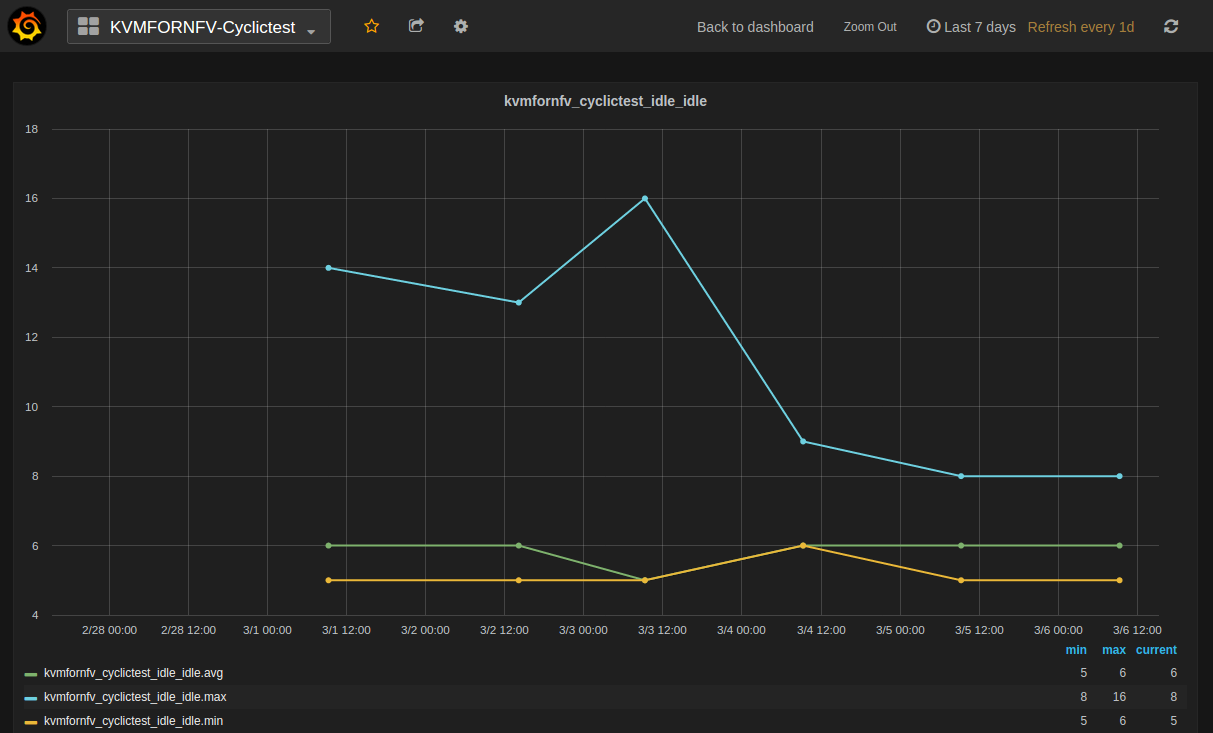
- Kvmfornfv_Cyclictest_Idle-Idle
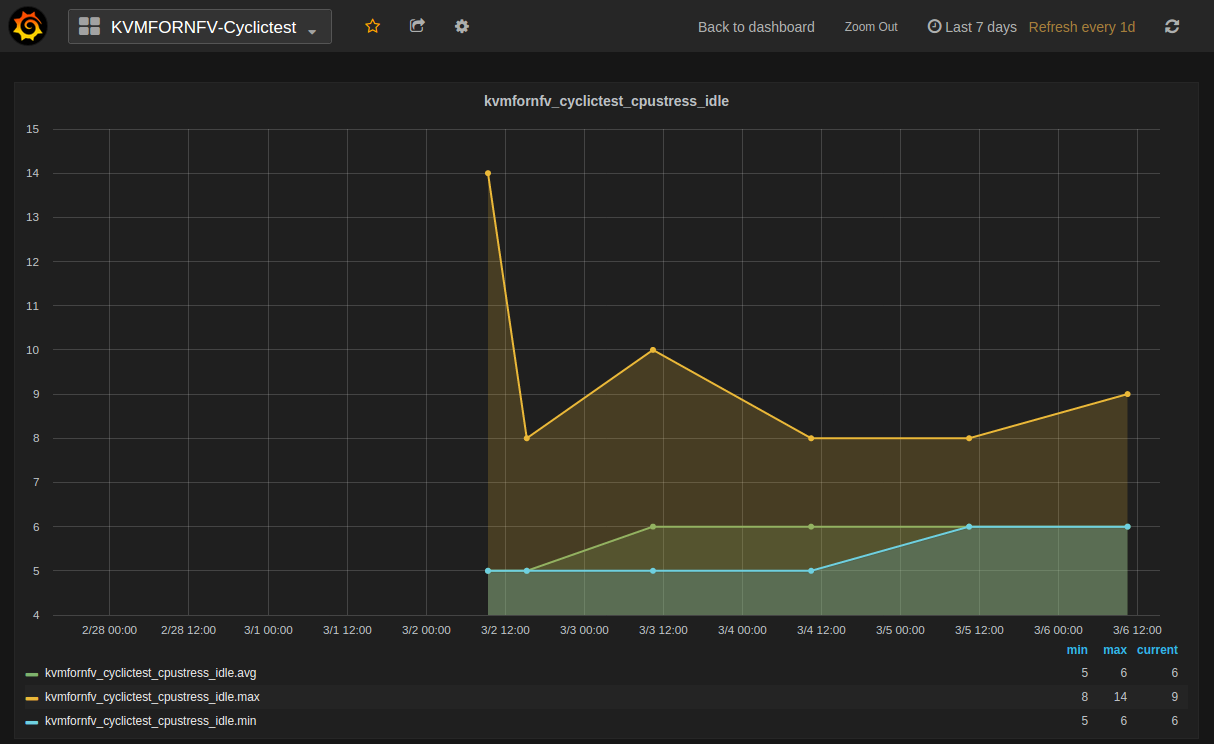
- Kvmfornfv_Cyclictest_CPUstress-Idle
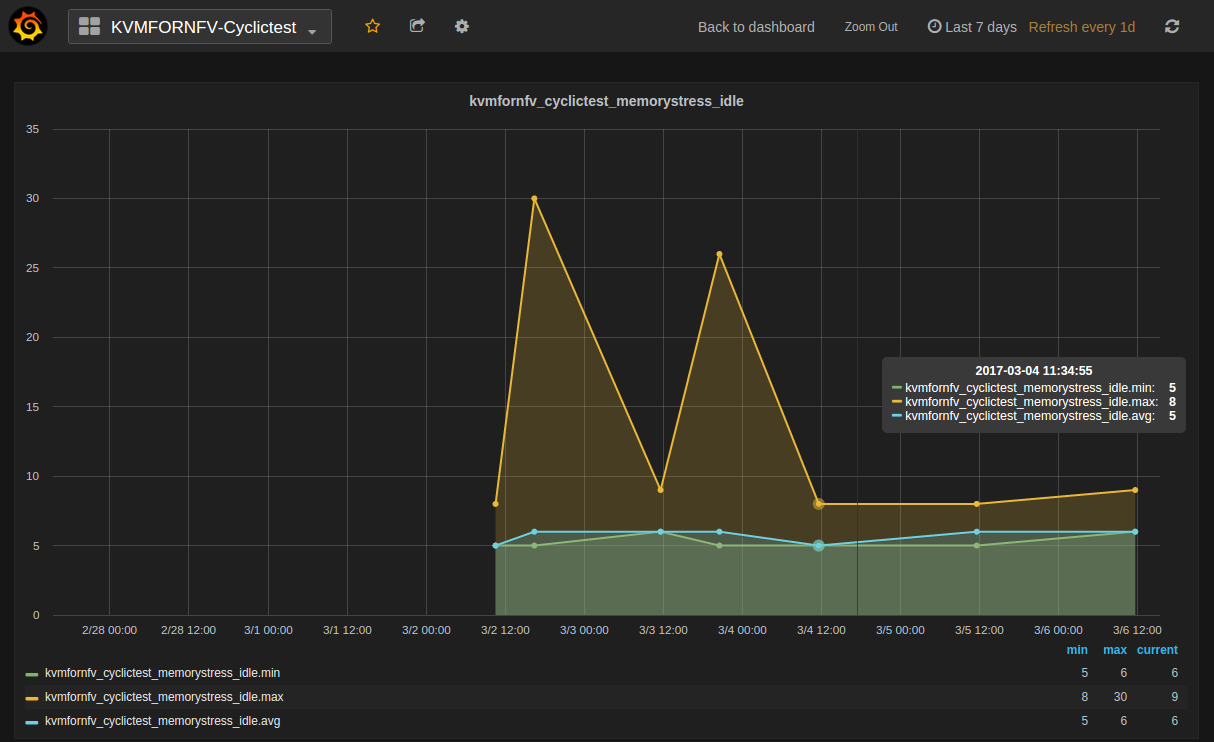
- Kvmfornfv_Cyclictest_Memorystress-Idle
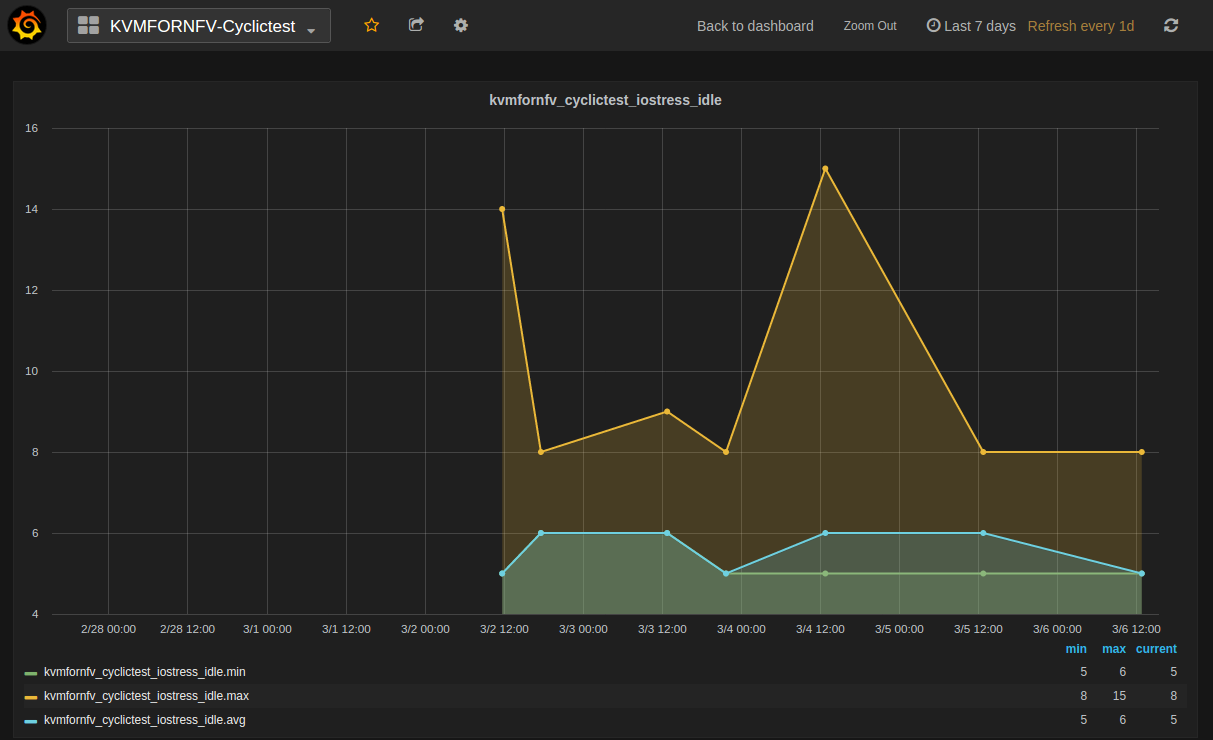
- Kvmfornfv_Cyclictest_IOstress-Idle
Note:
- For all graphs, X-axis is marked with time stamps, Y-axis with value in microsecond units.
A brief about what each graph of the dashboard represents:
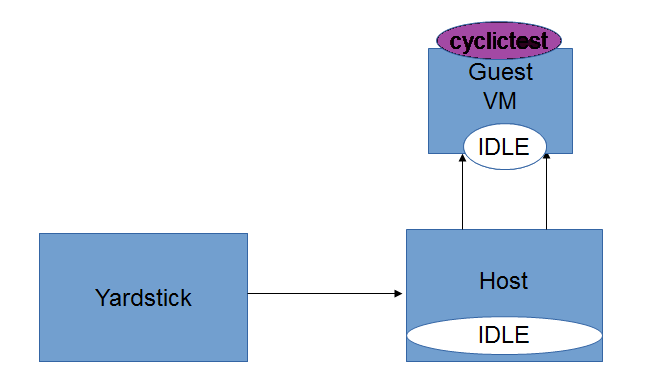
1. Idle-Idle Graph
Idle-Idle graph displays the Average, Maximum and Minimum latency values obtained by running Idle_Idle test-type of the cyclictest. Idle_Idle implies that no stress is applied on the Host or the Guest.
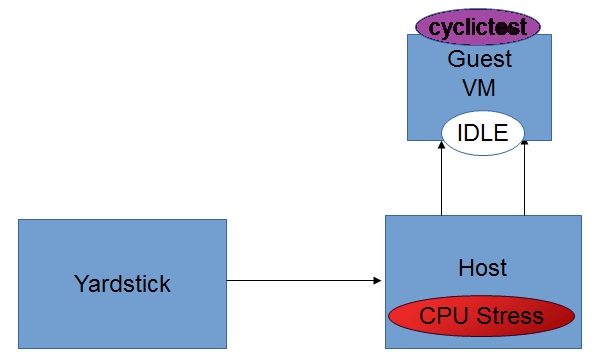
2. CPU_Stress-Idle Graph
Cpu_Stress-Idle graph displays the Average, Maximum and Minimum latency values obtained by running Cpu-stress_Idle test-type of the cyclictest. Cpu-stress_Idle implies that CPU stress is applied on the Host and no stress on the Guest.
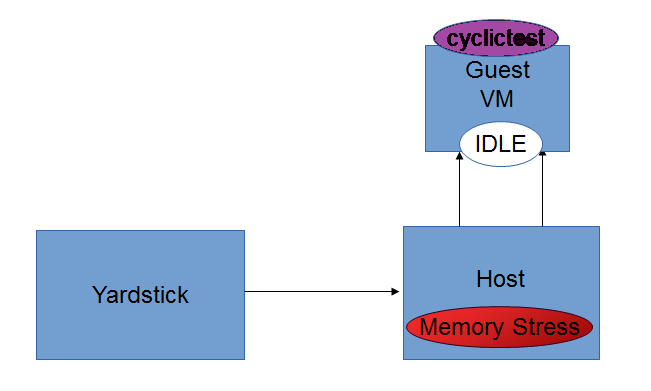
3. Memory_Stress-Idle Graph
Memory_Stress-Idle graph displays the Average, Maximum and Minimum latency values obtained by running Memory-stress_Idle test-type of the Cyclictest. Memory-stress_Idle implies that Memory stress is applied on the Host and no stress on the Guest.
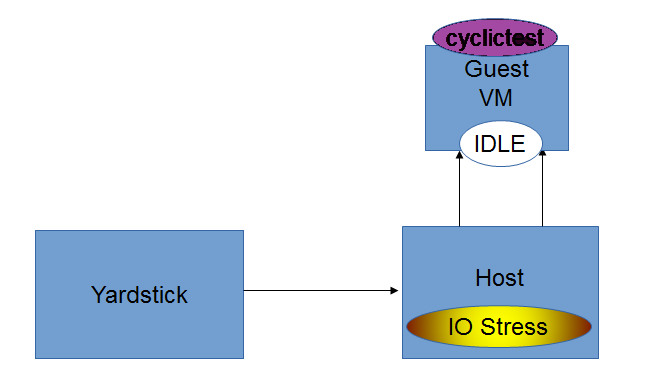
4. IO_Stress-Idle Graph
IO_Stress-Idle graph displays the Average, Maximum and Minimum latency values obtained by running IO-stress_Idle test-type of the Cyclictest. IO-stress_Idle implies that IO stress is applied on the Host and no stress on the Guest.
Future Scope
The future work will include adding the kvmfornfv_Packet-forwarding test results into Grafana and influxdb.
Low Latency Environment
Achieving low latency with the KVM4NFV project requires setting up a special test environment. This environment includes the BIOS settings, kernel configuration, kernel parameters and the run-time environment.
Hardware Environment Description
BIOS setup plays an important role in achieving real-time latency. A collection of relevant settings, used on the platform where the baseline performance data was collected, is detailed below:
CPU Features
Some special CPU features like TSC-deadline timer, invariant TSC and Process posted interrupts, etc, are helpful for latency reduction.
CPU Topology
NUMA topology is also important for latency reduction.
BIOS Setup
Careful BIOS setup is important in achieving real time latency. Different platforms have different BIOS setups, below are the important BIOS settings on the platform used to collect the baseline performance data.
Software Environment Setup
Both the host and the guest environment need to be configured properly to reduce latency variations. Below are some suggested kernel configurations. The ci/envs/ directory gives detailed implementation on how to setup the environment.
Kernel Parameter
Please check the default kernel configuration in the source code at: kernel/arch/x86/configs/opnfv.config.
Below is host kernel boot line example:
isolcpus=11-15,31-35 nohz_full=11-15,31-35 rcu_nocbs=11-15,31-35
iommu=pt intel_iommu=on default_hugepagesz=1G hugepagesz=1G mce=off idle=poll
intel_pstate=disable processor.max_cstate=1 pcie_asmp=off tsc=reliable
Below is guest kernel boot line example
isolcpus=1 nohz_full=1 rcu_nocbs=1 mce=off idle=poll default_hugepagesz=1G
hugepagesz=1G
Please refer to tuning.userguide for more explanation.
Run-time Environment Setup
Not only are special kernel parameters needed but a special run-time environment is also required. Please refer to tunning.userguide for more explanation.
Test cases to measure Latency
The performance of the kvm4nfv is assesed by the latency values. Cyclictest and Packet forwarding Test cases result in real time latency values of average, minimum and maximum.
- Cyclictest
- Packet Forwarding test
1. Cyclictest case
Cyclictest results are the most frequently cited real-time Linux metric. The core concept of Cyclictest is very simple. In KVM4NFV cyclictest is implemented on the Guest-VM with 4.4-Kernel RPM installed. It generated Max,Min and Avg values which help in assesing the kernel used. Cyclictest in currently divided into the following test types,
- Idle-Idle
- CPU_stress-Idle
- Memory_stress-Idle
- IO_stress-Idle
Future scope of work may include the below test-types,
- CPU_stress-CPU_stress
- Memory_stress-Memory_stress
- IO_stress-IO_stress
Understanding the naming convention
[Host-Type ] - [Guest-Type]
- Host-Type : Mentions the type of stress applied on the kernel of the Host
- Guest-Type : Mentions the type of stress applied on the kernel of the Guest
Example.,
Idle - CPU_stress
The above name signifies that,
- No Stress is applied on the Host kernel
- CPU Stress is applied on the Guest kernel
Note:
- Stress is applied using the stress which is installed as part of the deployment. Stress can be applied on CPU, Memory and Input-Output (Read/Write) operations using the stress tool.
Version Features
| Test Name | Colorado | Danube |
|
Y |
Y |
|
Y |
|
|
Y |
|
|
Y |
Idle-Idle test-type
Cyclictest in run on the Guest VM when Host,Guest are not under any kind of stress. This is the basic cyclictest of the KVM4NFV project. Outputs Avg, Min and Max latency values.
CPU_Stress-Idle test-type
Here, the host is under CPU stress, where multiple times sqrt() function is called on kernel which results increased CPU load. The cyclictest will run on the guest, where the guest is under no stress. Outputs Avg, Min and Max latency values.
Memory_Stress-Idle test-type
In this type, the host is under memory stress where continuos memory operations are implemented to increase the Memory stress (Buffer stress).The cyclictest will run on the guest, where the guest is under no stress. It outputs Avg, Min and Max latency values.
IO_Stress-Idle test-type
The host is under constant Input/Output stress .i.e., multiple read-write operations are invoked to increase stress. Cyclictest will run on the guest VM that is launched on the same host, where the guest is under no stress. It outputs Avg, Min and Max latency values.
CPU_Stress-CPU_Stress test-type
Not implemented for Danube release.
Memory_Stress-Memory_Stress test-type
Not implemented for Danube release.
IO_Stress-IO_Stress test type
Not implemented for Danube release.
2. Packet Forwarding Test cases
Packet forwarding is an other test case of Kvm4nfv. It measures the time taken by a packet to return to source after reaching its destination. This test case uses automated test-framework provided by OPNFV VSWITCHPERF project and a traffic generator (IXIA is used for kvm4nfv). Only latency results generating test cases are triggered as a part of kvm4nfv daily job.
Latency test measures the time required for a frame to travel from the originating device through the network to the destination device. Please note that RFC2544 Latency measurement will be superseded with a measurement of average latency over all successfully transferred packets or frames.
Packet forwarding test cases currently supports the following test types:
- Packet forwarding to Host
- Packet forwarding to Guest
- Packet forwarding to Guest using SRIOV
The testing approach adoped is black box testing, meaning the test inputs can be generated and the outputs captured and completely evaluated from the outside of the System Under Test(SUT).
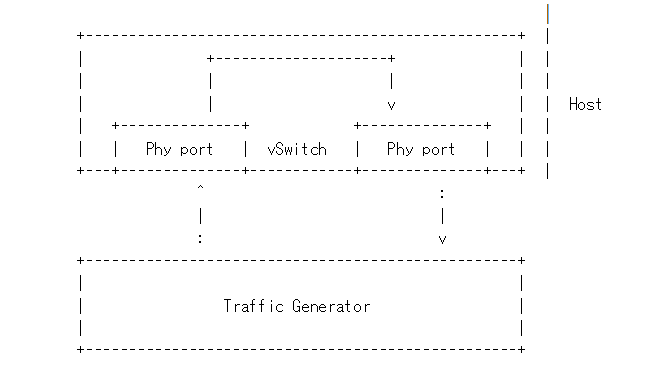
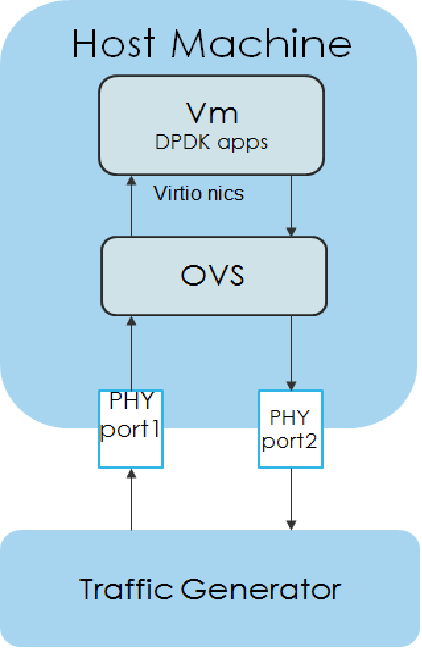
Packet forwarding to Host
This is also known as Physical port → vSwitch → physical port deployment. This test measures the time taken by the packet/frame generated by traffic generator(phy) to travel through the network to the destination device(phy). This test results min,avg and max latency values. This value signifies the performance of the installed kernel.
Packet flow,
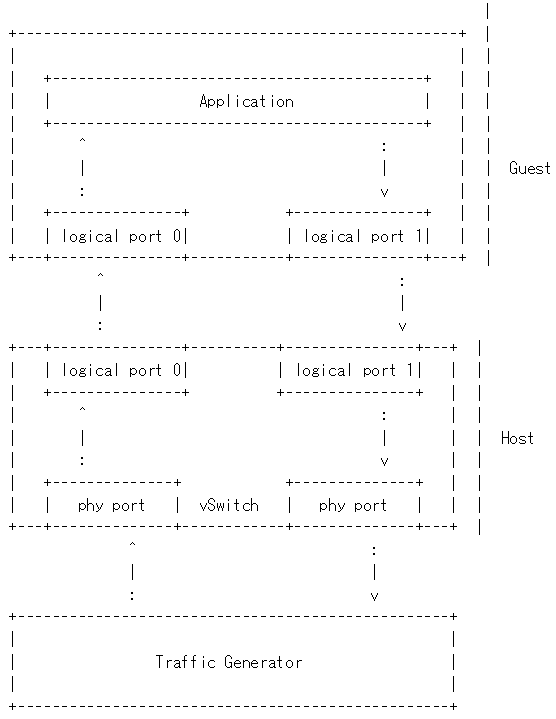
Packet forwarding to Guest
This is also known as Physical port → vSwitch → VNF → vSwitch → physical port deployment.
This test measures the time taken by the packet/frame generated by traffic generator(phy) to travel through the network involving a guest to the destination device(phy). This test results min,avg and max latency values. This value signifies the performance of the installed kernel.
Packet flow,
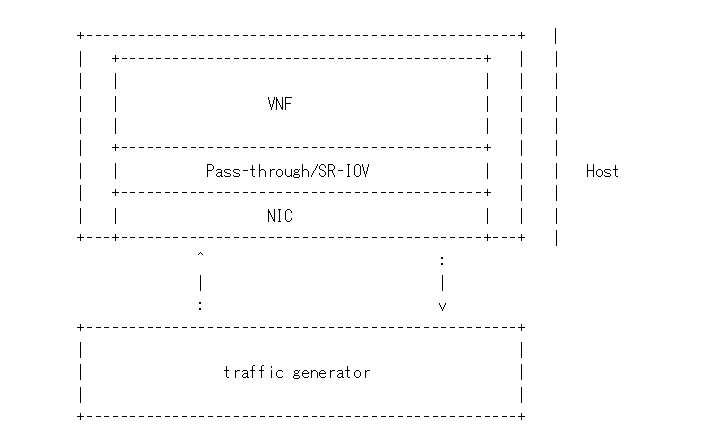
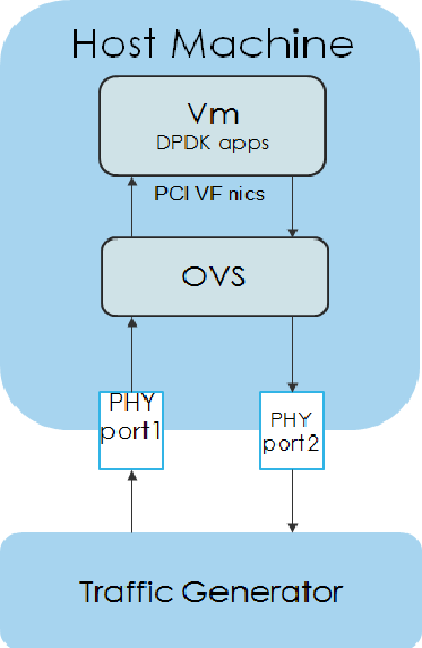
Packet forwarding to Guest using SRIOV
This test is used to verify the VNF and measure the base performance (maximum forwarding rate in fps and latency) that can be achieved by the VNF without a vSwitch. The performance metrics collected by this test will serve as a key comparison point for NIC passthrough technologies and vSwitches. VNF in this context refers to the hypervisor and the VM.
Note: The Vsperf running on the host is still required.
Packet flow,
Fast Live Migration
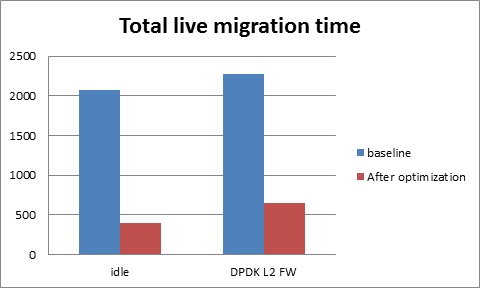
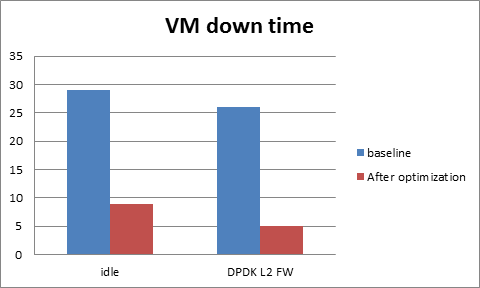
The NFV project requires fast live migration. The specific requirement is total live migration time < 2Sec, while keeping the VM down time < 10ms when running DPDK L2 forwarding workload.
We measured the baseline data of migrating an idle 8GiB guest running a DPDK L2 forwarding work load and observed that the total live migration time was 2271ms while the VM downtime was 26ms. Both of these two indicators failed to satisfy the requirements.
Current Challenges
The following 4 features have been developed over the years to make the live migration process faster.
- XBZRLE:
- Helps to reduce the network traffic by just sending the compressed data.
- RDMA:
- Uses a specific NIC to increase the efficiency of data transmission.
- Multi thread compression:
- Compresses the data before transmission.
- Auto convergence:
- Reduces the data rate of dirty pages.
Tests show none of the above features can satisfy the requirement of NFV. XBZRLE and Multi thread compression do the compression entirely in software and they are not fast enough in a 10Gbps network environment. RDMA is not flexible because it has to transport all the guest memory to the destination without zero page optimization. Auto convergence is not appropriate for NFV because it will impact guest’s performance.
So we need to find other ways for optimization.
Optimizations
- Delay non-emergency operations By profiling, it was discovered that some of the cleanup operations during the stop and copy stage are the main reason for the long VM down time. The cleanup operation includes stopping the dirty page logging, which is a time consuming operation. By deferring these operations until the data transmission is completed the VM down time is reduced to about 5-7ms.
- Optimize zero page checking Currently QEMU uses the SSE2 instruction to optimize the zero pages checking. The SSE2 instruction can process 16 bytes per instruction. By using the AVX2 instruction, we can process 32 bytes per instruction. Testing shows that using AVX2 can speed up the zero pages checking process by about 25%.
- Remove unnecessary context synchronization. The CPU context was being synchronized twice during live migration. Removing this unnecessary synchronization shortened the VM downtime by about 100us.
Test Environment
The source and destination host have the same hardware and OS: :: Host: HSW-EP CPU: Intel(R) Xeon(R) CPU E5-2699 v3 @ 2.30GHz RAM: 64G OS: RHEL 7.1 Kernel: 4.2 QEMU v2.4.0
Ethernet controller: Intel Corporation Ethernet Controller 10-Gigabit X540-AT2 (rev 01) QEMU parameters: :: ${qemu} -smp ${guest_cpus} -monitor unix:${qmp_sock},server,nowait -daemonize -cpu host,migratable=off,+invtsc,+tsc-deadline,pmu=off -realtime mlock=on -mem-prealloc -enable-kvm -m 1G -mem-path /mnt/hugetlbfs-1g -drive file=/root/minimal-centos1.qcow2,cache=none,aio=threads -netdev user,id=guest0,hostfwd=tcp:5555-:22 -device virtio-net-pci,netdev=guest0 -nographic -serial /dev/null -parallel /dev/null
Network connection
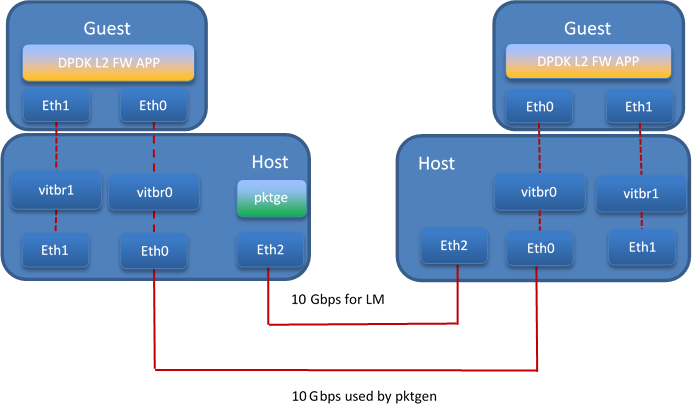
Test Result
The down time is set to 10ms when doing the test. We use pktgen to send the packages to guest, the package size is 64 bytes, and the line rate is 2013 Mbps.
Total live migration time
The total live migration time before and after optimization is shown in the chart below. For an idle guest, we can reduce the total live migration time from 2070ms to 401ms. For a guest running the DPDK L2 forwarding workload, the total live migration time is reduced from 2271ms to 654ms.
VM downtime
The VM down time before and after optimization is shown in the chart below. For an idle guest, we can reduce the VM down time from 29ms to 9ms. For a guest running the DPDK L2 forwarding workload, the VM down time is reduced from 26ms to 5ms.
Danube OpenStack User Guide
OpenStack is a cloud operating system developed and released by the OpenStack project. OpenStack is used in OPNFV for controlling pools of compute, storage, and networking resources in a Pharos compliant infrastructure.
OpenStack is used in Danube to manage tenants (known in OpenStack as projects),users, services, images, flavours, and quotas across the Pharos infrastructure.The OpenStack interface provides the primary interface for an operational Danube deployment and it is from the “horizon console” that an OPNFV user will perform the majority of administrative and operational activities on the deployment.
OpenStack references
The OpenStack user guide provides details and descriptions of how to configure and interact with the OpenStack deployment.This guide can be used by lab engineers and operators to tune the OpenStack deployment to your liking.
Once you have configured OpenStack to your purposes, or the Danube deployment meets your needs as deployed, an operator, or administrator, will find the best guidance for working with OpenStack in the OpenStack administration guide.
Connecting to the OpenStack instance
Once familiar with the basic of working with OpenStack you will want to connect to the OpenStack instance via the Horizon Console. The Horizon console provide a Web based GUI that will allow you operate the deployment. To do this you should open a browser on the JumpHost to the following address and enter the username and password:
http://{Controller-VIP}:80/index.html> username: admin password: admin
Other methods of interacting with and configuring OpenStack,, like the REST API and CLI are also available in the Danube deployment, see the OpenStack administration guide for more information on using those interfaces.
Packet Forwarding
About Packet Forwarding
Packet Forwarding is a test suite of KVM4NFV. These latency tests measures the time taken by a
Packet generated by the traffic generator to travel from the originating device through the
network to the destination device. Packet Forwarding is implemented using test framework
implemented by OPNFV VSWITCHPERF project and an IXIA Traffic Generator.
Version Features
| Release | Features |
|---|---|
| Colorado |
|
| Danube |
|
VSPERF
VSPerf is an OPNFV testing project. VSPerf will develop a generic and architecture agnostic vSwitch testing framework and associated tests, that will serve as a basis for validating the suitability of different vSwitch implementations in a Telco NFV deployment environment. The output of this project will be utilized by the OPNFV Performance and Test group and its associated projects, as part of OPNFV Platform and VNF level testing and validation.
For complete VSPERF documentation go to link.
Supported Operating Systems
- CentOS 7
- Fedora 20
- Fedora 21
- Fedora 22
- RedHat 7.2
- Ubuntu 14.04
Supported vSwitches
The vSwitch must support Open Flow 1.3 or greater.
- OVS (built from source).
- OVS with DPDK (built from source).
Supported Hypervisors
- Qemu version 2.6.
Other Requirements
The test suite requires Python 3.3 and relies on a number of other packages. These need to be installed for the test suite to function.
Installation of required packages, preparation of Python 3 virtual environment and compilation of OVS, DPDK and QEMU is performed by script systems/build_base_machine.sh. It should be executed under user account, which will be used for vsperf execution.
Please Note: Password-less sudo access must be configured for given user before script is executed.
Execution of installation script:
$ cd vswitchperf
$ cd systems
$ ./build_base_machine.sh
Script build_base_machine.sh will install all the vsperf dependencies in terms of system packages, Python 3.x and required Python modules. In case of CentOS 7 it will install Python 3.3 from an additional repository provided by Software Collections (a link). In case of RedHat 7 it will install Python 3.4 as an alternate installation in /usr/local/bin. Installation script will also use virtualenv to create a vsperf virtual environment, which is isolated from the default Python environment. This environment will reside in a directory called vsperfenv in $HOME.
You will need to activate the virtual environment every time you start a new shell session. Its activation is specific to your OS:
For running testcases VSPERF is installed on Intel pod1-node2 in which centos operating system is installed. Only VSPERF installion on Centos is discussed here. For installation steps on other operating systems please refer to here.
For CentOS 7
## Python 3 Packages
To avoid file permission errors and Python version issues, use virtualenv to create an isolated environment with Python3. The required Python 3 packages can be found in the requirements.txt file in the root of the test suite. They can be installed in your virtual environment like so:
scl enable python33 bash
# Create virtual environment
virtualenv vsperfenv
cd vsperfenv
source bin/activate
pip install -r requirements.txt
You need to activate the virtual environment every time you start a new shell session. To activate, simple run:
scl enable python33 bash
cd vsperfenv
source bin/activate
Working Behind a Proxy
If you’re behind a proxy, you’ll likely want to configure this before running any of the above. For example:
export http_proxy="http://<username>:<password>@<proxy>:<port>/";
export https_proxy="https://<username>:<password>@<proxy>:<port>/";
export ftp_proxy="ftp://<username>:<password>@<proxy>:<port>/";
export socks_proxy="socks://<username>:<password>@<proxy>:<port>/";
For other OS specific activation click this link:
Traffic-Generators
VSPERF supports many Traffic-generators. For configuring VSPERF to work with the available traffic-generator go through this.
VSPERF supports the following traffic generators:
- Dummy (DEFAULT): Allows you to use your own external traffic generator.
- IXIA (IxNet and IxOS)
- Spirent TestCenter
- Xena Networks
- MoonGen
To see the list of traffic gens from the cli:
$ ./vsperf --list-trafficgens
This guide provides the details of how to install and configure the various traffic generators.
As KVM4NFV uses only IXIA traffic generator, it is discussed here. For complete documentation regarding traffic generators please follow this link.
IXIA Setup
Hardware Requirements
VSPERF requires the following hardware to run tests: IXIA traffic generator (IxNetwork), a machine that runs the IXIA client software and a CentOS Linux release 7.1.1503 (Core) host.
Installation
Follow the installation instructions to install.
On the CentOS 7 system
You need to install IxNetworkTclClient$(VER_NUM)Linux.bin.tgz.
On the IXIA client software system
- Find the IxNetwork TCL server app (start -> All Programs -> IXIA -> IxNetwork -> IxNetwork_$(VER_NUM) -> IxNetwork TCL Server)
- Right click on IxNetwork TCL Server, select properties
- Under shortcut tab in the Target dialogue box make sure there is the argument “-tclport xxxx”
where xxxx is your port number (take note of this port number you will need it for the 10_custom.conf file).
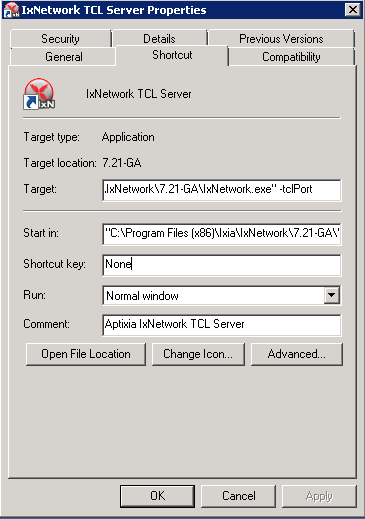
- Hit Ok and start the TCL server application
VSPERF configuration
There are several configuration options specific to the IxNetworks traffic generator from IXIA. It is essential to set them correctly, before the VSPERF is executed for the first time.
Detailed description of options follows:
- TRAFFICGEN_IXNET_MACHINE - IP address of server, where IxNetwork TCL Server is running
- TRAFFICGEN_IXNET_PORT - PORT, where IxNetwork TCL Server is accepting connections from TCL clients
- TRAFFICGEN_IXNET_USER - username, which will be used during communication with IxNetwork TCL Server and IXIA chassis
- TRAFFICGEN_IXIA_HOST - IP address of IXIA traffic generator chassis
- TRAFFICGEN_IXIA_CARD - identification of card with dedicated ports at IXIA chassis
- TRAFFICGEN_IXIA_PORT1 - identification of the first dedicated port at TRAFFICGEN_IXIA_CARD at IXIA chassis; VSPERF uses two separated ports for traffic generation. In case of unidirectional traffic, it is essential to correctly connect 1st IXIA port to the 1st NIC at DUT, i.e. to the first PCI handle from WHITELIST_NICS list. Otherwise traffic may not be able to pass through the vSwitch.
- TRAFFICGEN_IXIA_PORT2 - identification of the second dedicated port at TRAFFICGEN_IXIA_CARD at IXIA chassis; VSPERF uses two separated ports for traffic generation. In case of unidirectional traffic, it is essential to correctly connect 2nd IXIA port to the 2nd NIC at DUT, i.e. to the second PCI handle from WHITELIST_NICS list. Otherwise traffic may not be able to pass through the vSwitch.
- TRAFFICGEN_IXNET_LIB_PATH - path to the DUT specific installation of IxNetwork TCL API
- TRAFFICGEN_IXNET_TCL_SCRIPT - name of the TCL script, which VSPERF will use for communication with IXIA TCL server
- TRAFFICGEN_IXNET_TESTER_RESULT_DIR - folder accessible from IxNetwork TCL server, where test results are stored, e.g.
c:/ixia_results; see test-results-share- TRAFFICGEN_IXNET_DUT_RESULT_DIR - directory accessible from the DUT, where test results from IxNetwork TCL server are stored, e.g.
/mnt/ixia_results; see test-results-share
Cloning and building src dependencies
In order to run VSPERF, you will need to download DPDK and OVS. You can do this manually and build them in a preferred location, or you could use vswitchperf/src. The vswitchperf/src directory contains makefiles that will allow you to clone and build the libraries that VSPERF depends on, such as DPDK and OVS. To clone and build simply:
cd src
make
To delete a src subdirectory and its contents to allow you to re-clone simply use:
make cleanse
Configure the ./conf/10_custom.conf file
The supplied 10_custom.conf file must be modified, as it contains configuration items for which there are no reasonable default values.
The configuration items that can be added is not limited to the initial contents. Any configuration item mentioned in any .conf file in ./conf directory can be added and that item will be overridden by the custom configuration value.
Using a custom settings file
Alternatively a custom settings file can be passed to vsperf via the –conf-file argument.
./vsperf --conf-file <path_to_settings_py> ...
Note that configuration passed in via the environment (–load-env) or via another command line argument will override both the default and your custom configuration files. This “priority hierarchy” can be described like so (1 = max priority):
- Command line arguments
- Environment variables
- Configuration file(s)
vloop_vnf
VSPERF uses a VM image called vloop_vnf for looping traffic in the deployment scenarios involving VMs. The image can be downloaded from http://artifacts.opnfv.org/.
Please see the installation instructions for information on vloop-vnf images.
l2fwd Kernel Module
A Kernel Module that provides OSI Layer 2 Ipv4 termination or forwarding with support for Destination Network Address Translation (DNAT) for both the MAC and IP addresses. l2fwd can be found in <vswitchperf_dir>/src/l2fwd
Executing tests
Before running any tests make sure you have root permissions by adding the following line to /etc/sudoers: .. code:: bash
username ALL=(ALL) NOPASSWD: ALL
username in the example above should be replaced with a real username.
To list the available tests:
./vsperf --list-tests
To run a group of tests, for example all tests with a name containing ‘RFC2544’:
./vsperf --conf-file=user_settings.py --tests="RFC2544"
To run all tests:
./vsperf --conf-file=user_settings.py
Some tests allow for configurable parameters, including test duration (in seconds) as well as packet sizes (in bytes).
./vsperf --conf-file user_settings.py
    --tests RFC2544Tput
    --test-param` "rfc2544_duration=10;packet_sizes=128"
For all available options, check out the help dialog:
./vsperf --help
Testcases
Available Tests in VSPERF are:
- phy2phy_tput
- phy2phy_forwarding
- back2back
- phy2phy_tput_mod_vlan
- phy2phy_cont
- pvp_cont
- pvvp_cont
- pvpv_cont
- phy2phy_scalability
- pvp_tput
- pvp_back2back
- pvvp_tput
- pvvp_back2back
- phy2phy_cpu_load
- phy2phy_mem_load
VSPERF modes of operation
VSPERF can be run in different modes. By default it will configure vSwitch, traffic generator and VNF. However it can be used just for configuration and execution of traffic generator. Another option is execution of all components except traffic generator itself.
Mode of operation is driven by configuration parameter -m or –mode
-m MODE, --mode MODE  vsperf mode of operation;
   Values:
        "normal" - execute vSwitch, VNF and traffic generator
        "trafficgen" - execute only traffic generator
        "trafficgen-off" - execute vSwitch and VNF
        "trafficgen-pause" - execute vSwitch and VNF but wait before traffic transmission
In case, that VSPERF is executed in “trafficgen” mode, then configuration
of traffic generator can be modified through TRAFFIC dictionary passed to the
--test-params option. It is not needed to specify all values of TRAFFIC
dictionary. It is sufficient to specify only values, which should be changed.
Detailed description of TRAFFIC dictionary can be found at: ref:configuration-of-traffic-dictionary.
Example of execution of VSPERF in “trafficgen” mode:
$ ./vsperf -m trafficgen --trafficgen IxNet --conf-file vsperf.conf \
    --test-params "TRAFFIC={'traffic_type':'rfc2544_continuous','bidir':'False','framerate':60}"
Packet Forwarding Test Scenarios
KVM4NFV currently implements three scenarios as part of testing:
- Host Scenario
- Guest Scenario.
- SR-IOV Scenario.
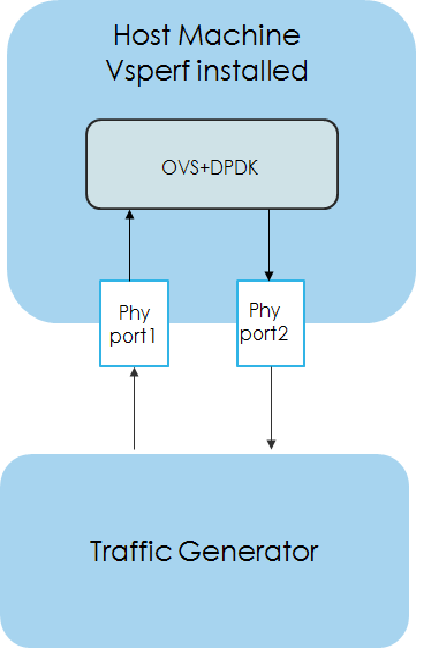
Packet Forwarding Host Scenario
Here host DUT has VSPERF installed in it and is properly configured to use IXIA Traffic-generator by providing IXIA CARD, PORTS and Lib paths along with IP. please refer to figure.2
Packet Forwarding Guest Scenario
Here the guest is a Virtual Machine (VM) launched by using vloop_vnf provided by vsperf project on host/DUT using Qemu. In this latency test the time taken by the frame/packet to travel from the originating device through network involving a guest to destination device is calculated. The resulting latency values will define the performance of installed kernel.
Packet Forwarding SRIOV Scenario
In this test the packet generated at the IXIA is forwarded to the Guest VM launched on Host by implementing SR-IOV interface at NIC level of host .i.e., DUT. The time taken by the packet to travel through the network to the destination the IXIA traffic-generator is calculated and published as a test result for this scenario.
SRIOV-support is given below, it details how to use SR-IOV.
Using vfio_pci with DPDK
To use vfio with DPDK instead of igb_uio add into your custom configuration file the following parameter:
PATHS['dpdk']['src']['modules'] = ['uio', 'vfio-pci']
NOTE: In case, that DPDK is installed from binary package, then please
setPATHS['dpdk']['bin']['modules']instead.
NOTE: Please ensure that Intel VT-d is enabled in BIOS.
NOTE: Please ensure your boot/grub parameters include the following:
iommu=pt intel_iommu=on
To check that IOMMU is enabled on your platform:
 $ dmesg | grep IOMMU
 [    0.000000] Intel-IOMMU: enabled
 [    0.139882] dmar: IOMMU 0: reg_base_addr fbffe000 ver 1:0 cap d2078c106f0466 ecap f020de
 [    0.139888] dmar: IOMMU 1: reg_base_addr ebffc000 ver 1:0 cap d2078c106f0466 ecap f020de
 [    0.139893] IOAPIC id 2 under DRHD base  0xfbffe000 IOMMU 0
 [    0.139894] IOAPIC id 0 under DRHD base  0xebffc000 IOMMU 1
 [    0.139895] IOAPIC id 1 under DRHD base  0xebffc000 IOMMU 1
 [    3.335744] IOMMU: dmar0 using Queued invalidation
 [    3.335746] IOMMU: dmar1 using Queued invalidation
....
Using SRIOV support
To use virtual functions of NIC with SRIOV support, use extended form of NIC PCI slot definition:
WHITELIST_NICS = ['0000:03:00.0|vf0', '0000:03:00.1|vf3']
Where vf is an indication of virtual function usage and following
number defines a VF to be used. In case that VF usage is detected,
then vswitchperf will enable SRIOV support for given card and it will
detect PCI slot numbers of selected VFs.
So in example above, one VF will be configured for NIC ‘0000:05:00.0’ and four VFs will be configured for NIC ‘0000:05:00.1’. Vswitchperf will detect PCI addresses of selected VFs and it will use them during test execution.
At the end of vswitchperf execution, SRIOV support will be disabled.
SRIOV support is generic and it can be used in different testing scenarios. For example:
- vSwitch tests with DPDK or without DPDK support to verify impact of VF usage on vSwitch performance
- tests without vSwitch, where traffic is forwared directly between VF interfaces by packet forwarder (e.g. testpmd application)
- tests without vSwitch, where VM accesses VF interfaces directly by PCI-passthrough to measure raw VM throughput performance.
Using QEMU with PCI passthrough support
Raw virtual machine throughput performance can be measured by execution of PVP test with direct access to NICs by PCI passthrough. To execute VM with direct access to PCI devices, enable vfio-pci. In order to use virtual functions, SRIOV-support must be enabled.
Execution of test with PCI passthrough with vswitch disabled:
$ ./vsperf --conf-file=<path_to_custom_conf>/10_custom.conf \
           --vswitch none --vnf QemuPciPassthrough pvp_tput
Any of supported guest-loopback-application can be used inside VM with PCI passthrough support.
Note: Qemu with PCI passthrough support can be used only with PVP test deployment.
Results
The results for the packet forwarding test cases are uploaded to artifacts. The link for the same can be found below
http://artifacts.opnfv.org/kvmfornfv.html
PCM Utility in KVM4NFV
Collecting Memory Bandwidth Information using PCM utility
This chapter includes how the PCM utility is used in kvm4nfv to collect memory bandwidth information
About PCM utility
The Intel® Performance Counter Monitor provides sample C++ routines and utilities to estimate the internal resource utilization of the latest Intel® Xeon® and Core™ processors and gain a significant performance boost.In Intel PCM toolset,there is a pcm-memory.x tool which is used for observing the memory traffic intensity
Version Features
| Release | Features |
|---|---|
| Colorado |
|
| Danube |
|
Implementation of pcm-memory.x:
The tool measures the memory bandwidth observed for every channel reporting seperate throughput for reads from memory and writes to the memory. pcm-memory.x tool tends to report values slightly higher than the application’s own measurement.
Command:
sudo ./pcm-memory.x [Delay]/[external_program]
Parameters
- pcm-memory can called with either delay or external_program/application as a parameter
- If delay is given as 5,then the output will be produced with refresh of every 5 seconds.
- If external_program is script/application,then the output will produced after the execution of the application or the script passed as a parameter.
Sample Output:
The output produced with default refresh of 1 second.
| Socket 0 | Socket 1 |
|---|---|
| Memory Performance Monitoring | Memory Performance Monitoring |
NODE0 Mem Read (MB/s) : 27478.96 NODE0 Mem Write (MB/s): 7225.79 NODE0 P. Write (T/s) : 214810 NODE0 Memory (MB/s) : 34704.75 |
NODE1 Mem Read (MB/s) : 29624.51 NODE1 Mem Write (MB/s): 7811.36 NODE1 P. Write (T/s) : 238294 NODE1 Memory (MB/s) : 37435.87 |
|
|
pcm-memory.x in KVM4NFV:
pcm-memory is a part of KVM4NFV in D release.pcm-memory.x will be executed with delay of 60 seconds before starting every testcase to monitor the memory traffic intensity which was handled in collect_MBWInfo function .The memory bandwidth information will be collected into the logs through the testcase updating every 60 seconds.
Pre-requisites:
1.Check for the processors supported by PCM .Latest pcm utility version (2.11)support Intel® Xeon® E5 v4 processor family.
2.Disabling NMI Watch Dog
3.Installing MSR registers
Memory Bandwidth logs for KVM4NFV can be found here:
http://artifacts.opnfv.org/kvmfornfv.html
Details of the function implemented:
In install_Pcm function, it handles the installation of pcm utility and the required prerequisites for pcm-memory.x tool to execute.
$ git clone https://github.com/opcm/pcm
$ cd pcm
$ make
In collect_MBWInfo Function,the below command is executed on the node which was collected to the logs with the timestamp and testType.The function will be called at the begining of each testcase and signal will be passed to terminate the pcm-memory process which was executing throughout the cyclic testcase.
$ pcm-memory.x 60 &>/root/MBWInfo/MBWInfo_${testType}_${timeStamp}

where,
${testType} = verify (or) daily
Future Scope
PCM information will be added to cyclictest of kvm4nfv in yardstick.
Low Latency Tunning Suggestion
The correct configuration is critical for improving the NFV performance/latency.Even working on the same codebase, configurations can cause wildly different performance/latency results.
There are many combinations of configurations, from hardware configuration to Operating System configuration and application level configuration. And there is no one simple configuration that works for every case. To tune a specific scenario, it’s important to know the behaviors of different configurations and their impact.
Platform Configuration
Some hardware features can be configured through firmware interface(like BIOS) but others may not be configurable (e.g. SMI on most platforms).
- Power management: Most power management related features save power at the expensive of latency. These features include: Intel®Turbo Boost Technology, Enhanced Intel®SpeedStep, Processor C state and P state. Normally they should be disabled but, depending on the real-time application design and latency requirements, there might be some features that can be enabled if the impact on deterministic execution of the workload is small.
- Hyper-Threading: The logic cores that share resource with other logic cores can introduce latency so the recommendation is to disable this feature for realtime use cases.
- Legacy USB Support/Port 60/64 Emulation: These features involve some emulation in firmware and can introduce random latency. It is recommended that they are disabled.
- SMI (System Management Interrupt): SMI runs outside of the kernel code and can potentially cause latency. It is a pity there is no simple way to disable it. Some vendors may provide related switches in BIOS but most machines do not have this capability.
Operating System Configuration
- CPU isolation: To achieve deterministic latency, dedicated CPUs should be allocated for realtime application. This can be achieved by isolating cpus from kernel scheduler. Please refer to http://lxr.free-electrons.com/source/Documentation/kernel-parameters.txt#L1608 for more information.
- Memory allocation: Memory shoud be reserved for realtime applications and usually hugepage should be used to reduce page fauts/TLB misses.
- IRQ affinity: All the non-realtime IRQs should be affinitized to non realtime CPUs to reduce the impact on realtime CPUs. Some OS distributions contain an irqbalance daemon which balances the IRQs among all the cores dynamically. It should be disabled as well.
- Device assignment for VM: If a device is used in a VM, then device passthrough is desirable. In this case,the IOMMU should be enabled.
- Tickless: Frequent clock ticks cause latency. CONFIG_NOHZ_FULL should be enabled in the linux kernel. With CONFIG_NOHZ_FULL, the physical CPU will trigger many fewer clock tick interrupts(currently, 1 tick per second). This can reduce latency because each host timer interrupt triggers a VM exit from guest to host which causes performance/latency impacts.
- TSC: Mark TSC clock source as reliable. A TSC clock source that seems to be unreliable causes the kernel to continuously enable the clock source watchdog to check if TSC frequency is still correct. On recent Intel platforms with Constant TSC/Invariant TSC/Synchronized TSC, the TSC is reliable so the watchdog is useless but cause latency.
- Idle: The poll option forces a polling idle loop that can slightly improve the performance of waking up an idle CPU.
- RCU_NOCB: RCU is a kernel synchronization mechanism. Refer to http://lxr.free-electrons.com/source/Documentation/RCU/whatisRCU.txt for more information. With RCU_NOCB, the impact from RCU to the VNF will be reduced.
- Disable the RT throttling: RT Throttling is a Linux kernel mechanism that occurs when a process or thread uses 100% of the core, leaving no resources for the Linux scheduler to execute the kernel/housekeeping tasks. RT Throttling increases the latency so should be disabled.
- NUMA configuration: To achieve the best latency. CPU/Memory and device allocated for realtime application/VM should be in the same NUMA node.