Yardstick Overview
Introduction
Welcome to Yardstick’s documentation !
Yardstick is an OPNFV Project.
The project’s goal is to verify infrastructure compliance, from the perspective of a Virtual Network Function (VNF).
The Project’s scope is the development of a test framework, Yardstick, test cases and test stimuli to enable Network Function Virtualization Infrastructure (NFVI) verification. The Project also includes a sample VNF, the Virtual Traffic Classifier (VTC) and its experimental framework, ApexLake !
Yardstick is used in OPNFV for verifying the OPNFV infrastructure and some of the OPNFV features. The Yardstick framework is deployed in several OPNFV community labs. It is installer, infrastructure and application independent.
See also
Pharos for information on OPNFV community labs and this Presentation for an overview of Yardstick
About This Document
This document consists of the following chapters:
- Chapter Methodology describes the methodology implemented by the Yardstick Project for NFVI verification.
- Chapter Architecture provides information on the software architecture of yardstick.
- Chapter Virtual Traffic Classifier provides information on the VTC.
- Chapter Apexlake Installation Guide provides instructions to install the experimental framework ApexLake and chapter Apexlake API Interface Definition explains how this framework is integrated in Yardstick.
- Chapter
07-installationprovides instructions to install Yardstick. - Chapter
08-yardstick_pluginprovides information on how to integrate other OPNFV testing projects into Yardstick. - Chapter
09-result-store-InfluxDBprovides inforamtion on how to run plug-in test cases and store test results into community’s InfluxDB. - Chapter
10-list-of-tcsincludes a list of available Yardstick test cases.
Contact Yardstick
Feedback? Contact us
Methodology
Abstract
This chapter describes the methodology implemented by the Yardstick project for verifying the NFVI from the perspective of a VNF.
ETSI-NFV
The document ETSI GS NFV-TST001, “Pre-deployment Testing; Report on Validation of NFV Environments and Services”, recommends methods for pre-deployment testing of the functional components of an NFV environment.
The Yardstick project implements the methodology described in chapter 6, “Pre- deployment validation of NFV infrastructure”.
The methodology consists in decomposing the typical VNF work-load performance metrics into a number of characteristics/performance vectors, which each can be represented by distinct test-cases.
The methodology includes five steps:
- Step1: Define Infrastruture - the Hardware, Software and corresponding
- configuration target for validation; the OPNFV infrastructure, in OPNFV community labs.
- Step2: Identify VNF type - the application for which the
- infrastructure is to be validated, and its requirements on the underlying infrastructure.
- Step3: Select test cases - depending on the workload that represents the
- application for which the infrastruture is to be validated, the relevant test cases amongst the list of available Yardstick test cases.
- Step4: Execute tests - define the duration and number of iterations for the
- selected test cases, tests runs are automated via OPNFV Jenkins Jobs.
- Step5: Collect results - using the common API for result collection.
See also
Yardsticktst for material on alignment ETSI TST001 and Yardstick.
Metrics
The metrics, as defined by ETSI GS NFV-TST001, are shown in Table1, Table2 and Table3.
In OPNFV Colorado release, generic test cases covering aspects of the listed metrics are available; further OPNFV releases will provide extended testing of these metrics. The view of available Yardstick test cases cross ETSI definitions in Table1, Table2 and Table3 is shown in Table4. It shall be noticed that the Yardstick test cases are examples, the test duration and number of iterations are configurable, as are the System Under Test (SUT) and the attributes (or, in Yardstick nomemclature, the scenario options).
Table 1 - Performance/Speed Metrics
| Category | Performance/Speed |
| Compute |
|
| Network |
|
| Storage |
|
Table 2 - Capacity/Scale Metrics
| Category | Capacity/Scale |
| Compute |
|
| Network |
|
| Storage |
|
Table 3 - Availability/Reliability Metrics
| Category | Availability/Reliability |
| Compute |
|
| Network |
|
| Storage |
|
Table 4 - Yardstick Generic Test Cases
| Category | Performance/Speed | Capacity/Scale | Availability/Reliability |
| Compute | TC003 [1] TC004 TC010 TC012 TC014 TC069 | TC003 [1] TC004 TC024 TC055 | TC013 [1] TC015 [1] |
| Network | TC001 TC002 TC009 TC011 TC042 TC043 | TC044 TC073 TC075 | TC016 [1] TC018 [1] |
| Storage | TC005 | TC063 | TC017 [1] |
Note
The description in this OPNFV document is intended as a reference for users to understand the scope of the Yardstick Project and the deliverables of the Yardstick framework. For complete description of the methodology, please refer to the ETSI document.
Footnotes
| [1] | (1, 2, 3, 4, 5, 6, 7) To be included in future deliveries. |
Architecture
Abstract
This chapter describes the yardstick framework software architecture. we will introduce it from Use-Case View, Logical View, Process View and Deployment View. More technical details will be introduced in this chapter.
Overview
Architecture overview
Yardstick is mainly written in Python, and test configurations are made in YAML. Documentation is written in reStructuredText format, i.e. .rst files. Yardstick is inspired by Rally. Yardstick is intended to run on a computer with access and credentials to a cloud. The test case is described in a configuration file given as an argument.
How it works: the benchmark task configuration file is parsed and converted into an internal model. The context part of the model is converted into a Heat template and deployed into a stack. Each scenario is run using a runner, either serially or in parallel. Each runner runs in its own subprocess executing commands in a VM using SSH. The output of each scenario is written as json records to a file or influxdb or http server, we use influxdb as the backend, the test result will be shown with grafana.
Concept
Benchmark - assess the relative performance of something
Benchmark configuration file - describes a single test case in yaml format
Context - The set of Cloud resources used by a scenario, such as user names, image names, affinity rules and network configurations. A context is converted into a simplified Heat template, which is used to deploy onto the Openstack environment.
Data - Output produced by running a benchmark, written to a file in json format
Runner - Logic that determines how a test scenario is run and reported, for example the number of test iterations, input value stepping and test duration. Predefined runner types exist for re-usage, see Runner types.
Scenario - Type/class of measurement for example Ping, Pktgen, (Iperf, LmBench, ...)
SLA - Relates to what result boundary a test case must meet to pass. For example a latency limit, amount or ratio of lost packets and so on. Action based on SLA can be configured, either just to log (monitor) or to stop further testing (assert). The SLA criteria is set in the benchmark configuration file and evaluated by the runner.
Runner types
There exists several predefined runner types to choose between when designing a test scenario:
Arithmetic: Every test run arithmetically steps the specified input value(s) in the test scenario, adding a value to the previous input value. It is also possible to combine several input values for the same test case in different combinations.
Snippet of an Arithmetic runner configuration:
runner:
    type: Arithmetic
    iterators:
    -
      name: stride
      start: 64
      stop: 128
      step: 64
Duration: The test runs for a specific period of time before completed.
Snippet of a Duration runner configuration:
runner:
  type: Duration
  duration: 30
Sequence: The test changes a specified input value to the scenario. The input values to the sequence are specified in a list in the benchmark configuration file.
Snippet of a Sequence runner configuration:
runner:
  type: Sequence
  scenario_option_name: packetsize
  sequence:
  - 100
  - 200
  - 250
Iteration: Tests are run a specified number of times before completed.
Snippet of an Iteration runner configuration:
runner:
  type: Iteration
  iterations: 2
Use-Case View
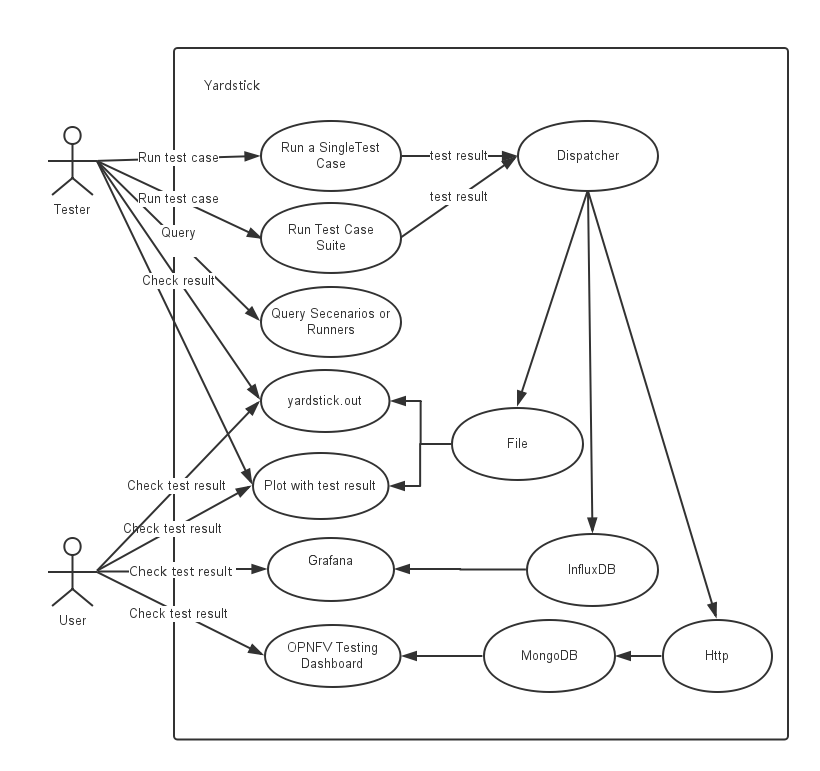
Yardstick Use-Case View shows two kinds of users. One is the Tester who will do testing in cloud, the other is the User who is more concerned with test result and result analyses.
For testers, they will run a single test case or test case suite to verify infrastructure compliance or bencnmark their own infrastructure performance. Test result will be stored by dispatcher module, three kinds of store method (file, influxdb and http) can be configured. The detail information of scenarios and runners can be queried with CLI by testers.
For users, they would check test result with four ways.
If dispatcher module is configured as file(default), there are two ways to check test result. One is to get result from yardstick.out ( default path: /tmp/yardstick.out), the other is to get plot of test result, it will be shown if users execute command “yardstick-plot”.
If dispatcher module is configured as influxdb, users will check test result on Grafana which is most commonly used for visualizing time series data.
If dispatcher module is configured as http, users will check test result on OPNFV testing dashboard which use MongoDB as backend.
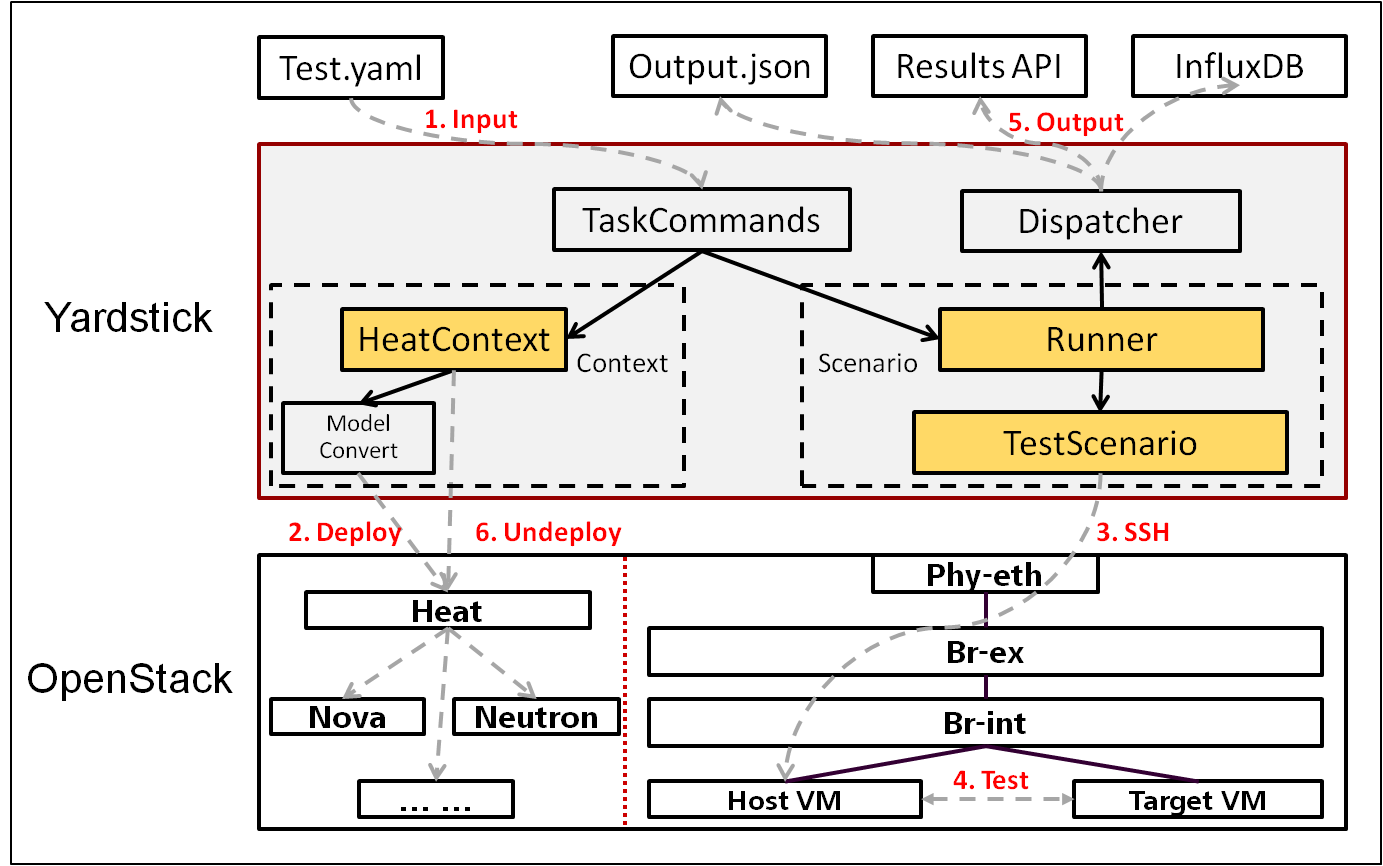
Logical View
Yardstick Logical View describes the most important classes, their organization, and the most important use-case realizations.
Main classes:
TaskCommands - “yardstick task” subcommand handler.
HeatContext - Do test yaml file context section model convert to HOT, deploy and undeploy Openstack heat stack.
Runner - Logic that determines how a test scenario is run and reported.
TestScenario - Type/class of measurement for example Ping, Pktgen, (Iperf, LmBench, ...)
Dispatcher - Choose user defined way to store test results.
TaskCommands is the “yardstick task” subcommand’s main entry. It takes yaml file (e.g. test.yaml) as input, and uses HeatContext to convert the yaml file’s context section to HOT. After Openstack heat stack is deployed by HeatContext with the converted HOT, TaskCommands use Runner to run specified TestScenario. During first runner initialization, it will create output process. The output process use Dispatcher to push test results. The Runner will also create a process to execute TestScenario. And there is a multiprocessing queue between each runner process and output process, so the runner process can push the real-time test results to the storage media. TestScenario is commonly connected with VMs by using ssh. It sets up VMs and run test measurement scripts through the ssh tunnel. After all TestScenaio is finished, TaskCommands will undeploy the heat stack. Then the whole test is finished.
Process View (Test execution flow)
Yardstick process view shows how yardstick runs a test case. Below is the sequence graph about the test execution flow using heat context, and each object represents one module in yardstick:
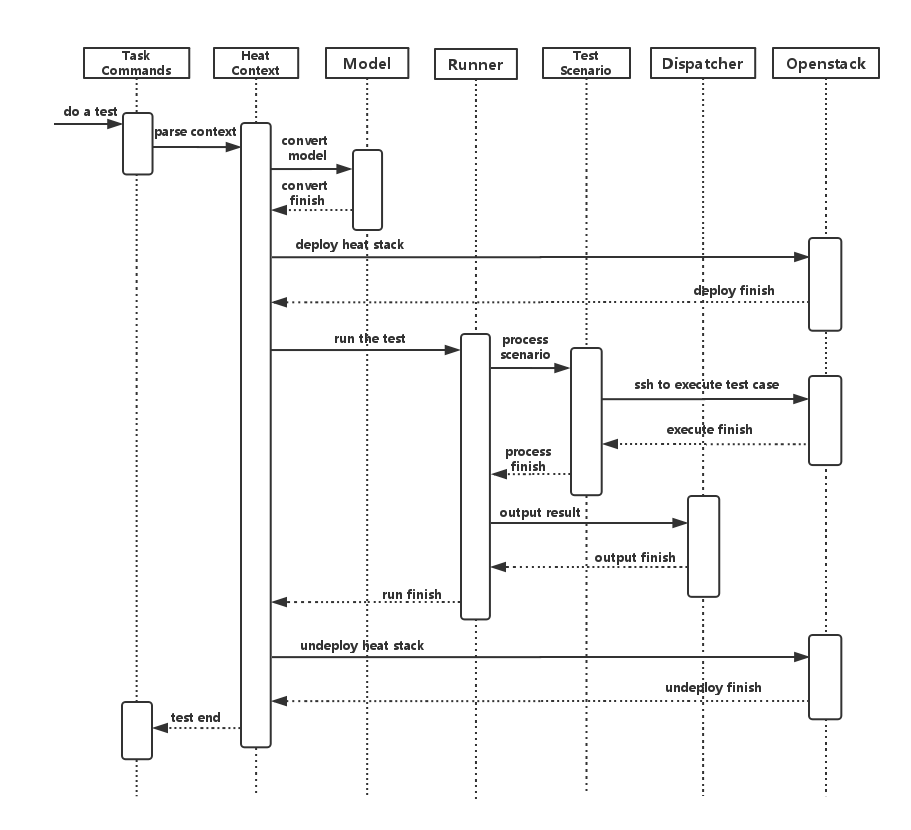
A user wants to do a test with yardstick. He can use the CLI to input the command to start a task. “TaskCommands” will receive the command and ask “HeatContext” to parse the context. “HeatContext” will then ask “Model” to convert the model. After the model is generated, “HeatContext” will inform “Openstack” to deploy the heat stack by heat template. After “Openstack” deploys the stack, “HeatContext” will inform “Runner” to run the specific test case.
Firstly, “Runner” would ask “TestScenario” to process the specific scenario. Then “TestScenario” will start to log on the openstack by ssh protocal and execute the test case on the specified VMs. After the script execution finishes, “TestScenario” will send a message to inform “Runner”. When the testing job is done, “Runner” will inform “Dispatcher” to output the test result via file, influxdb or http. After the result is output, “HeatContext” will call “Openstack” to undeploy the heat stack. Once the stack is undepoyed, the whole test ends.
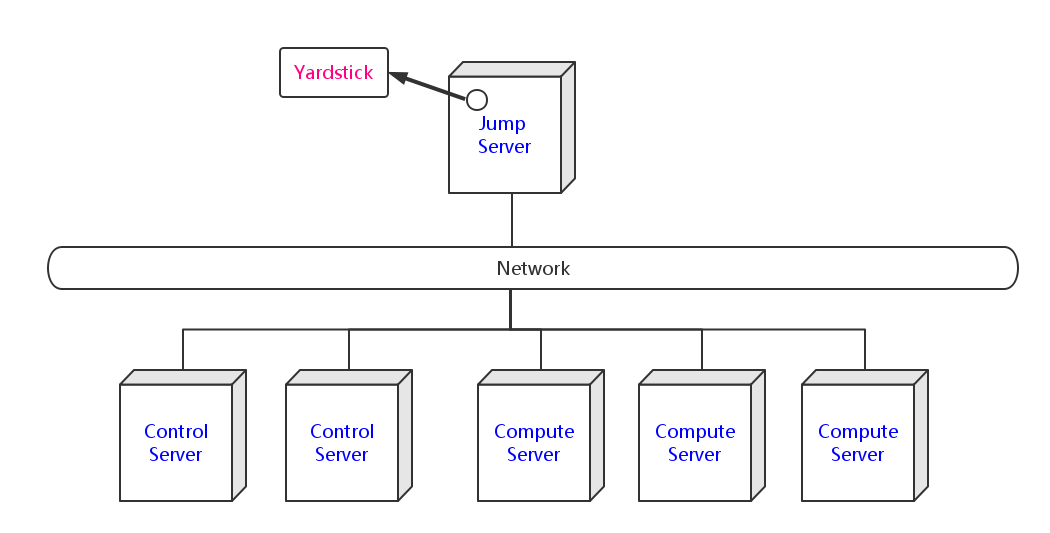
Deployment View
Yardstick deployment view shows how the yardstick tool can be deployed into the underlying platform. Generally, yardstick tool is installed on JumpServer(see 07-installation for detail installation steps), and JumpServer is connected with other control/compute servers by networking. Based on this deployment, yardstick can run the test cases on these hosts, and get the test result for better showing.
Yardstick Directory structure
yardstick/ - Yardstick main directory.
- ci/ - Used for continuous integration of Yardstick at different PODs and
- with support for different installers.
- docs/ - All documentation is stored here, such as configuration guides,
- user guides and Yardstick descriptions.
etc/ - Used for test cases requiring specific POD configurations.
- samples/ - test case samples are stored here, most of all scenario and
- feature’s samples are shown in this directory.
- tests/ - Here both Yardstick internal tests (functional/ and unit/) as
- well as the test cases run to verify the NFVI (opnfv/) are stored. Also configurations of what to run daily and weekly at the different PODs is located here.
- tools/ - Currently contains tools to build image for VMs which are deployed
- by Heat. Currently contains how to build the yardstick-trusty-server image with the different tools that are needed from within the image.
plugin/ - Plug-in configuration files are stored here.
vTC/ - Contains the files for running the virtual Traffic Classifier tests.
- yardstick/ - Contains the internals of Yardstick: Runners, Scenario, Contexts,
- CLI parsing, keys, plotting tools, dispatcher, plugin install/remove scripts and so on.
Virtual Traffic Classifier
Abstract
This chapter provides an overview of the virtual Traffic Classifier, a contribution to OPNFV Yardstick from the EU Project TNOVA. Additional documentation is available in TNOVAresults.
Overview
The virtual Traffic Classifier (VTC) VNF, comprises of a Virtual Network Function Component (VNFC). The VNFC contains both the Traffic Inspection module, and the Traffic forwarding module, needed to run the VNF. The exploitation of Deep Packet Inspection (DPI) methods for traffic classification is built around two basic assumptions:
- third parties unaffiliated with either source or recipient are able to
inspect each IP packet’s payload
- the classifier knows the relevant syntax of each application’s packet
payloads (protocol signatures, data patterns, etc.).
The proposed DPI based approach will only use an indicative, small number of the initial packets from each flow in order to identify the content and not inspect each packet.
In this respect it follows the Packet Based per Flow State (term:PBFS). This method uses a table to track each session based on the 5-tuples (src address, dest address, src port,dest port, transport protocol) that is maintained for each flow.
Concepts
- Traffic Inspection: The process of packet analysis and application
identification of network traffic that passes through the VTC.
- Traffic Forwarding: The process of packet forwarding from an incoming
network interface to a pre-defined outgoing network interface.
- Traffic Rule Application: The process of packet tagging, based on a
predefined set of rules. Packet tagging may include e.g. Type of Service (ToS) field modification.
Architecture
The Traffic Inspection module is the most computationally intensive component of the VNF. It implements filtering and packet matching algorithms in order to support the enhanced traffic forwarding capability of the VNF. The component supports a flow table (exploiting hashing algorithms for fast indexing of flows) and an inspection engine for traffic classification.
The implementation used for these experiments exploits the nDPI library. The packet capturing mechanism is implemented using libpcap. When the DPI engine identifies a new flow, the flow register is updated with the appropriate information and transmitted across the Traffic Forwarding module, which then applies any required policy updates.
The Traffic Forwarding moudle is responsible for routing and packet forwarding. It accepts incoming network traffic, consults the flow table for classification information for each incoming flow and then applies pre-defined policies marking e.g. ToS/Differentiated Services Code Point (DSCP) multimedia traffic for Quality of Service (QoS) enablement on the forwarded traffic. It is assumed that the traffic is forwarded using the default policy until it is identified and new policies are enforced.
The expected response delay is considered to be negligible, as only a small number of packets are required to identify each flow.
Graphical Overview
+----------------------------+
|                            |
| Virtual Traffic Classifier |
|                            |
|     Analysing/Forwarding   |
|        ------------>       |
|     ethA          ethB     |
|                            |
+----------------------------+
     |              ^
     |              |
     v              |
+----------------------------+
|                            |
|     Virtual Switch         |
|                            |
+----------------------------+
Install
run the build.sh with root privileges
Run
sudo ./pfbridge -a eth1 -b eth2
Development Environment
Ubuntu 14.04
Apexlake Installation Guide
Abstract
ApexLake is a framework that provides automatic execution of experiments and related data collection to enable a user validate infrastructure from the perspective of a Virtual Network Function (VNF).
In the context of Yardstick, a virtual Traffic Classifier (VTC) network function is utilized.
Framework Hardware Dependencies
In order to run the framework there are some hardware related dependencies for ApexLake.
The framework needs to be installed on the same physical node where DPDK-pktgen is installed.
The installation requires the physical node hosting the packet generator must have 2 NICs which are DPDK compatible.
The 2 NICs will be connected to the switch where the OpenStack VM network is managed.
The switch used must support multicast traffic and IGMP snooping. Further details about the configuration are provided at the following here.
The corresponding ports to which the cables are connected need to be configured as VLAN trunks using two of the VLAN IDs available for Neutron. Note the VLAN IDs used as they will be required in later configuration steps.
Framework Software Dependencies
Before starting the framework, a number of dependencies must first be installed. The following describes the set of instructions to be executed via the Linux shell in order to install and configure the required dependencies.
- Install Dependencies.
To support the framework dependencies the following packages must be installed. The example provided is based on Ubuntu and needs to be executed in root mode.
apt-get install python-dev
apt-get install python-pip
apt-get install python-mock
apt-get install tcpreplay
apt-get install libpcap-dev
- Source OpenStack openrc file.
source openrc
- Configure Openstack Neutron
In order to support traffic generation and management by the virtual Traffic Classifier, the configuration of the port security driver extension is required for Neutron.
For further details please follow the following link: PORTSEC This step can be skipped in case the target OpenStack is Juno or Kilo release, but it is required to support Liberty. It is therefore required to indicate the release version in the configuration file located in ./yardstick/vTC/apexlake/apexlake.conf
- Create Two Networks based on VLANs in Neutron.
To enable network communications between the packet generator and the compute node, two networks must be created via Neutron and mapped to the VLAN IDs that were previously used in the configuration of the physical switch. The following shows the typical set of commands required to configure Neutron correctly. The physical switches need to be configured accordingly.
VLAN_1=2032
VLAN_2=2033
PHYSNET=physnet2
neutron net-create apexlake_inbound_network \
        --provider:network_type vlan \
        --provider:segmentation_id $VLAN_1 \
        --provider:physical_network $PHYSNET

neutron subnet-create apexlake_inbound_network \
        192.168.0.0/24 --name apexlake_inbound_subnet

neutron net-create apexlake_outbound_network \
        --provider:network_type vlan \
        --provider:segmentation_id $VLAN_2 \
        --provider:physical_network $PHYSNET

neutron subnet-create apexlake_outbound_network 192.168.1.0/24 \
        --name apexlake_outbound_subnet
- Download Ubuntu Cloud Image and load it on Glance
The virtual Traffic Classifier is supported on top of Ubuntu 14.04 cloud image. The image can be downloaded on the local machine and loaded on Glance using the following commands:
wget cloud-images.ubuntu.com/trusty/current/trusty-server-cloudimg-amd64-disk1.img
glance image-create \
        --name ubuntu1404 \
        --is-public true \
        --disk-format qcow \
        --container-format bare \
        --file trusty-server-cloudimg-amd64-disk1.img
- Configure the Test Cases
The VLAN tags must also be included in the test case Yardstick yaml file as parameters for the following test cases:
Install and Configure DPDK Pktgen
Execution of the framework is based on DPDK Pktgen. If DPDK Pktgen has not installed, it is necessary to download, install, compile and configure it. The user can create a directory and download the dpdk packet generator source code:
cd experimental_framework/libraries
mkdir dpdk_pktgen
git clone https://github.com/pktgen/Pktgen-DPDK.git
For instructions on the installation and configuration of DPDK and DPDK Pktgen please follow the official DPDK Pktgen README file. Once the installation is completed, it is necessary to load the DPDK kernel driver, as follow:
insmod uio
insmod DPDK_DIR/x86_64-native-linuxapp-gcc/kmod/igb_uio.ko
It is necessary to set the configuration file to support the desired Pktgen configuration. A description of the required configuration parameters and supporting examples is provided in the following:
[PacketGen]
packet_generator = dpdk_pktgen

# This is the directory where the packet generator is installed
# (if the user previously installed dpdk-pktgen,
# it is required to provide the director where it is installed).
pktgen_directory = /home/user/software/dpdk_pktgen/dpdk/examples/pktgen/

# This is the directory where DPDK is installed
dpdk_directory = /home/user/apexlake/experimental_framework/libraries/Pktgen-DPDK/dpdk/

# Name of the dpdk-pktgen program that starts the packet generator
program_name = app/app/x86_64-native-linuxapp-gcc/pktgen

# DPDK coremask (see DPDK-Pktgen readme)
coremask = 1f

# DPDK memory channels (see DPDK-Pktgen readme)
memory_channels = 3

# Name of the interface of the pktgen to be used to send traffic (vlan_sender)
name_if_1 = p1p1

# Name of the interface of the pktgen to be used to receive traffic (vlan_receiver)
name_if_2 = p1p2

# PCI bus address correspondent to if_1
bus_slot_nic_1 = 01:00.0

# PCI bus address correspondent to if_2
bus_slot_nic_2 = 01:00.1
To find the parameters related to names of the NICs and the addresses of the PCI buses the user may find it useful to run the DPDK tool nic_bind as follows:
DPDK_DIR/tools/dpdk_nic_bind.py --status
Lists the NICs available on the system, and shows the available drivers and bus addresses for each interface. Please make sure to select NICs which are DPDK compatible.
Installation and Configuration of smcroute
The user is required to install smcroute which is used by the framework to support multicast communications.
The following is the list of commands required to download and install smroute.
cd ~
git clone https://github.com/troglobit/smcroute.git
cd smcroute
git reset --hard c3f5c56
sed -i 's/aclocal-1.11/aclocal/g' ./autogen.sh
sed -i 's/automake-1.11/automake/g' ./autogen.sh
./autogen.sh
./configure
make
sudo make install
cd ..
It is required to do the reset to the specified commit ID. It is also requires the creation a configuration file using the following command:
SMCROUTE_NIC=(name of the nic)
where name of the nic is the name used previously for the variable “name_if_2”. For example:
SMCROUTE_NIC=p1p2
Then create the smcroute configuration file /etc/smcroute.conf
echo mgroup from $SMCROUTE_NIC group 224.192.16.1 > /etc/smcroute.conf
At the end of this procedure it will be necessary to perform the following actions to add the user to the sudoers:
adduser USERNAME sudo
echo "user ALL=(ALL) NOPASSWD: ALL" >> /etc/sudoers
Experiment using SR-IOV Configuration on the Compute Node
To enable SR-IOV interfaces on the physical NIC of the compute node, a compatible NIC is required. NIC configuration depends on model and vendor. After proper configuration to support SR-IOV, a proper configuration of OpenStack is required. For further information, please refer to the SRIOV configuration guide
Finalize installation the framework on the system
The installation of the framework on the system requires the setup of the project. After entering into the apexlake directory, it is sufficient to run the following command.
python setup.py install
Since some elements are copied into the /tmp directory (see configuration file) it could be necessary to repeat this step after a reboot of the host.
Apexlake API Interface Definition
Abstract
The API interface provided by the framework to enable the execution of test cases is defined as follows.
execute_framework
static execute_framework (test_cases,
iterations,
heat_template,
heat_template_parameters,
deployment_configuration,
openstack_credentials)
Executes the framework according the specified inputs
Parameters
test_cases
Test cases to be run with the workload (dict() of dict())
- Example:
test_case = dict()
test_case[’name’] = ‘module.Class’
test_case[’params’] = dict()
test_case[’params’][’throughput’] = ‘1’
test_case[’params’][’vlan_sender’] = ‘1000’
test_case[’params’][’vlan_receiver’] = ‘1001’
test_cases = [test_case]
- iterations
Number of test cycles to be executed (int)
- heat_template
(string) File name of the heat template corresponding to the workload to be deployed. It contains the parameters to be evaluated in the form of #parameter_name. (See heat_templates/vTC.yaml as example).
- heat_template_parameters
(dict) Parameters to be provided as input to the heat template. See http://docs.openstack.org/developer/heat/ template_guide/hot_guide.html section “Template input parameters” for further info.
- deployment_configuration
( dict[string] = list(strings) ) ) Dictionary of parameters representing the deployment configuration of the workload.
The key is a string corresponding to the name of the parameter, the value is a list of strings representing the value to be assumed by a specific param. The parameters are user defined: they have to correspond to the place holders (#parameter_name) specified in the heat template.
Returns dict() containing results
Glossary
- API
- Application Programming Interface
- DPDK
- Data Plane Development Kit
- DPI
- Deep Packet Inspection
- DSCP
- Differentiated Services Code Point
- IGMP
- Internet Group Management Protocol
- IOPS
- Input/Output Operations Per Second
- NFVI
- Network Function Virtualization Infrastructure
- NIC
- Network Interface Controller
- PBFS
- Packet Based per Flow State
- QoS
- Quality of Service
- SR-IOV
- Single Root IO Virtualization
- SUT
- System Under Test
- ToS
- Type of Service
- VLAN
- Virtual LAN
- VM
- Virtual Machine
- VNF
- Virtual Network Function
- VNFC
- Virtual Network Function Component
- VTC
- Virtual Traffic Classifier
References
OPNFV
- Parser wiki: https://wiki.opnfv.org/parser
- Pharos wiki: https://wiki.opnfv.org/pharos
- VTC: https://wiki.opnfv.org/vtc
- Yardstick CI: https://build.opnfv.org/ci/view/yardstick/
- Yardstick and ETSI TST001 presentation: https://wiki.opnfv.org/display/yardstick/Yardstick?preview=%2F2925202%2F2925205%2Fopnfv_summit_-_bridging_opnfv_and_etsi.pdf
- Yardstick Project presentation: https://wiki.opnfv.org/display/yardstick/Yardstick?preview=%2F2925202%2F2925208%2Fopnfv_summit_-_yardstick_project.pdf
- Yardstick wiki: https://wiki.opnfv.org/yardstick
References used in Test Cases
- cachestat: https://github.com/brendangregg/perf-tools/tree/master/fs
- cirros-image: https://download.cirros-cloud.net
- cyclictest: https://rt.wiki.kernel.org/index.php/Cyclictest
- DPDKpktgen: https://github.com/Pktgen/Pktgen-DPDK/
- DPDK supported NICs: http://dpdk.org/doc/nics
- fdisk: http://www.tldp.org/HOWTO/Partition/fdisk_partitioning.html
- fio: http://www.bluestop.org/fio/HOWTO.txt
- free: http://manpages.ubuntu.com/manpages/trusty/en/man1/free.1.html
- iperf3: https://iperf.fr/
- iostat: http://linux.die.net/man/1/iostat
- Lmbench man-pages: http://manpages.ubuntu.com/manpages/trusty/lat_mem_rd.8.html
- Memory bandwidth man-pages: http://manpages.ubuntu.com/manpages/trusty/bw_mem.8.html
- mpstat man-pages: http://manpages.ubuntu.com/manpages/trusty/man1/mpstat.1.html
- netperf: http://www.netperf.org/netperf/training/Netperf.html
- pktgen: https://www.kernel.org/doc/Documentation/networking/pktgen.txt
- RAMspeed: http://alasir.com/software/ramspeed/
- sar: http://linux.die.net/man/1/sar
- SR-IOV: https://wiki.openstack.org/wiki/SR-IOV-Passthrough-For-Networking
- Storperf: https://wiki.opnfv.org/display/storperf/Storperf
- unixbench: https://github.com/kdlucas/byte-unixbench/blob/master/UnixBench
Research
- NCSRD: http://www.demokritos.gr/?lang=en
- T-NOVA: http://www.t-nova.eu/
- T-NOVA Results: http://www.t-nova.eu/results/