Performance Testing User Guide (Yardstick)
1. Introduction
Welcome to Yardstick’s documentation !
Yardstick is an OPNFV Project.
The project’s goal is to verify infrastructure compliance, from the perspective of a Virtual Network Function (VNF).
The Project’s scope is the development of a test framework, Yardstick, test cases and test stimuli to enable Network Function Virtualization Infrastructure (NFVI) verification.
Yardstick is used in OPNFV for verifying the OPNFV infrastructure and some of the OPNFV features. The Yardstick framework is deployed in several OPNFV community labs. It is installer, infrastructure and application independent.
See also
Pharos for information on OPNFV community labs and this Presentation for an overview of Yardstick
1.1. About This Document
This document consists of the following chapters:
- Chapter Introduction provides a brief introduction to Yardstick project’s background and describes the structure of this document.
- Chapter Methodology describes the methodology implemented by the Yardstick Project for NFVI verification.
- Chapter Architecture provides information on the software architecture of Yardstick.
- Chapter Yardstick Installation provides instructions to install Yardstick.
- Chapter Installing a plug-in into Yardstick provides information on how to integrate other OPNFV testing projects into Yardstick.
- Chapter Store Other Project’s Test Results in InfluxDB provides inforamtion on how to run plug-in test cases and store test results into community’s InfluxDB.
- Chapter Grafana dashboard provides inforamtion on Yardstick grafana dashboard and how to add a dashboard into Yardstick grafana dashboard.
- Chapter Yardstick Restful API provides inforamtion on Yardstick ReST API and how to use Yardstick API.
- Chapter Yardstick User Interface provides inforamtion on how to use yardstick report CLI to view the test result in table format and also values pinned on to a graph
- Chapter Virtual Traffic Classifier provides information on the VTC.
- Chapter Network Services Benchmarking (NSB) describes the methodology implemented by the Yardstick - Network service benchmarking to test real world usecase for a given VNF.
- Chapter Yardstick - NSB Testing -Installation provides instructions to install Yardstick - Network service benchmarking testing.
- Chapter Yardstick Test Cases includes a list of available Yardstick test cases.
1.2. Contact Yardstick
Feedback? Contact us
2. Methodology
2.1. Abstract
This chapter describes the methodology implemented by the Yardstick project for verifying the NFVI from the perspective of a VNF.
2.2. ETSI-NFV
The document ETSI GS NFV-TST001, “Pre-deployment Testing; Report on Validation of NFV Environments and Services”, recommends methods for pre-deployment testing of the functional components of an NFV environment.
The Yardstick project implements the methodology described in chapter 6, “Pre- deployment validation of NFV infrastructure”.
The methodology consists in decomposing the typical VNF work-load performance metrics into a number of characteristics/performance vectors, which each can be represented by distinct test-cases.
The methodology includes five steps:
- Step1: Define Infrastruture - the Hardware, Software and corresponding
configuration target for validation; the OPNFV infrastructure, in OPNFV community labs.
- Step2: Identify VNF type - the application for which the
infrastructure is to be validated, and its requirements on the underlying infrastructure.
- Step3: Select test cases - depending on the workload that represents the
application for which the infrastruture is to be validated, the relevant test cases amongst the list of available Yardstick test cases.
- Step4: Execute tests - define the duration and number of iterations for the
selected test cases, tests runs are automated via OPNFV Jenkins Jobs.
Step5: Collect results - using the common API for result collection.
See also
Yardsticktst for material on alignment ETSI TST001 and Yardstick.
2.3. Metrics
The metrics, as defined by ETSI GS NFV-TST001, are shown in Table1, Table2 and Table3.
In OPNFV Colorado release, generic test cases covering aspects of the listed metrics are available; further OPNFV releases will provide extended testing of these metrics. The view of available Yardstick test cases cross ETSI definitions in Table1, Table2 and Table3 is shown in Table4. It shall be noticed that the Yardstick test cases are examples, the test duration and number of iterations are configurable, as are the System Under Test (SUT) and the attributes (or, in Yardstick nomemclature, the scenario options).
Table 1 - Performance/Speed Metrics
| Category | Performance/Speed |
| Compute |
|
| Network |
|
| Storage |
|
Table 2 - Capacity/Scale Metrics
| Category | Capacity/Scale |
| Compute |
|
| Network |
|
| Storage |
|
Table 3 - Availability/Reliability Metrics
| Category | Availability/Reliability |
| Compute |
|
| Network |
|
| Storage |
|
Table 4 - Yardstick Generic Test Cases
| Category | Performance/Speed | Capacity/Scale | Availability/Reliability |
| Compute | TC003 [1] TC004 TC010 TC012 TC014 TC069 | TC003 [1] TC004 TC024 TC055 | TC013 [1] TC015 [1] |
| Network | TC001 TC002 TC009 TC011 TC042 TC043 | TC044 TC073 TC075 | TC016 [1] TC018 [1] |
| Storage | TC005 | TC063 | TC017 [1] |
Note
The description in this OPNFV document is intended as a reference for users to understand the scope of the Yardstick Project and the deliverables of the Yardstick framework. For complete description of the methodology, please refer to the ETSI document.
Footnotes
| [1] | (1, 2, 3, 4, 5, 6, 7) To be included in future deliveries. |
3. Architecture
3.1. Abstract
This chapter describes the yardstick framework software architecture. we will introduce it from Use-Case View, Logical View, Process View and Deployment View. More technical details will be introduced in this chapter.
3.2. Overview
3.2.1. Architecture overview
Yardstick is mainly written in Python, and test configurations are made in YAML. Documentation is written in reStructuredText format, i.e. .rst files. Yardstick is inspired by Rally. Yardstick is intended to run on a computer with access and credentials to a cloud. The test case is described in a configuration file given as an argument.
How it works: the benchmark task configuration file is parsed and converted into an internal model. The context part of the model is converted into a Heat template and deployed into a stack. Each scenario is run using a runner, either serially or in parallel. Each runner runs in its own subprocess executing commands in a VM using SSH. The output of each scenario is written as json records to a file or influxdb or http server, we use influxdb as the backend, the test result will be shown with grafana.
3.2.2. Concept
Benchmark - assess the relative performance of something
Benchmark configuration file - describes a single test case in yaml format
Context - The set of Cloud resources used by a scenario, such as user names, image names, affinity rules and network configurations. A context is converted into a simplified Heat template, which is used to deploy onto the Openstack environment.
Data - Output produced by running a benchmark, written to a file in json format
Runner - Logic that determines how a test scenario is run and reported, for example the number of test iterations, input value stepping and test duration. Predefined runner types exist for re-usage, see Runner types.
Scenario - Type/class of measurement for example Ping, Pktgen, (Iperf, LmBench, ...)
SLA - Relates to what result boundary a test case must meet to pass. For example a latency limit, amount or ratio of lost packets and so on. Action based on SLA can be configured, either just to log (monitor) or to stop further testing (assert). The SLA criteria is set in the benchmark configuration file and evaluated by the runner.
3.2.3. Runner types
There exists several predefined runner types to choose between when designing a test scenario:
Arithmetic: Every test run arithmetically steps the specified input value(s) in the test scenario, adding a value to the previous input value. It is also possible to combine several input values for the same test case in different combinations.
Snippet of an Arithmetic runner configuration:
runner:
    type: Arithmetic
    iterators:
    -
      name: stride
      start: 64
      stop: 128
      step: 64
Duration: The test runs for a specific period of time before completed.
Snippet of a Duration runner configuration:
runner:
  type: Duration
  duration: 30
Sequence: The test changes a specified input value to the scenario. The input values to the sequence are specified in a list in the benchmark configuration file.
Snippet of a Sequence runner configuration:
runner:
  type: Sequence
  scenario_option_name: packetsize
  sequence:
  - 100
  - 200
  - 250
Iteration: Tests are run a specified number of times before completed.
Snippet of an Iteration runner configuration:
runner:
  type: Iteration
  iterations: 2
3.3. Use-Case View
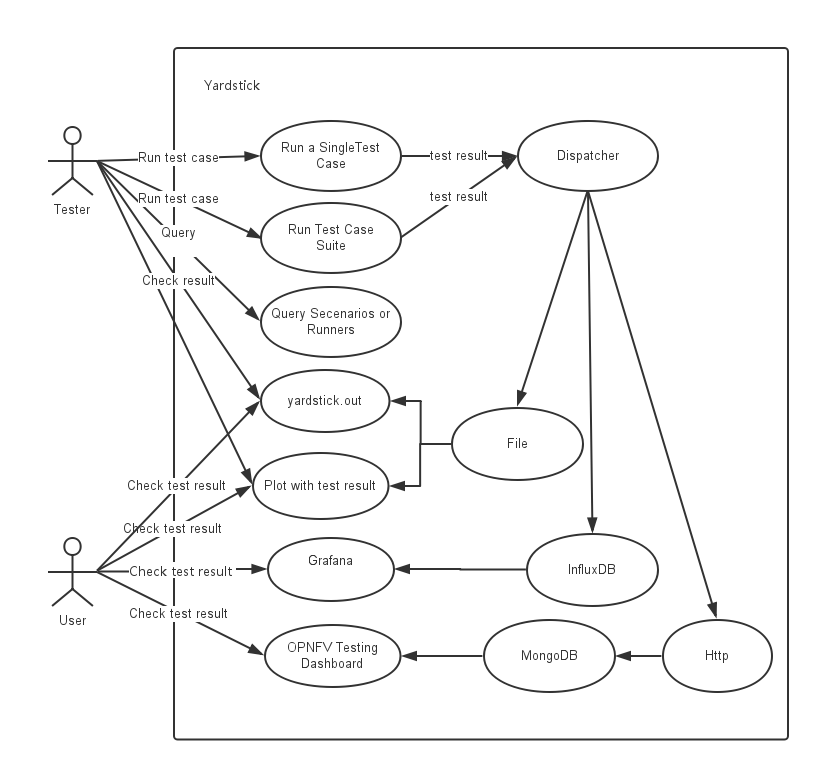
Yardstick Use-Case View shows two kinds of users. One is the Tester who will do testing in cloud, the other is the User who is more concerned with test result and result analyses.
For testers, they will run a single test case or test case suite to verify infrastructure compliance or bencnmark their own infrastructure performance. Test result will be stored by dispatcher module, three kinds of store method (file, influxdb and http) can be configured. The detail information of scenarios and runners can be queried with CLI by testers.
For users, they would check test result with four ways.
If dispatcher module is configured as file(default), there are two ways to check test result. One is to get result from yardstick.out ( default path: /tmp/yardstick.out), the other is to get plot of test result, it will be shown if users execute command “yardstick-plot”.
If dispatcher module is configured as influxdb, users will check test result on Grafana which is most commonly used for visualizing time series data.
If dispatcher module is configured as http, users will check test result on OPNFV testing dashboard which use MongoDB as backend.
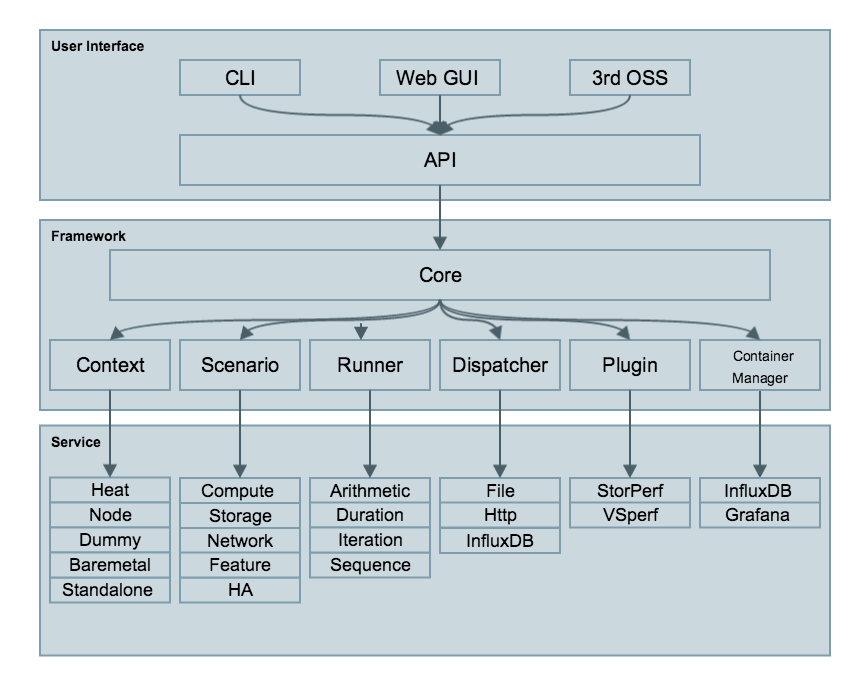
3.4. Logical View
Yardstick Logical View describes the most important classes, their organization, and the most important use-case realizations.
Main classes:
TaskCommands - “yardstick task” subcommand handler.
HeatContext - Do test yaml file context section model convert to HOT, deploy and undeploy Openstack heat stack.
Runner - Logic that determines how a test scenario is run and reported.
TestScenario - Type/class of measurement for example Ping, Pktgen, (Iperf, LmBench, ...)
Dispatcher - Choose user defined way to store test results.
TaskCommands is the “yardstick task” subcommand’s main entry. It takes yaml file (e.g. test.yaml) as input, and uses HeatContext to convert the yaml file’s context section to HOT. After Openstack heat stack is deployed by HeatContext with the converted HOT, TaskCommands use Runner to run specified TestScenario. During first runner initialization, it will create output process. The output process use Dispatcher to push test results. The Runner will also create a process to execute TestScenario. And there is a multiprocessing queue between each runner process and output process, so the runner process can push the real-time test results to the storage media. TestScenario is commonly connected with VMs by using ssh. It sets up VMs and run test measurement scripts through the ssh tunnel. After all TestScenaio is finished, TaskCommands will undeploy the heat stack. Then the whole test is finished.
3.5. Process View (Test execution flow)
Yardstick process view shows how yardstick runs a test case. Below is the sequence graph about the test execution flow using heat context, and each object represents one module in yardstick:
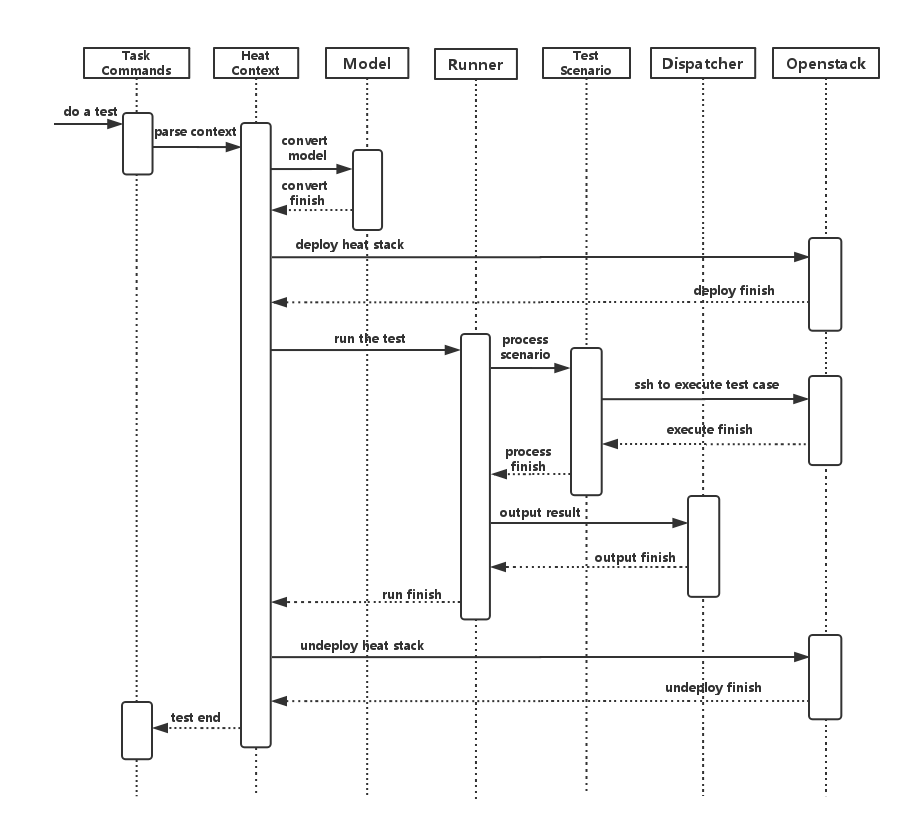
A user wants to do a test with yardstick. He can use the CLI to input the command to start a task. “TaskCommands” will receive the command and ask “HeatContext” to parse the context. “HeatContext” will then ask “Model” to convert the model. After the model is generated, “HeatContext” will inform “Openstack” to deploy the heat stack by heat template. After “Openstack” deploys the stack, “HeatContext” will inform “Runner” to run the specific test case.
Firstly, “Runner” would ask “TestScenario” to process the specific scenario. Then “TestScenario” will start to log on the openstack by ssh protocal and execute the test case on the specified VMs. After the script execution finishes, “TestScenario” will send a message to inform “Runner”. When the testing job is done, “Runner” will inform “Dispatcher” to output the test result via file, influxdb or http. After the result is output, “HeatContext” will call “Openstack” to undeploy the heat stack. Once the stack is undepoyed, the whole test ends.
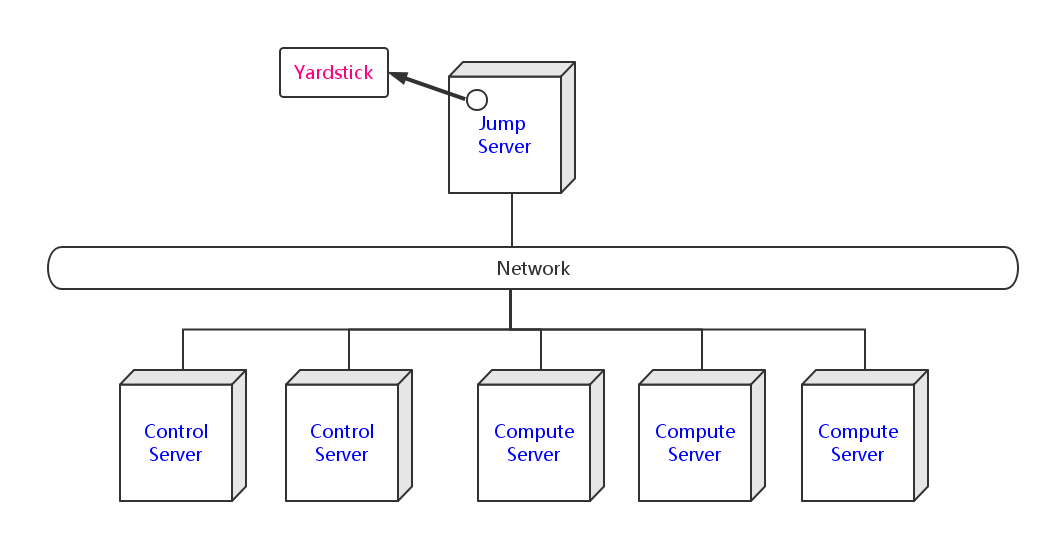
3.6. Deployment View
Yardstick deployment view shows how the yardstick tool can be deployed into the underlying platform. Generally, yardstick tool is installed on JumpServer(see 07-installation for detail installation steps), and JumpServer is connected with other control/compute servers by networking. Based on this deployment, yardstick can run the test cases on these hosts, and get the test result for better showing.
3.7. Yardstick Directory structure
yardstick/ - Yardstick main directory.
- tests/ci/ - Used for continuous integration of Yardstick at different PODs and
- with support for different installers.
- docs/ - All documentation is stored here, such as configuration guides,
- user guides and Yardstick descriptions.
etc/ - Used for test cases requiring specific POD configurations.
- samples/ - test case samples are stored here, most of all scenario and
- feature’s samples are shown in this directory.
- tests/ - Here both Yardstick internal tests (functional/ and unit/) as
- well as the test cases run to verify the NFVI (opnfv/) are stored. Also configurations of what to run daily and weekly at the different PODs is located here.
- tools/ - Currently contains tools to build image for VMs which are deployed
- by Heat. Currently contains how to build the yardstick-trusty-server image with the different tools that are needed from within the image.
plugin/ - Plug-in configuration files are stored here.
vTC/ - Contains the files for running the virtual Traffic Classifier tests.
- yardstick/ - Contains the internals of Yardstick: Runners, Scenario, Contexts,
- CLI parsing, keys, plotting tools, dispatcher, plugin install/remove scripts and so on.
4. Yardstick Installation
4.1. Abstract
Yardstick supports installation by Docker or directly in Ubuntu. The installation procedure for Docker and direct installation are detailed in the sections below.
To use Yardstick you should have access to an OpenStack environment, with at least Nova, Neutron, Glance, Keystone and Heat installed.
The steps needed to run Yardstick are:
- Install Yardstick.
- Load OpenStack environment variables.
- Create Yardstick flavor.
- Build a guest image and load it into the OpenStack environment.
- Create the test configuration
.yamlfile and run the test case/suite.
4.2. Prerequisites
The OPNFV deployment is out of the scope of this document and can be found here. The OPNFV platform is considered as the System Under Test (SUT) in this document.
Several prerequisites are needed for Yardstick:
- A Jumphost to run Yardstick on
- A Docker daemon or a virtual environment installed on the Jumphost
- A public/external network created on the SUT
- Connectivity from the Jumphost to the SUT public/external network
NOTE: Jumphost refers to any server which meets the previous requirements. Normally it is the same server from where the OPNFV deployment has been triggered.
WARNING: Connectivity from Jumphost is essential and it is of paramount importance to make sure it is working before even considering to install and run Yardstick. Make also sure you understand how your networking is designed to work.
NOTE: If your Jumphost is operating behind a company http proxy and/or Firewall, please consult first the section `Proxy Support (**Todo**)`_, towards the end of this document. That section details some tips/tricks which may be of help in a proxified environment.
4.3. Install Yardstick using Docker (recommended)
Yardstick has a Docker image. It is recommended to use this Docker image to run Yardstick test.
4.3.1. Prepare the Yardstick container
Install docker on your guest system with the following command, if not done yet:
wget -qO- https://get.docker.com/ | sh
Pull the Yardstick Docker image (opnfv/yardstick) from the public dockerhub
registry under the OPNFV account: dockerhub, with the following docker
command:
docker pull opnfv/yardstick:stable
After pulling the Docker image, check that it is available with the following docker command:
[yardsticker@jumphost ~]$ docker images
REPOSITORY         TAG       IMAGE ID        CREATED      SIZE
opnfv/yardstick    stable    a4501714757a    1 day ago    915.4 MB
Run the Docker image to get a Yardstick container:
docker run -itd --privileged -v /var/run/docker.sock:/var/run/docker.sock -p 8888:5000 --name yardstick opnfv/yardstick:stable
Note:
| parameters | Detail |
|---|---|
| -itd | -i: interactive, Keep STDIN open even if not attached. -t: allocate a pseudo-TTY. -d: run container in detached mode, in the background. |
| –privileged | If you want to build
yardstick-image in
Yardstick container, this
parameter is needed. |
| -p 8888:5000 | If you want to call Yardstick API out of Yardstick container, this parameter is needed. |
| -v /var/run/docker.sock:/var/run/docker.sock | If you want to use yardstick env grafana/influxdb to create a grafana/influxdb container out of Yardstick container, this parameter is needed. |
| –name yardstick | The name for this container, not needed and can be defined by the user. |
4.3.2. Configure the Yardstick container environment
There are three ways to configure environments for running Yardstick, which will be shown in the following sections. Before that, enter the Yardstick container:
docker exec -it yardstick /bin/bash
and then configure Yardstick environments in the Yardstick container.
4.3.2.1. The first way (recommended)
In the Yardstick container, the Yardstick repository is located in the /home/opnfv/repos directory. Yardstick provides a CLI to prepare OpenStack environment variables and create Yardstick flavor and guest images automatically:
yardstick env prepare
NOTE: Since Euphrates release, the above command will not able to automatically configure the /etc/yardstick/openstack.creds file. So before running the above command, it is necessary to create the /etc/yardstick/openstack.creds file and save OpenStack environment variables into it manually. If you have the openstack credential file saved outside the Yardstcik Docker container, you can do this easily by mapping the credential file into Yardstick container
using ‘-v /path/to/credential_file:/etc/yardstick/openstack.creds’ when running the Yardstick container.
For details of the required OpenStack environment variables please refer to section Export OpenStack environment variables
The env prepare command may take up to 6-8 minutes to finish building yardstick-image and other environment preparation. Meanwhile if you wish to monitor the env prepare process, you can enter the Yardstick container in a new terminal window and execute the following command:
tail -f /var/log/yardstick/uwsgi.log
4.3.2.2. The second way
4.3.2.2.1. Export OpenStack environment variables
Before running Yardstick it is necessary to export OpenStack environment variables:
source openrc
Environment variables in the openrc file have to include at least:
OS_AUTH_URLOS_USERNAMEOS_PASSWORDOS_TENANT_NAMEEXTERNAL_NETWORK
A sample openrc file may look like this:
export OS_PASSWORD=console
export OS_TENANT_NAME=admin
export OS_AUTH_URL=http://172.16.1.222:35357/v2.0
export OS_USERNAME=admin
export OS_VOLUME_API_VERSION=2
export EXTERNAL_NETWORK=net04_ext
4.3.2.2.2. Manually create Yardstick falvor and guest images
Before executing Yardstick test cases, make sure that Yardstick flavor and guest image are available in OpenStack. Detailed steps about creating the Yardstick flavor and building the Yardstick guest image can be found below.
Most of the sample test cases in Yardstick are using an OpenStack flavor called
yardstick-flavor which deviates from the OpenStack standard m1.tiny flavor by the disk size - instead of 1GB it has 3GB. Other parameters are the same as in m1.tiny.
Create yardstick-flavor:
nova flavor-create yardstick-flavor 100 512 3 1
Most of the sample test cases in Yardstick are using a guest image called
yardstick-image which deviates from an Ubuntu Cloud Server image
containing all the required tools to run test cases supported by Yardstick.
Yardstick has a tool for building this custom image. It is necessary to have
sudo rights to use this tool.
Also you may need install several additional packages to use this tool, by follwing the commands below:
sudo apt-get update && sudo apt-get install -y qemu-utils kpartx
This image can be built using the following command in the directory where Yardstick is installed:
export YARD_IMG_ARCH='amd64'
sudo echo "Defaults env_keep += \'YARD_IMG_ARCH\'" >> /etc/sudoers
sudo tools/yardstick-img-modify tools/ubuntu-server-cloudimg-modify.sh
Warning: Before building the guest image inside the Yardstick container, make sure the container is granted with privilege. The script will create files by default in /tmp/workspace/yardstick and the files will be owned by root!
The created image can be added to OpenStack using the glance image-create or via the OpenStack Dashboard. Example command is:
glance --os-image-api-version 1 image-create \
--name yardstick-image --is-public true \
--disk-format qcow2 --container-format bare \
--file /tmp/workspace/yardstick/yardstick-image.img
Some Yardstick test cases use a Cirros 0.3.5 image and/or a Ubuntu 16.04 image. Add Cirros and Ubuntu images to OpenStack:
openstack image create \
    --disk-format qcow2 \
    --container-format bare \
    --file $cirros_image_file \
    cirros-0.3.5

openstack image create \
    --disk-format qcow2 \
    --container-format bare \
    --file $ubuntu_image_file \
    Ubuntu-16.04
4.3.2.3. The third way
Similar to the second way, the first step is also to Export OpenStack environment variables. Then the following steps should be done.
4.3.2.3.1. Automatically create Yardstcik flavor and guest images
Yardstick has a script for automatically creating Yardstick flavor and building Yardstick guest images. This script is mainly used for CI and can be also used in the local environment:
source $YARDSTICK_REPO_DIR/tests/ci/load_images.sh
4.3.3. Delete the Yardstick container
If you want to uninstall Yardstick, just delete the Yardstick container:
docker stop yardstick && docker rm yardstick
4.4. Install Yardstick directly in Ubuntu
Alternatively you can install Yardstick framework directly in Ubuntu or in an Ubuntu Docker image. No matter which way you choose to install Yardstick, the following installation steps are identical.
If you choose to use the Ubuntu Docker image, you can pull the Ubuntu Docker image from Docker hub:
docker pull ubuntu:16.04
4.4.1. Install Yardstick
Prerequisite preparation:
apt-get update && apt-get install -y git python-setuptools python-pip
easy_install -U setuptools==30.0.0
pip install appdirs==1.4.0
pip install virtualenv
Create a virtual environment:
virtualenv ~/yardstick_venv
export YARDSTICK_VENV=~/yardstick_venv
source ~/yardstick_venv/bin/activate
Download the source code and install Yardstick from it:
git clone https://gerrit.opnfv.org/gerrit/yardstick
export YARDSTICK_REPO_DIR=~/yardstick
cd yardstick
./install.sh
4.4.2. Configure the Yardstick environment (Todo)
For installing Yardstick directly in Ubuntu, the yardstick env command is not available. You need to prepare OpenStack environment variables and create Yardstick flavor and guest images manually.
4.4.3. Uninstall Yardstick
For unistalling Yardstick, just delete the virtual environment:
rm -rf ~/yardstick_venv
4.5. Verify the installation
It is recommended to verify that Yardstick was installed successfully
by executing some simple commands and test samples. Before executing Yardstick
test cases make sure yardstick-flavor and yardstick-image can be found in OpenStack and the openrc file is sourced. Below is an example
invocation of Yardstick help command and ping.py test sample:
yardstick -h
yardstick task start samples/ping.yaml
NOTE: The above commands could be run in both the Yardstick container and the Ubuntu directly.
Each testing tool supported by Yardstick has a sample configuration file.
These configuration files can be found in the samples directory.
Default location for the output is /tmp/yardstick.out.
4.6. Deploy InfluxDB and Grafana using Docker
Without InfluxDB, Yardstick stores results for runnning test case in the file
/tmp/yardstick.out. However, it’s unconvenient to retrieve and display
test results. So we will show how to use InfluxDB to store data and use
Grafana to display data in the following sections.
4.6.1. Automatically deploy InfluxDB and Grafana containers (recommended)
Firstly, enter the Yardstick container:
docker exec -it yardstick /bin/bash
Secondly, create InfluxDB container and configure with the following command:
yardstick env influxdb
Thirdly, create and configure Grafana container:
yardstick env grafana
Then you can run a test case and visit http://host_ip:3000 (admin/admin) to see the results.
NOTE: Executing yardstick env command to deploy InfluxDB and Grafana requires Jumphost’s docker API version => 1.24. Run the following command to check the docker API version on the Jumphost:
docker version
4.6.2. Manually deploy InfluxDB and Grafana containers
You could also deploy influxDB and Grafana containers manually on the Jumphost. The following sections show how to do.
4.6.2.1. Pull docker images
docker pull tutum/influxdb
docker pull grafana/grafana
4.6.2.2. Run and configure influxDB
Run influxDB:
docker run -d --name influxdb \
-p 8083:8083 -p 8086:8086 --expose 8090 --expose 8099 \
tutum/influxdb
docker exec -it influxdb bash
Configure influxDB:
influx
>CREATE USER root WITH PASSWORD 'root' WITH ALL PRIVILEGES
>CREATE DATABASE yardstick;
>use yardstick;
>show MEASUREMENTS;
4.6.2.3. Run and configure Grafana
Run Grafana:
docker run -d --name grafana -p 3000:3000 grafana/grafana
Log on http://{YOUR_IP_HERE}:3000 using admin/admin and configure database resource to be {YOUR_IP_HERE}:8086.
4.6.2.4. Configure yardstick.conf
docker exec -it yardstick /bin/bash
cp etc/yardstick/yardstick.conf.sample /etc/yardstick/yardstick.conf
vi /etc/yardstick/yardstick.conf
Modify yardstick.conf:
[DEFAULT]
debug = True
dispatcher = influxdb

[dispatcher_influxdb]
timeout = 5
target = http://{YOUR_IP_HERE}:8086
db_name = yardstick
username = root
password = root
Now you can run Yardstick test cases and store the results in influxDB.
4.7. Deploy InfluxDB and Grafana directly in Ubuntu (Todo)
4.8. Yardstick common CLI
yardstick testcase list
This command line would list all test cases in yardstick. It would show like below:
+---------------------------------------------------------------------------------------
| Testcase Name         | Description
+---------------------------------------------------------------------------------------
| opnfv_yardstick_tc001 | Measure network throughput using pktgen
| opnfv_yardstick_tc002 | measure network latency using ping
| opnfv_yardstick_tc005 | Measure Storage IOPS, throughput and latency using fio.
| opnfv_yardstick_tc006 | Measure volume storage IOPS, throughput and latency using fio.
| opnfv_yardstick_tc008 | Measure network throughput and packet loss using Pktgen
| opnfv_yardstick_tc009 | Measure network throughput and packet loss using pktgen
| opnfv_yardstick_tc010 | measure memory read latency using lmbench.
| opnfv_yardstick_tc011 | Measure packet delay variation (jitter) using iperf3.
| opnfv_yardstick_tc012 | Measure memory read and write bandwidth using lmbench.
| opnfv_yardstick_tc014 | Measure Processing speed using unixbench.
| opnfv_yardstick_tc019 | Sample test case for the HA of controller node service.
...
+---------------------------------------------------------------------------------------
Take opnfv_yardstick_tc002 for an example. This test case measure network latency. You just need to type in yardstick testcase show opnfv_yardstick_tc002, and the console would show the config yaml of this test case:
##############################################################################
# Copyright (c) 2017 kristian.hunt@gmail.com and others.
#
# All rights reserved. This program and the accompanying materials
# are made available under the terms of the Apache License, Version 2.0
# which accompanies this distribution, and is available at
# http://www.apache.org/licenses/LICENSE-2.0
##############################################################################
---

schema: "yardstick:task:0.1"
description: >
    Yardstick TC002 config file;
    measure network latency using ping;

{% set image = image or "cirros-0.3.5" %}

{% set provider = provider or none %}
{% set physical_network = physical_network or 'physnet1' %}
{% set segmentation_id = segmentation_id or none %}
{% set packetsize = packetsize or 100 %}

scenarios:
{% for i in range(2) %}
-
  type: Ping
  options:
    packetsize: {{packetsize}}
  host: athena.demo
  target: ares.demo

  runner:
    type: Duration
    duration: 60
    interval: 10

  sla:
    max_rtt: 10
    action: monitor
{% endfor %}

context:
  name: demo
  image: {{image}}
  flavor: yardstick-flavor
  user: cirros

  placement_groups:
    pgrp1:
      policy: "availability"

  servers:
    athena:
      floating_ip: true
      placement: "pgrp1"
    ares:
      placement: "pgrp1"

  networks:
    test:
      cidr: '10.0.1.0/24'
      {% if provider == "vlan" %}
      provider: {{provider}}
      physical_network: {{physical_network}}å
        {% if segmentation_id %}
      segmentation_id: {{segmentation_id}}
        {% endif %}
      {% endif %}
If you want run a test case, then you need to use yardstick task start <test_case_path> this command support some parameters as below:
| Parameters | Detail |
|---|---|
| -d | show debug log of yardstick running |
| –task-args | If you want to customize test case parameters, use “–task-args” to pass the value. The format is a json string with parameter key-value pair. |
| –task-args-file | If you want to use yardstick env prepare command(or related API) to load the |
| –parse-only | |
| –output-file OUTPUT_FILE_PATH | Specify where to output the log. if not pass, the default value is “/tmp/yardstick/yardstick.log” |
| –suite TEST_SUITE_PATH | run a test suite, TEST_SUITE_PATH speciy where the test suite locates |
4.9. Run Yardstick in a local environment
We also have a guide about how to run Yardstick in a local environment. This work is contributed by Tapio Tallgren. You can find this guide at here.
4.10. Create a test suite for Yardstick
A test suite in yardstick is a yaml file which include one or more test cases. Yardstick is able to support running test suite task, so you can customize your own test suite and run it in one task.
tests/opnfv/test_suites is the folder where Yardstick puts CI test suite. A typical test suite is like below (the fuel_test_suite.yaml example):
---
# Fuel integration test task suite

schema: "yardstick:suite:0.1"

name: "fuel_test_suite"
test_cases_dir: "samples/"
test_cases:
-
  file_name: ping.yaml
-
  file_name: iperf3.yaml
As you can see, there are two test cases in the fuel_test_suite.yaml. The
schema and the name must be specified. The test cases should be listed
via the tag test_cases and their relative path is also marked via the tag
test_cases_dir.
Yardstick test suite also supports constraints and task args for each test
case. Here is another sample (the os-nosdn-nofeature-ha.yaml example) to
show this, which is digested from one big test suite:
---

schema: "yardstick:suite:0.1"

name: "os-nosdn-nofeature-ha"
test_cases_dir: "tests/opnfv/test_cases/"
test_cases:
-
    file_name: opnfv_yardstick_tc002.yaml
-
    file_name: opnfv_yardstick_tc005.yaml
-
    file_name: opnfv_yardstick_tc043.yaml
       constraint:
          installer: compass
          pod: huawei-pod1
       task_args:
          huawei-pod1: '{"pod_info": "etc/yardstick/.../pod.yaml",
          "host": "node4.LF","target": "node5.LF"}'
As you can see in test case opnfv_yardstick_tc043.yaml, there are two
tags, constraint and task_args. constraint is to specify which
installer or pod it can be run in the CI environment. task_args is to
specify the task arguments for each pod.
All in all, to create a test suite in Yardstick, you just need to create a yaml file and add test cases, constraint or task arguments if necessary.
4.11. Proxy Support (Todo)
5. Installing a plug-in into Yardstick
5.1. Abstract
Yardstick provides a plugin CLI command to support integration with other
OPNFV testing projects. Below is an example invocation of Yardstick plugin
command and Storperf plug-in sample.
5.2. Installing Storperf into Yardstick
Storperf is delivered as a Docker container from https://hub.docker.com/r/opnfv/storperf/tags/.
There are two possible methods for installation in your environment:
- Run container on Jump Host
- Run container in a VM
In this introduction we will install Storperf on Jump Host.
5.2.1. Step 0: Environment preparation
Running Storperf on Jump Host Requirements:
- Docker must be installed
- Jump Host must have access to the OpenStack Controller API
- Jump Host must have internet connectivity for downloading docker image
- Enough floating IPs must be available to match your agent count
Before installing Storperf into yardstick you need to check your openstack environment and other dependencies:
- Make sure docker is installed.
- Make sure Keystone, Nova, Neutron, Glance, Heat are installed correctly.
- Make sure Jump Host have access to the OpenStack Controller API.
- Make sure Jump Host must have internet connectivity for downloading docker image.
- You need to know where to get basic openstack Keystone authorization info, such as OS_PASSWORD, OS_TENANT_NAME, OS_AUTH_URL, OS_USERNAME.
- To run a Storperf container, you need to have OpenStack Controller environment variables defined and passed to Storperf container. The best way to do this is to put environment variables in a “storperf_admin-rc” file. The storperf_admin-rc should include credential environment variables at least:
- OS_AUTH_URL
- OS_USERNAME
- OS_PASSWORD
- OS_TENANT_ID
- OS_TENANT_NAME
- OS_PROJECT_NAME
- OS_PROJECT_ID
- OS_USER_DOMAIN_ID
Yardstick has a “prepare_storperf_admin-rc.sh” script which can be used to generate the “storperf_admin-rc” file, this script is located at test/ci/prepare_storperf_admin-rc.sh
#!/bin/bash
# Prepare storperf_admin-rc for StorPerf.
AUTH_URL=${OS_AUTH_URL}
USERNAME=${OS_USERNAME:-admin}
PASSWORD=${OS_PASSWORD:-console}

TENANT_NAME=${OS_TENANT_NAME:-admin}
TENANT_ID=`openstack project show admin|grep '\bid\b' |awk -F '|' '{print $3}'|sed -e 's/^[[:space:]]*//'`
PROJECT_NAME=${OS_PROJECT_NAME:-$TENANT_NAME}
PROJECT_ID=`openstack project show admin|grep '\bid\b' |awk -F '|' '{print $3}'|sed -e 's/^[[:space:]]*//'`
USER_DOMAIN_ID=${OS_USER_DOMAIN_ID:-default}

rm -f ~/storperf_admin-rc
touch ~/storperf_admin-rc

echo "OS_AUTH_URL="$AUTH_URL >> ~/storperf_admin-rc
echo "OS_USERNAME="$USERNAME >> ~/storperf_admin-rc
echo "OS_PASSWORD="$PASSWORD >> ~/storperf_admin-rc
echo "OS_PROJECT_NAME="$PROJECT_NAME >> ~/storperf_admin-rc
echo "OS_PROJECT_ID="$PROJECT_ID >> ~/storperf_admin-rc
echo "OS_TENANT_NAME="$TENANT_NAME >> ~/storperf_admin-rc
echo "OS_TENANT_ID="$TENANT_ID >> ~/storperf_admin-rc
echo "OS_USER_DOMAIN_ID="$USER_DOMAIN_ID >> ~/storperf_admin-rc
The generated “storperf_admin-rc” file will be stored in the root directory. If you installed Yardstick using Docker, this file will be located in the container. You may need to copy it to the root directory of the Storperf deployed host.
5.2.2. Step 1: Plug-in configuration file preparation
To install a plug-in, first you need to prepare a plug-in configuration file in YAML format and store it in the “plugin” directory. The plugin configration file work as the input of yardstick “plugin” command. Below is the Storperf plug-in configuration file sample:
---
# StorPerf plugin configuration file
# Used for integration StorPerf into Yardstick as a plugin
schema: "yardstick:plugin:0.1"
plugins:
  name: storperf
deployment:
  ip: 192.168.23.2
  user: root
  password: root
In the plug-in configuration file, you need to specify the plug-in name and the plug-in deployment info, including node ip, node login username and password. Here the Storperf will be installed on IP 192.168.23.2 which is the Jump Host in my local environment.
5.2.3. Step 2: Plug-in install/remove scripts preparation
In “yardstick/resource/scripts” directory, there are two folders: a “install” folder and a “remove” folder. You need to store the plug-in install/remove scripts in these two folders respectively.
The detailed installation or remove operation should de defined in these two scripts. The name of both install and remove scripts should match the plugin-in name that you specified in the plug-in configuration file.
For example, the install and remove scripts for Storperf are both named to “storperf.bash”.
5.2.4. Step 3: Install and remove Storperf
To install Storperf, simply execute the following command:
# Install Storperf
yardstick plugin install plugin/storperf.yaml
5.2.4.1. removing Storperf from yardstick
To remove Storperf, simply execute the following command:
# Remove Storperf
yardstick plugin remove plugin/storperf.yaml
What yardstick plugin command does is using the username and password to log into the deployment target and then execute the corresponding install or remove script.
6. Store Other Project’s Test Results in InfluxDB
6.1. Abstract
This chapter illustrates how to run plug-in test cases and store test results into community’s InfluxDB. The framework is shown in Framework.
6.2. Store Storperf Test Results into Community’s InfluxDB
As shown in Framework, there are two ways to store Storperf test results into community’s InfluxDB:
- Yardstick executes Storperf test case (TC074), posting test job to Storperf container via ReST API. After the test job is completed, Yardstick reads test results via ReST API from Storperf and posts test data to the influxDB.
- Additionally, Storperf can run tests by itself and post the test result directly to the InfluxDB. The method for posting data directly to influxDB will be supported in the future.
Our plan is to support rest-api in D release so that other testing projects can call the rest-api to use yardstick dispatcher service to push data to yardstick’s influxdb database.
For now, influxdb only support line protocol, and the json protocol is deprecated.
Take ping test case for example, the raw_result is json format like this:
  "benchmark": {
      "timestamp": 1470315409.868095,
      "errors": "",
      "data": {
        "rtt": {
        "ares": 1.125
        }
      },
    "sequence": 1
    },
  "runner_id": 2625
}
With the help of “influxdb_line_protocol”, the json is transform to like below as a line string:
'ping,deploy_scenario=unknown,host=athena.demo,installer=unknown,pod_name=unknown,
  runner_id=2625,scenarios=Ping,target=ares.demo,task_id=77755f38-1f6a-4667-a7f3-
    301c99963656,version=unknown rtt.ares=1.125 1470315409868094976'
So, for data output of json format, you just need to transform json into line format and call influxdb api to post the data into the database. All this function has been implemented in Influxdb. If you need support on this, please contact Mingjiang.
curl -i -XPOST 'http://104.197.68.199:8086/write?db=yardstick' --
  data-binary 'ping,deploy_scenario=unknown,host=athena.demo,installer=unknown, ...'
Grafana will be used for visualizing the collected test data, which is shown in Visual. Grafana can be accessed by Login.
7. Grafana dashboard
7.1. Abstract
This chapter describes the Yardstick grafana dashboard. The Yardstick grafana dashboard can be found here: http://testresults.opnfv.org/grafana/
7.2. Public access
Yardstick provids a public account for accessing to the dashboard. The username and password are both set to ‘opnfv’.
7.3. Testcase dashboard
For each test case, there is a dedicated dashboard. Shown here is the dashboard of TC002.
For each test case dashboard. On the top left, we have a dashboard selection, you can switch to different test cases using this pull-down menu.
Underneath, we have a pod and scenario selection. All the pods and scenarios that have ever published test data to the InfluxDB will be shown here.
You can check multiple pods or scenarios.
For each test case, we have a short description and a link to detailed test case information in Yardstick user guide.
Underneath, it is the result presentation section. You can use the time period selection on the top right corner to zoom in or zoom out the chart.
7.4. Administration access
For a user with administration rights it is easy to update and save any dashboard configuration. Saved updates immediately take effect and become live. This may cause issues like:
- Changes and updates made to the live configuration in Grafana can compromise existing Grafana content in an unwanted, unpredicted or incompatible way. Grafana as such is not version controlled, there exists one single Grafana configuration per dashboard.
- There is a risk several people can disturb each other when doing updates to the same Grafana dashboard at the same time.
Any change made by administrator should be careful.
7.5. Add a dashboard into yardstick grafana
Due to security concern, users that using the public opnfv account are not able to edit the yardstick grafana directly.It takes a few more steps for a non-yardstick user to add a custom dashboard into yardstick grafana.
There are 6 steps to go.
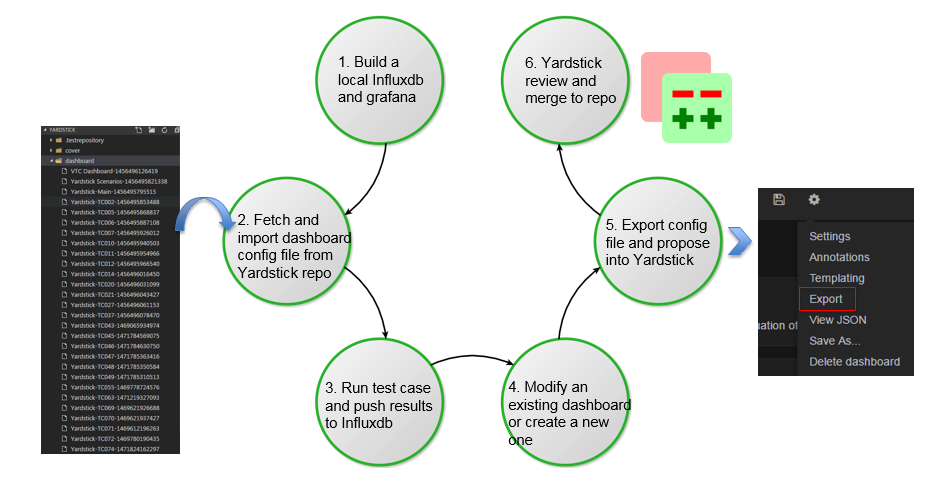
- You need to build a local influxdb and grafana, so you can do the work locally. You can refer to How to deploy InfluxDB and Grafana locally wiki page about how to do this.
- Once step one is done, you can fetch the existing grafana dashboard configuration file from the yardstick repository and import it to your local grafana. After import is done, you grafana dashboard will be ready to use just like the community’s dashboard.
- The third step is running some test cases to generate test results and publishing it to your local influxdb.
- Now you have some data to visualize in your dashboard. In the fourth step, it is time to create your own dashboard. You can either modify an existing dashboard or try to create a new one from scratch. If you choose to modify an existing dashboard then in the curtain menu of the existing dashboard do a “Save As...” into a new dashboard copy instance, and then continue doing all updates and saves within the dashboard copy.
- When finished with all Grafana configuration changes in this temporary dashboard then chose “export” of the updated dashboard copy into a JSON file and put it up for review in Gerrit, in file /yardstick/dashboard/Yardstick-TCxxx-yyyyyyyyyyyyy. For instance a typical default name of the file would be “Yardstick-TC001 Copy-1234567891234”.
- Once you finish your dashboard, the next step is exporting the configuration file and propose a patch into Yardstick. Yardstick team will review and merge it into Yardstick repository. After approved review Yardstick team will do an “import” of the JSON file and also a “save dashboard” as soon as possible to replace the old live dashboard configuration.
8. Yardstick Restful API
8.1. Abstract
Yardstick support restful API in danube.
8.2. Available API
8.2.1. /yardstick/env/action
Description: This API is used to do some work related to environment. For now, we support:
- Prepare yardstick environment(Including fetch openrc file, get external network and load images)
- Start a InfluxDB docker container and config yardstick output to InfluxDB.
- Start a Grafana docker container and config with the InfluxDB.
Which API to call will depend on the Parameters.
Method: POST
Prepare Yardstick Environment Example:
{
    'action': 'prepareYardstickEnv'
}
This is an asynchronous API. You need to call /yardstick/asynctask API to get the task result.
Start and Config InfluxDB docker container Example:
{
    'action': 'createInfluxDBContainer'
}
This is an asynchronous API. You need to call /yardstick/asynctask API to get the task result.
Start and Config Grafana docker container Example:
{
    'action': 'createGrafanaContainer'
}
This is an asynchronous API. You need to call /yardstick/asynctask API to get the task result.
8.2.2. /yardstick/asynctask
Description: This API is used to get the status of asynchronous task
Method: GET
Get the status of asynchronous task Example:
http://localhost:8888/yardstick/asynctask?task_id=3f3f5e03-972a-4847-a5f8-154f1b31db8c
The returned status will be 0(running), 1(finished) and 2(failed).
8.2.3. /yardstick/testcases
Description: This API is used to list all release test cases now in yardstick.
Method: GET
Get a list of release test cases Example:
http://localhost:8888/yardstick/testcases
8.2.4. /yardstick/testcases/release/action
Description: This API is used to run a yardstick release test case.
Method: POST
Run a release test case Example:
{
    'action': 'runTestCase',
    'args': {
        'opts': {},
        'testcase': 'tc002'
    }
}
This is an asynchronous API. You need to call /yardstick/results to get the result.
8.2.5. /yardstick/testcases/samples/action
Description: This API is used to run a yardstick sample test case.
Method: POST
Run a sample test case Example:
{
    'action': 'runTestCase',
    'args': {
        'opts': {},
        'testcase': 'ping'
    }
}
This is an asynchronous API. You need to call /yardstick/results to get the result.
8.2.6. /yardstick/testsuites/action
Description: This API is used to run a yardstick test suite.
Method: POST
Run a test suite Example:
{
    'action': 'runTestSuite',
    'args': {
        'opts': {},
        'testcase': 'smoke'
    }
}
This is an asynchronous API. You need to call /yardstick/results to get the result.
8.2.7. /yardstick/results
Description: This API is used to get the test results of certain task. If you call /yardstick/testcases/samples/action API, it will return a task id. You can use the returned task id to get the results by using this API.
Get test results of one task Example:
http://localhost:8888/yardstick/results?task_id=3f3f5e03-972a-4847-a5f8-154f1b31db8c
This API will return a list of test case result
9. Yardstick User Interface
This interface provides a user to view the test result in table format and also values pinned on to a graph.
9.1. Command
yardstick report generate <task-ID> <testcase-filename>
9.2. Description
1. When the command is triggered using the task-id and the testcase name provided the respective values are retrieved from the database (influxdb in this particular case).
2. The values are then formatted and then provided to the html template framed with complete html body using Django Framework.
- Then the whole template is written into a html file.
The graph is framed with Timestamp on x-axis and output values (differ from testcase to testcase) on y-axis with the help of “Highcharts”.
10. Virtual Traffic Classifier
10.1. Abstract
This chapter provides an overview of the virtual Traffic Classifier, a contribution to OPNFV Yardstick from the EU Project TNOVA. Additional documentation is available in TNOVAresults.
10.2. Overview
The virtual Traffic Classifier (VTC) VNF, comprises of a Virtual Network Function Component (VNFC). The VNFC contains both the Traffic Inspection module, and the Traffic forwarding module, needed to run the VNF. The exploitation of Deep Packet Inspection (DPI) methods for traffic classification is built around two basic assumptions:
- third parties unaffiliated with either source or recipient are able to
inspect each IP packet’s payload
- the classifier knows the relevant syntax of each application’s packet
payloads (protocol signatures, data patterns, etc.).
The proposed DPI based approach will only use an indicative, small number of the initial packets from each flow in order to identify the content and not inspect each packet.
In this respect it follows the Packet Based per Flow State (term:PBFS). This method uses a table to track each session based on the 5-tuples (src address, dest address, src port,dest port, transport protocol) that is maintained for each flow.
10.3. Concepts
- Traffic Inspection: The process of packet analysis and application
identification of network traffic that passes through the VTC.
- Traffic Forwarding: The process of packet forwarding from an incoming
network interface to a pre-defined outgoing network interface.
- Traffic Rule Application: The process of packet tagging, based on a
predefined set of rules. Packet tagging may include e.g. Type of Service (ToS) field modification.
10.4. Architecture
The Traffic Inspection module is the most computationally intensive component of the VNF. It implements filtering and packet matching algorithms in order to support the enhanced traffic forwarding capability of the VNF. The component supports a flow table (exploiting hashing algorithms for fast indexing of flows) and an inspection engine for traffic classification.
The implementation used for these experiments exploits the nDPI library. The packet capturing mechanism is implemented using libpcap. When the DPI engine identifies a new flow, the flow register is updated with the appropriate information and transmitted across the Traffic Forwarding module, which then applies any required policy updates.
The Traffic Forwarding moudle is responsible for routing and packet forwarding. It accepts incoming network traffic, consults the flow table for classification information for each incoming flow and then applies pre-defined policies marking e.g. ToS/Differentiated Services Code Point (DSCP) multimedia traffic for Quality of Service (QoS) enablement on the forwarded traffic. It is assumed that the traffic is forwarded using the default policy until it is identified and new policies are enforced.
The expected response delay is considered to be negligible, as only a small number of packets are required to identify each flow.
10.5. Graphical Overview
+----------------------------+
|                            |
| Virtual Traffic Classifier |
|                            |
|     Analysing/Forwarding   |
|        ------------>       |
|     ethA          ethB     |
|                            |
+----------------------------+
     |              ^
     |              |
     v              |
+----------------------------+
|                            |
|     Virtual Switch         |
|                            |
+----------------------------+
10.6. Install
run the vTC/build.sh with root privileges
10.7. Run
sudo ./pfbridge -a eth1 -b eth2
Note
Virtual Traffic Classifier is not support in OPNFV Danube release.
10.8. Development Environment
Ubuntu 14.04 Ubuntu 16.04
11. Network Services Benchmarking (NSB)
11.1. Abstract
This chapter provides an overview of the NSB, a contribution to OPNFV Yardstick from Intel.
11.2. Overview
GOAL: Extend Yardstick to perform real world VNFs and NFVi Characterization and benchmarking with repeatable and deterministic methods.
The Network Service Benchmarking (NSB) extends the yardstick framework to do VNF characterization and benchmarking in three different execution environments - bare metal i.e. native Linux environment, standalone virtual environment and managed virtualized environment (e.g. Open stack etc.). It also brings in the capability to interact with external traffic generators both hardware & software based for triggering and validating the traffic according to user defined profiles.
NSB extension includes:
Generic data models of Network Services, based on ETSI spec (ETSI GS NFV-TST 001) .. _ETSI GS NFV-TST 001: http://www.etsi.org/deliver/etsi_gs/NFV-TST/001_099/001/01.01.01_60/gs_nfv-tst001v010101p.pdf
New Standalone context for VNF testing like SRIOV, OVS, OVS-DPDK etc
Generic VNF configuration models and metrics implemented with Python classes
Traffic generator features and traffic profiles
- L1-L3 state-less traffic profiles
- L4-L7 state-full traffic profiles
- Tunneling protocol / network overlay support
Test case samples
- Ping
- Trex
- vPE,vCGNAT, vFirewall etc - ipv4 throughput, latency etc
Traffic generators like Trex, ab/nginx, ixia, iperf etc
KPIs for a given use case:
System agent support for collecting NFVi KPI. This includes:
- CPU statistic
- Memory BW
- OVS-DPDK Stats
Network KPIs, e.g., inpackets, outpackets, thoughput, latency etc
VNF KPIs, e.g., packet_in, packet_drop, packet_fwd etc
11.3. Architecture
The Network Service (NS) defines a set of Virtual Network Functions (VNF) connected together using NFV infrastructure.
The Yardstick NSB extension can support multiple VNFs created by different vendors including traffic generators. Every VNF being tested has its own data model. The Network service defines a VNF modelling on base of performed network functionality. The part of the data model is a set of the configuration parameters, number of connection points used and flavor including core and memory amount.
The ETSI defines a Network Service as a set of configurable VNFs working in some NFV Infrastructure connecting each other using Virtual Links available through Connection Points. The ETSI MANO specification defines a set of management entities called Network Service Descriptors (NSD) and VNF Descriptors (VNFD) that define real Network Service. The picture below makes an example how the real Network Operator use-case can map into ETSI Network service definition
Network Service framework performs the necessary test steps. It may involve
- Interacting with traffic generator and providing the inputs on traffic type / packet structure to generate the required traffic as per the test case. Traffic profiles will be used for this.
- Executing the commands required for the test procedure and analyses the command output for confirming whether the command got executed correctly or not. E.g. As per the test case, run the traffic for the given time period / wait for the necessary time delay
- Verify the test result.
- Validate the traffic flow from SUT
- Fetch the table / data from SUT and verify the value as per the test case
- Upload the logs from SUT onto the Test Harness server
- Read the KPI’s provided by particular VNF
11.3.1. Components of Network Service
- Models for Network Service benchmarking: The Network Service benchmarking requires the proper modelling approach. The NSB provides models using Python files and defining of NSDs and VNFDs.
The benchmark control application being a part of OPNFV yardstick can call that python models to instantiate and configure the VNFs. Depending on infrastructure type (bare-metal or fully virtualized) that calls could be made directly or using MANO system.
- Traffic generators in NSB: Any benchmark application requires a set of traffic generator and traffic profiles defining the method in which traffic is generated.
The Network Service benchmarking model extends the Network Service definition with a set of Traffic Generators (TG) that are treated same way as other VNFs being a part of benchmarked network service. Same as other VNFs the traffic generator are instantiated and terminated.
Every traffic generator has own configuration defined as a traffic profile and a set of KPIs supported. The python models for TG is extended by specific calls to listen and generate traffic.
- The stateless TREX traffic generator: The main traffic generator used as Network Service stimulus is open source TREX tool.
The TREX tool can generate any kind of stateless traffic.
+--------+      +-------+      +--------+
|        |      |       |      |        |
|  Trex  | ---> |  VNF  | ---> |  Trex  |
|        |      |       |      |        |
+--------+      +-------+      +--------+
Supported testcases scenarios:
Correlated UDP traffic using TREX traffic generator and replay VNF.
- using different IMIX configuration like pure voice, pure video traffic etc
- using different number IP flows like 1 flow, 1K, 16K, 64K, 256K, 1M flows
- Using different number of rules configured like 1 rule, 1K, 10K rules
For UDP correlated traffic following Key Performance Indicators are collected for every combination of test case parameters:
- RFC2544 throughput for various loss rate defined (1% is a default)
11.4. Graphical Overview
NSB Testing with yardstick framework facilitate performance testing of various VNFs provided.
+-----------+
|           |                                                     +-----------+
|   vPE     |                                                   ->|TGen Port 0|
| TestCase  |                                                   | +-----------+
|           |                                                   |
+-----------+     +------------------+            +-------+     |
                  |                  | -- API --> |  VNF  | <--->
+-----------+     |     Yardstick    |            +-------+     |
| Test Case | --> |    NSB Testing   |                          |
+-----------+     |                  |                          |
      |           |                  |                          |
      |           +------------------+                          |
+-----------+                                                   | +-----------+
|   Traffic |                                                   ->|TGen Port 1|
|  patterns |                                                     +-----------+
+-----------+

            Figure 1: Network Service - 2 server configuration
11.4.1. VNFs supported for chracterization:
CGNAPT - Carrier Grade Network Address and port Translation
vFW - Virtual Firewall
vACL - Access Control List
vPE - Provider Edge Router
- Prox - Packet pROcessing eXecution engine:
VNF can act as Drop, Basic Forwarding (no touch), L2 Forwarding (change MAC), GRE encap/decap, Load balance based on packet fields, Symmetric load balancing, QinQ encap/decap IPv4/IPv6, ARP, QoS, Routing, Unmpls, Policing, ACL
UDP_Replay
12. Yardstick - NSB Testing -Installation
12.1. Abstract
The Network Service Benchmarking (NSB) extends the yardstick framework to do VNF characterization and benchmarking in three different execution environments viz., bare metal i.e. native Linux environment, standalone virtual environment and managed virtualized environment (e.g. Open stack etc.). It also brings in the capability to interact with external traffic generators both hardware & software based for triggering and validating the traffic according to user defined profiles.
The steps needed to run Yardstick with NSB testing are:
- Install Yardstick (NSB Testing).
- Setup pod.yaml describing Test topology
- Create the test configuration yaml file.
- Run the test case.
12.2. Prerequisites
Refer chapter Yardstick Instalaltion for more information on yardstick prerequisites
Several prerequisites are needed for Yardstick(VNF testing):
- Python Modules: pyzmq, pika.
- flex
- bison
- build-essential
- automake
- libtool
- librabbitmq-dev
- rabbitmq-server
- collectd
- intel-cmt-cat
12.3. Install Yardstick (NSB Testing)
12.4. Using Docker
Refer chapter Yardstick Installation for more on docker Install Yardstick using Docker (**recommended)**
12.5. Install directly in Ubuntu
Alternatively you can install Yardstick framework directly in Ubuntu or in an Ubuntu Docker image. No matter which way you choose to install Yardstick, the following installation steps are identical.
If you choose to use the Ubuntu Docker image, you can pull the Ubuntu Docker image from Docker hub:
docker pull ubuntu:16.04
12.5.1. Install Yardstick
Prerequisite preparation:
apt-get update && apt-get install -y git python-setuptools python-pip
easy_install -U setuptools==30.0.0
pip install appdirs==1.4.0
pip install virtualenv
Create a virtual environment:
virtualenv ~/yardstick_venv
export YARDSTICK_VENV=~/yardstick_venv
source ~/yardstick_venv/bin/activate
Download the source code and install Yardstick from it:
git clone https://gerrit.opnfv.org/gerrit/yardstick
export YARDSTICK_REPO_DIR=~/yardstick
cd yardstick
./install.sh
After Yardstick is installed, executing the “nsb_setup.sh” script to setup NSB testing:
./nsb_setup.sh
It will also automatically download all the packages needed for NSB Testing setup.
12.6. System Topology:
+----------+              +----------+
|          |              |          |
|          | (0)----->(0) |          |
|    TG1   |              |    DUT   |
|          |              |          |
|          | (1)<-----(1) |          |
+----------+              +----------+
trafficgen_1                   vnf
12.7. Environment parameters and credentials
12.7.1. Environment variables
Before running Yardstick (NSB Testing) it is necessary to export traffic generator libraries.:
source ~/.bash_profile
12.7.2. Config yardstick conf
cp ./etc/yardstick/yardstick.conf.sample /etc/yardstick/yardstick.conf
vi /etc/yardstick/yardstick.conf
Add trex_path, trex_client_lib and bin_path in ‘nsb’ section.
[DEFAULT]
debug = True
dispatcher = file, influxdb

[dispatcher_influxdb]
timeout = 5
target = http://{YOUR_IP_HERE}:8086
db_name = yardstick
username = root
password = root

[nsb]
trex_path=/opt/nsb_bin/trex/scripts
bin_path=/opt/nsb_bin
trex_client_lib=/opt/nsb_bin/trex_client/stl
12.8. Network Service Benchmarking - Bare-Metal
12.8.1. Config pod.yaml describing Topology
12.8.2. 2-Node setup:
12.8.4. Enable yardstick virtual environment
Before executing yardstick test cases, make sure to activate yardstick python virtual environment if runnin on ubuntu without docker:
source /opt/nsb_bin/yardstick_venv/bin/activate
On docker, virtual env is in main path.
12.9. Run Yardstick - Network Service Testcases
12.9.1. NS testing - using NSBperf CLI
 PYTHONPATH: ". ~/.bash_profile"
 cd <yardstick_repo>/yardstick/cmd

Execute command: ./NSPerf.py -h
     ./NSBperf.py --vnf <selected vnf> --test <rfc test>
     eg: ./NSBperf.py --vnf vpe --test tc_baremetal_rfc2544_ipv4_1flow_64B.yaml
12.9.2. NS testing - using yardstick CLI
- ::
- PYTHONPATH: ”. ~/.bash_profile”
- Go to test case forlder type we want to execute.
- e.g. <yardstick repo>/samples/vnf_samples/nsut/<vnf>/ run: yardstick –debug task start <test_case.yaml>
12.10. Network Service Benchmarking - Standalone Virtualization
12.11. SRIOV:
12.11.1. Pre-requisites
- On Host:
Create a bridge for VM to connect to external network brctl addbr br-int brctl addif br-int <interface_name> #This interface is connected to internet
Build guest image for VNF to run. Most of the sample test cases in Yardstick are using a guest image called
yardstick-imagewhich deviates from an Ubuntu Cloud Server image Yardstick has a tool for building this custom image with samplevnf. It is necessary to havesudorights to use this tool.Also you may need to install several additional packages to use this tool, by follwing the commands below:
sudo apt-get update && sudo apt-get install -y qemu-utils kpartx
This image can be built using the following command in the directory where Yardstick is installed:
export YARD_IMG_ARCH='amd64'
sudo echo "Defaults env_keep += \'YARD_IMG_ARCH\'" >> /etc/sudoers
sudo tools/yardstick-img-dpdk-modify tools/ubuntu-server-cloudimg-samplevnf-modify.sh
for more details refer chapter
04-installation`
Note: VM should be build with static IP and should be accessiable from yardstick host.
12.11.2. Config pod.yaml describing Topology
12.11.3. 2-Node setup:
12.11.4. 3-Node setup - Correlated Traffic
                             +--------------------+
                             |                    |
                             |                    |
                             |        DUT         |
                             |       (VNF)        |
                             |                    |
                             +--------------------+
                             | VF NIC |  | VF NIC |
                             +--------+  +--------+
                                  ^          ^
                                  |          |
                                  |          |
                             +--------+  +--------+
                             | PF NIC -  - PF NIC -
+----------+               +-------------------------+          +------------+
|          |               |       ^          ^      |          |            |
|          |               |       |          |      |          |            |
|          | (0)<----->(0) | ------           |      |          |    TG2     |
|    TG1   |               |           SUT    |      |          |(UDP Replay)|
|          |               |                  |      |          |            |
|          | (n)<----->(n) |                  ------ |(n)<-->(n)|            |
+----------+               +-------------------------+          +------------+
trafficgen_1                          host                       trafficgen_2
Before executing Yardstick test cases, make sure that pod.yaml reflects the topology and update all the required fields.
cp /etc/yardstick/nodes/pod.yaml.nsb.sriov.sample /etc/yardstick/nodes/pod.yaml
Config pod.yaml
nodes:
-
    name: trafficgen_1
    role: TrafficGen
    ip: 1.1.1.1
    user: root
    password: r00t
    interfaces:
        xe0:  # logical name from topology.yaml and vnfd.yaml
            vpci:      "0000:07:00.0"
            driver:    i40e # default kernel driver
            dpdk_port_num: 0
            local_ip: "152.16.100.20"
            netmask:   "255.255.255.0"
            local_mac: "00:00:00:00:00:01"
        xe1:  # logical name from topology.yaml and vnfd.yaml
            vpci:      "0000:07:00.1"
            driver:    i40e # default kernel driver
            dpdk_port_num: 1
            local_ip: "152.16.40.20"
            netmask:   "255.255.255.0"
            local_mac: "00:00.00:00:00:02"
name: sriov role: Sriov ip: 2.2.2.2 user: root auth_type: password password: password vf_macs:
- “00:00:00:00:00:03”
- “00:00:00:00:00:04”
- phy_ports: # Physical ports to configure sriov
- “0000:06:00.0”
- “0000:06:00.1”
phy_driver: i40e # kernel driver images: “/var/lib/libvirt/images/ubuntu1.img”
name: vnf role: vnf ip: 1.1.1.2 user: root password: r00t host: 2.2.2.2 #BM - host == ip, virtualized env - Host - compute node interfaces:
- xe0: # logical name from topology.yaml and vnfd.yaml
vpci: “0000:00:07.0” driver: i40evf # default kernel driver dpdk_port_num: 0 local_ip: “152.16.100.10” netmask: “255.255.255.0” local_mac: “00:00:00:00:00:03”
- xe1: # logical name from topology.yaml and vnfd.yaml
vpci: “0000:00:08.0” driver: i40evf # default kernel driver dpdk_port_num: 1 local_ip: “152.16.40.10” netmask: “255.255.255.0” local_mac: “00:00:00:00:00:04”
routing_table: - network: “152.16.100.10”
netmask: “255.255.255.0” gateway: “152.16.100.20” if: “xe0”
- network: “152.16.40.10” netmask: “255.255.255.0” gateway: “152.16.40.20” if: “xe1”
nd_route_tbl: - network: “0064:ff9b:0:0:0:0:9810:6414”
netmask: “112” gateway: “0064:ff9b:0:0:0:0:9810:6414” if: “xe0”
- network: “0064:ff9b:0:0:0:0:9810:2814” netmask: “112” gateway: “0064:ff9b:0:0:0:0:9810:2814” if: “xe1”
12.11.5. Enable yardstick virtual environment
Before executing yardstick test cases, make sure to activate yardstick python virtual environment if runnin on ubuntu without docker:
source /opt/nsb_bin/yardstick_venv/bin/activate
On docker, virtual env is in main path.
12.12. Run Yardstick - Network Service Testcases
12.12.1. NS testing - using NSBperf CLI
 PYTHONPATH: ". ~/.bash_profile"
 cd <yardstick_repo>/yardstick/cmd

Execute command: ./NSPerf.py -h
     ./NSBperf.py --vnf <selected vnf> --test <rfc test>
     eg: ./NSBperf.py --vnf vfw --test tc_sriov_rfc2544_ipv4_1flow_64B.yaml
12.12.2. NS testing - using yardstick CLI
- ::
- PYTHONPATH: ”. ~/.bash_profile”
- Go to test case forlder type we want to execute.
- e.g. <yardstick repo>/samples/vnf_samples/nsut/<vnf>/ run: yardstick –debug task start <test_case.yaml>
12.13. OVS-DPDK:
12.13.1. Pre-requisites
- On Host:
Create a bridge for VM to connect to external network brctl addbr br-int brctl addif br-int <interface_name> #This interface is connected to internet
Build guest image for VNF to run. Most of the sample test cases in Yardstick are using a guest image called
yardstick-imagewhich deviates from an Ubuntu Cloud Server image Yardstick has a tool for building this custom image with samplevnf. It is necessary to havesudorights to use this tool.Also you may need to install several additional packages to use this tool, by follwing the commands below:
sudo apt-get update && sudo apt-get install -y qemu-utils kpartx
This image can be built using the following command in the directory where Yardstick is installed:
export YARD_IMG_ARCH='amd64'
sudo echo "Defaults env_keep += \'YARD_IMG_ARCH\'" >> /etc/sudoers
sudo tools/yardstick-img-dpdk-modify tools/ubuntu-server-cloudimg-samplevnf-modify.sh
for more details refer chapter
04-installation`
Note: VM should be build with static IP and should be accessiable from yardstick host.
- OVS & DPDK version. - OVS 2.7 and DPDK 16.11.1 above version is supported
- Setup OVS/DPDK on host. Please refer below link on how to setup .. _ovs-dpdk: http://docs.openvswitch.org/en/latest/intro/install/dpdk/
12.13.2. Config pod.yaml describing Topology
12.13.3. 2-Node setup:
12.13.4. 3-Node setup - Correlated Traffic
                             +--------------------+
                             |                    |
                             |                    |
                             |        DUT         |
                             |       (VNF)        |
                             |                    |
                             +--------------------+
                             | virtio |  | virtio |
                             +--------+  +--------+
                                  ^          ^
                                  |          |
                                  |          |
                             +--------+  +--------+
                             | vHOST0 |  | vHOST1 |
+----------+               +-------------------------+          +------------+
|          |               |       ^          ^      |          |            |
|          |               |       |          |      |          |            |
|          | (0)<----->(0) | ------           |      |          |    TG2     |
|    TG1   |               |          SUT     |      |          |(UDP Replay)|
|          |               |      (ovs-dpdk)  |      |          |            |
|          | (n)<----->(n) |                  ------ |(n)<-->(n)|            |
+----------+               +-------------------------+          +------------+
trafficgen_1                          host                       trafficgen_2
Before executing Yardstick test cases, make sure that pod.yaml reflects the topology and update all the required fields.:
cp /etc/yardstick/nodes/pod.yaml.nsb.ovs.sample /etc/yardstick/nodes/pod.yaml
Config pod.yaml
nodes:
-
    name: trafficgen_1
    role: TrafficGen
    ip: 1.1.1.1
    user: root
    password: r00t
    interfaces:
        xe0:  # logical name from topology.yaml and vnfd.yaml
            vpci:      "0000:07:00.0"
            driver:    i40e # default kernel driver
            dpdk_port_num: 0
            local_ip: "152.16.100.20"
            netmask:   "255.255.255.0"
            local_mac: "00:00:00:00:00:01"
        xe1:  # logical name from topology.yaml and vnfd.yaml
            vpci:      "0000:07:00.1"
            driver:    i40e # default kernel driver
            dpdk_port_num: 1
            local_ip: "152.16.40.20"
            netmask:   "255.255.255.0"
            local_mac: "00:00.00:00:00:02"
name: ovs role: Ovsdpdk ip: 2.2.2.2 user: root auth_type: password password: <password> vpath: “/usr/local/” vports:
- dpdkvhostuser0
- dpdkvhostuser1
- vports_mac:
- “00:00:00:00:00:03”
- “00:00:00:00:00:04”
- phy_ports: # Physical ports to configure ovs
- “0000:06:00.0”
- “0000:06:00.1”
- flow:
- ovs-ofctl add-flow br0 in_port=1,action=output:3
- ovs-ofctl add-flow br0 in_port=3,action=output:1
- ovs-ofctl add-flow br0 in_port=4,action=output:2
- ovs-ofctl add-flow br0 in_port=2,action=output:4
phy_driver: i40e # kernel driver images: “/var/lib/libvirt/images/ubuntu1.img”
name: vnf role: vnf ip: 1.1.1.2 user: root password: r00t host: 2.2.2.2 #BM - host == ip, virtualized env - Host - compute node interfaces:
- xe0: # logical name from topology.yaml and vnfd.yaml
vpci: “0000:00:04.0” driver: virtio-pci # default kernel driver dpdk_port_num: 0 local_ip: “152.16.100.10” netmask: “255.255.255.0” local_mac: “00:00:00:00:00:03”
- xe1: # logical name from topology.yaml and vnfd.yaml
vpci: “0000:00:05.0” driver: virtio-pci # default kernel driver dpdk_port_num: 1 local_ip: “152.16.40.10” netmask: “255.255.255.0” local_mac: “00:00:00:00:00:04”
routing_table: - network: “152.16.100.10”
netmask: “255.255.255.0” gateway: “152.16.100.20” if: “xe0”
- network: “152.16.40.10” netmask: “255.255.255.0” gateway: “152.16.40.20” if: “xe1”
nd_route_tbl: - network: “0064:ff9b:0:0:0:0:9810:6414”
netmask: “112” gateway: “0064:ff9b:0:0:0:0:9810:6414” if: “xe0”
- network: “0064:ff9b:0:0:0:0:9810:2814” netmask: “112” gateway: “0064:ff9b:0:0:0:0:9810:2814” if: “xe1”
12.13.5. Enable yardstick virtual environment
Before executing yardstick test cases, make sure to activate yardstick python virtual environment if runnin on ubuntu without docker:
source /opt/nsb_bin/yardstick_venv/bin/activate
On docker, virtual env is in main path.
12.14. Run Yardstick - Network Service Testcases
12.14.1. NS testing - using NSBperf CLI
 PYTHONPATH: ". ~/.bash_profile"
 cd <yardstick_repo>/yardstick/cmd

Execute command: ./NSPerf.py -h
     ./NSBperf.py --vnf <selected vnf> --test <rfc test>
     eg: ./NSBperf.py --vnf vfw --test tc_ovs_rfc2544_ipv4_1flow_64B.yaml
12.14.2. NS testing - using yardstick CLI
- ::
- PYTHONPATH: ”. ~/.bash_profile”
- Go to test case forlder type we want to execute.
- e.g. <yardstick repo>/samples/vnf_samples/nsut/<vnf>/ run: yardstick –debug task start <test_case.yaml>
13. Yardstick Test Cases
13.1. Abstract
This chapter lists available Yardstick test cases. Yardstick test cases are divided in two main categories:
- Generic NFVI Test Cases - Test Cases developed to realize the methodology
described in Methodology
- OPNFV Feature Test Cases - Test Cases developed to verify one or more
aspect of a feature delivered by an OPNFV Project, including the test cases developed for the VTC.
13.2. Generic NFVI Test Case Descriptions
13.2.1. Yardstick Test Case Description TC001
| Network Performance | |
| test case id | OPNFV_YARDSTICK_TC001_NETWORK PERFORMANCE |
| metric | Number of flows and throughput |
| test purpose | The purpose of TC001 is to evaluate the IaaS network performance with regards to flows and throughput, such as if and how different amounts of flows matter for the throughput between hosts on different compute blades. Typically e.g. the performance of a vSwitch depends on the number of flows running through it. Also performance of other equipment or entities can depend on the number of flows or the packet sizes used. The purpose is also to be able to spot the trends. Test results, graphs and similar shall be stored for comparison reasons and product evolution understanding between different OPNFV versions and/or configurations. |
| test tool | pktgen Linux packet generator is a tool to generate packets at very high speed in the kernel. pktgen is mainly used to drive and LAN equipment test network. pktgen supports multi threading. To generate random MAC address, IP address, port number UDP packets, pktgen uses multiple CPU processors in the different PCI bus (PCI, PCIe bus) with Gigabit Ethernet tested (pktgen performance depends on the CPU processing speed, memory delay, PCI bus speed hardware parameters), Transmit data rate can be even larger than 10GBit/s. Visible can satisfy most card test requirements. (Pktgen is not always part of a Linux distribution, hence it needs to be installed. It is part of the Yardstick Docker image. As an example see the /yardstick/tools/ directory for how to generate a Linux image with pktgen included.) |
| test description | This test case uses Pktgen to generate packet flow between two hosts for simulating network workloads on the SUT. |
| traffic profile | An IP table is setup on server to monitor for received packets. |
| configuration | file: opnfv_yardstick_tc001.yaml Packet size is set to 60 bytes. Number of ports: 10, 50, 100, 500 and 1000, where each runs for 20 seconds. The whole sequence is run twice The client and server are distributed on different hardware. For SLA max_ppm is set to 1000. The amount of configured ports map to between 110 up to 1001000 flows, respectively. |
| applicability | Test can be configured with different:
Default values exist. SLA (optional): max_ppm: The number of packets per million packets sent that are acceptable to loose, not received. |
| usability | This test case is used for generating high network throughput to simulate certain workloads on the SUT. Hence it should work with other test cases. |
| references |
ETSI-NFV-TST001 |
| pre-test conditions | The test case image needs to be installed into Glance with pktgen included in it. No POD specific requirements have been identified. |
| test sequence | description and expected result |
| step 1 | Two host VMs are booted, as server and client. |
| step 2 | Yardstick is connected with the server VM by using ssh. ‘pktgen_benchmark’ bash script is copyied from Jump Host to the server VM via the ssh tunnel. |
| step 3 | An IP table is setup on server to monitor for received packets. |
| step 4 | pktgen is invoked to generate packet flow between two server and client for simulating network workloads on the SUT. Results are processed and checked against the SLA. Logs are produced and stored. Result: Logs are stored. |
| step 5 | Two host VMs are deleted. |
| test verdict | Fails only if SLA is not passed, or if there is a test case execution problem. |
13.2.2. Yardstick Test Case Description TC002
| Network Latency | |
| test case id | OPNFV_YARDSTICK_TC002_NETWORK LATENCY |
| metric | RTT (Round Trip Time) |
| test purpose | The purpose of TC002 is to do a basic verification that network latency is within acceptable boundaries when packets travel between hosts located on same or different compute blades. The purpose is also to be able to spot the trends. Test results, graphs and similar shall be stored for comparison reasons and product evolution understanding between different OPNFV versions and/or configurations. |
| test tool | ping Ping is a computer network administration software utility used to test the reachability of a host on an Internet Protocol (IP) network. It measures the round-trip time for packet sent from the originating host to a destination computer that are echoed back to the source. Ping is normally part of any Linux distribution, hence it doesn’t need to be installed. It is also part of the Yardstick Docker image. (For example also a Cirros image can be downloaded from cirros-image, it includes ping) |
| test topology | Ping packets (ICMP protocol’s mandatory ECHO_REQUEST datagram) are sent from host VM to target VM(s) to elicit ICMP ECHO_RESPONSE. For one host VM there can be multiple target VMs. Host VM and target VM(s) can be on same or different compute blades. |
| configuration | file: opnfv_yardstick_tc002.yaml Packet size 100 bytes. Test duration 60 seconds. One ping each 10 seconds. Test is iterated two times. SLA RTT is set to maximum 10 ms. |
| applicability | This test case can be configured with different:
Default values exist. SLA is optional. The SLA in this test case serves as an example. Considerably lower RTT is expected, and also normal to achieve in balanced L2 environments. However, to cover most configurations, both bare metal and fully virtualized ones, this value should be possible to achieve and acceptable for black box testing. Many real time applications start to suffer badly if the RTT time is higher than this. Some may suffer bad also close to this RTT, while others may not suffer at all. It is a compromise that may have to be tuned for different configuration purposes. |
| usability | This test case is one of Yardstick’s generic test. Thus it is runnable on most of the scenarios. |
| references |
ETSI-NFV-TST001 |
| pre-test conditions | The test case image (cirros-image) needs to be installed into Glance with ping included in it. No POD specific requirements have been identified. |
| test sequence | description and expected result |
| step 1 | Two host VMs are booted, as server and client. |
| step 2 | Yardstick is connected with the server VM by using ssh. ‘ping_benchmark’ bash script is copyied from Jump Host to the server VM via the ssh tunnel. |
| step 3 | Ping is invoked. Ping packets are sent from server VM to client VM. RTT results are calculated and checked against the SLA. Logs are produced and stored. Result: Logs are stored. |
| step 4 | Two host VMs are deleted. |
| test verdict | Test should not PASS if any RTT is above the optional SLA value, or if there is a test case execution problem. |
13.2.3. Yardstick Test Case Description TC004
| Cache Utilization | |
| test case id | OPNFV_YARDSTICK_TC004_CACHE Utilization |
| metric | cache hit, cache miss, hit/miss ratio, buffer size and page cache size |
| test purpose | The purpose of TC004 is to evaluate the IaaS compute capability with regards to cache utilization.This test case should be run in parallel with other Yardstick test cases and not run as a stand-alone test case. This test case measures cache usage statistics, including cache hit, cache miss, hit ratio, buffer cache size and page cache size, with some wokloads runing on the infrastructure. Both average and maximun values are collected. The purpose is also to be able to spot the trends. Test results, graphs and similar shall be stored for comparison reasons and product evolution understanding between different OPNFV versions and/or configurations. |
| test tool | cachestat cachestat is a tool using Linux ftrace capabilities for showing Linux page cache hit/miss statistics. (cachestat is not always part of a Linux distribution, hence it needs to be installed. As an example see the /yardstick/tools/ directory for how to generate a Linux image with cachestat included.) |
| test description | cachestat test is invoked in a host VM on a compute blade, cachestat test requires some other test cases running in the host to stimulate workload. |
| configuration | File: cachestat.yaml (in the ‘samples’ directory) Interval is set 1. Test repeat, pausing every 1 seconds in-between. Test durarion is set to 60 seconds. SLA is not available in this test case. |
| applicability | Test can be configured with different:
Default values exist. |
| usability | This test case is one of Yardstick’s generic test. Thus it is runnable on most of the scenarios. |
| references |
ETSI-NFV-TST001 |
| pre-test conditions | The test case image needs to be installed into Glance with cachestat included in the image. No POD specific requirements have been identified. |
| test sequence | description and expected result |
| step 1 | A host VM with cachestat installed is booted. |
| step 2 | Yardstick is connected with the host VM by using ssh. ‘cache_stat’ bash script is copyied from Jump Host to the server VM via the ssh tunnel. |
| step 3 | ‘cache_stat’ script is invoked. Raw cache usage statistics are collected and filtrated. Average and maximum values are calculated and recorded. Logs are produced and stored. Result: Logs are stored. |
| step 4 | The host VM is deleted. |
| test verdict | None. Cache utilization results are collected and stored. |
13.2.4. Yardstick Test Case Description TC005
| Storage Performance | |
| test case id | OPNFV_YARDSTICK_TC005_STORAGE PERFORMANCE |
| metric | IOPS (Average IOs performed per second), Throughput (Average disk read/write bandwidth rate), Latency (Average disk read/write latency) |
| test purpose | The purpose of TC005 is to evaluate the IaaS storage performance with regards to IOPS, throughput and latency. The purpose is also to be able to spot the trends. Test results, graphs and similar shall be stored for comparison reasons and product evolution understanding between different OPNFV versions and/or configurations. |
| test tool | fio fio is an I/O tool meant to be used both for benchmark and stress/hardware verification. It has support for 19 different types of I/O engines (sync, mmap, libaio, posixaio, SG v3, splice, null, network, syslet, guasi, solarisaio, and more), I/O priorities (for newer Linux kernels), rate I/O, forked or threaded jobs, and much more. (fio is not always part of a Linux distribution, hence it needs to be installed. As an example see the /yardstick/tools/ directory for how to generate a Linux image with fio included.) |
| test description | fio test is invoked in a host VM on a compute blade, a job file as well as parameters are passed to fio and fio will start doing what the job file tells it to do. |
| configuration | file: opnfv_yardstick_tc005.yaml IO types is set to read, write, randwrite, randread, rw. IO block size is set to 4KB, 64KB, 1024KB. fio is run for each IO type and IO block size scheme, each iteration runs for 30 seconds (10 for ramp time, 20 for runtime). For SLA, minimum read/write iops is set to 100, minimum read/write throughput is set to 400 KB/s, and maximum read/write latency is set to 20000 usec. |
| applicability | This test case can be configured with different:
Default values exist. SLA is optional. The SLA in this test case serves as an example. Considerably higher throughput and lower latency are expected. However, to cover most configurations, both baremetal and fully virtualized ones, this value should be possible to achieve and acceptable for black box testing. Many heavy IO applications start to suffer badly if the read/write bandwidths are lower than this. |
| usability | This test case is one of Yardstick’s generic test. Thus it is runnable on most of the scenarios. |
| references |
ETSI-NFV-TST001 |
| pre-test conditions | The test case image needs to be installed into Glance with fio included in it. No POD specific requirements have been identified. |
| test sequence | description and expected result |
| step 1 | A host VM with fio installed is booted. |
| step 2 | Yardstick is connected with the host VM by using ssh. ‘fio_benchmark’ bash script is copyied from Jump Host to the host VM via the ssh tunnel. |
| step 3 | ‘fio_benchmark’ script is invoked. Simulated IO operations are started. IOPS, disk read/write bandwidth and latency are recorded and checked against the SLA. Logs are produced and stored. Result: Logs are stored. |
| step 4 | The host VM is deleted. |
| test verdict | Fails only if SLA is not passed, or if there is a test case execution problem. |
13.2.5. Yardstick Test Case Description TC008
| Packet Loss Extended Test | |
| test case id | OPNFV_YARDSTICK_TC008_NW PERF, Packet loss Extended Test |
| metric | Number of flows, packet size and throughput |
| test purpose | To evaluate the IaaS network performance with regards to flows and throughput, such as if and how different amounts of packet sizes and flows matter for the throughput between VMs on different compute blades. Typically e.g. the performance of a vSwitch depends on the number of flows running through it. Also performance of other equipment or entities can depend on the number of flows or the packet sizes used. The purpose is also to be able to spot trends. Test results, graphs ans similar shall be stored for comparison reasons and product evolution understanding between different OPNFV versions and/or configurations. |
| configuration | file: opnfv_yardstick_tc008.yaml Packet size: 64, 128, 256, 512, 1024, 1280 and 1518 bytes. Number of ports: 1, 10, 50, 100, 500 and 1000. The amount of configured ports map from 2 up to 1001000 flows, respectively. Each packet_size/port_amount combination is run ten times, for 20 seconds each. Then the next packet_size/port_amount combination is run, and so on. The client and server are distributed on different HW. For SLA max_ppm is set to 1000. |
| test tool | pktgen (Pktgen is not always part of a Linux distribution, hence it needs to be installed. It is part of the Yardstick Docker image. As an example see the /yardstick/tools/ directory for how to generate a Linux image with pktgen included.) |
| references |
ETSI-NFV-TST001 |
| applicability | Test can be configured with different packet sizes, amount of flows and test duration. Default values exist. SLA (optional): max_ppm: The number of packets per million packets sent that are acceptable to loose, not received. |
| pre-test conditions | The test case image needs to be installed into Glance with pktgen included in it. No POD specific requirements have been identified. |
| test sequence | description and expected result |
| step 1 | The hosts are installed, as server and client. pktgen is invoked and logs are produced and stored. Result: Logs are stored. |
| test verdict | Fails only if SLA is not passed, or if there is a test case execution problem. |
13.2.6. Yardstick Test Case Description TC009
| Packet Loss | |
| test case id | OPNFV_YARDSTICK_TC009_NW PERF, Packet loss |
| metric | Number of flows, packets lost and throughput |
| test purpose | To evaluate the IaaS network performance with regards to flows and throughput, such as if and how different amounts of flows matter for the throughput between VMs on different compute blades. Typically e.g. the performance of a vSwitch depends on the number of flows running through it. Also performance of other equipment or entities can depend on the number of flows or the packet sizes used. The purpose is also to be able to spot trends. Test results, graphs ans similar shall be stored for comparison reasons and product evolution understanding between different OPNFV versions and/or configurations. |
| configuration | file: opnfv_yardstick_tc009.yaml Packet size: 64 bytes Number of ports: 1, 10, 50, 100, 500 and 1000. The amount of configured ports map from 2 up to 1001000 flows, respectively. Each port amount is run ten times, for 20 seconds each. Then the next port_amount is run, and so on. The client and server are distributed on different HW. For SLA max_ppm is set to 1000. |
| test tool | pktgen (Pktgen is not always part of a Linux distribution, hence it needs to be installed. It is part of the Yardstick Docker image. As an example see the /yardstick/tools/ directory for how to generate a Linux image with pktgen included.) |
| references |
ETSI-NFV-TST001 |
| applicability | Test can be configured with different packet sizes, amount of flows and test duration. Default values exist. SLA (optional): max_ppm: The number of packets per million packets sent that are acceptable to loose, not received. |
| pre-test conditions | The test case image needs to be installed into Glance with pktgen included in it. No POD specific requirements have been identified. |
| test sequence | description and expected result |
| step 1 | The hosts are installed, as server and client. pktgen is invoked and logs are produced and stored. Result: logs are stored. |
| test verdict | Fails only if SLA is not passed, or if there is a test case execution problem. |
13.2.7. Yardstick Test Case Description TC010
| Memory Latency | |
| test case id | OPNFV_YARDSTICK_TC010_MEMORY LATENCY |
| metric | Memory read latency (nanoseconds) |
| test purpose | The purpose of TC010 is to evaluate the IaaS compute performance with regards to memory read latency. It measures the memory read latency for varying memory sizes and strides. Whole memory hierarchy is measured. The purpose is also to be able to spot the trends. Test results, graphs and similar shall be stored for comparison reasons and product evolution understanding between different OPNFV versions and/or configurations. |
| test tool | Lmbench Lmbench is a suite of operating system microbenchmarks. This test uses lat_mem_rd tool from that suite including:
(LMbench is not always part of a Linux distribution, hence it needs to be installed. As an example see the /yardstick/tools/ directory for how to generate a Linux image with LMbench included.) |
| test description | LMbench lat_mem_rd benchmark measures memory read latency for varying memory sizes and strides. The benchmark runs as two nested loops. The outer loop is the stride size. The inner loop is the array size. For each array size, the benchmark creates a ring of pointers that point backward one stride.Traversing the array is done by:
in a for loop (the over head of the for loop is not significant; the loop is an unrolled loop 100 loads long). The size of the array varies from 512 bytes to (typically) eight megabytes. For the small sizes, the cache will have an effect, and the loads will be much faster. This becomes much more apparent when the data is plotted. Only data accesses are measured; the instruction cache is not measured. The results are reported in nanoseconds per load and have been verified accurate to within a few nanoseconds on an SGI Indy. |
| configuration | File: opnfv_yardstick_tc010.yaml
SLA is optional. The SLA in this test case serves as an example. Considerably lower read latency is expected. However, to cover most configurations, both baremetal and fully virtualized ones, this value should be possible to achieve and acceptable for black box testing. Many heavy IO applications start to suffer badly if the read latency is higher than this. |
| applicability | Test can be configured with different:
Default values exist. SLA (optional) : max_latency: The maximum memory latency that is accepted. |
| usability | This test case is one of Yardstick’s generic test. Thus it is runnable on most of the scenarios. |
| references | LMbench lat_mem_rd ETSI-NFV-TST001 |
| pre-test conditions | The test case image needs to be installed into Glance with Lmbench included in the image. No POD specific requirements have been identified. |
| test sequence | description and expected result |
| step 1 | The host is installed as client. LMbench’s lat_mem_rd tool is invoked and logs are produced and stored. Result: logs are stored. |
| step 1 | A host VM with LMbench installed is booted. |
| step 2 | Yardstick is connected with the host VM by using ssh. ‘lmbench_latency_benchmark’ bash script is copyied from Jump Host to the host VM via the ssh tunnel. |
| step 3 | ‘lmbench_latency_benchmark’ script is invoked. LMbench’s lat_mem_rd benchmark starts to measures memory read latency for varying memory sizes and strides. Memory read latency are recorded and checked against the SLA. Logs are produced and stored. Result: Logs are stored. |
| step 4 | The host VM is deleted. |
| test verdict | Test fails if the measured memory latency is above the SLA value or if there is a test case execution problem. |
13.2.8. Yardstick Test Case Description TC011
| Packet delay variation between VMs | |
| test case id | OPNFV_YARDSTICK_TC011_PACKET DELAY VARIATION BETWEEN VMs |
| metric | jitter: packet delay variation (ms) |
| test purpose | The purpose of TC011 is to evaluate the IaaS network performance with regards to network jitter (packet delay variation). It measures the packet delay variation sending the packets from one VM to the other. The purpose is also to be able to spot the trends. Test results, graphs and similar shall be stored for comparison reasons and product evolution understanding between different OPNFV versions and/or configurations. |
| test tool | iperf3 iPerf3 is a tool for active measurements of the maximum achievable bandwidth on IP networks. It supports tuning of various parameters related to timing, buffers and protocols. The UDP protocols can be used to measure jitter delay. (iperf3 is not always part of a Linux distribution, hence it needs to be installed. It is part of the Yardstick Docker image. As an example see the /yardstick/tools/ directory for how to generate a Linux image with pktgen included.) |
| test description | iperf3 test is invoked between a host VM and a target VM. Jitter calculations are continuously computed by the server, as specified by RTP in RFC 1889. The client records a 64 bit second/microsecond timestamp in the packet. The server computes the relative transit time as (server’s receive time - client’s send time). The client’s and server’s clocks do not need to be synchronized; any difference is subtracted outin the jitter calculation. Jitter is the smoothed mean of differences between consecutive transit times. |
| configuration | File: opnfv_yardstick_tc011.yaml
|
| applicability | Test can be configured with different:
|
| usability | This test case is one of Yardstick’s generic test. Thus it is runnable on most of the scenarios. |
| references |
ETSI-NFV-TST001 |
| pre-test conditions | The test case image needs to be installed into Glance with iperf3 included in the image. No POD specific requirements have been identified. |
| test sequence | description and expected result |
| step 1 | Two host VMs with iperf3 installed are booted, as server and client. |
| step 2 | Yardstick is connected with the host VM by using ssh. A iperf3 server is started on the server VM via the ssh tunnel. |
| step 3 | iperf3 benchmark is invoked. Jitter is calculated and check against the SLA. Logs are produced and stored. Result: Logs are stored. |
| step 4 | The host VMs are deleted. |
| test verdict | Test should not PASS if any jitter is above the optional SLA value, or if there is a test case execution problem. |
13.2.9. Yardstick Test Case Description TC012
| Memory Bandwidth | |
| test case id | OPNFV_YARDSTICK_TC012_MEMORY BANDWIDTH |
| metric | Memory read/write bandwidth (MBps) |
| test purpose | The purpose of TC012 is to evaluate the IaaS compute performance with regards to memory throughput. It measures the rate at which data can be read from and written to the memory (this includes all levels of memory). The purpose is also to be able to spot the trends. Test results, graphs and similar shall be stored for comparison reasons and product evolution understanding between different OPNFV versions and/or configurations. |
| test tool | LMbench LMbench is a suite of operating system microbenchmarks. This test uses bw_mem tool from that suite including:
(LMbench is not always part of a Linux distribution, hence it needs to be installed. As an example see the /yardstick/tools/ directory for how to generate a Linux image with LMbench included.) |
| test description | LMbench bw_mem benchmark allocates twice the specified amount of memory, zeros it, and then times the copying of the first half to the second half. The benchmark is invoked in a host VM on a compute blade. Results are reported in megabytes moved per second. |
| configuration | File: opnfv_yardstick_tc012.yaml
SLA is optional. The SLA in this test case serves as an example. Considerably higher bandwidth is expected. However, to cover most configurations, both baremetal and fully virtualized ones, this value should be possible to achieve and acceptable for black box testing. Many heavy IO applications start to suffer badly if the read/write bandwidths are lower than this. |
| applicability | Test can be configured with different:
Default values exist. SLA (optional) : min_bandwidth: The minimun memory bandwidth that is accepted. |
| usability | This test case is one of Yardstick’s generic test. Thus it is runnable on most of the scenarios. |
| references | LMbench bw_mem ETSI-NFV-TST001 |
| pre-test conditions | The test case image needs to be installed into Glance with Lmbench included in the image. No POD specific requirements have been identified. |
| test sequence | description and expected result |
| step 1 | A host VM with LMbench installed is booted. |
| step 2 | Yardstick is connected with the host VM by using ssh. “lmbench_bandwidth_benchmark” bash script is copied from Jump Host to the host VM via ssh tunnel. |
| step 3 | ‘lmbench_bandwidth_benchmark’ script is invoked. LMbench’s bw_mem benchmark starts to measures memory read/write bandwidth. Memory read/write bandwidth results are recorded and checked against the SLA. Logs are produced and stored. Result: Logs are stored. |
| step 4 | The host VM is deleted. |
| test verdict | Test fails if the measured memory bandwidth is below the SLA value or if there is a test case execution problem. |
13.2.10. Yardstick Test Case Description TC014
| Processing speed | |
| test case id | OPNFV_YARDSTICK_TC014_PROCESSING SPEED |
| metric | score of single cpu running, score of parallel running |
| test purpose | The purpose of TC014 is to evaluate the IaaS compute performance with regards to CPU processing speed. It measures score of single cpu running and parallel running. The purpose is also to be able to spot the trends. Test results, graphs and similar shall be stored for comparison reasons and product evolution understanding between different OPNFV versions and/or configurations. |
| test tool | UnixBench Unixbench is the most used CPU benchmarking software tool. It can measure the performance of bash scripts, CPUs in multithreading and single threading. It can also measure the performance for parallel taks. Also, specific disk IO for small and large files are performed. You can use it to measure either linux dedicated servers and linux vps servers, running CentOS, Debian, Ubuntu, Fedora and other distros. (UnixBench is not always part of a Linux distribution, hence it needs to be installed. As an example see the /yardstick/tools/ directory for how to generate a Linux image with UnixBench included.) |
| test description | The UnixBench runs system benchmarks in a host VM on a compute blade, getting information on the CPUs in the system. If the system has more than one CPU, the tests will be run twice – once with a single copy of each test running at once, and once with N copies, where N is the number of CPUs. UnixBench will processs a set of results from a single test by averaging the individal pass results into a single final value. |
| configuration | file: opnfv_yardstick_tc014.yaml run_mode: Run unixbench in quiet mode or verbose mode test_type: dhry2reg, whetstone and so on For SLA with single_score and parallel_score, both can be set by user, default is NA. |
| applicability | Test can be configured with different:
Default values exist. SLA (optional) : min_score: The minimun UnixBench score that is accepted. |
| usability | This test case is one of Yardstick’s generic test. Thus it is runnable on most of the scenarios. |
| references |
ETSI-NFV-TST001 |
| pre-test conditions | The test case image needs to be installed into Glance with unixbench included in it. No POD specific requirements have been identified. |
| test sequence | description and expected result |
| step 1 | A host VM with UnixBench installed is booted. |
| step 2 | Yardstick is connected with the host VM by using ssh. “unixbench_benchmark” bash script is copied from Jump Host to the host VM via ssh tunnel. |
| step 3 | UnixBench is invoked. All the tests are executed using the “Run” script in the top-level of UnixBench directory. The “Run” script will run a standard “index” test, and save the report in the “results” directory. Then the report is processed by “unixbench_benchmark” and checked againsted the SLA. Result: Logs are stored. |
| step 4 | The host VM is deleted. |
| test verdict | Fails only if SLA is not passed, or if there is a test case execution problem. |
13.2.11. Yardstick Test Case Description TC024
| CPU Load | |
| test case id | OPNFV_YARDSTICK_TC024_CPU Load |
| metric | CPU load |
| test purpose | To evaluate the CPU load performance of the IaaS. This test case should be run in parallel to other Yardstick test cases and not run as a stand-alone test case. Average, minimum and maximun values are obtained. The purpose is also to be able to spot trends. Test results, graphs and similar shall be stored for comparison reasons and product evolution understanding between different OPNFV versions and/or configurations. |
| configuration | file: cpuload.yaml (in the ‘samples’ directory)
|
| test tool | mpstat (mpstat is not always part of a Linux distribution, hence it needs to be installed. It is part of the Yardstick Glance image. However, if mpstat is not present the TC instead uses /proc/stats as source to produce “mpstat” output. |
| references | man-pages |
| applicability | Test can be configured with different:
There are default values for each above-mentioned option. Run in background with other test cases. |
| pre-test conditions | The test case image needs to be installed into Glance with mpstat included in it. No POD specific requirements have been identified. |
| test sequence | description and expected result |
| step 1 | The host is installed. The related TC, or TCs, is invoked and mpstat logs are produced and stored. Result: Stored logs |
| test verdict | None. CPU load results are fetched and stored. |
13.2.12. Yardstick Test Case Description TC037
| Latency, CPU Load, Throughput, Packet Loss | |
| test case id | OPNFV_YARDSTICK_TC037_LATENCY,CPU LOAD,THROUGHPUT, PACKET LOSS |
| metric | Number of flows, latency, throughput, packet loss CPU utilization percentage, CPU interrupt per second |
| test purpose | The purpose of TC037 is to evaluate the IaaS compute capacity and network performance with regards to CPU utilization, packet flows and network throughput, such as if and how different amounts of flows matter for the throughput between hosts on different compute blades, and the CPU load variation. Typically e.g. the performance of a vSwitch depends on the number of flows running through it. Also performance of other equipment or entities can depend on the number of flows or the packet sizes used The purpose is also to be able to spot the trends. Test results, graphs and similar shall be stored for comparison reasons and product evolution understanding between different OPNFV versions and/or configurations. |
| test tool | Ping, Pktgen, mpstat Ping is a computer network administration software utility used to test the reachability of a host on an Internet Protocol (IP) network. It measures the round-trip time for packet sent from the originating host to a destination computer that are echoed back to the source. Linux packet generator is a tool to generate packets at very high speed in the kernel. pktgen is mainly used to drive and LAN equipment test network. pktgen supports multi threading. To generate random MAC address, IP address, port number UDP packets, pktgen uses multiple CPU processors in the different PCI bus (PCI, PCIe bus) with Gigabit Ethernet tested (pktgen performance depends on the CPU processing speed, memory delay, PCI bus speed hardware parameters), Transmit data rate can be even larger than 10GBit/s. Visible can satisfy most card test requirements. The mpstat command writes to standard output activities for each available processor, processor 0 being the first one. Global average activities among all processors are also reported. The mpstat command can be used both on SMP and UP machines, but in the latter, only global average activities will be printed. (Ping is normally part of any Linux distribution, hence it doesn’t need to be installed. It is also part of the Yardstick Docker image. For example also a Cirros image can be downloaded from cirros-image, it includes ping. Pktgen and mpstat are not always part of a Linux distribution, hence it needs to be installed. It is part of the Yardstick Docker image. As an example see the /yardstick/tools/ directory for how to generate a Linux image with pktgen and mpstat included.) |
| test description | This test case uses Pktgen to generate packet flow between two hosts for simulating network workloads on the SUT. Ping packets (ICMP protocol’s mandatory ECHO_REQUEST datagram) are sent from a host VM to the target VM(s) to elicit ICMP ECHO_RESPONSE, meanwhile CPU activities are monitored by mpstat. |
| configuration | file: opnfv_yardstick_tc037.yaml Packet size is set to 64 bytes. Number of ports: 1, 10, 50, 100, 300, 500, 750 and 1000. The amount configured ports map from 2 up to 1001000 flows, respectively. Each port amount is run two times, for 20 seconds each. Then the next port_amount is run, and so on. During the test CPU load on both client and server, and the network latency between the client and server are measured. The client and server are distributed on different hardware. mpstat monitoring interval is set to 1 second. ping packet size is set to 100 bytes. For SLA max_ppm is set to 1000. |
| applicability | Test can be configured with different:
Default values exist. SLA (optional): max_ppm: The number of packets per million packets sent that are acceptable to loose, not received. |
| references |
ETSI-NFV-TST001 |
| pre-test conditions | The test case image needs to be installed into Glance with pktgen, mpstat included in it. No POD specific requirements have been identified. |
| test sequence | description and expected result |
| step 1 | Two host VMs are booted, as server and client. |
| step 2 | Yardstick is connected with the server VM by using ssh. ‘pktgen_benchmark’, “ping_benchmark” bash script are copyied from Jump Host to the server VM via the ssh tunnel. |
| step 3 | An IP table is setup on server to monitor for received packets. |
| step 4 | pktgen is invoked to generate packet flow between two server and client for simulating network workloads on the SUT. Ping is invoked. Ping packets are sent from server VM to client VM. mpstat is invoked, recording activities for each available processor. Results are processed and checked against the SLA. Logs are produced and stored. Result: Logs are stored. |
| step 5 | Two host VMs are deleted. |
| test verdict | Fails only if SLA is not passed, or if there is a test case execution problem. |
13.2.13. Yardstick Test Case Description TC038
| Latency, CPU Load, Throughput, Packet Loss (Extended measurements) | |
| test case id | OPNFV_YARDSTICK_TC038_Latency,CPU Load,Throughput,Packet Loss |
| metric | Number of flows, latency, throughput, CPU load, packet loss |
| test purpose | To evaluate the IaaS network performance with regards to flows and throughput, such as if and how different amounts of flows matter for the throughput between hosts on different compute blades. Typically e.g. the performance of a vSwitch depends on the number of flows running through it. Also performance of other equipment or entities can depend on the number of flows or the packet sizes used. The purpose is also to be able to spot trends. Test results, graphs ans similar shall be stored for comparison reasons and product evolution understanding between different OPNFV versions and/or configurations. |
| configuration | file: opnfv_yardstick_tc038.yaml Packet size: 64 bytes Number of ports: 1, 10, 50, 100, 300, 500, 750 and 1000. The amount configured ports map from 2 up to 1001000 flows, respectively. Each port amount is run ten times, for 20 seconds each. Then the next port_amount is run, and so on. During the test CPU load on both client and server, and the network latency between the client and server are measured. The client and server are distributed on different HW. For SLA max_ppm is set to 1000. |
| test tool | pktgen (Pktgen is not always part of a Linux distribution, hence it needs to be installed. It is part of the Yardstick Glance image. As an example see the /yardstick/tools/ directory for how to generate a Linux image with pktgen included.) ping Ping is normally part of any Linux distribution, hence it doesn’t need to be installed. It is also part of the Yardstick Glance image. (For example also a cirros image can be downloaded, it includes ping) mpstat (Mpstat is not always part of a Linux distribution, hence it needs to be installed. It is part of the Yardstick Glance image. |
| references | Ping and Mpstat man pages ETSI-NFV-TST001 |
| applicability | Test can be configured with different packet sizes, amount of flows and test duration. Default values exist. SLA (optional): max_ppm: The number of packets per million packets sent that are acceptable to loose, not received. |
| pre-test conditions | The test case image needs to be installed into Glance with pktgen included in it. No POD specific requirements have been identified. |
| test sequence | description and expected result |
| step 1 | The hosts are installed, as server and client. pktgen is invoked and logs are produced and stored. Result: Logs are stored. |
| test verdict | Fails only if SLA is not passed, or if there is a test case execution problem. |
13.2.14. Yardstick Test Case Description TC0042
| Network Performance | |
| test case id | OPNFV_YARDSTICK_TC042_DPDK pktgen latency measurements |
| metric | L2 Network Latency |
| test purpose | Measure L2 network latency when DPDK is enabled between hosts on different compute blades. |
| configuration | file: opnfv_yardstick_tc042.yaml
|
| test tool |
(DPDK and Pktgen-dpdk are not part of a Linux distribution, hence they needs to be installed. As an example see the /yardstick/tools/ directory for how to generate a Linux image with DPDK and pktgen-dpdk included.) |
| references |
ETSI-NFV-TST001 |
| applicability | Test can be configured with different packet sizes. Default values exist. |
| pre-test conditions | The test case image needs to be installed into Glance with DPDK and pktgen-dpdk included in it. The NICs of compute nodes must support DPDK on POD. And at least compute nodes setup hugepage. If you want to achievement a hight performance result, it is recommend to use NUAM, CPU pin, OVS and so on. |
| test sequence | description and expected result |
| step 1 | The hosts are installed on different blades, as server and client. Both server and client have three interfaces. The first one is management such as ssh. The other two are used by DPDK. |
| step 2 | Testpmd is invoked with configurations to forward packets from one DPDK port to the other on server. |
| step 3 | Pktgen-dpdk is invoked with configurations as a traffic generator and logs are produced and stored on client. Result: Logs are stored. |
| test verdict | Fails only if SLA is not passed, or if there is a test case execution problem. |
13.2.15. Yardstick Test Case Description TC043
| Network Latency Between NFVI Nodes | |
| test case id | OPNFV_YARDSTICK_TC043_LATENCY_BETWEEN_NFVI_NODES |
| metric | RTT (Round Trip Time) |
| test purpose | The purpose of TC043 is to do a basic verification that network latency is within acceptable boundaries when packets travel between different NFVI nodes. The purpose is also to be able to spot the trends. Test results, graphs and similar shall be stored for comparison reasons and product evolution understanding between different OPNFV versions and/or configurations. |
| test tool | ping Ping is a computer network administration software utility used to test the reachability of a host on an Internet Protocol (IP) network. It measures the round-trip time for packet sent from the originating host to a destination computer that are echoed back to the source. |
| test topology | Ping packets (ICMP protocol’s mandatory ECHO_REQUEST datagram) are sent from host node to target node to elicit ICMP ECHO_RESPONSE. |
| configuration | file: opnfv_yardstick_tc043.yaml Packet size 100 bytes. Total test duration 600 seconds. One ping each 10 seconds. SLA RTT is set to maximum 10 ms. |
| applicability | This test case can be configured with different:
Default values exist. SLA is optional. The SLA in this test case serves as an example. Considerably lower RTT is expected, and also normal to achieve in balanced L2 environments. However, to cover most configurations, both bare metal and fully virtualized ones, this value should be possible to achieve and acceptable for black box testing. Many real time applications start to suffer badly if the RTT time is higher than this. Some may suffer bad also close to this RTT, while others may not suffer at all. It is a compromise that may have to be tuned for different configuration purposes. |
| references |
ETSI-NFV-TST001 |
| pre_test conditions | Each pod node must have ping included in it. |
| test sequence | description and expected result |
| step 1 | Yardstick is connected with the NFVI node by using ssh. ‘ping_benchmark’ bash script is copyied from Jump Host to the NFVI node via the ssh tunnel. |
| step 2 | Ping is invoked. Ping packets are sent from server node to client node. RTT results are calculated and checked against the SLA. Logs are produced and stored. Result: Logs are stored. |
| test verdict | Test should not PASS if any RTT is above the optional SLA value, or if there is a test case execution problem. |
13.2.16. Yardstick Test Case Description TC044
| Memory Utilization | |
| test case id | OPNFV_YARDSTICK_TC044_Memory Utilization |
| metric | Memory utilization |
| test purpose | To evaluate the IaaS compute capability with regards to memory utilization.This test case should be run in parallel to other Yardstick test cases and not run as a stand-alone test case. Measure the memory usage statistics including used memory, free memory, buffer, cache and shared memory. Both average and maximun values are obtained. The purpose is also to be able to spot trends. Test results, graphs and similar shall be stored for comparison reasons and product evolution understanding between different OPNFV versions and/or configurations. |
| configuration | File: memload.yaml (in the ‘samples’ directory)
|
| test tool | free free provides information about unused and used memory and swap space on any computer running Linux or another Unix-like operating system. free is normally part of a Linux distribution, hence it doesn’t needs to be installed. |
| references |
ETSI-NFV-TST001 |
| applicability | Test can be configured with different:
There are default values for each above-mentioned option. Run in background with other test cases. |
| pre-test conditions | The test case image needs to be installed into Glance with free included in the image. No POD specific requirements have been identified. |
| test sequence | description and expected result |
| step 1 | The host is installed as client. The related TC, or TCs, is invoked and free logs are produced and stored. Result: logs are stored. |
| test verdict | None. Memory utilization results are fetched and stored. |
13.2.17. Yardstick Test Case Description TC055
| Compute Capacity | |
| test case id | OPNFV_YARDSTICK_TC055_Compute Capacity |
| metric | Number of cpus, number of cores, number of threads, available memory size and total cache size. |
| test purpose | To evaluate the IaaS compute capacity with regards to hardware specification, including number of cpus, number of cores, number of threads, available memory size and total cache size. Test results, graphs and similar shall be stored for comparison reasons and product evolution understanding between different OPNFV versions and/or configurations. |
| configuration | file: opnfv_yardstick_tc055.yaml There is are no additional configurations to be set for this TC. |
| test tool | /proc/cpuinfo this TC uses /proc/cpuinfo as source to produce compute capacity output. |
| references | /proc/cpuinfo_ ETSI-NFV-TST001 |
| applicability | None. |
| pre-test conditions | No POD specific requirements have been identified. |
| test sequence | description and expected result |
| step 1 | The hosts are installed, TC is invoked and logs are produced and stored. Result: Logs are stored. |
| test verdict | None. Hardware specification are fetched and stored. |
13.2.18. Yardstick Test Case Description TC061
| Network Utilization | |
| test case id | OPNFV_YARDSTICK_TC061_Network Utilization |
| metric | Network utilization |
| test purpose | To evaluate the IaaS network capability with regards to network utilization, including Total number of packets received per second, Total number of packets transmitted per second, Total number of kilobytes received per second, Total number of kilobytes transmitted per second, Number of compressed packets received per second (for cslip etc.), Number of compressed packets transmitted per second, Number of multicast packets received per second, Utilization percentage of the network interface. This test case should be run in parallel to other Yardstick test cases and not run as a stand-alone test case. Measure the network usage statistics from the network devices Average, minimum and maximun values are obtained. The purpose is also to be able to spot trends. Test results, graphs and similar shall be stored for comparison reasons and product evolution understanding between different OPNFV versions and/or configurations. |
| configuration | File: netutilization.yaml (in the ‘samples’ directory)
|
| test tool | sar The sar command writes to standard output the contents of selected cumulative activity counters in the operating system. sar is normally part of a Linux distribution, hence it doesn’t needs to be installed. |
| references |
ETSI-NFV-TST001 |
| applicability | Test can be configured with different:
There are default values for each above-mentioned option. Run in background with other test cases. |
| pre-test conditions | The test case image needs to be installed into Glance with sar included in the image. No POD specific requirements have been identified. |
| test sequence | description and expected result. |
| step 1 | The host is installed as client. The related TC, or TCs, is invoked and sar logs are produced and stored. Result: logs are stored. |
| test verdict | None. Network utilization results are fetched and stored. |
13.2.19. Yardstick Test Case Description TC063
| Storage Capacity | |
| test case id | OPNFV_YARDSTICK_TC063_Storage Capacity |
| metric | Storage/disk size, block size Disk Utilization |
| test purpose | This test case will check the parameters which could decide several models and each model has its specified task to measure. The test purposes are to measure disk size, block size and disk utilization. With the test results, we could evaluate the storage capacity of the host. |
| configuration |
|
| test tool | fdisk A command-line utility that provides disk partitioning functions iostat This is a computer system monitor tool used to collect and show operating system storage input and output statistics. |
| references |
ETSI-NFV-TST001 |
| applicability | Test can be configured with different:
There are default values for each above-mentioned option. Run in background with other test cases. |
| pre-test conditions | The test case image needs to be installed into Glance No POD specific requirements have been identified. |
| test sequence | Output the specific storage capacity of disk information as the sequence into file. |
| step 1 | The pod is available and the hosts are installed. Node5 is used and logs are produced and stored. Result: Logs are stored. |
| test verdict | None. |
13.2.20. Yardstick Test Case Description TC069
| Memory Bandwidth | |
| test case id | OPNFV_YARDSTICK_TC069_Memory Bandwidth |
| metric | Megabyte per second (MBps) |
| test purpose | To evaluate the IaaS compute performance with regards to memory bandwidth. Measure the maximum possible cache and memory performance while reading and writing certain blocks of data (starting from 1Kb and further in power of 2) continuously through ALU and FPU respectively. Measure different aspects of memory performance via synthetic simulations. Each simulation consists of four performances (Copy, Scale, Add, Triad). Test results, graphs and similar shall be stored for comparison reasons and product evolution understanding between different OPNFV versions and/or configurations. |
| configuration | File: opnfv_yardstick_tc069.yaml
|
| test tool | RAMspeed RAMspeed is a free open source command line utility to measure cache and memory performance of computer systems. RAMspeed is not always part of a Linux distribution, hence it needs to be installed in the test image. |
| references |
ETSI-NFV-TST001 |
| applicability | Test can be configured with different:
There are default values for each above-mentioned option. |
| pre-test conditions | The test case image needs to be installed into Glance with RAmspeed included in the image. No POD specific requirements have been identified. |
| test sequence | description and expected result |
| step 1 | The host is installed as client. RAMspeed is invoked and logs are produced and stored. Result: logs are stored. |
| test verdict | Test fails if the measured memory bandwidth is below the SLA value or if there is a test case execution problem. |
13.2.21. Yardstick Test Case Description TC070
| Latency, Memory Utilization, Throughput, Packet Loss | |
| test case id | OPNFV_YARDSTICK_TC070_Latency, Memory Utilization, Throughput,Packet Loss |
| metric | Number of flows, latency, throughput, Memory Utilization, packet loss |
| test purpose | To evaluate the IaaS network performance with regards to flows and throughput, such as if and how different amounts of flows matter for the throughput between hosts on different compute blades. Typically e.g. the performance of a vSwitch depends on the number of flows running through it. Also performance of other equipment or entities can depend on the number of flows or the packet sizes used. The purpose is also to be able to spot trends. Test results, graphs and similar shall be stored for comparison reasons and product evolution understanding between different OPNFV versions and/or configurations. |
| configuration | file: opnfv_yardstick_tc070.yaml Packet size: 64 bytes Number of ports: 1, 10, 50, 100, 300, 500, 750 and 1000. The amount configured ports map from 2 up to 1001000 flows, respectively. Each port amount is run two times, for 20 seconds each. Then the next port_amount is run, and so on. During the test Memory Utilization on both client and server, and the network latency between the client and server are measured. The client and server are distributed on different HW. For SLA max_ppm is set to 1000. |
| test tool | pktgen Pktgen is not always part of a Linux distribution, hence it needs to be installed. It is part of the Yardstick Glance image. (As an example see the /yardstick/tools/ directory for how to generate a Linux image with pktgen included.) ping Ping is normally part of any Linux distribution, hence it doesn’t need to be installed. It is also part of the Yardstick Glance image. (For example also a cirros image can be downloaded, it includes ping) free free provides information about unused and used memory and swap space on any computer running Linux or another Unix-like operating system. free is normally part of a Linux distribution, hence it doesn’t needs to be installed. |
| references | Ping and free man pages ETSI-NFV-TST001 |
| applicability | Test can be configured with different packet sizes, amount of flows and test duration. Default values exist. SLA (optional): max_ppm: The number of packets per million packets sent that are acceptable to lose, not received. |
| pre-test conditions | The test case image needs to be installed into Glance with pktgen included in it. No POD specific requirements have been identified. |
| test sequence | description and expected result |
| step 1 | The hosts are installed, as server and client. pktgen is invoked and logs are produced and stored. Result: Logs are stored. |
| test verdict | Fails only if SLA is not passed, or if there is a test case execution problem. |
13.2.22. Yardstick Test Case Description TC071
| Latency, Cache Utilization, Throughput, Packet Loss | |
| test case id | OPNFV_YARDSTICK_TC071_Latency, Cache Utilization, Throughput,Packet Loss |
| metric | Number of flows, latency, throughput, Cache Utilization, packet loss |
| test purpose | To evaluate the IaaS network performance with regards to flows and throughput, such as if and how different amounts of flows matter for the throughput between hosts on different compute blades. Typically e.g. the performance of a vSwitch depends on the number of flows running through it. Also performance of other equipment or entities can depend on the number of flows or the packet sizes used. The purpose is also to be able to spot trends. Test results, graphs and similar shall be stored for comparison reasons and product evolution understanding between different OPNFV versions and/or configurations. |
| configuration | file: opnfv_yardstick_tc071.yaml Packet size: 64 bytes Number of ports: 1, 10, 50, 100, 300, 500, 750 and 1000. The amount configured ports map from 2 up to 1001000 flows, respectively. Each port amount is run two times, for 20 seconds each. Then the next port_amount is run, and so on. During the test Cache Utilization on both client and server, and the network latency between the client and server are measured. The client and server are distributed on different HW. For SLA max_ppm is set to 1000. |
| test tool | pktgen Pktgen is not always part of a Linux distribution, hence it needs to be installed. It is part of the Yardstick Glance image. (As an example see the /yardstick/tools/ directory for how to generate a Linux image with pktgen included.) ping Ping is normally part of any Linux distribution, hence it doesn’t need to be installed. It is also part of the Yardstick Glance image. (For example also a cirros image can be downloaded, it includes ping) cachestat cachestat is not always part of a Linux distribution, hence it needs to be installed. |
| references | Ping man pages ETSI-NFV-TST001 |
| applicability | Test can be configured with different packet sizes, amount of flows and test duration. Default values exist. SLA (optional): max_ppm: The number of packets per million packets sent that are acceptable to lose, not received. |
| pre-test conditions | The test case image needs to be installed into Glance with pktgen included in it. No POD specific requirements have been identified. |
| test sequence | description and expected result |
| step 1 | The hosts are installed, as server and client. pktgen is invoked and logs are produced and stored. Result: Logs are stored. |
| test verdict | Fails only if SLA is not passed, or if there is a test case execution problem. |
13.2.23. Yardstick Test Case Description TC072
| Latency, Network Utilization, Throughput, Packet Loss | |
| test case id | OPNFV_YARDSTICK_TC072_Latency, Network Utilization, Throughput,Packet Loss |
| metric | Number of flows, latency, throughput, Network Utilization, packet loss |
| test purpose | To evaluate the IaaS network performance with regards to flows and throughput, such as if and how different amounts of flows matter for the throughput between hosts on different compute blades. Typically e.g. the performance of a vSwitch depends on the number of flows running through it. Also performance of other equipment or entities can depend on the number of flows or the packet sizes used. The purpose is also to be able to spot trends. Test results, graphs and similar shall be stored for comparison reasons and product evolution understanding between different OPNFV versions and/or configurations. |
| configuration | file: opnfv_yardstick_tc072.yaml Packet size: 64 bytes Number of ports: 1, 10, 50, 100, 300, 500, 750 and 1000. The amount configured ports map from 2 up to 1001000 flows, respectively. Each port amount is run two times, for 20 seconds each. Then the next port_amount is run, and so on. During the test Network Utilization on both client and server, and the network latency between the client and server are measured. The client and server are distributed on different HW. For SLA max_ppm is set to 1000. |
| test tool | pktgen Pktgen is not always part of a Linux distribution, hence it needs to be installed. It is part of the Yardstick Glance image. (As an example see the /yardstick/tools/ directory for how to generate a Linux image with pktgen included.) ping Ping is normally part of any Linux distribution, hence it doesn’t need to be installed. It is also part of the Yardstick Glance image. (For example also a cirros image can be downloaded, it includes ping) sar The sar command writes to standard output the contents of selected cumulative activity counters in the operating system. sar is normally part of a Linux distribution, hence it doesn’t needs to be installed. |
| references | Ping and sar man pages ETSI-NFV-TST001 |
| applicability | Test can be configured with different packet sizes, amount of flows and test duration. Default values exist. SLA (optional): max_ppm: The number of packets per million packets sent that are acceptable to lose, not received. |
| pre-test conditions | The test case image needs to be installed into Glance with pktgen included in it. No POD specific requirements have been identified. |
| test sequence | description and expected result |
| step 1 | The hosts are installed, as server and client. pktgen is invoked and logs are produced and stored. Result: Logs are stored. |
| test verdict | Fails only if SLA is not passed, or if there is a test case execution problem. |
13.2.24. Yardstick Test Case Description TC073
| Throughput per NFVI node test | |
| test case id | OPNFV_YARDSTICK_TC073_Network latency and throughput between nodes |
| metric | Network latency and throughput |
| test purpose | To evaluate the IaaS network performance with regards to flows and throughput, such as if and how different amounts of packet sizes and flows matter for the throughput between nodes in one pod. |
| configuration | file: opnfv_yardstick_tc073.yaml Packet size: default 1024 bytes. Test length: default 20 seconds. The client and server are distributed on different nodes. For SLA max_mean_latency is set to 100. |
| test tool | netperf Netperf is a software application that provides network bandwidth testing between two hosts on a network. It supports Unix domain sockets, TCP, SCTP, DLPI and UDP via BSD Sockets. Netperf provides a number of predefined tests e.g. to measure bulk (unidirectional) data transfer or request response performance. (netperf is not always part of a Linux distribution, hence it needs to be installed.) |
| references | netperf Man pages ETSI-NFV-TST001 |
| applicability | Test can be configured with different packet sizes and test duration. Default values exist. SLA (optional): max_mean_latency |
| pre-test conditions | The POD can be reached by external ip and logged on via ssh |
| test sequence | description and expected result |
| step 1 | Install netperf tool on each specified node, one is as the server, and the other as the client. |
| step 2 | Log on to the client node and use the netperf command to execute the network performance test |
| step 3 | The throughput results stored. |
| test verdict | Fails only if SLA is not passed, or if there is a test case execution problem. |
13.2.25. Yardstick Test Case Description TC075
| Network Capacity and Scale Testing | |
| test case id | OPNFV_YARDSTICK_TC075_Network_Capacity_and_Scale_testing |
| metric | Number of connections, Number of frames sent/received |
| test purpose | To evaluate the network capacity and scale with regards to connections and frmaes. |
| configuration | file: opnfv_yardstick_tc075.yaml There is no additional configuration to be set for this TC. |
| test tool | netstar Netstat is normally part of any Linux distribution, hence it doesn’t need to be installed. |
| references | Netstat man page ETSI-NFV-TST001 |
| applicability | This test case is mainly for evaluating network performance. |
| pre_test conditions | Each pod node must have netstat included in it. |
| test sequence | description and expected result |
| step 1 | The pod is available. Netstat is invoked and logs are produced and stored. Result: Logs are stored. |
| test verdict | None. Number of connections and frames are fetched and stored. |
13.2.26. Yardstick Test Case Description TC076
| Monitor Network Metrics | |
| test case id | OPNFV_YARDSTICK_TC076_Monitor_Network_Metrics |
| metric | IP datagram error rate, ICMP message error rate, TCP segment error rate and UDP datagram error rate |
| test purpose | The purpose of TC076 is to evaluate the IaaS network reliability with regards to IP datagram error rate, ICMP message error rate, TCP segment error rate and UDP datagram error rate. TC076 monitors network metrics provided by the Linux kernel in a host and calculates IP datagram error rate, ICMP message error rate, TCP segment error rate and UDP datagram error rate. The purpose is also to be able to spot the trends. Test results, graphs and similar shall be stored for comparison reasons and product evolution understanding between different OPNFV versions and/or configurations. |
| test tool | nstat nstat is a simple tool to monitor kernel snmp counters and network interface statistics. (nstat is not always part of a Linux distribution, hence it needs to be installed. nstat is provided by the iproute2 collection, which is usually also the name of the package in many Linux distributions.As an example see the /yardstick/tools/ directory for how to generate a Linux image with iproute2 included.) |
| test description | Ping packets (ICMP protocol’s mandatory ECHO_REQUEST datagram) are sent from host VM to target VM(s) to elicit ICMP ECHO_RESPONSE. nstat is invoked on the target vm to monitors network metrics provided by the Linux kernel. |
| configuration | file: opnfv_yardstick_tc076.yaml There is no additional configuration to be set for this TC. |
| references | nstat man page ETSI-NFV-TST001 |
| applicability | This test case is mainly for monitoring network metrics. |
| pre_test conditions | The test case image needs to be installed into Glance with fio included in it. No POD specific requirements have been identified. |
| test sequence | description and expected result |
| step 1 | Two host VMs are booted, as server and client. |
| step 2 | Yardstick is connected with the server VM by using ssh. ‘ping_benchmark’ bash script is copyied from Jump Host to the server VM via the ssh tunnel. |
| step 3 | Ping is invoked. Ping packets are sent from server VM to client VM. RTT results are calculated and checked against the SLA. nstat is invoked on the client vm to monitors network metrics provided by the Linux kernel. IP datagram error rate, ICMP message error rate, TCP segment error rate and UDP datagram error rate are calculated. Logs are produced and stored. Result: Logs are stored. |
| step 4 | Two host VMs are deleted. |
| test verdict | None. |
13.3. OPNFV Feature Test Cases
13.3.1. H A
13.3.1.1. Yardstick Test Case Description TC019
| Control Node Openstack Service High Availability | |
| test case id | OPNFV_YARDSTICK_TC019_HA: Control node Openstack service down |
| test purpose | This test case will verify the high availability of the service provided by OpenStack (like nova-api, neutro-server) on control node. |
| test method | This test case kills the processes of a specific Openstack service on a selected control node, then checks whether the request of the related Openstack command is OK and the killed processes are recovered. |
| attackers | In this test case, an attacker called “kill-process” is needed. This attacker includes three parameters: 1) fault_type: which is used for finding the attacker’s scripts. It should be always set to “kill-process” in this test case. 2) process_name: which is the process name of the specified OpenStack service. If there are multiple processes use the same name on the host, all of them are killed by this attacker. 3) host: which is the name of a control node being attacked. e.g. -fault_type: “kill-process” -process_name: “nova-api” -host: node1 |
| monitors | In this test case, two kinds of monitor are needed: 1. the “openstack-cmd” monitor constantly request a specific
1) monitor_type: which is used for finding the monitor class and related scritps. It should be always set to “openstack-cmd” for this monitor. 2) command_name: which is the command name used for request
1) monitor_type: which used for finding the monitor class and related scritps. It should be always set to “process” for this monitor. 2) process_name: which is the process name for monitor 3) host: which is the name of the node runing the process e.g. monitor1: -monitor_type: “openstack-cmd” -command_name: “openstack server list” monitor2: -monitor_type: “process” -process_name: “nova-api” -host: node1 |
| metrics | In this test case, there are two metrics: 1)service_outage_time: which indicates the maximum outage time (seconds) of the specified Openstack command request. 2)process_recover_time: which indicates the maximun time (seconds) from the process being killed to recovered |
| test tool | Developed by the project. Please see folder: “yardstick/benchmark/scenarios/availability/ha_tools” |
| references | ETSI NFV REL001 |
| configuration | This test case needs two configuration files: 1) test case file: opnfv_yardstick_tc019.yaml -Attackers: see above “attackers” discription -waiting_time: which is the time (seconds) from the process being killed to stoping monitors the monitors -Monitors: see above “monitors” discription -SLA: see above “metrics” discription 2)POD file: pod.yaml The POD configuration should record on pod.yaml first. the “host” item in this test case will use the node name in the pod.yaml. |
| test sequence | description and expected result |
| step 1 | start monitors: each monitor will run with independently process Result: The monitor info will be collected. |
| step 2 | do attacker: connect the host through SSH, and then execute the kill process script with param value specified by “process_name” Result: Process will be killed. |
| step 3 | stop monitors after a period of time specified by “waiting_time” Result: The monitor info will be aggregated. |
| step 4 | verify the SLA Result: The test case is passed or not. |
| post-action | It is the action when the test cases exist. It will check the status of the specified process on the host, and restart the process if it is not running for next test cases |
| test verdict | Fails only if SLA is not passed, or if there is a test case execution problem. |
13.3.1.2. Yardstick Test Case Description TC025
| OpenStack Controller Node abnormally shutdown High Availability | |
| test case id | OPNFV_YARDSTICK_TC025_HA: OpenStack Controller Node abnormally shutdown |
| test purpose | This test case will verify the high availability of controller node. When one of the controller node abnormally shutdown, the service provided by it should be OK. |
| test method | This test case shutdowns a specified controller node with some fault injection tools, then checks whether all services provided by the controller node are OK with some monitor tools. |
| attackers | In this test case, an attacker called “host-shutdown” is needed. This attacker includes two parameters: 1) fault_type: which is used for finding the attacker’s scripts. It should be always set to “host-shutdown” in this test case. 2) host: the name of a controller node being attacked. e.g. -fault_type: “host-shutdown” -host: node1 |
| monitors | In this test case, one kind of monitor are needed: 1. the “openstack-cmd” monitor constantly request a specific
1) monitor_type: which is used for finding the monitor class and related scritps. It should be always set to “openstack-cmd” for this monitor. 2) command_name: which is the command name used for request There are four instance of the “openstack-cmd” monitor: monitor1: -monitor_type: “openstack-cmd” -api_name: “nova image-list” monitor2: -monitor_type: “openstack-cmd” -api_name: “neutron router-list” monitor3: -monitor_type: “openstack-cmd” -api_name: “heat stack-list” monitor4: -monitor_type: “openstack-cmd” -api_name: “cinder list” |
| metrics | In this test case, there is one metric: 1)service_outage_time: which indicates the maximum outage time (seconds) of the specified Openstack command request. |
| test tool | Developed by the project. Please see folder: “yardstick/benchmark/scenarios/availability/ha_tools” |
| references | ETSI NFV REL001 |
| configuration | This test case needs two configuration files: 1) test case file: opnfv_yardstick_tc019.yaml -Attackers: see above “attackers” discription -waiting_time: which is the time (seconds) from the process being killed to stoping monitors the monitors -Monitors: see above “monitors” discription -SLA: see above “metrics” discription 2)POD file: pod.yaml The POD configuration should record on pod.yaml first. the “host” item in this test case will use the node name in the pod.yaml. |
| test sequence | description and expected result |
| step 1 | start monitors: each monitor will run with independently process Result: The monitor info will be collected. |
| step 2 | do attacker: connect the host through SSH, and then execute shutdown script on the host Result: The host will be shutdown. |
| step 3 | stop monitors after a period of time specified by “waiting_time” Result: All monitor result will be aggregated. |
| step 4 | verify the SLA Result: The test case is passed or not. |
| post-action | It is the action when the test cases exist. It restarts the specified controller node if it is not restarted. |
| test verdict | Fails only if SLA is not passed, or if there is a test case execution problem. |
13.3.1.3. Yardstick Test Case Description TC045
| Control Node Openstack Service High Availability - Neutron Server | |
| test case id | OPNFV_YARDSTICK_TC045: Control node Openstack service down - neutron server |
| test purpose | This test case will verify the high availability of the network service provided by OpenStack (neutro-server) on control node. |
| test method | This test case kills the processes of neutron-server service on a selected control node, then checks whether the request of the related Openstack command is OK and the killed processes are recovered. |
| attackers | In this test case, an attacker called “kill-process” is needed. This attacker includes three parameters: 1) fault_type: which is used for finding the attacker’s scripts. It should be always set to “kill-process” in this test case. 2) process_name: which is the process name of the specified OpenStack service. If there are multiple processes use the same name on the host, all of them are killed by this attacker. In this case. This parameter should always set to “neutron- server”. 3) host: which is the name of a control node being attacked. e.g. -fault_type: “kill-process” -process_name: “neutron-server” -host: node1 |
| monitors | In this test case, two kinds of monitor are needed: 1. the “openstack-cmd” monitor constantly request a specific Openstack command, which needs two parameters: 1) monitor_type: which is used for finding the monitor class and related scritps. It should be always set to “openstack-cmd” for this monitor. 2) command_name: which is the command name used for request. In this case, the command name should be neutron related commands. 2. the “process” monitor check whether a process is running on a specific node, which needs three parameters: 1) monitor_type: which used for finding the monitor class and related scritps. It should be always set to “process” for this monitor. 2) process_name: which is the process name for monitor 3) host: which is the name of the node runing the process e.g. monitor1: -monitor_type: “openstack-cmd” -command_name: “neutron agent-list” monitor2: -monitor_type: “process” -process_name: “neutron-server” -host: node1 |
| metrics | In this test case, there are two metrics: 1)service_outage_time: which indicates the maximum outage time (seconds) of the specified Openstack command request. 2)process_recover_time: which indicates the maximun time (seconds) from the process being killed to recovered |
| test tool | Developed by the project. Please see folder: “yardstick/benchmark/scenarios/availability/ha_tools” |
| references | ETSI NFV REL001 |
| configuration | This test case needs two configuration files: 1) test case file: opnfv_yardstick_tc045.yaml -Attackers: see above “attackers” discription -waiting_time: which is the time (seconds) from the process being killed to stoping monitors the monitors -Monitors: see above “monitors” discription -SLA: see above “metrics” discription 2)POD file: pod.yaml The POD configuration should record on pod.yaml first. the “host” item in this test case will use the node name in the pod.yaml. |
| test sequence | description and expected result |
| step 1 | start monitors: each monitor will run with independently process Result: The monitor info will be collected. |
| step 2 | do attacker: connect the host through SSH, and then execute the kill process script with param value specified by “process_name” Result: Process will be killed. |
| step 3 | stop monitors after a period of time specified by “waiting_time” Result: The monitor info will be aggregated. |
| step 4 | verify the SLA Result: The test case is passed or not. |
| post-action | It is the action when the test cases exist. It will check the status of the specified process on the host, and restart the process if it is not running for next test cases |
| test verdict | Fails only if SLA is not passed, or if there is a test case execution problem. |
13.3.1.4. Yardstick Test Case Description TC046
| Control Node Openstack Service High Availability - Keystone | |
| test case id | OPNFV_YARDSTICK_TC046: Control node Openstack service down - keystone |
| test purpose | This test case will verify the high availability of the user service provided by OpenStack (keystone) on control node. |
| test method | This test case kills the processes of keystone service on a selected control node, then checks whether the request of the related Openstack command is OK and the killed processes are recovered. |
| attackers | In this test case, an attacker called “kill-process” is needed. This attacker includes three parameters: 1) fault_type: which is used for finding the attacker’s scripts. It should be always set to “kill-process” in this test case. 2) process_name: which is the process name of the specified OpenStack service. If there are multiple processes use the same name on the host, all of them are killed by this attacker. In this case. This parameter should always set to “keystone” 3) host: which is the name of a control node being attacked. e.g. -fault_type: “kill-process” -process_name: “keystone” -host: node1 |
| monitors | In this test case, two kinds of monitor are needed: 1. the “openstack-cmd” monitor constantly request a specific Openstack command, which needs two parameters: 1) monitor_type: which is used for finding the monitor class and related scritps. It should be always set to “openstack-cmd” for this monitor. 2) command_name: which is the command name used for request. In this case, the command name should be keystone related commands. 2. the “process” monitor check whether a process is running on a specific node, which needs three parameters: 1) monitor_type: which used for finding the monitor class and related scritps. It should be always set to “process” for this monitor. 2) process_name: which is the process name for monitor 3) host: which is the name of the node runing the process e.g. monitor1: -monitor_type: “openstack-cmd” -command_name: “keystone user-list” monitor2: -monitor_type: “process” -process_name: “keystone” -host: node1 |
| metrics | In this test case, there are two metrics: 1)service_outage_time: which indicates the maximum outage time (seconds) of the specified Openstack command request. 2)process_recover_time: which indicates the maximun time (seconds) from the process being killed to recovered |
| test tool | Developed by the project. Please see folder: “yardstick/benchmark/scenarios/availability/ha_tools” |
| references | ETSI NFV REL001 |
| configuration | This test case needs two configuration files: 1) test case file: opnfv_yardstick_tc046.yaml -Attackers: see above “attackers” discription -waiting_time: which is the time (seconds) from the process being killed to stoping monitors the monitors -Monitors: see above “monitors” discription -SLA: see above “metrics” discription 2)POD file: pod.yaml The POD configuration should record on pod.yaml first. the “host” item in this test case will use the node name in the pod.yaml. |
| test sequence | description and expected result |
| step 1 | start monitors: each monitor will run with independently process Result: The monitor info will be collected. |
| step 2 | do attacker: connect the host through SSH, and then execute the kill process script with param value specified by “process_name” Result: Process will be killed. |
| step 3 | stop monitors after a period of time specified by “waiting_time” Result: The monitor info will be aggregated. |
| step 4 | verify the SLA Result: The test case is passed or not. |
| post-action | It is the action when the test cases exist. It will check the status of the specified process on the host, and restart the process if it is not running for next test cases |
| test verdict | Fails only if SLA is not passed, or if there is a test case execution problem. |
13.3.1.5. Yardstick Test Case Description TC047
| Control Node Openstack Service High Availability - Glance Api | |
| test case id | OPNFV_YARDSTICK_TC047: Control node Openstack service down - glance api |
| test purpose | This test case will verify the high availability of the image service provided by OpenStack (glance-api) on control node. |
| test method | This test case kills the processes of glance-api service on a selected control node, then checks whether the request of the related Openstack command is OK and the killed processes are recovered. |
| attackers | In this test case, an attacker called “kill-process” is needed. This attacker includes three parameters: 1) fault_type: which is used for finding the attacker’s scripts. It should be always set to “kill-process” in this test case. 2) process_name: which is the process name of the specified OpenStack service. If there are multiple processes use the same name on the host, all of them are killed by this attacker. In this case. This parameter should always set to “glance- api”. 3) host: which is the name of a control node being attacked. e.g. -fault_type: “kill-process” -process_name: “glance-api” -host: node1 |
| monitors | In this test case, two kinds of monitor are needed: 1. the “openstack-cmd” monitor constantly request a specific Openstack command, which needs two parameters: 1) monitor_type: which is used for finding the monitor class and related scritps. It should be always set to “openstack-cmd” for this monitor. 2) command_name: which is the command name used for request. In this case, the command name should be glance related commands. 2. the “process” monitor check whether a process is running on a specific node, which needs three parameters: 1) monitor_type: which used for finding the monitor class and related scritps. It should be always set to “process” for this monitor. 2) process_name: which is the process name for monitor 3) host: which is the name of the node runing the process e.g. monitor1: -monitor_type: “openstack-cmd” -command_name: “glance image-list” monitor2: -monitor_type: “process” -process_name: “glance-api” -host: node1 |
| metrics | In this test case, there are two metrics: 1)service_outage_time: which indicates the maximum outage time (seconds) of the specified Openstack command request. 2)process_recover_time: which indicates the maximun time (seconds) from the process being killed to recovered |
| test tool | Developed by the project. Please see folder: “yardstick/benchmark/scenarios/availability/ha_tools” |
| references | ETSI NFV REL001 |
| configuration | This test case needs two configuration files: 1) test case file: opnfv_yardstick_tc047.yaml -Attackers: see above “attackers” discription -waiting_time: which is the time (seconds) from the process being killed to stoping monitors the monitors -Monitors: see above “monitors” discription -SLA: see above “metrics” discription 2)POD file: pod.yaml The POD configuration should record on pod.yaml first. the “host” item in this test case will use the node name in the pod.yaml. |
| test sequence | description and expected result |
| step 1 | start monitors: each monitor will run with independently process Result: The monitor info will be collected. |
| step 2 | do attacker: connect the host through SSH, and then execute the kill process script with param value specified by “process_name” Result: Process will be killed. |
| step 3 | stop monitors after a period of time specified by “waiting_time” Result: The monitor info will be aggregated. |
| step 4 | verify the SLA Result: The test case is passed or not. |
| post-action | It is the action when the test cases exist. It will check the status of the specified process on the host, and restart the process if it is not running for next test cases |
| test verdict | Fails only if SLA is not passed, or if there is a test case execution problem. |
13.3.1.6. Yardstick Test Case Description TC048
| Control Node Openstack Service High Availability - Cinder Api | |
| test case id | OPNFV_YARDSTICK_TC048: Control node Openstack service down - cinder api |
| test purpose | This test case will verify the high availability of the volume service provided by OpenStack (cinder-api) on control node. |
| test method | This test case kills the processes of cinder-api service on a selected control node, then checks whether the request of the related Openstack command is OK and the killed processes are recovered. |
| attackers | In this test case, an attacker called “kill-process” is needed. This attacker includes three parameters: 1) fault_type: which is used for finding the attacker’s scripts. It should be always set to “kill-process” in this test case. 2) process_name: which is the process name of the specified OpenStack service. If there are multiple processes use the same name on the host, all of them are killed by this attacker. In this case. This parameter should always set to “cinder- api”. 3) host: which is the name of a control node being attacked. e.g. -fault_type: “kill-process” -process_name: “cinder-api” -host: node1 |
| monitors | In this test case, two kinds of monitor are needed: 1. the “openstack-cmd” monitor constantly request a specific Openstack command, which needs two parameters: 1) monitor_type: which is used for finding the monitor class and related scritps. It should be always set to “openstack-cmd” for this monitor. 2) command_name: which is the command name used for request. In this case, the command name should be cinder related commands. 2. the “process” monitor check whether a process is running on a specific node, which needs three parameters: 1) monitor_type: which used for finding the monitor class and related scritps. It should be always set to “process” for this monitor. 2) process_name: which is the process name for monitor 3) host: which is the name of the node runing the process e.g. monitor1: -monitor_type: “openstack-cmd” -command_name: “cinder list” monitor2: -monitor_type: “process” -process_name: “cinder-api” -host: node1 |
| metrics | In this test case, there are two metrics: 1)service_outage_time: which indicates the maximum outage time (seconds) of the specified Openstack command request. 2)process_recover_time: which indicates the maximun time (seconds) from the process being killed to recovered |
| test tool | Developed by the project. Please see folder: “yardstick/benchmark/scenarios/availability/ha_tools” |
| references | ETSI NFV REL001 |
| configuration | This test case needs two configuration files: 1) test case file: opnfv_yardstick_tc048.yaml -Attackers: see above “attackers” discription -waiting_time: which is the time (seconds) from the process being killed to stoping monitors the monitors -Monitors: see above “monitors” discription -SLA: see above “metrics” discription 2)POD file: pod.yaml The POD configuration should record on pod.yaml first. the “host” item in this test case will use the node name in the pod.yaml. |
| test sequence | description and expected result |
| step 1 | start monitors: each monitor will run with independently process Result: The monitor info will be collected. |
| step 2 | do attacker: connect the host through SSH, and then execute the kill process script with param value specified by “process_name” Result: Process will be killed. |
| step 3 | stop monitors after a period of time specified by “waiting_time” Result: The monitor info will be aggregated. |
| step 4 | verify the SLA Result: The test case is passed or not. |
| post-action | It is the action when the test cases exist. It will check the status of the specified process on the host, and restart the process if it is not running for next test cases |
| test verdict | Fails only if SLA is not passed, or if there is a test case execution problem. |
13.3.1.7. Yardstick Test Case Description TC049
| Control Node Openstack Service High Availability - Swift Proxy | |
| test case id | OPNFV_YARDSTICK_TC049: Control node Openstack service down - swift proxy |
| test purpose | This test case will verify the high availability of the storage service provided by OpenStack (swift-proxy) on control node. |
| test method | This test case kills the processes of swift-proxy service on a selected control node, then checks whether the request of the related Openstack command is OK and the killed processes are recovered. |
| attackers | In this test case, an attacker called “kill-process” is needed. This attacker includes three parameters: 1) fault_type: which is used for finding the attacker’s scripts. It should be always set to “kill-process” in this test case. 2) process_name: which is the process name of the specified OpenStack service. If there are multiple processes use the same name on the host, all of them are killed by this attacker. In this case. This parameter should always set to “swift- proxy”. 3) host: which is the name of a control node being attacked. e.g. -fault_type: “kill-process” -process_name: “swift-proxy” -host: node1 |
| monitors | In this test case, two kinds of monitor are needed: 1. the “openstack-cmd” monitor constantly request a specific Openstack command, which needs two parameters: 1) monitor_type: which is used for finding the monitor class and related scritps. It should be always set to “openstack-cmd” for this monitor. 2) command_name: which is the command name used for request. In this case, the command name should be swift related commands. 2. the “process” monitor check whether a process is running on a specific node, which needs three parameters: 1) monitor_type: which used for finding the monitor class and related scritps. It should be always set to “process” for this monitor. 2) process_name: which is the process name for monitor 3) host: which is the name of the node runing the process e.g. monitor1: -monitor_type: “openstack-cmd” -command_name: “swift stat” monitor2: -monitor_type: “process” -process_name: “swift-proxy” -host: node1 |
| metrics | In this test case, there are two metrics: 1)service_outage_time: which indicates the maximum outage time (seconds) of the specified Openstack command request. 2)process_recover_time: which indicates the maximun time (seconds) from the process being killed to recovered |
| test tool | Developed by the project. Please see folder: “yardstick/benchmark/scenarios/availability/ha_tools” |
| references | ETSI NFV REL001 |
| configuration | This test case needs two configuration files: 1) test case file: opnfv_yardstick_tc049.yaml -Attackers: see above “attackers” discription -waiting_time: which is the time (seconds) from the process being killed to stoping monitors the monitors -Monitors: see above “monitors” discription -SLA: see above “metrics” discription 2)POD file: pod.yaml The POD configuration should record on pod.yaml first. the “host” item in this test case will use the node name in the pod.yaml. |
| test sequence | description and expected result |
| step 1 | start monitors: each monitor will run with independently process Result: The monitor info will be collected. |
| step 2 | do attacker: connect the host through SSH, and then execute the kill process script with param value specified by “process_name” Result: Process will be killed. |
| step 3 | stop monitors after a period of time specified by “waiting_time” Result: The monitor info will be aggregated. |
| step 4 | verify the SLA Result: The test case is passed or not. |
| post-action | It is the action when the test cases exist. It will check the status of the specified process on the host, and restart the process if it is not running for next test cases |
| test verdict | Fails only if SLA is not passed, or if there is a test case execution problem. |
13.3.1.8. Yardstick Test Case Description TC050
| OpenStack Controller Node Network High Availability | |
| test case id | OPNFV_YARDSTICK_TC050: OpenStack Controller Node Network High Availability |
| test purpose | This test case will verify the high availability of control node. When one of the controller failed to connect the network, which breaks down the Openstack services on this node. These Openstack service should able to be accessed by other controller nodes, and the services on failed controller node should be isolated. |
| test method | This test case turns off the network interfaces of a specified control node, then checks whether all services provided by the control node are OK with some monitor tools. |
| attackers | In this test case, an attacker called “close-interface” is needed. This attacker includes three parameters: 1) fault_type: which is used for finding the attacker’s scripts. It should be always set to “close-interface” in this test case. 2) host: which is the name of a control node being attacked. 3) interface: the network interface to be turned off. There are four instance of the “close-interface” monitor: attacker1(for public netork): -fault_type: “close-interface” -host: node1 -interface: “br-ex” attacker2(for management netork): -fault_type: “close-interface” -host: node1 -interface: “br-mgmt” attacker3(for storage netork): -fault_type: “close-interface” -host: node1 -interface: “br-storage” attacker4(for private netork): -fault_type: “close-interface” -host: node1 -interface: “br-mesh” |
| monitors | In this test case, the monitor named “openstack-cmd” is needed. The monitor needs needs two parameters: 1) monitor_type: which is used for finding the monitor class and related scritps. It should be always set to “openstack-cmd” for this monitor. 2) command_name: which is the command name used for request There are four instance of the “openstack-cmd” monitor: monitor1: -monitor_type: “openstack-cmd” -command_name: “nova image-list” monitor2: -monitor_type: “openstack-cmd” -command_name: “neutron router-list” monitor3: -monitor_type: “openstack-cmd” -command_name: “heat stack-list” monitor4: -monitor_type: “openstack-cmd” -command_name: “cinder list” |
| metrics | In this test case, there is one metric: 1)service_outage_time: which indicates the maximum outage time (seconds) of the specified Openstack command request. |
| test tool | Developed by the project. Please see folder: “yardstick/benchmark/scenarios/availability/ha_tools” |
| references | ETSI NFV REL001 |
| configuration | This test case needs two configuration files: 1) test case file: opnfv_yardstick_tc050.yaml -Attackers: see above “attackers” discription -waiting_time: which is the time (seconds) from the process being killed to stoping monitors the monitors -Monitors: see above “monitors” discription -SLA: see above “metrics” discription 2)POD file: pod.yaml The POD configuration should record on pod.yaml first. the “host” item in this test case will use the node name in the pod.yaml. |
| test sequence | description and expected result |
| step 1 | start monitors: each monitor will run with independently process Result: The monitor info will be collected. |
| step 2 | do attacker: connect the host through SSH, and then execute the turnoff network interface script with param value specified by “interface”. Result: Network interfaces will be turned down. |
| step 3 | stop monitors after a period of time specified by “waiting_time” Result: The monitor info will be aggregated. |
| step 4 | verify the SLA Result: The test case is passed or not. |
| post-action | It is the action when the test cases exist. It turns up the network interface of the control node if it is not turned up. |
| test verdict | Fails only if SLA is not passed, or if there is a test case execution problem. |
13.3.1.9. Yardstick Test Case Description TC051
| OpenStack Controller Node CPU Overload High Availability | |
| test case id | OPNFV_YARDSTICK_TC051: OpenStack Controller Node CPU Overload High Availability |
| test purpose | This test case will verify the high availability of control node. When the CPU usage of a specified controller node is stressed to 100%, which breaks down the Openstack services on this node. These Openstack service should able to be accessed by other controller nodes, and the services on failed controller node should be isolated. |
| test method | This test case stresses the CPU uasge of a specified control node to 100%, then checks whether all services provided by the environment are OK with some monitor tools. |
| attackers | In this test case, an attacker called “stress-cpu” is needed. This attacker includes two parameters: 1) fault_type: which is used for finding the attacker’s scripts. It should be always set to “stress-cpu” in this test case. 2) host: which is the name of a control node being attacked. e.g. -fault_type: “stress-cpu” -host: node1 |
| monitors | In this test case, the monitor named “openstack-cmd” is needed. The monitor needs needs two parameters: 1) monitor_type: which is used for finding the monitor class and related scritps. It should be always set to “openstack-cmd” for this monitor. 2) command_name: which is the command name used for request There are four instance of the “openstack-cmd” monitor: monitor1: -monitor_type: “openstack-cmd” -command_name: “nova image-list” monitor2: -monitor_type: “openstack-cmd” -command_name: “neutron router-list” monitor3: -monitor_type: “openstack-cmd” -command_name: “heat stack-list” monitor4: -monitor_type: “openstack-cmd” -command_name: “cinder list” |
| metrics | In this test case, there is one metric: 1)service_outage_time: which indicates the maximum outage time (seconds) of the specified Openstack command request. |
| test tool | Developed by the project. Please see folder: “yardstick/benchmark/scenarios/availability/ha_tools” |
| references | ETSI NFV REL001 |
| configuration | This test case needs two configuration files: 1) test case file: opnfv_yardstick_tc051.yaml -Attackers: see above “attackers” discription -waiting_time: which is the time (seconds) from the process being killed to stoping monitors the monitors -Monitors: see above “monitors” discription -SLA: see above “metrics” discription 2)POD file: pod.yaml The POD configuration should record on pod.yaml first. the “host” item in this test case will use the node name in the pod.yaml. |
| test sequence | description and expected result |
| step 1 | start monitors: each monitor will run with independently process Result: The monitor info will be collected. |
| step 2 | do attacker: connect the host through SSH, and then execute the stress cpu script on the host. Result: The CPU usage of the host will be stressed to 100%. |
| step 3 | stop monitors after a period of time specified by “waiting_time” Result: The monitor info will be aggregated. |
| step 4 | verify the SLA Result: The test case is passed or not. |
| post-action | It is the action when the test cases exist. It kills the process that stresses the CPU usage. |
| test verdict | Fails only if SLA is not passed, or if there is a test case execution problem. |
13.3.1.10. Yardstick Test Case Description TC052
| OpenStack Controller Node Disk I/O Block High Availability | |
| test case id | OPNFV_YARDSTICK_TC052: OpenStack Controller Node Disk I/O Block High Availability |
| test purpose | This test case will verify the high availability of control node. When the disk I/O of a specified disk is blocked, which breaks down the Openstack services on this node. Read and write services should still be accessed by other controller nodes, and the services on failed controller node should be isolated. |
| test method | This test case blocks the disk I/O of a specified control node, then checks whether the services that need to read or wirte the disk of the control node are OK with some monitor tools. |
| attackers | In this test case, an attacker called “disk-block” is needed. This attacker includes two parameters: 1) fault_type: which is used for finding the attacker’s scripts. It should be always set to “disk-block” in this test case. 2) host: which is the name of a control node being attacked. e.g. -fault_type: “disk-block” -host: node1 |
| monitors | In this test case, two kinds of monitor are needed: 1. the “openstack-cmd” monitor constantly request a specific Openstack command, which needs two parameters: 1) monitor_type: which is used for finding the monitor class and related scripts. It should be always set to “openstack-cmd” for this monitor. 2) command_name: which is the command name used for request. e.g. -monitor_type: “openstack-cmd” -command_name: “nova flavor-list” 2. the second monitor verifies the read and write function by a “operation” and a “result checker”. the “operation” have two parameters: 1) operation_type: which is used for finding the operation class and related scripts. 2) action_parameter: parameters for the operation. the “result checker” have three parameters: 1) checker_type: which is used for finding the reuslt checker class and realted scripts. 2) expectedValue: the expected value for the output of the checker script. 3) condition: whether the expected value is in the output of checker script or is totally same with the output. In this case, the “operation” adds a flavor and the “result checker” checks whether ths flavor is created. Their parameters show as follows: operation: -operation_type: “nova-create-flavor” -action_parameter:
result checker: -checker_type: “check-flavor” -expectedValue: “test-001” -condition: “in” |
| metrics | In this test case, there is one metric: 1)service_outage_time: which indicates the maximum outage time (seconds) of the specified Openstack command request. |
| test tool | Developed by the project. Please see folder: “yardstick/benchmark/scenarios/availability/ha_tools” |
| references | ETSI NFV REL001 |
| configuration | This test case needs two configuration files: 1) test case file: opnfv_yardstick_tc052.yaml -Attackers: see above “attackers” discription -waiting_time: which is the time (seconds) from the process being killed to stoping monitors the monitors -Monitors: see above “monitors” discription -SLA: see above “metrics” discription 2)POD file: pod.yaml The POD configuration should record on pod.yaml first. the “host” item in this test case will use the node name in the pod.yaml. |
| test sequence | description and expected result |
| step 1 | do attacker: connect the host through SSH, and then execute the block disk I/O script on the host. Result: The disk I/O of the host will be blocked |
| step 2 | start monitors: each monitor will run with independently process Result: The monitor info will be collected. |
| step 3 | do operation: add a flavor |
| step 4 | do result checker: check whether the falvor is created |
| step 5 | stop monitors after a period of time specified by “waiting_time” Result: The monitor info will be aggregated. |
| step 6 | verify the SLA Result: The test case is passed or not. |
| post-action | It is the action when the test cases exist. It excutes the release disk I/O script to release the blocked I/O. |
| test verdict | Fails if monnitor SLA is not passed or the result checker is not passed, or if there is a test case execution problem. |
13.3.1.11. Yardstick Test Case Description TC053
| OpenStack Controller Load Balance Service High Availability | |
| test case id | OPNFV_YARDSTICK_TC053: OpenStack Controller Load Balance Service High Availability |
| test purpose | This test case will verify the high availability of the load balance service(current is HAProxy) that supports OpenStack on controller node. When the load balance service of a specified controller node is killed, whether other load balancers on other controller nodes will work, and whether the controller node will restart the load balancer are checked. |
| test method | This test case kills the processes of load balance service on a selected control node, then checks whether the request of the related Openstack command is OK and the killed processes are recovered. |
| attackers | In this test case, an attacker called “kill-process” is needed. This attacker includes three parameters: 1) fault_type: which is used for finding the attacker’s scripts. It should be always set to “kill-process” in this test case. 2) process_name: which is the process name of the specified OpenStack service. If there are multiple processes use the same name on the host, all of them are killed by this attacker. In this case. This parameter should always set to “swift- proxy”. 3) host: which is the name of a control node being attacked. e.g. -fault_type: “kill-process” -process_name: “haproxy” -host: node1 |
| monitors | In this test case, two kinds of monitor are needed: 1. the “openstack-cmd” monitor constantly request a specific Openstack command, which needs two parameters: 1) monitor_type: which is used for finding the monitor class and related scritps. It should be always set to “openstack-cmd” for this monitor. 2) command_name: which is the command name used for request. 2. the “process” monitor check whether a process is running on a specific node, which needs three parameters: 1) monitor_type: which used for finding the monitor class and related scripts. It should be always set to “process” for this monitor. 2) process_name: which is the process name for monitor 3) host: which is the name of the node runing the process In this case, the command_name of monitor1 should be services that is supported by load balancer and the process- name of monitor2 should be “haproxy”, for example: e.g. monitor1: -monitor_type: “openstack-cmd” -command_name: “nova image-list” monitor2: -monitor_type: “process” -process_name: “haproxy” -host: node1 |
| metrics | In this test case, there are two metrics: 1)service_outage_time: which indicates the maximum outage time (seconds) of the specified Openstack command request. 2)process_recover_time: which indicates the maximun time (seconds) from the process being killed to recovered |
| test tool | Developed by the project. Please see folder: “yardstick/benchmark/scenarios/availability/ha_tools” |
| references | ETSI NFV REL001 |
| configuration | This test case needs two configuration files: 1) test case file: opnfv_yardstick_tc053.yaml -Attackers: see above “attackers” discription -waiting_time: which is the time (seconds) from the process being killed to stoping monitors the monitors -Monitors: see above “monitors” discription -SLA: see above “metrics” discription 2)POD file: pod.yaml The POD configuration should record on pod.yaml first. the “host” item in this test case will use the node name in the pod.yaml. |
| test sequence | description and expected result |
| step 1 | start monitors: each monitor will run with independently process Result: The monitor info will be collected. |
| step 2 | do attacker: connect the host through SSH, and then execute the kill process script with param value specified by “process_name” Result: Process will be killed. |
| step 3 | stop monitors after a period of time specified by “waiting_time” Result: The monitor info will be aggregated. |
| step 4 | verify the SLA Result: The test case is passed or not. |
| post-action | It is the action when the test cases exist. It will check the status of the specified process on the host, and restart the process if it is not running for next test cases. |
| test verdict | Fails only if SLA is not passed, or if there is a test case execution problem. |
13.3.1.12. Yardstick Test Case Description TC054
| OpenStack Virtual IP High Availability | |
| test case id | OPNFV_YARDSTICK_TC054: OpenStack Virtual IP High Availability |
| test purpose | This test case will verify the high availability for virtual ip in the environment. When master node of virtual ip is abnormally shutdown, connection to virtual ip and the services binded to the virtual IP it should be OK. |
| test method | This test case shutdowns the virtual IP master node with some fault injection tools, then checks whether virtual ips can be pinged and services binded to virtual ip are OK with some monitor tools. |
| attackers | In this test case, an attacker called “control-shutdown” is needed. This attacker includes two parameters: 1) fault_type: which is used for finding the attacker’s scripts. It should be always set to “control-shutdown” in this test case. 2) host: which is the name of a control node being attacked. In this case the host should be the virtual ip master node, that means the host ip is the virtual ip, for exapmle: -fault_type: “control-shutdown” -host: node1(the VIP Master node) |
| monitors | In this test case, two kinds of monitor are needed: 1. the “ip_status” monitor that pings a specific ip to check the connectivity of this ip, which needs two parameters: 1) monitor_type: which is used for finding the monitor class and related scripts. It should be always set to “ip_status” for this monitor. 2) ip_address: The ip to be pinged. In this case, ip_address should be the virtual IP. 2. the “openstack-cmd” monitor constantly request a specific Openstack command, which needs two parameters: 1) monitor_type: which is used for finding the monitor class and related scripts. It should be always set to “openstack-cmd” for this monitor. 2) command_name: which is the command name used for request. e.g. monitor1: -monitor_type: “ip_status” -host: 192.168.0.2 monitor2: -monitor_type: “openstack-cmd” -command_name: “nova image-list” |
| metrics | In this test case, there are two metrics: 1) ping_outage_time: which-indicates the maximum outage time to ping the specified host. 2)service_outage_time: which indicates the maximum outage time (seconds) of the specified Openstack command request. |
| test tool | Developed by the project. Please see folder: “yardstick/benchmark/scenarios/availability/ha_tools” |
| references | ETSI NFV REL001 |
| configuration | This test case needs two configuration files: 1) test case file: opnfv_yardstick_tc054.yaml -Attackers: see above “attackers” discription -waiting_time: which is the time (seconds) from the process being killed to stoping monitors the monitors -Monitors: see above “monitors” discription -SLA: see above “metrics” discription 2)POD file: pod.yaml The POD configuration should record on pod.yaml first. the “host” item in this test case will use the node name in the pod.yaml. |
| test sequence | description and expected result |
| step 1 | start monitors: each monitor will run with independently process Result: The monitor info will be collected. |
| step 2 | do attacker: connect the host through SSH, and then execute the shutdown script on the VIP master node. Result: VIP master node will be shutdown |
| step 3 | stop monitors after a period of time specified by “waiting_time” Result: The monitor info will be aggregated. |
| step 4 | verify the SLA Result: The test case is passed or not. |
| post-action | It is the action when the test cases exist. It restarts the original VIP master node if it is not restarted. |
| test verdict | Fails only if SLA is not passed, or if there is a test case execution problem. |
13.3.2. IPv6
13.3.2.1. Yardstick Test Case Description TC027
| IPv6 connectivity between nodes on the tenant network | |
| test case id | OPNFV_YARDSTICK_TC027_IPv6 connectivity |
| metric | RTT, Round Trip Time |
| test purpose | To do a basic verification that IPv6 connectivity is within acceptable boundaries when ipv6 packets travel between hosts located on same or different compute blades. The purpose is also to be able to spot trends. Test results, graphs and similar shall be stored for comparison reasons and product evolution understanding between different OPNFV versions and/or configurations. |
| configuration | file: opnfv_yardstick_tc027.yaml Packet size 56 bytes. SLA RTT is set to maximum 30 ms. ipv6 test case can be configured as three independent modules (setup, run, teardown). if you only want to setup ipv6 testing environment, do some tests as you want, “run_step” of task yaml file should be configured as “setup”. if you want to setup and run ping6 testing automatically, “run_step” should be configured as “setup, run”. and if you have had a environment which has been setup, you only wan to verify the connectivity of ipv6 network, “run_step” should be “run”. Of course, default is that three modules run sequentially. |
| test tool | ping6 Ping6 is normally part of Linux distribution, hence it doesn’t need to be installed. |
| references |
ETSI-NFV-TST001 |
| applicability | Test case can be configured with different run step you can run setup, run benchmark, teardown independently SLA is optional. The SLA in this test case serves as an example. Considerably lower RTT is expected. |
| pre-test conditions | The test case image needs to be installed into Glance with ping6 included in it. For Brahmaputra, a compass_os_nosdn_ha deploy scenario is need. more installer and more sdn deploy scenario will be supported soon |
| test sequence | description and expected result |
| step 1 | To setup IPV6 testing environment: 1. disable security group 2. create (ipv6, ipv4) router, network and subnet 3. create VRouter, VM1, VM2 |
| step 2 | To run ping6 to verify IPV6 connectivity : 1. ssh to VM1 2. Ping6 to ipv6 router from VM1 3. Get the result(RTT) and logs are stored |
| step 3 | To teardown IPV6 testing environment 1. delete VRouter, VM1, VM2 2. delete (ipv6, ipv4) router, network and subnet 3. enable security group |
| test verdict | Test should not PASS if any RTT is above the optional SLA value, or if there is a test case execution problem. |
13.3.3. KVM
13.3.3.1. Yardstick Test Case Description TC028
| KVM Latency measurements | |
| test case id | OPNFV_YARDSTICK_TC028_KVM Latency measurements |
| metric | min, avg and max latency |
| test purpose | To evaluate the IaaS KVM virtualization capability with regards to min, avg and max latency. The purpose is also to be able to spot trends. Test results, graphs and similar shall be stored for comparison reasons and product evolution understanding between different OPNFV versions and/or configurations. |
| configuration | file: samples/cyclictest-node-context.yaml |
| test tool | Cyclictest (Cyclictest is not always part of a Linux distribution, hence it needs to be installed. As an example see the /yardstick/tools/ directory for how to generate a Linux image with cyclictest included.) |
| references | Cyclictest |
| applicability | This test case is mainly for kvm4nfv project CI verify. Upgrade host linux kernel, boot a gust vm update it’s linux kernel, and then run the cyclictest to test the new kernel is work well. |
| pre-test conditions | The test kernel rpm, test sequence scripts and test guest image need put the right folders as specified in the test case yaml file. The test guest image needs with cyclictest included in it. No POD specific requirements have been identified. |
| test sequence | description and expected result |
| step 1 | The host and guest os kernel is upgraded. Cyclictest is invoked and logs are produced and stored. Result: Logs are stored. |
| test verdict | Fails only if SLA is not passed, or if there is a test case execution problem. |
13.3.4. Parser
13.3.4.1. Yardstick Test Case Description TC040
| Verify Parser Yang-to-Tosca | |
| test case id | OPNFV_YARDSTICK_TC040 Verify Parser Yang-to-Tosca |
| metric |
|
| test purpose | To verify the function of Yang-to-Tosca in Parser. |
| configuration | file: opnfv_yardstick_tc040.yaml yangfile: the path of the yangfile which you want to convert toscafile: the path of the toscafile which is your expected outcome. |
| test tool | Parser (Parser is not part of a Linux distribution, hence it needs to be installed. As an example see the /yardstick/benchmark/scenarios/parser/parser_setup.sh for how to install it manual. Of course, it will be installed and uninstalled automatically when you run this test case by yardstick) |
| references | Parser |
| applicability | Test can be configured with different path of yangfile and toscafile to fit your real environment to verify Parser |
| pre-test conditions | No POD specific requirements have been identified. it can be run without VM |
| test sequence | description and expected result |
| step 1 | parser is installed without VM, running Yang-to-Tosca module to convert yang file to tosca file, validating output against expected outcome. Result: Logs are stored. |
| test verdict | Fails only if output is different with expected outcome or if there is a test case execution problem. |
13.3.4.2. Yardstick Test Case Description TC074
| Storperf | |
| test case id | OPNFV_YARDSTICK_TC074_Storperf |
| metric | Storage performance |
| test purpose | Storperf integration with yardstick. The purpose of StorPerf is to provide a tool to measure block and object storage performance in an NFVI. When complemented with a characterization of typical VF storage performance requirements, it can provide pass/fail thresholds for test, staging, and production NFVI environments. The benchmarks developed for block and object storage will be sufficiently varied to provide a good preview of expected storage performance behavior for any type of VNF workload. |
| configuration | file: opnfv_yardstick_tc074.yaml
|
| test tool |
StorPerf is a tool to measure block and object storage performance in an NFVI. StorPerf is delivered as a Docker container from https://hub.docker.com/r/opnfv/storperf/tags/. |
| references |
ETSI-NFV-TST001 |
| applicability | Test can be configured with different:
|
| pre-test conditions | If you do not have an Ubuntu 14.04 image in Glance, you will need to add one. A key pair for launching agents is also required. Storperf is required to be installed in the environment. There are two possible methods for Storperf installation:
Running StorPerf on Jump Host Requirements:
Running StorPerf in a VM Requirements:
No POD specific requirements have been identified. |
| test sequence | description and expected result |
| step 1 | The Storperf is installed and Ubuntu 14.04 image is stored in glance. TC is invoked and logs are produced and stored. Result: Logs are stored. |
| test verdict | None. Storage performance results are fetched and stored. |
13.3.5. virtual Traffic Classifier
13.3.5.1. Yardstick Test Case Description TC006
| Volume storage Performance | |
| test case id | OPNFV_YARDSTICK_TC006_VOLUME STORAGE PERFORMANCE |
| metric | IOPS (Average IOs performed per second), Throughput (Average disk read/write bandwidth rate), Latency (Average disk read/write latency) |
| test purpose | The purpose of TC006 is to evaluate the IaaS volume storage performance with regards to IOPS, throughput and latency. The purpose is also to be able to spot the trends. Test results, graphs and similar shall be stored for comparison reasons and product evolution understanding between different OPNFV versions and/or configurations. |
| test tool | fio fio is an I/O tool meant to be used both for benchmark and stress/hardware verification. It has support for 19 different types of I/O engines (sync, mmap, libaio, posixaio, SG v3, splice, null, network, syslet, guasi, solarisaio, and more), I/O priorities (for newer Linux kernels), rate I/O, forked or threaded jobs, and much more. (fio is not always part of a Linux distribution, hence it needs to be installed. As an example see the /yardstick/tools/ directory for how to generate a Linux image with fio included.) |
| test description | fio test is invoked in a host VM with a volume attached on a compute blade, a job file as well as parameters are passed to fio and fio will start doing what the job file tells it to do. |
| configuration | file: opnfv_yardstick_tc006.yaml Fio job file is provided to define the benchmark process Target volume is mounted at /FIO_Test directory For SLA, minimum read/write iops is set to 100, minimum read/write throughput is set to 400 KB/s, and maximum read/write latency is set to 20000 usec. |
| applicability | This test case can be configured with different:
SLA is optional. The SLA in this test case serves as an example. Considerably higher throughput and lower latency are expected. However, to cover most configurations, both baremetal and fully virtualized ones, this value should be possible to achieve and acceptable for black box testing. Many heavy IO applications start to suffer badly if the read/write bandwidths are lower than this. |
| usability | This test case is one of Yardstick’s generic test. Thus it is runnable on most of the scenarios. |
| references |
ETSI-NFV-TST001 |
| pre-test conditions | The test case image needs to be installed into Glance with fio included in it. No POD specific requirements have been identified. |
| test sequence | description and expected result |
| step 1 | A host VM with fio installed is booted. A 200G volume is attached to the host VM |
| step 2 | Yardstick is connected with the host VM by using ssh. ‘job_file.ini’ is copyied from Jump Host to the host VM via the ssh tunnel. The attached volume is formated and mounted. |
| step 3 | Fio benchmark is invoked. Simulated IO operations are started. IOPS, disk read/write bandwidth and latency are recorded and checked against the SLA. Logs are produced and stored. Result: Logs are stored. |
| step 4 | The host VM is deleted. |
| test verdict | Fails only if SLA is not passed, or if there is a test case execution problem. |
13.4. Templates
13.4.1. Yardstick Test Case Description TCXXX
| test case slogan e.g. Network Latency | |
| test case id | e.g. OPNFV_YARDSTICK_TC001_NW Latency |
| metric | what will be measured, e.g. latency |
| test purpose | describe what is the purpose of the test case |
| configuration | what .yaml file to use, state SLA if applicable, state test duration, list and describe the scenario options used in this TC and also list the options using default values. |
| test tool | e.g. ping |
| references | e.g. RFCxxx, ETSI-NFVyyy |
| applicability | describe variations of the test case which can be performend, e.g. run the test for different packet sizes |
| pre-test conditions | describe configuration in the tool(s) used to perform the measurements (e.g. fio, pktgen), POD-specific configuration required to enable running the test |
| test sequence | description and expected result |
| step 1 | use this to describe tests that require sveveral steps e.g collect logs. Result: what happens in this step e.g. logs collected |
| step 2 | remove interface Result: interface down. |
| step N | what is done in step N Result: what happens |
| test verdict | expected behavior, or SLA, pass/fail criteria |
13.4.2. Task Template Syntax
13.4.2.1. Basic template syntax
A nice feature of the input task format used in Yardstick is that it supports the template syntax based on Jinja2. This turns out to be extremely useful when, say, you have a fixed structure of your task but you want to parameterize this task in some way. For example, imagine your input task file (task.yaml) runs a set of Ping scenarios:
# Sample benchmark task config file
# measure network latency using ping
schema: "yardstick:task:0.1"

scenarios:
-
  type: Ping
  options:
    packetsize: 200
  host: athena.demo
  target: ares.demo

  runner:
    type: Duration
    duration: 60
    interval: 1

  sla:
    max_rtt: 10
    action: monitor

context:
    ...
Let’s say you want to run the same set of scenarios with the same runner/ context/sla, but you want to try another packetsize to compare the performance. The most elegant solution is then to turn the packetsize name into a template variable:
# Sample benchmark task config file
# measure network latency using ping

schema: "yardstick:task:0.1"
scenarios:
-
  type: Ping
  options:
    packetsize: {{packetsize}}
  host: athena.demo
  target: ares.demo

  runner:
    type: Duration
    duration: 60
    interval: 1

  sla:
    max_rtt: 10
    action: monitor

context:
    ...
and then pass the argument value for {{packetsize}} when starting a task with this configuration file. Yardstick provides you with different ways to do that:
1.Pass the argument values directly in the command-line interface (with either a JSON or YAML dictionary):
yardstick task start samples/ping-template.yaml
--task-args'{"packetsize":"200"}'
2.Refer to a file that specifies the argument values (JSON/YAML):
yardstick task start samples/ping-template.yaml --task-args-file args.yaml
13.4.2.2. Using the default values
Note that the Jinja2 template syntax allows you to set the default values for your parameters. With default values set, your task file will work even if you don’t parameterize it explicitly while starting a task. The default values should be set using the {% set ... %} clause (task.yaml). For example:
# Sample benchmark task config file
# measure network latency using ping
schema: "yardstick:task:0.1"
{% set packetsize = packetsize or "100" %}
scenarios:
-
  type: Ping
  options:
  packetsize: {{packetsize}}
  host: athena.demo
  target: ares.demo

  runner:
    type: Duration
    duration: 60
    interval: 1
  ...
If you don’t pass the value for {{packetsize}} while starting a task, the default one will be used.
13.4.2.3. Advanced templates
Yardstick makes it possible to use all the power of Jinja2 template syntax, including the mechanism of built-in functions. As an example, let us make up a task file that will do a block storage performance test. The input task file (fio-template.yaml) below uses the Jinja2 for-endfor construct to accomplish that:
#Test block sizes of 4KB, 8KB, 64KB, 1MB
#Test 5 workloads: read, write, randwrite, randread, rw
schema: "yardstick:task:0.1"

 scenarios:
{% for bs in ['4k', '8k', '64k', '1024k' ] %}
  {% for rw in ['read', 'write', 'randwrite', 'randread', 'rw' ] %}
-
  type: Fio
  options:
    filename: /home/ubuntu/data.raw
    bs: {{bs}}
    rw: {{rw}}
    ramp_time: 10
  host: fio.demo
  runner:
    type: Duration
    duration: 60
    interval: 60

  {% endfor %}
{% endfor %}
context
    ...
14. Glossary
- API
- Application Programming Interface
- DPDK
- Data Plane Development Kit
- DPI
- Deep Packet Inspection
- DSCP
- Differentiated Services Code Point
- IGMP
- Internet Group Management Protocol
- IOPS
- Input/Output Operations Per Second
- NFVI
- Network Function Virtualization Infrastructure
- NIC
- Network Interface Controller
- PBFS
- Packet Based per Flow State
- QoS
- Quality of Service
- SR-IOV
- Single Root IO Virtualization
- SUT
- System Under Test
- ToS
- Type of Service
- VLAN
- Virtual LAN
- VM
- Virtual Machine
- VNF
- Virtual Network Function
- VNFC
- Virtual Network Function Component
- VTC
- Virtual Traffic Classifier
15. References
15.1. OPNFV
- Parser wiki: https://wiki.opnfv.org/parser
- Pharos wiki: https://wiki.opnfv.org/pharos
- VTC: https://wiki.opnfv.org/vtc
- Yardstick CI: https://build.opnfv.org/ci/view/yardstick/
- Yardstick and ETSI TST001 presentation: https://wiki.opnfv.org/display/yardstick/Yardstick?preview=%2F2925202%2F2925205%2Fopnfv_summit_-_bridging_opnfv_and_etsi.pdf
- Yardstick Project presentation: https://wiki.opnfv.org/display/yardstick/Yardstick?preview=%2F2925202%2F2925208%2Fopnfv_summit_-_yardstick_project.pdf
- Yardstick wiki: https://wiki.opnfv.org/yardstick
15.2. References used in Test Cases
- cachestat: https://github.com/brendangregg/perf-tools/tree/master/fs
- cirros-image: https://download.cirros-cloud.net
- cyclictest: https://rt.wiki.kernel.org/index.php/Cyclictest
- DPDKpktgen: https://github.com/Pktgen/Pktgen-DPDK/
- DPDK supported NICs: http://dpdk.org/doc/nics
- fdisk: http://www.tldp.org/HOWTO/Partition/fdisk_partitioning.html
- fio: http://www.bluestop.org/fio/HOWTO.txt
- free: http://manpages.ubuntu.com/manpages/trusty/en/man1/free.1.html
- iperf3: https://iperf.fr/
- iostat: http://linux.die.net/man/1/iostat
- Lmbench man-pages: http://manpages.ubuntu.com/manpages/trusty/lat_mem_rd.8.html
- Memory bandwidth man-pages: http://manpages.ubuntu.com/manpages/trusty/bw_mem.8.html
- mpstat man-pages: http://manpages.ubuntu.com/manpages/trusty/man1/mpstat.1.html
- netperf: http://www.netperf.org/netperf/training/Netperf.html
- pktgen: https://www.kernel.org/doc/Documentation/networking/pktgen.txt
- RAMspeed: http://alasir.com/software/ramspeed/
- sar: http://linux.die.net/man/1/sar
- SR-IOV: https://wiki.openstack.org/wiki/SR-IOV-Passthrough-For-Networking
- Storperf: https://wiki.opnfv.org/display/storperf/Storperf
- unixbench: https://github.com/kdlucas/byte-unixbench/blob/master/UnixBench
15.3. Research
- NCSRD: http://www.demokritos.gr/?lang=en
- T-NOVA: http://www.t-nova.eu/
- T-NOVA Results: http://www.t-nova.eu/results/