Yardstick Overview
Introduction
Welcome to Yardstick’s documentation !
Yardstick is an OPNFV Project.
The project’s goal is to verify infrastructure compliance, from the perspective of a Virtual Network Function (VNF).
The Project’s scope is the development of a test framework, Yardstick, test cases and test stimuli to enable Network Function Virtualization Infrastructure (NFVI) verification. The Project also includes a sample VNF, the Virtual Traffic Classifier (VTC) and its experimental framework, ApexLake !
Yardstick is used in OPNFV for verifying the OPNFV infrastructure and some of the OPNFV features. The Yardstick framework is deployed in several OPNFV community labs. It is installer, infrastructure and application independent.
See also
Pharos for information on OPNFV community labs and this Presentation for an overview of Yardstick
About This Document
This document consists of the following chapters:
- Chapter Methodology describes the methodology implemented by the Yardstick Project for NFVI verification.
- Chapter Architecture provides information on the software architecture of yardstick.
- Chapter Virtual Traffic Classifier provides information on the VTC.
- Chapter Apexlake Installation Guide provides instructions to install the experimental framework ApexLake and chapter Apexlake API Interface Definition explains how this framework is integrated in Yardstick.
- Chapter Yardstick Installation provides instructions to install Yardstick.
- Chapter Installing a plug-in into yardstick provides information on how to integrate other OPNFV testing projects into Yardstick.
- Chapter Store Other Project’s Test Results in InfluxDB provides inforamtion on how to run plug-in test cases and store test results into community’s InfluxDB.
- Chapter Yardstick Test Cases includes a list of available Yardstick test cases.
Contact Yardstick
Feedback? Contact us
Methodology
Abstract
This chapter describes the methodology implemented by the Yardstick project for verifying the NFVI from the perspective of a VNF.
ETSI-NFV
The document ETSI GS NFV-TST001, “Pre-deployment Testing; Report on Validation of NFV Environments and Services”, recommends methods for pre-deployment testing of the functional components of an NFV environment.
The Yardstick project implements the methodology described in chapter 6, “Pre- deployment validation of NFV infrastructure”.
The methodology consists in decomposing the typical VNF work-load performance metrics into a number of characteristics/performance vectors, which each can be represented by distinct test-cases.
The methodology includes five steps:
- Step1: Define Infrastruture - the Hardware, Software and corresponding
configuration target for validation; the OPNFV infrastructure, in OPNFV community labs.
- Step2: Identify VNF type - the application for which the
infrastructure is to be validated, and its requirements on the underlying infrastructure.
- Step3: Select test cases - depending on the workload that represents the
application for which the infrastruture is to be validated, the relevant test cases amongst the list of available Yardstick test cases.
- Step4: Execute tests - define the duration and number of iterations for the
selected test cases, tests runs are automated via OPNFV Jenkins Jobs.
Step5: Collect results - using the common API for result collection.
See also
Yardsticktst for material on alignment ETSI TST001 and Yardstick.
Metrics
The metrics, as defined by ETSI GS NFV-TST001, are shown in Table1, Table2 and Table3.
In OPNFV Colorado release, generic test cases covering aspects of the listed metrics are available; further OPNFV releases will provide extended testing of these metrics. The view of available Yardstick test cases cross ETSI definitions in Table1, Table2 and Table3 is shown in Table4. It shall be noticed that the Yardstick test cases are examples, the test duration and number of iterations are configurable, as are the System Under Test (SUT) and the attributes (or, in Yardstick nomemclature, the scenario options).
Table 1 - Performance/Speed Metrics
| Category | Performance/Speed |
| Compute |
|
| Network |
|
| Storage |
|
Table 2 - Capacity/Scale Metrics
| Category | Capacity/Scale |
| Compute |
|
| Network |
|
| Storage |
|
Table 3 - Availability/Reliability Metrics
| Category | Availability/Reliability |
| Compute |
|
| Network |
|
| Storage |
|
Table 4 - Yardstick Generic Test Cases
| Category | Performance/Speed | Capacity/Scale | Availability/Reliability |
| Compute | TC003 [1] TC004 TC014 TC024 TC069 | TC003 [1] TC004 TC010 TC012 TC055 | TC013 [1] TC015 [1] |
| Network | TC001 TC002 TC011 TC073 | TC001 TC008 TC009 TC075 | TC016 [1] TC018 [1] |
| Storage | TC005 | TC005 TC063 | TC017 [1] |
Note
The description in this OPNFV document is intended as a reference for users to understand the scope of the Yardstick Project and the deliverables of the Yardstick framework. For complete description of the methodology, please refer to the ETSI document.
Footnotes
| [1] | (1, 2, 3, 4, 5, 6, 7) To be included in future deliveries. |
Architecture
Abstract
This chapter describes the yardstick framework software architecture. we will introduce it from Use-Case View, Logical View, Process View and Deployment View. More technical details will be introduced in this chapter.
Overview
Architecture overview
Yardstick is mainly written in Python, and test configurations are made in YAML. Documentation is written in reStructuredText format, i.e. .rst files. Yardstick is inspired by Rally. Yardstick is intended to run on a computer with access and credentials to a cloud. The test case is described in a configuration file given as an argument.
How it works: the benchmark task configuration file is parsed and converted into an internal model. The context part of the model is converted into a Heat template and deployed into a stack. Each scenario is run using a runner, either serially or in parallel. Each runner runs in its own subprocess executing commands in a VM using SSH. The output of each scenario is written as json records to a file or influxdb or http server, we use influxdb as the backend, the test result will be shown with grafana.
Concept
Benchmark - assess the relative performance of something
Benchmark configuration file - describes a single test case in yaml format
Context - The set of Cloud resources used by a scenario, such as user names, image names, affinity rules and network configurations. A context is converted into a simplified Heat template, which is used to deploy onto the Openstack environment.
Data - Output produced by running a benchmark, written to a file in json format
Runner - Logic that determines how a test scenario is run and reported, for example the number of test iterations, input value stepping and test duration. Predefined runner types exist for re-usage, see Runner types.
Scenario - Type/class of measurement for example Ping, Pktgen, (Iperf, LmBench, ...)
SLA - Relates to what result boundary a test case must meet to pass. For example a latency limit, amount or ratio of lost packets and so on. Action based on SLA can be configured, either just to log (monitor) or to stop further testing (assert). The SLA criteria is set in the benchmark configuration file and evaluated by the runner.
Runner types
There exists several predefined runner types to choose between when designing a test scenario:
Arithmetic: Every test run arithmetically steps the specified input value(s) in the test scenario, adding a value to the previous input value. It is also possible to combine several input values for the same test case in different combinations.
Snippet of an Arithmetic runner configuration:
runner:
    type: Arithmetic
    iterators:
    -
      name: stride
      start: 64
      stop: 128
      step: 64
Duration: The test runs for a specific period of time before completed.
Snippet of a Duration runner configuration:
runner:
  type: Duration
  duration: 30
Sequence: The test changes a specified input value to the scenario. The input values to the sequence are specified in a list in the benchmark configuration file.
Snippet of a Sequence runner configuration:
runner:
  type: Sequence
  scenario_option_name: packetsize
  sequence:
  - 100
  - 200
  - 250
Iteration: Tests are run a specified number of times before completed.
Snippet of an Iteration runner configuration:
runner:
  type: Iteration
  iterations: 2
Use-Case View
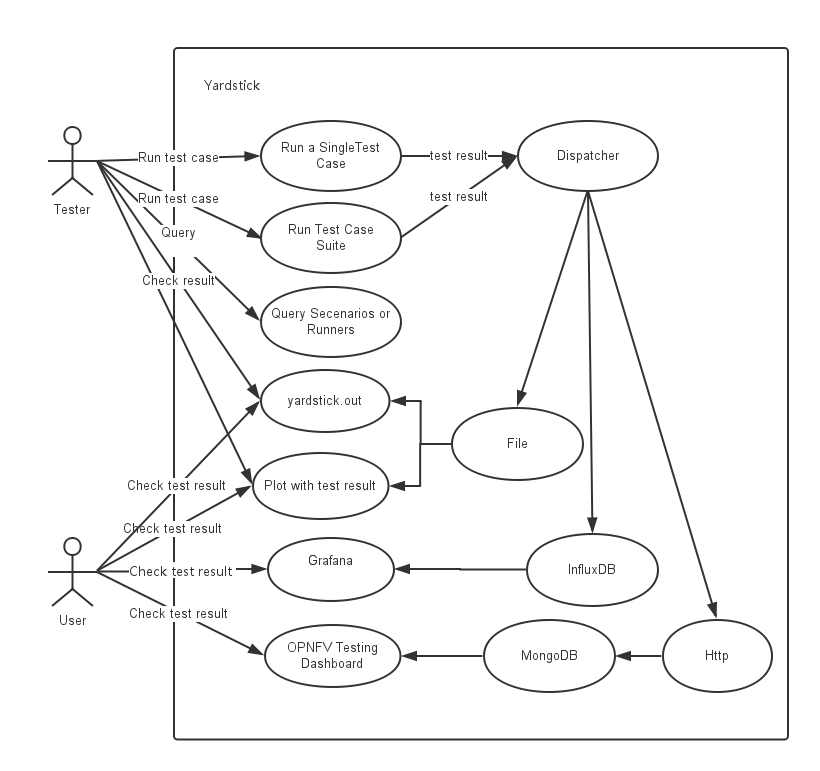
Yardstick Use-Case View shows two kinds of users. One is the Tester who will do testing in cloud, the other is the User who is more concerned with test result and result analyses.
For testers, they will run a single test case or test case suite to verify infrastructure compliance or bencnmark their own infrastructure performance. Test result will be stored by dispatcher module, three kinds of store method (file, influxdb and http) can be configured. The detail information of scenarios and runners can be queried with CLI by testers.
For users, they would check test result with four ways.
If dispatcher module is configured as file(default), there are two ways to check test result. One is to get result from yardstick.out ( default path: /tmp/yardstick.out), the other is to get plot of test result, it will be shown if users execute command “yardstick-plot”.
If dispatcher module is configured as influxdb, users will check test result on Grafana which is most commonly used for visualizing time series data.
If dispatcher module is configured as http, users will check test result on OPNFV testing dashboard which use MongoDB as backend.
Logical View
Yardstick Logical View describes the most important classes, their organization, and the most important use-case realizations.
Main classes:
TaskCommands - “yardstick task” subcommand handler.
HeatContext - Do test yaml file context section model convert to HOT, deploy and undeploy Openstack heat stack.
Runner - Logic that determines how a test scenario is run and reported.
TestScenario - Type/class of measurement for example Ping, Pktgen, (Iperf, LmBench, ...)
Dispatcher - Choose user defined way to store test results.
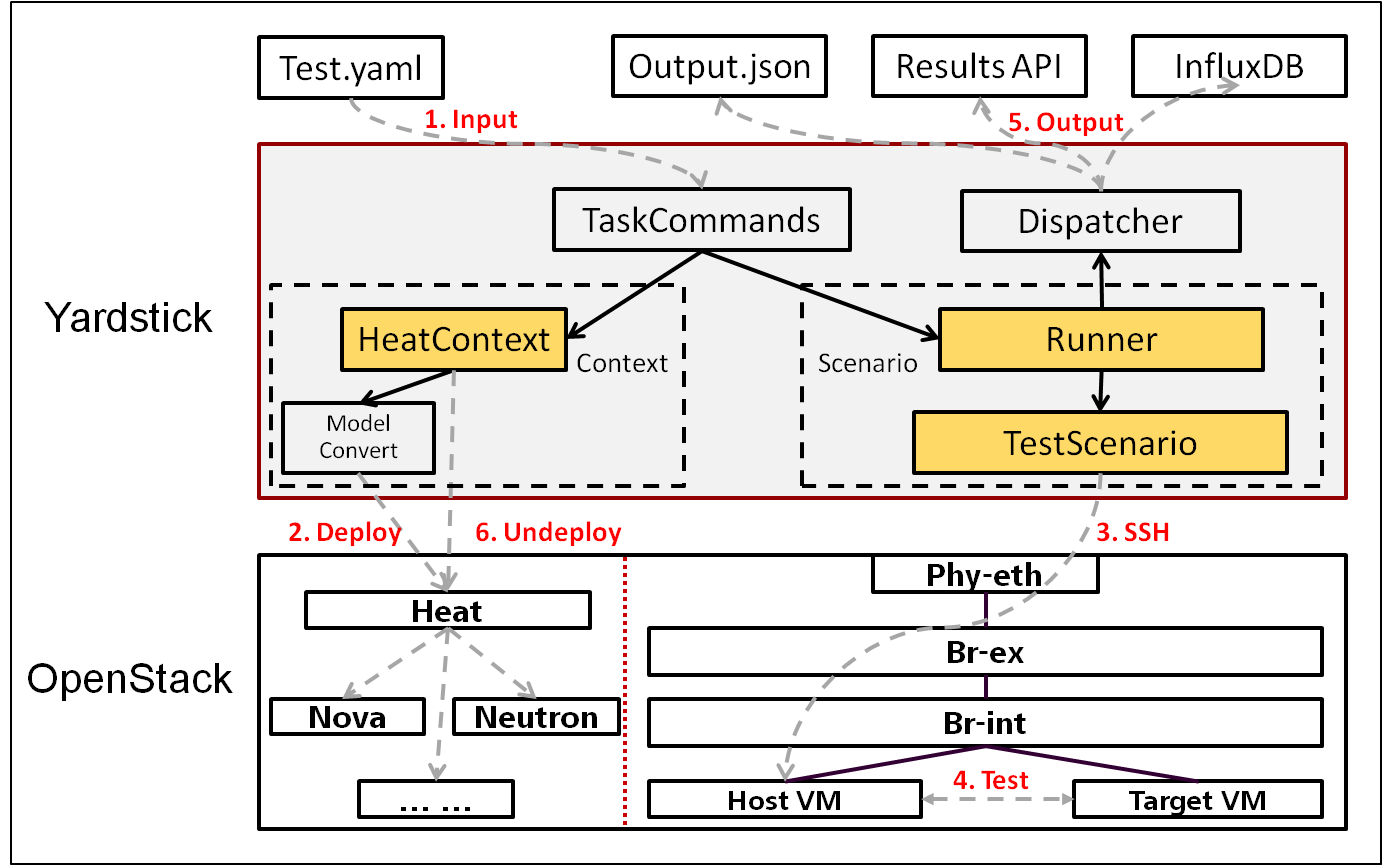
TaskCommands is the “yardstick task” subcommand’s main entry. It takes yaml file (e.g. test.yaml) as input, and uses HeatContext to convert the yaml file’s context section to HOT. After Openstacik heat stack is deployed by HeatContext with the converted HOT, TaskCommands use Runner to run specified TestScenario. During first runner initialization, it will create output process. The output process use Dispatcher to push test results. The Runner will also create a process to execute TestScenario. And there is a multiprocessing queue between each runner process and output process, so the runner process can push the real-time test results to the storage media. TestScenario is commonly connected with VMs by using ssh. It sets up VMs and run test measurement scripts through the ssh tunnel. After all TestScenaio is finished, TaskCommands will undeploy the heat stack. Then the whole test is finished.
Process View (Test execution flow)
Yardstick process view shows how yardstick runs a test case. Below is the sequence graph about the test execution flow using heat context, and each object represents one module in yardstick:
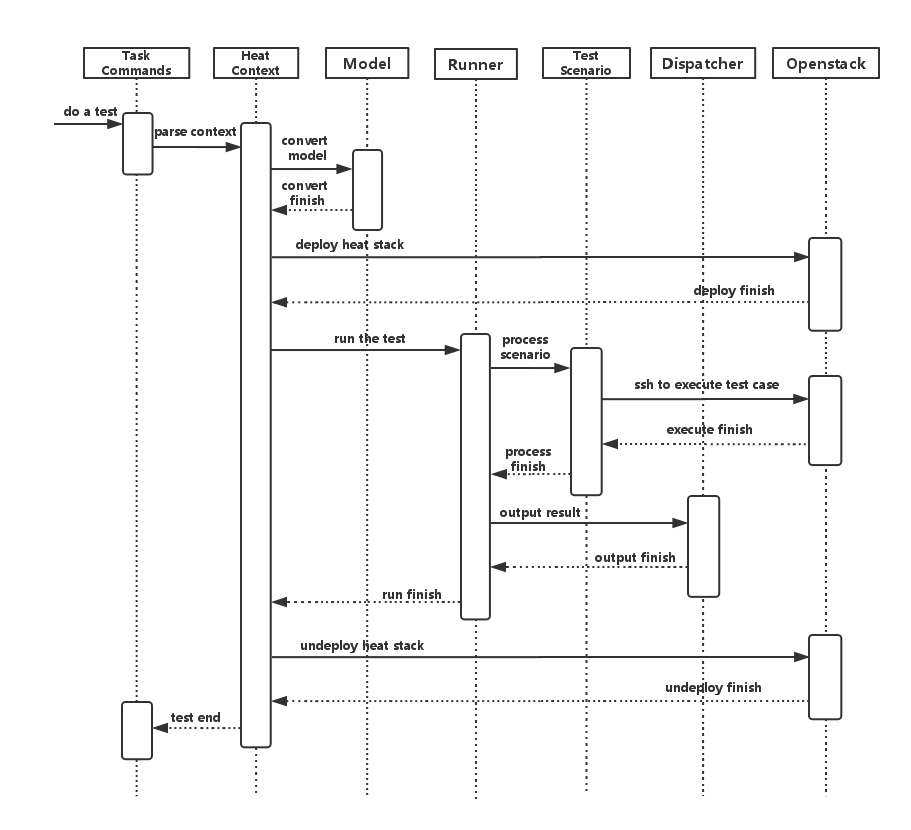
A user wants to do a test with yardstick. He can use the CLI to input the command to start a task. “TaskCommands” will receive the command and ask “HeatContext” to parse the context. “HeatContext” will then ask “Model” to convert the model. After the model is generated, “HeatContext” will inform “Openstack” to deploy the heat stack by heat template. After “Openstack” deploys the stack, “HeatContext” will inform “Runner” to run the specific test case.
Firstly, “Runner” would ask “TestScenario” to process the specific scenario. Then “TestScenario” will start to log on the openstack by ssh protocal and execute the test case on the specified VMs. After the script execution finishes, “TestScenario” will send a message to inform “Runner”. When the testing job is done, “Runner” will inform “Dispatcher” to output the test result via file, influxdb or http. After the result is output, “HeatContext” will call “Openstack” to undeploy the heat stack. Once the stack is undepoyed, the whole test ends.
Deployment View
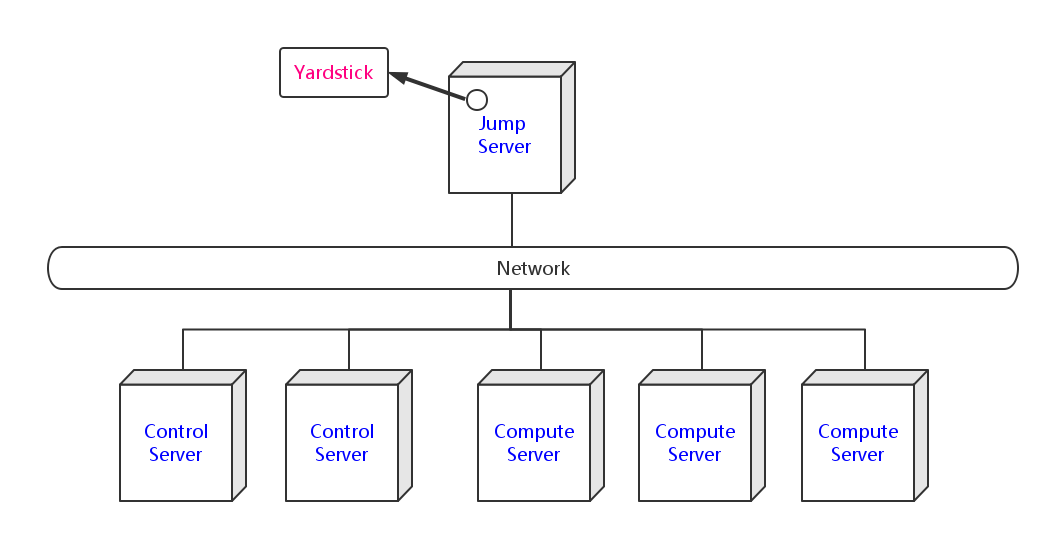
Yardstick deployment view shows how the yardstick tool can be deployed into the underlying platform. Generally, yardstick tool is installed on JumpServer(see 07-installation for detail installation steps), and JumpServer is connected with other control/compute servers by networking. Based on this deployment, yardstick can run the test cases on these hosts, and get the test result for better showing.
Yardstick Directory structure
yardstick/ - Yardstick main directory.
- ci/ - Used for continuous integration of Yardstick at different PODs and
- with support for different installers.
- docs/ - All documentation is stored here, such as configuration guides,
- user guides and Yardstick descriptions.
etc/ - Used for test cases requiring specific POD configurations.
- samples/ - test case samples are stored here, most of all scenario and
- feature’s samples are shown in this directory.
- tests/ - Here both Yardstick internal tests (functional/ and unit/) as
- well as the test cases run to verify the NFVI (opnfv/) are stored. Also configurations of what to run daily and weekly at the different PODs is located here.
- tools/ - Currently contains tools to build image for VMs which are deployed
- by Heat. Currently contains how to build the yardstick-trusty-server image with the different tools that are needed from within the image.
plugin/ - Plug-in configuration files are stored here.
vTC/ - Contains the files for running the virtual Traffic Classifier tests.
- yardstick/ - Contains the internals of Yardstick: Runners, Scenario, Contexts,
- CLI parsing, keys, plotting tools, dispatcher, plugin install/remove scripts and so on.
Virtual Traffic Classifier
Abstract
This chapter provides an overview of the virtual Traffic Classifier, a contribution to OPNFV Yardstick from the EU Project TNOVA. Additional documentation is available in TNOVAresults.
Overview
The virtual Traffic Classifier (VTC) VNF, comprises of a Virtual Network Function Component (VNFC). The VNFC contains both the Traffic Inspection module, and the Traffic forwarding module, needed to run the VNF. The exploitation of Deep Packet Inspection (DPI) methods for traffic classification is built around two basic assumptions:
- third parties unaffiliated with either source or recipient are able to
inspect each IP packet’s payload
- the classifier knows the relevant syntax of each application’s packet
payloads (protocol signatures, data patterns, etc.).
The proposed DPI based approach will only use an indicative, small number of the initial packets from each flow in order to identify the content and not inspect each packet.
In this respect it follows the Packet Based per Flow State (term:PBFS). This method uses a table to track each session based on the 5-tuples (src address, dest address, src port,dest port, transport protocol) that is maintained for each flow.
Concepts
- Traffic Inspection: The process of packet analysis and application
identification of network traffic that passes through the VTC.
- Traffic Forwarding: The process of packet forwarding from an incoming
network interface to a pre-defined outgoing network interface.
- Traffic Rule Application: The process of packet tagging, based on a
predefined set of rules. Packet tagging may include e.g. Type of Service (ToS) field modification.
Architecture
The Traffic Inspection module is the most computationally intensive component of the VNF. It implements filtering and packet matching algorithms in order to support the enhanced traffic forwarding capability of the VNF. The component supports a flow table (exploiting hashing algorithms for fast indexing of flows) and an inspection engine for traffic classification.
The implementation used for these experiments exploits the nDPI library. The packet capturing mechanism is implemented using libpcap. When the DPI engine identifies a new flow, the flow register is updated with the appropriate information and transmitted across the Traffic Forwarding module, which then applies any required policy updates.
The Traffic Forwarding moudle is responsible for routing and packet forwarding. It accepts incoming network traffic, consults the flow table for classification information for each incoming flow and then applies pre-defined policies marking e.g. ToS/Differentiated Services Code Point (DSCP) multimedia traffic for Quality of Service (QoS) enablement on the forwarded traffic. It is assumed that the traffic is forwarded using the default policy until it is identified and new policies are enforced.
The expected response delay is considered to be negligible, as only a small number of packets are required to identify each flow.
Graphical Overview
+----------------------------+
|                            |
| Virtual Traffic Classifier |
|                            |
|     Analysing/Forwarding   |
|        ------------>       |
|     ethA          ethB     |
|                            |
+----------------------------+
     |              ^
     |              |
     v              |
+----------------------------+
|                            |
|     Virtual Switch         |
|                            |
+----------------------------+
Install
run the build.sh with root privileges
Run
sudo ./pfbridge -a eth1 -b eth2
Development Environment
Ubuntu 14.04
Apexlake Installation Guide
Abstract
ApexLake is a framework that provides automatic execution of experiments and related data collection to enable a user validate infrastructure from the perspective of a Virtual Network Function (VNF).
In the context of Yardstick, a virtual Traffic Classifier (VTC) network function is utilized.
Framework Hardware Dependencies
In order to run the framework there are some hardware related dependencies for ApexLake.
The framework needs to be installed on the same physical node where DPDK-pktgen is installed.
The installation requires the physical node hosting the packet generator must have 2 NICs which are DPDK compatible.
The 2 NICs will be connected to the switch where the OpenStack VM network is managed.
The switch used must support multicast traffic and IGMP snooping. Further details about the configuration are provided at the following here.
The corresponding ports to which the cables are connected need to be configured as VLAN trunks using two of the VLAN IDs available for Neutron. Note the VLAN IDs used as they will be required in later configuration steps.
Framework Software Dependencies
Before starting the framework, a number of dependencies must first be installed. The following describes the set of instructions to be executed via the Linux shell in order to install and configure the required dependencies.
- Install Dependencies.
To support the framework dependencies the following packages must be installed. The example provided is based on Ubuntu and needs to be executed in root mode.
apt-get install python-dev
apt-get install python-pip
apt-get install python-mock
apt-get install tcpreplay
apt-get install libpcap-dev
- Source OpenStack openrc file.
source openrc
- Configure Openstack Neutron
In order to support traffic generation and management by the virtual Traffic Classifier, the configuration of the port security driver extension is required for Neutron.
For further details please follow the following link: PORTSEC This step can be skipped in case the target OpenStack is Juno or Kilo release, but it is required to support Liberty. It is therefore required to indicate the release version in the configuration file located in ./yardstick/vTC/apexlake/apexlake.conf
- Create Two Networks based on VLANs in Neutron.
To enable network communications between the packet generator and the compute node, two networks must be created via Neutron and mapped to the VLAN IDs that were previously used in the configuration of the physical switch. The following shows the typical set of commands required to configure Neutron correctly. The physical switches need to be configured accordingly.
VLAN_1=2032
VLAN_2=2033
PHYSNET=physnet2
neutron net-create apexlake_inbound_network \
        --provider:network_type vlan \
        --provider:segmentation_id $VLAN_1 \
        --provider:physical_network $PHYSNET

neutron subnet-create apexlake_inbound_network \
        192.168.0.0/24 --name apexlake_inbound_subnet

neutron net-create apexlake_outbound_network \
        --provider:network_type vlan \
        --provider:segmentation_id $VLAN_2 \
        --provider:physical_network $PHYSNET

neutron subnet-create apexlake_outbound_network 192.168.1.0/24 \
        --name apexlake_outbound_subnet
- Download Ubuntu Cloud Image and load it on Glance
The virtual Traffic Classifier is supported on top of Ubuntu 14.04 cloud image. The image can be downloaded on the local machine and loaded on Glance using the following commands:
wget cloud-images.ubuntu.com/trusty/current/trusty-server-cloudimg-amd64-disk1.img
glance image-create \
        --name ubuntu1404 \
        --is-public true \
        --disk-format qcow \
        --container-format bare \
        --file trusty-server-cloudimg-amd64-disk1.img
- Configure the Test Cases
The VLAN tags must also be included in the test case Yardstick yaml file as parameters for the following test cases:
Install and Configure DPDK Pktgen
Execution of the framework is based on DPDK Pktgen. If DPDK Pktgen has not installed, it is necessary to download, install, compile and configure it. The user can create a directory and download the dpdk packet generator source code:
cd experimental_framework/libraries
mkdir dpdk_pktgen
git clone https://github.com/pktgen/Pktgen-DPDK.git
For instructions on the installation and configuration of DPDK and DPDK Pktgen please follow the official DPDK Pktgen README file. Once the installation is completed, it is necessary to load the DPDK kernel driver, as follow:
insmod uio
insmod DPDK_DIR/x86_64-native-linuxapp-gcc/kmod/igb_uio.ko
It is necessary to set the configuration file to support the desired Pktgen configuration. A description of the required configuration parameters and supporting examples is provided in the following:
[PacketGen]
packet_generator = dpdk_pktgen

# This is the directory where the packet generator is installed
# (if the user previously installed dpdk-pktgen,
# it is required to provide the director where it is installed).
pktgen_directory = /home/user/software/dpdk_pktgen/dpdk/examples/pktgen/

# This is the directory where DPDK is installed
dpdk_directory = /home/user/apexlake/experimental_framework/libraries/Pktgen-DPDK/dpdk/

# Name of the dpdk-pktgen program that starts the packet generator
program_name = app/app/x86_64-native-linuxapp-gcc/pktgen

# DPDK coremask (see DPDK-Pktgen readme)
coremask = 1f

# DPDK memory channels (see DPDK-Pktgen readme)
memory_channels = 3

# Name of the interface of the pktgen to be used to send traffic (vlan_sender)
name_if_1 = p1p1

# Name of the interface of the pktgen to be used to receive traffic (vlan_receiver)
name_if_2 = p1p2

# PCI bus address correspondent to if_1
bus_slot_nic_1 = 01:00.0

# PCI bus address correspondent to if_2
bus_slot_nic_2 = 01:00.1
To find the parameters related to names of the NICs and the addresses of the PCI buses the user may find it useful to run the DPDK tool nic_bind as follows:
DPDK_DIR/tools/dpdk_nic_bind.py --status
Lists the NICs available on the system, and shows the available drivers and bus addresses for each interface. Please make sure to select NICs which are DPDK compatible.
Installation and Configuration of smcroute
The user is required to install smcroute which is used by the framework to support multicast communications.
The following is the list of commands required to download and install smroute.
cd ~
git clone https://github.com/troglobit/smcroute.git
cd smcroute
git reset --hard c3f5c56
sed -i 's/aclocal-1.11/aclocal/g' ./autogen.sh
sed -i 's/automake-1.11/automake/g' ./autogen.sh
./autogen.sh
./configure
make
sudo make install
cd ..
It is required to do the reset to the specified commit ID. It is also requires the creation a configuration file using the following command:
SMCROUTE_NIC=(name of the nic)
where name of the nic is the name used previously for the variable “name_if_2”. For example:
SMCROUTE_NIC=p1p2
Then create the smcroute configuration file /etc/smcroute.conf
echo mgroup from $SMCROUTE_NIC group 224.192.16.1 > /etc/smcroute.conf
At the end of this procedure it will be necessary to perform the following actions to add the user to the sudoers:
adduser USERNAME sudo
echo "user ALL=(ALL) NOPASSWD: ALL" >> /etc/sudoers
Experiment using SR-IOV Configuration on the Compute Node
To enable SR-IOV interfaces on the physical NIC of the compute node, a compatible NIC is required. NIC configuration depends on model and vendor. After proper configuration to support SR-IOV, a proper configuration of OpenStack is required. For further information, please refer to the SRIOV configuration guide
Finalize installation the framework on the system
The installation of the framework on the system requires the setup of the project. After entering into the apexlake directory, it is sufficient to run the following command.
python setup.py install
Since some elements are copied into the /tmp directory (see configuration file) it could be necessary to repeat this step after a reboot of the host.
Apexlake API Interface Definition
Abstract
The API interface provided by the framework to enable the execution of test cases is defined as follows.
execute_framework
static execute_framework (test_cases,
iterations,
heat_template,
heat_template_parameters,
deployment_configuration,
openstack_credentials)
Executes the framework according the specified inputs
Parameters
test_cases
Test cases to be run with the workload (dict() of dict())
- Example:
test_case = dict()
test_case[’name’] = ‘module.Class’
test_case[’params’] = dict()
test_case[’params’][’throughput’] = ‘1’
test_case[’params’][’vlan_sender’] = ‘1000’
test_case[’params’][’vlan_receiver’] = ‘1001’
test_cases = [test_case]
- iterations
Number of test cycles to be executed (int)
- heat_template
(string) File name of the heat template corresponding to the workload to be deployed. It contains the parameters to be evaluated in the form of #parameter_name. (See heat_templates/vTC.yaml as example).
- heat_template_parameters
(dict) Parameters to be provided as input to the heat template. See http://docs.openstack.org/developer/heat/ template_guide/hot_guide.html section “Template input parameters” for further info.
- deployment_configuration
( dict[string] = list(strings) ) ) Dictionary of parameters representing the deployment configuration of the workload.
The key is a string corresponding to the name of the parameter, the value is a list of strings representing the value to be assumed by a specific param. The parameters are user defined: they have to correspond to the place holders (#parameter_name) specified in the heat template.
Returns dict() containing results
Yardstick Installation
Abstract
Yardstick currently supports installation on Ubuntu 14.04 or by using a Docker image. Detailed steps about installing Yardstick using both of these options can be found below.
To use Yardstick you should have access to an OpenStack environment, with at least Nova, Neutron, Glance, Keystone and Heat installed.
The steps needed to run Yardstick are:
- Install Yardstick and create the test configuration .yaml file.
- Build a guest image and load the image into the OpenStack environment.
- Create a Neutron external network and load OpenStack environment variables.
- Run the test case.
Installing Yardstick on Ubuntu 14.04
You can install Yardstick framework directly on Ubuntu 14.04 or in an Ubuntu 14.04 Docker image. No matter which way you choose to install Yardstick framework, the following installation steps are identical. If you choose to use the Ubuntu 14.04 Docker image, You can pull the Ubuntu 14.04 Docker image from Docker hub:
docker pull ubuntu:14.04
Installing Yardstick framework
Install dependencies:
sudo apt-get update && sudo apt-get install -y \
    wget \
    git \
    sshpass \
    qemu-utils \
    kpartx \
    libffi-dev \
    libssl-dev \
    python \
    python-dev \
    python-virtualenv \
    libxml2-dev \
    libxslt1-dev \
    python-setuptools
Create a python virtual environment, source it and update setuptools:
virtualenv ~/yardstick_venv
source ~/yardstick_venv/bin/activate
easy_install -U setuptools
Download source code and install python dependencies:
git clone https://gerrit.opnfv.org/gerrit/yardstick
cd yardstick
python setup.py install
There is also a YouTube video, showing the above steps:

Building a guest image
Yardstick has a tool for building an Ubuntu Cloud Server image containing all the required tools to run test cases supported by Yardstick. It is necessary to have sudo rights to use this tool.
Also you may need install several additional packages to use this tool, by follwing the commands below:
apt-get update && apt-get install -y \
    qemu-utils \
    kpartx
This image can be built using the following command while in the directory where
Yardstick is installed (~/yardstick if the framework is installed
by following the commands above):
sudo ./tools/yardstick-img-modify tools/ubuntu-server-cloudimg-modify.sh
Warning: the script will create files by default in:
/tmp/workspace/yardstick and the files will be owned by root!
The created image can be added to OpenStack using the glance image-create or
via the OpenStack Dashboard.
Example command:
glance --os-image-api-version 1 image-create \
--name yardstick-trusty-server --is-public true \
--disk-format qcow2 --container-format bare \
--file /tmp/workspace/yardstick/yardstick-trusty-server.img
Installing Yardstick using Docker
Yardstick iteself has a Docker image, this Docker image (Yardstick-stable) serves as a replacement for installing the Yardstick framework in a virtual environment (for example as done in install-framework). It is recommended to use this Docker image to run Yardstick test.
Yardstick-stable image
Pull the Yardstick-stable Docker image from Docker hub:
docker pull opnfv/yardstick:stable
Run the Docker image:
docker run \
 --privileged=true \
  --rm \
  -t \
  -e "INSTALLER_TYPE=${INSTALLER_TYPE}" \
  -e "INSTALLER_IP=${INSTALLER_IP}" \
  opnfv/yardstick \
  exec_tests.sh ${YARDSTICK_DB_BACKEND} ${YARDSTICK_SUITE_NAME}
Where ${INSTALLER_TYPE} can be apex, compass, fuel or joid, ${INSTALLER_IP}
is the installer master node IP address (i.e. 10.20.0.2 is default for fuel). ${YARDSTICK_DB_BACKEND}
is the IP and port number of DB, ${YARDSTICK_SUITE_NAME} is the test suite you want to run.
For more details, please refer to the Jenkins job defined in Releng project, labconfig information
and sshkey are required. See the link
https://git.opnfv.org/cgit/releng/tree/jjb/yardstick/yardstick-ci-jobs.yml.
Note: exec_tests.sh is used for executing test suite here, furthermore, if someone wants to execute the test suite manually, it can be used as long as the parameters are configured correct. Another script called run_tests.sh is used for unittest in Jenkins verify job, in local manaul environment, it is recommended to run before test suite execuation.
Basic steps performed by the Yardstick-stable container:
- clone yardstick and releng repos
- setup OS credentials (releng scripts)
- install yardstick and dependencies
- build yardstick cloud image and upload it to glance
- upload cirros-0.3.3 cloud image and ubuntu-14.04 cloud image to glance
- run yardstick test scenarios
- cleanup
If someone only wants to execute a single test case, one can log into the yardstick-stable container first using command:
docker run -it openfv/yardstick /bin/bash
Then in the container run yardstick task command to execute single test case. Detailed steps about executing Yardstick test case can be found below.
OpenStack parameters and credentials
Yardstick-flavor
Most of the sample test cases in Yardstick are using an OpenStack flavor called yardstick-flavor which deviates from the OpenStack standard m1.tiny flavor by the disk size - instead of 1GB it has 3GB. Other parameters are the same as in m1.tiny.
Environment variables
Before running Yardstick it is necessary to export OpenStack environment variables
from the OpenStack openrc file (using the source command) and export the
external network name export EXTERNAL_NETWORK="external-network-name",
the default name for the external network is net04_ext.
Credential environment variables in the openrc file have to include at least:
- OS_AUTH_URL
- OS_USERNAME
- OS_PASSWORD
- OS_TENANT_NAME
Yardstick default key pair
Yardstick uses a SSH key pair to connect to the guest image. This key pair can
be found in the resources/files directory. To run the ping-hot.yaml test
sample, this key pair needs to be imported to the OpenStack environment.
Examples and verifying the install
It is recommended to verify that Yardstick was installed successfully by executing some simple commands and test samples. Below is an example invocation of yardstick help command and ping.py test sample:
yardstick –h
yardstick task start samples/ping.yaml
Each testing tool supported by Yardstick has a sample configuration file. These configuration files can be found in the samples directory.
Default location for the output is /tmp/yardstick.out.
Deploy InfluxDB and Grafana locally
Pull docker images
docker pull tutum/influxdb
docker pull grafana/grafana
Run influxdb and config
Run influxdb
docker run -d --name influxdb \
-p 8083:8083 -p 8086:8086 --expose 8090 --expose 8099 \
tutum/influxdb
docker exec -it influxdb bash
Config influxdb
influx
>CREATE USER root WITH PASSWORD 'root' WITH ALL PRIVILEGES
>CREATE DATABASE yardstick;
>use yardstick;
>show MEASUREMENTS;
Run grafana and config
Run grafana
docker run -d --name grafana -p 3000:3000 grafana/grafana
Config grafana
http://{YOUR_IP_HERE}:3000
log on using admin/admin and config database resource to be {YOUR_IP_HERE}:8086
Config yardstick conf
cp ./etc/yardstick/yardstick.conf.sample /etc/yardstick/yardstick.conf
vi /etc/yardstick/yardstick.conf Config yardstick.conf
[DEFAULT]
debug = True
dispatcher = influxdb

[dispatcher_influxdb]
timeout = 5
target = http://{YOUR_IP_HERE}:8086
db_name = yardstick
username = root
password = root
Now you can run yardstick test case and store the results in influxdb
Create a test suite for yardstick
A test suite in yardstick is a yaml file which include one or more test cases. Yardstick is able to support running test suite task, so you can customize you own test suite and run it in one task.
“tests/opnfv/test_suites” is where yardstick put ci test-suite. A typical test suite is like below:
fuel_test_suite.yaml
---
# Fuel integration test task suite

schema: "yardstick:suite:0.1"

name: "fuel_test_suite"
test_cases_dir: "samples/"
test_cases:
-
  file_name: ping.yaml
-
  file_name: iperf3.yaml
As you can see, there are two test cases in fuel_test_suite, the syntas is simple here, you must specify the schema and the name, then you just need to list the test cases in the tag “test_cases” and also mark their relative directory in the tag “test_cases_dir”.
Yardstick test suite also support constraints and task args for each test suite. Here is another sample to show this, which is digested from one big test suite.
os-nosdn-nofeature-ha.yaml
---

schema: "yardstick:suite:0.1"

name: "os-nosdn-nofeature-ha"
test_cases_dir: "tests/opnfv/test_cases/"
test_cases:
-
    file_name: opnfv_yardstick_tc002.yaml
-
    file_name: opnfv_yardstick_tc005.yaml
-
    file_name: opnfv_yardstick_tc043.yaml
       constraint:
          installer: compass
          pod: huawei-pod1
       task_args:
          huawei-pod1: '{"pod_info": "etc/yardstick/.../pod.yaml",
          "host": "node4.LF","target": "node5.LF"}'
As you can see in test case “opnfv_yardstick_tc043.yaml”, it has two tags, “constraint” and “task_args”. “constraint” is where you can specify which installer or pod it can be run in the ci environment. “task_args” is where you can specify the task arguments for each pod.
All in all, to create a test suite in yardstick, you just need to create a suite yaml file and add test cases and constraint or task arguments if necessary.
Installing a plug-in into yardstick
Abstract
Yardstick currently provides a plugin CLI command to support integration
with other OPNFV testing projects. Below is an example invocation of yardstick
plugin command and Storperf plug-in sample.
Installing Storperf into yardstick
Storperf is delivered as a Docker container from https://hub.docker.com/r/opnfv/storperf/tags/.
There are two possible methods for installation in your environment:
- Run container on Jump Host
- Run container in a VM
In this introduction we will install Storperf on Jump Host.
Step 0: Environment preparation
Running Storperf on Jump Host Requirements:
- Docker must be installed
- Jump Host must have access to the OpenStack Controller API
- Jump Host must have internet connectivity for downloading docker image
- Enough floating IPs must be available to match your agent count
Before installing Storperf into yardstick you need to check your openstack environment and other dependencies:
- Make sure docker is installed.
- Make sure Keystone, Nova, Neutron, Glance, Heat are installed correctly.
- Make sure Jump Host have access to the OpenStack Controller API.
- Make sure Jump Host must have internet connectivity for downloading docker image.
- You need to know where to get basic openstack Keystone authorization info, such as OS_PASSWORD, OS_TENANT_NAME, OS_AUTH_URL, OS_USERNAME.
- To run a Storperf container, you need to have OpenStack Controller environment variables defined and passed to Storperf container. The best way to do this is to put environment variables in a “storperf_admin-rc” file. The storperf_admin-rc should include credential environment variables at least:
- OS_AUTH_URL
- OS_TENANT_ID
- OS_TENANT_NAME
- OS_PROJECT_NAME
- OS_USERNAME
- OS_PASSWORD
- OS_REGION_NAME
For this storperf_admin-rc file, during environment preparation a “prepare_storperf_admin-rc.sh” script can be used to generate it.
#!/bin/bash
AUTH_URL=${OS_AUTH_URL}
USERNAME=${OS_USERNAME:-admin}
PASSWORD=${OS_PASSWORD:-console}
TENANT_NAME=${OS_TENANT_NAME:-admin}
VOLUME_API_VERSION=${OS_VOLUME_API_VERSION:-2}
PROJECT_NAME=${OS_PROJECT_NAME:-$TENANT_NAME}
TENANT_ID=`keystone tenant-get admin|grep 'id'|awk -F '|' '{print $3}'|sed -e 's/^[[:space:]]*//'`
rm -f ~/storperf_admin-rc
touch ~/storperf_admin-rc
echo "OS_AUTH_URL="$AUTH_URL >> ~/storperf_admin-rc
echo "OS_USERNAME="$USERNAME >> ~/storperf_admin-rc
echo "OS_PASSWORD="$PASSWORD >> ~/storperf_admin-rc
echo "OS_TENANT_NAME="$TENANT_NAME >> ~/storperf_admin-rc
echo "OS_VOLUME_API_VERSION="$VOLUME_API_VERSION >> ~/storperf_admin-rc
echo "OS_PROJECT_NAME="$PROJECT_NAME >> ~/storperf_admin-rc
echo "OS_TENANT_ID="$TENANT_ID >> ~/storperf_admin-rc
Step 1: Plug-in configuration file preparation
To install a plug-in, first you need to prepare a plug-in configuration file in YAML format and store it in the “plugin” directory. The plugin configration file work as the input of yardstick “plugin” command. Below is the Storperf plug-in configuration file sample:
---
# StorPerf plugin configuration file
# Used for integration StorPerf into Yardstick as a plugin
schema: "yardstick:plugin:0.1"
plugins:
  name: storperf
deployment:
  ip: 192.168.23.2
  user: root
  password: root
In the plug-in configuration file, you need to specify the plug-in name and the plug-in deployment info, including node ip, node login username and password. Here the Storperf will be installed on IP 192.168.23.2 which is the Jump Host in my local environment.
Step 2: Plug-in install/remove scripts preparation
Under “yardstick/resource/scripts directory”, there are two folders: a “install” folder and a “remove” folder. You need to store the plug-in install/remove script in these two folders respectively.
The detailed installation or remove operation should de defined in these two scripts. The name of both install and remove scripts should match the plugin-in name that you specified in the plug-in configuration file. For example, the install and remove scripts for Storperf are both named to “storperf.bash”.
Step 3: Install and remove Storperf
To install Storperf, simply execute the following command
# Install Storperf
yardstick plugin install plugin/storperf.yaml
removing Storperf from yardstick
To remove Storperf, simply execute the following command
# Remove Storperf
yardstick plugin remove plugin/storperf.yaml
What yardstick plugin command does is using the username and password to log into the deployment target and then execute the corresponding install or remove script.
Store Other Project’s Test Results in InfluxDB
Abstract
This chapter illustrates how to run plug-in test cases and store test results into community’s InfluxDB. The framework is shown in Framework.
Store Storperf Test Results into Community’s InfluxDB
As shown in Framework, there are two ways to store Storperf test results into community’s InfluxDB:
- Yardstick asks Storperf to run the test case. After the test case is completed, Yardstick reads test results via ReST API from Storperf and posts test data to the influxDB.
- Additionally, Storperf can run tests by itself and post the test result directly to the InfluxDB. The method for posting data directly to influxDB will be supported in the future.
Our plan is to support rest-api in D release so that other testing projects can call the rest-api to use yardstick dispatcher service to push data to yardstick’s influxdb database.
For now, influxdb only support line protocol, and the json protocol is deprecated.
Take ping test case for example, the raw_result is json format like this:
  "benchmark": {
      "timestamp": 1470315409.868095,
      "errors": "",
      "data": {
        "rtt": {
        "ares": 1.125
        }
      },
    "sequence": 1
    },
  "runner_id": 2625
}
With the help of “influxdb_line_protocol”, the json is transform to like below as a line string:
'ping,deploy_scenario=unknown,host=athena.demo,installer=unknown,pod_name=unknown,
  runner_id=2625,scenarios=Ping,target=ares.demo,task_id=77755f38-1f6a-4667-a7f3-
    301c99963656,version=unknown rtt.ares=1.125 1470315409868094976'
So, for data output of json format, you just need to transform json into line format and call influxdb api to post the data into the database. All this function has been implemented in Influxdb. If you need support on this, please contact Mingjiang.
curl -i -XPOST 'http://104.197.68.199:8086/write?db=yardstick' --
  data-binary 'ping,deploy_scenario=unknown,host=athena.demo,installer=unknown, ...'
Grafana will be used for visualizing the collected test data, which is shown in Visual. Grafana can be accessed by Login.
Yardstick Test Cases
Abstract
This chapter lists available Yardstick test cases. Yardstick test cases are divided in two main categories:
- Generic NFVI Test Cases - Test Cases developed to realize the methodology
described in Methodology
- OPNFV Feature Test Cases - Test Cases developed to verify one or more
aspect of a feature delivered by an OPNFV Project, including the test cases developed for the VTC.
Generic NFVI Test Case Descriptions
Yardstick Test Case Description TC001
| Network Performance | |
| test case id | OPNFV_YARDSTICK_TC001_NW PERF |
| metric | Number of flows and throughput |
| test purpose | To evaluate the IaaS network performance with regards to flows and throughput, such as if and how different amounts of flows matter for the throughput between hosts on different compute blades. Typically e.g. the performance of a vSwitch depends on the number of flows running through it. Also performance of other equipment or entities can depend on the number of flows or the packet sizes used. The purpose is also to be able to spot trends. Test results, graphs ans similar shall be stored for comparison reasons and product evolution understanding between different OPNFV versions and/or configurations. |
| configuration | file: opnfv_yardstick_tc001.yaml Packet size: 60 bytes Number of ports: 10, 50, 100, 500 and 1000, where each runs for 20 seconds. The whole sequence is run twice. The client and server are distributed on different HW. For SLA max_ppm is set to 1000. The amount of configured ports map to between 110 up to 1001000 flows, respectively. |
| test tool | pktgen (Pktgen is not always part of a Linux distribution, hence it needs to be installed. It is part of the Yardstick Docker image. As an example see the /yardstick/tools/ directory for how to generate a Linux image with pktgen included.) |
| references |
ETSI-NFV-TST001 |
| applicability | Test can be configured with different packet sizes, amount of flows and test duration. Default values exist. SLA (optional): max_ppm: The number of packets per million packets sent that are acceptable to loose, not received. |
| pre-test conditions | The test case image needs to be installed into Glance with pktgen included in it. No POD specific requirements have been identified. |
| test sequence | description and expected result |
| step 1 | The hosts are installed, as server and client. pktgen is invoked and logs are produced and stored. Result: Logs are stored. |
| test verdict | Fails only if SLA is not passed, or if there is a test case execution problem. |
Yardstick Test Case Description TC002
| Network Latency | |
| test case id | OPNFV_YARDSTICK_TC002_NW LATENCY |
| metric | RTT, Round Trip Time |
| test purpose | To do a basic verification that network latency is within acceptable boundaries when packets travel between hosts located on same or different compute blades. The purpose is also to be able to spot trends. Test results, graphs and similar shall be stored for comparison reasons and product evolution understanding between different OPNFV versions and/or configurations. |
| configuration | file: opnfv_yardstick_tc002.yaml Packet size 100 bytes. Total test duration 600 seconds. One ping each 10 seconds. SLA RTT is set to maximum 10 ms. |
| test tool | ping Ping is normally part of any Linux distribution, hence it doesn’t need to be installed. It is also part of the Yardstick Docker image. (For example also a Cirros image can be downloaded from cirros-image, it includes ping) |
| references | Ping man page ETSI-NFV-TST001 |
| applicability | Test case can be configured with different packet sizes, burst sizes, ping intervals and test duration. SLA is optional. The SLA in this test case serves as an example. Considerably lower RTT is expected, and also normal to achieve in balanced L2 environments. However, to cover most configurations, both bare metal and fully virtualized ones, this value should be possible to achieve and acceptable for black box testing. Many real time applications start to suffer badly if the RTT time is higher than this. Some may suffer bad also close to this RTT, while others may not suffer at all. It is a compromise that may have to be tuned for different configuration purposes. |
| pre-test conditions | The test case image needs to be installed into Glance with ping included in it. No POD specific requirements have been identified. |
| test sequence | description and expected result |
| step 1 | The hosts are installed, as server and client. Ping is invoked and logs are produced and stored. Result: Logs are stored. |
| test verdict | Test should not PASS if any RTT is above the optional SLA value, or if there is a test case execution problem. |
Yardstick Test Case Description TC004
| Cache Utilization | |
| test case id | OPNFV_YARDSTICK_TC004_Cache Utilization |
| metric | Cache Utilization |
| test purpose | To evaluate the IaaS compute capability with regards to cache utilization.This test case should be run in parallel to other Yardstick test cases and not run as a stand-alone test case. Measure the cache usage statistics including cache hit, cache miss, hit ratio, page cache size and page cache size. Both average and maximun values are obtained. The purpose is also to be able to spot trends. Test results, graphs and similar shall be stored for comparison reasons and product evolution understanding between different OPNFV versions and/or configurations. |
| configuration | File: cachestat.yaml (in the ‘samples’ directory)
|
| test tool | cachestat cachestat is not always part of a Linux distribution, hence it needs to be installed. |
| references |
ETSI-NFV-TST001 |
| applicability | Test can be configured with different:
There are default values for each above-mentioned option. Run in background with other test cases. |
| pre-test conditions | The test case image needs to be installed into Glance with cachestat included in the image. No POD specific requirements have been identified. |
| test sequence | description and expected result |
| step 1 | The host is installed as client. The related TC, or TCs, is invoked and cachestat logs are produced and stored. Result: logs are stored. |
| test verdict | None. Cache utilization results are fetched and stored. |
Yardstick Test Case Description TC005
| Storage Performance | |
| test case id | OPNFV_YARDSTICK_TC005_Storage Performance |
| metric | IOPS, throughput and latency |
| test purpose | To evaluate the IaaS storage performance with regards to IOPS, throughput and latency. The purpose is also to be able to spot trends. Test results, graphs and similar shall be stored for comparison reasons and product evolution understanding between different OPNFV versions and/or configurations. |
| configuration | file: opnfv_yardstick_tc005.yaml IO types: read, write, randwrite, randread, rw IO block size: 4KB, 64KB, 1024KB, where each runs for 30 seconds(10 for ramp time, 20 for runtime). For SLA minimum read/write iops is set to 100, minimum read/write throughput is set to 400 KB/s, and maximum read/write latency is set to 20000 usec. |
| test tool | fio (fio is not always part of a Linux distribution, hence it needs to be installed. As an example see the /yardstick/tools/ directory for how to generate a Linux image with fio included.) |
| references |
ETSI-NFV-TST001 |
| applicability | Test can be configured with different read/write types, IO block size, IO depth, ramp time (runtime required for stable results) and test duration. Default values exist. |
| pre-test conditions | The test case image needs to be installed into Glance with fio included in it. No POD specific requirements have been identified. |
| test sequence | description and expected result |
| step 1 | The host is installed and fio is invoked and logs are produced and stored. Result: Logs are stored. |
| test verdict | Fails only if SLA is not passed, or if there is a test case execution problem. |
Yardstick Test Case Description TC008
| Packet Loss Extended Test | |
| test case id | OPNFV_YARDSTICK_TC008_NW PERF, Packet loss Extended Test |
| metric | Number of flows, packet size and throughput |
| test purpose | To evaluate the IaaS network performance with regards to flows and throughput, such as if and how different amounts of packet sizes and flows matter for the throughput between VMs on different compute blades. Typically e.g. the performance of a vSwitch depends on the number of flows running through it. Also performance of other equipment or entities can depend on the number of flows or the packet sizes used. The purpose is also to be able to spot trends. Test results, graphs ans similar shall be stored for comparison reasons and product evolution understanding between different OPNFV versions and/or configurations. |
| configuration | file: opnfv_yardstick_tc008.yaml Packet size: 64, 128, 256, 512, 1024, 1280 and 1518 bytes. Number of ports: 1, 10, 50, 100, 500 and 1000. The amount of configured ports map from 2 up to 1001000 flows, respectively. Each packet_size/port_amount combination is run ten times, for 20 seconds each. Then the next packet_size/port_amount combination is run, and so on. The client and server are distributed on different HW. For SLA max_ppm is set to 1000. |
| test tool | pktgen (Pktgen is not always part of a Linux distribution, hence it needs to be installed. It is part of the Yardstick Docker image. As an example see the /yardstick/tools/ directory for how to generate a Linux image with pktgen included.) |
| references |
ETSI-NFV-TST001 |
| applicability | Test can be configured with different packet sizes, amount of flows and test duration. Default values exist. SLA (optional): max_ppm: The number of packets per million packets sent that are acceptable to loose, not received. |
| pre-test conditions | The test case image needs to be installed into Glance with pktgen included in it. No POD specific requirements have been identified. |
| test sequence | description and expected result |
| step 1 | The hosts are installed, as server and client. pktgen is invoked and logs are produced and stored. Result: Logs are stored. |
| test verdict | Fails only if SLA is not passed, or if there is a test case execution problem. |
Yardstick Test Case Description TC009
| Packet Loss | |
| test case id | OPNFV_YARDSTICK_TC009_NW PERF, Packet loss |
| metric | Number of flows, packets lost and throughput |
| test purpose | To evaluate the IaaS network performance with regards to flows and throughput, such as if and how different amounts of flows matter for the throughput between VMs on different compute blades. Typically e.g. the performance of a vSwitch depends on the number of flows running through it. Also performance of other equipment or entities can depend on the number of flows or the packet sizes used. The purpose is also to be able to spot trends. Test results, graphs ans similar shall be stored for comparison reasons and product evolution understanding between different OPNFV versions and/or configurations. |
| configuration | file: opnfv_yardstick_tc009.yaml Packet size: 64 bytes Number of ports: 1, 10, 50, 100, 500 and 1000. The amount of configured ports map from 2 up to 1001000 flows, respectively. Each port amount is run ten times, for 20 seconds each. Then the next port_amount is run, and so on. The client and server are distributed on different HW. For SLA max_ppm is set to 1000. |
| test tool | pktgen (Pktgen is not always part of a Linux distribution, hence it needs to be installed. It is part of the Yardstick Docker image. As an example see the /yardstick/tools/ directory for how to generate a Linux image with pktgen included.) |
| references |
ETSI-NFV-TST001 |
| applicability | Test can be configured with different packet sizes, amount of flows and test duration. Default values exist. SLA (optional): max_ppm: The number of packets per million packets sent that are acceptable to loose, not received. |
| pre-test conditions | The test case image needs to be installed into Glance with pktgen included in it. No POD specific requirements have been identified. |
| test sequence | description and expected result |
| step 1 | The hosts are installed, as server and client. pktgen is invoked and logs are produced and stored. Result: logs are stored. |
| test verdict | Fails only if SLA is not passed, or if there is a test case execution problem. |
Yardstick Test Case Description TC010
| Memory Latency | |
| test case id | OPNFV_YARDSTICK_TC010_Memory Latency |
| metric | Latency in nanoseconds |
| test purpose | Measure the memory read latency for varying memory sizes and strides. Whole memory hierarchy is measured including all levels of cache. |
| configuration | File: opnfv_yardstick_tc010.yaml
|
| test tool | Lmbench Lmbench is a suite of operating system microbenchmarks. This test uses lat_mem_rd tool from that suite. Lmbench is not always part of a Linux distribution, hence it needs to be installed in the test image |
| references |
McVoy, Larry W.,and Carl Staelin. “lmbench: Portable Tools for Performance Analysis.” USENIX annual technical conference 1996. |
| applicability | Test can be configured with different:
There are default values for each above-mentioned option. SLA (optional) : max_latency: The maximum memory latency that is accepted. |
| pre-test conditions | The test case image needs to be installed into Glance with Lmbench included in the image. No POD specific requirements have been identified. |
| test sequence | description and expected result |
| step 1 | The host is installed as client. Lmbench’s lat_mem_rd tool is invoked and logs are produced and stored. Result: logs are stored. |
| test verdict | Test fails if the measured memory latency is above the SLA value or if there is a test case execution problem. |
Yardstick Test Case Description TC011
| Packet delay variation between VMs | |
| test case id | OPNFV_YARDSTICK_TC011_Packet delay variation between VMs |
| metric | jitter: packet delay variation (ms) |
| test purpose | Measure the packet delay variation sending the packets from one VM to the other. |
| configuration | File: opnfv_yardstick_tc011.yaml
|
| test tool | iperf3 iPerf3 is a tool for active measurements of the maximum achievable bandwidth on IP networks. It supports tuning of various parameters related to timing, buffers and protocols. The UDP protocols can be used to measure jitter delay. (iperf3 is not always part of a Linux distribution, hence it needs to be installed. It is part of the Yardstick Docker image. As an example see the /yardstick/tools/ directory for how to generate a Linux image with pktgen included.) |
| references |
ETSI-NFV-TST001 |
| applicability | Test can be configured with different:
|
| pre-test conditions | The test case image needs to be installed into Glance with iperf3 included in the image. No POD specific requirements have been identified. |
| test sequence | description and expected result |
| step 1 | The hosts are installed, as server and client. iperf3 is invoked and logs are produced and stored. Result: Logs are stored. |
| test verdict | Test should not PASS if any jitter is above the optional SLA value, or if there is a test case execution problem. |
Yardstick Test Case Description TC012
| Memory Bandwidth | |
| test case id | OPNFV_YARDSTICK_TC012_Memory Bandwidth |
| metric | Megabyte per second (MBps) |
| test purpose | Measure the rate at which data can be read from and written to the memory (this includes all levels of memory). |
| configuration | File: opnfv_yardstick_tc012.yaml
|
| test tool | Lmbench Lmbench is a suite of operating system microbenchmarks. This test uses bw_mem tool from that suite. Lmbench is not always part of a Linux distribution, hence it needs to be installed in the test image. |
| references |
McVoy, Larry W., and Carl Staelin. “lmbench: Portable Tools for Performance Analysis.” USENIX annual technical conference. 1996. |
| applicability | Test can be configured with different:
There are default values for each above-mentioned option. |
| pre-test conditions | The test case image needs to be installed into Glance with Lmbench included in the image. No POD specific requirements have been identified. |
| test sequence | description and expected result |
| step 1 | The host is installed as client. Lmbench’s bw_mem tool is invoked and logs are produced and stored. Result: logs are stored. |
| test verdict | Test fails if the measured memory bandwidth is below the SLA value or if there is a test case execution problem. |
Yardstick Test Case Description TC014
| Processing speed | |
| test case id | OPNFV_YARDSTICK_TC014_Processing speed |
| metric | score of single cpu running, score of parallel running |
| test purpose | To evaluate the IaaS processing speed with regards to score of single cpu running and parallel running The purpose is also to be able to spot trends. Test results, graphs and similar shall be stored for comparison reasons and product evolution understanding between different OPNFV versions and/or configurations. |
| configuration | file: opnfv_yardstick_tc014.yaml run_mode: Run unixbench in quiet mode or verbose mode test_type: dhry2reg, whetstone and so on For SLA with single_score and parallel_score, both can be set by user, default is NA |
| test tool | unixbench (unixbench is not always part of a Linux distribution, hence it needs to be installed. As an example see the /yardstick/tools/ directory for how to generate a Linux image with unixbench included.) |
| references |
ETSI-NFV-TST001 |
| applicability | Test can be configured with different test types, dhry2reg, whetstone and so on. |
| pre-test conditions | The test case image needs to be installed into Glance with unixbench included in it. No POD specific requirements have been identified. |
| test sequence | description and expected result |
| step 1 | The hosts are installed, as a client. unixbench is invoked and logs are produced and stored. Result: Logs are stored. |
| test verdict | Fails only if SLA is not passed, or if there is a test case execution problem. |
Yardstick Test Case Description TC024
| CPU Load | |
| test case id | OPNFV_YARDSTICK_TC024_CPU Load |
| metric | CPU load |
| test purpose | To evaluate the CPU load performance of the IaaS. This test case should be run in parallel to other Yardstick test cases and not run as a stand-alone test case. Average, minimum and maximun values are obtained. The purpose is also to be able to spot trends. Test results, graphs and similar shall be stored for comparison reasons and product evolution understanding between different OPNFV versions and/or configurations. |
| configuration | file: cpuload.yaml (in the ‘samples’ directory)
|
| test tool | mpstat (mpstat is not always part of a Linux distribution, hence it needs to be installed. It is part of the Yardstick Glance image. However, if mpstat is not present the TC instead uses /proc/stats as source to produce “mpstat” output. |
| references | man-pages |
| applicability | Test can be configured with different:
There are default values for each above-mentioned option. Run in background with other test cases. |
| pre-test conditions | The test case image needs to be installed into Glance with mpstat included in it. No POD specific requirements have been identified. |
| test sequence | description and expected result |
| step 1 | The host is installed. The related TC, or TCs, is invoked and mpstat logs are produced and stored. Result: Stored logs |
| test verdict | None. CPU load results are fetched and stored. |
Yardstick Test Case Description TC037
| Latency, CPU Load, Throughput, Packet Loss | |
| test case id | OPNFV_YARDSTICK_TC037_Latency,CPU Load,Throughput,Packet Loss |
| metric | Number of flows, latency, throughput, CPU load, packet loss |
| test purpose | To evaluate the IaaS network performance with regards to flows and throughput, such as if and how different amounts of flows matter for the throughput between hosts on different compute blades. Typically e.g. the performance of a vSwitch depends on the number of flows running through it. Also performance of other equipment or entities can depend on the number of flows or the packet sizes used. The purpose is also to be able to spot trends. Test results, graphs ans similar shall be stored for comparison reasons and product evolution understanding between different OPNFV versions and/or configurations. |
| configuration | file: opnfv_yardstick_tc037.yaml Packet size: 64 bytes Number of ports: 1, 10, 50, 100, 300, 500, 750 and 1000. The amount configured ports map from 2 up to 1001000 flows, respectively. Each port amount is run two times, for 20 seconds each. Then the next port_amount is run, and so on. During the test CPU load on both client and server, and the network latency between the client and server are measured. The client and server are distributed on different HW. For SLA max_ppm is set to 1000. |
| test tool | pktgen (Pktgen is not always part of a Linux distribution, hence it needs to be installed. It is part of the Yardstick Glance image. As an example see the /yardstick/tools/ directory for how to generate a Linux image with pktgen included.) ping Ping is normally part of any Linux distribution, hence it doesn’t need to be installed. It is also part of the Yardstick Glance image. (For example also a cirros image can be downloaded, it includes ping) mpstat (Mpstat is not always part of a Linux distribution, hence it needs to be installed. It is part of the Yardstick Glance image. |
| references | Ping and Mpstat man pages ETSI-NFV-TST001 |
| applicability | Test can be configured with different packet sizes, amount of flows and test duration. Default values exist. SLA (optional): max_ppm: The number of packets per million packets sent that are acceptable to loose, not received. |
| pre-test conditions | The test case image needs to be installed into Glance with pktgen included in it. No POD specific requirements have been identified. |
| test sequence | description and expected result |
| step 1 | The hosts are installed, as server and client. pktgen is invoked and logs are produced and stored. Result: Logs are stored. |
| test verdict | Fails only if SLA is not passed, or if there is a test case execution problem. |
Yardstick Test Case Description TC038
| Latency, CPU Load, Throughput, Packet Loss (Extended measurements) | |
| test case id | OPNFV_YARDSTICK_TC038_Latency,CPU Load,Throughput,Packet Loss |
| metric | Number of flows, latency, throughput, CPU load, packet loss |
| test purpose | To evaluate the IaaS network performance with regards to flows and throughput, such as if and how different amounts of flows matter for the throughput between hosts on different compute blades. Typically e.g. the performance of a vSwitch depends on the number of flows running through it. Also performance of other equipment or entities can depend on the number of flows or the packet sizes used. The purpose is also to be able to spot trends. Test results, graphs ans similar shall be stored for comparison reasons and product evolution understanding between different OPNFV versions and/or configurations. |
| configuration | file: opnfv_yardstick_tc038.yaml Packet size: 64 bytes Number of ports: 1, 10, 50, 100, 300, 500, 750 and 1000. The amount configured ports map from 2 up to 1001000 flows, respectively. Each port amount is run ten times, for 20 seconds each. Then the next port_amount is run, and so on. During the test CPU load on both client and server, and the network latency between the client and server are measured. The client and server are distributed on different HW. For SLA max_ppm is set to 1000. |
| test tool | pktgen (Pktgen is not always part of a Linux distribution, hence it needs to be installed. It is part of the Yardstick Glance image. As an example see the /yardstick/tools/ directory for how to generate a Linux image with pktgen included.) ping Ping is normally part of any Linux distribution, hence it doesn’t need to be installed. It is also part of the Yardstick Glance image. (For example also a cirros image can be downloaded, it includes ping) mpstat (Mpstat is not always part of a Linux distribution, hence it needs to be installed. It is part of the Yardstick Glance image. |
| references | Ping and Mpstat man pages ETSI-NFV-TST001 |
| applicability | Test can be configured with different packet sizes, amount of flows and test duration. Default values exist. SLA (optional): max_ppm: The number of packets per million packets sent that are acceptable to loose, not received. |
| pre-test conditions | The test case image needs to be installed into Glance with pktgen included in it. No POD specific requirements have been identified. |
| test sequence | description and expected result |
| step 1 | The hosts are installed, as server and client. pktgen is invoked and logs are produced and stored. Result: Logs are stored. |
| test verdict | Fails only if SLA is not passed, or if there is a test case execution problem. |
Yardstick Test Case Description TC0042
| Network Performance | |
| test case id | OPNFV_YARDSTICK_TC042_DPDK pktgen latency measurements |
| metric | L2 Network Latency |
| test purpose | Measure L2 network latency when DPDK is enabled between hosts on different compute blades. |
| configuration | file: opnfv_yardstick_tc042.yaml
|
| test tool |
(DPDK and Pktgen-dpdk are not part of a Linux distribution, hence they needs to be installed. As an example see the /yardstick/tools/ directory for how to generate a Linux image with DPDK and pktgen-dpdk included.) |
| references |
ETSI-NFV-TST001 |
| applicability | Test can be configured with different packet sizes. Default values exist. |
| pre-test conditions | The test case image needs to be installed into Glance with DPDK and pktgen-dpdk included in it. The NICs of compute nodes must support DPDK on POD. And at least compute nodes setup hugepage. If you want to achievement a hight performance result, it is recommend to use NUAM, CPU pin, OVS and so on. |
| test sequence | description and expected result |
| step 1 | The hosts are installed on different blades, as server and client. Both server and client have three interfaces. The first one is management such as ssh. The other two are used by DPDK. |
| step 2 | Testpmd is invoked with configurations to forward packets from one DPDK port to the other on server. |
| step 3 | Pktgen-dpdk is invoked with configurations as a traffic generator and logs are produced and stored on client. Result: Logs are stored. |
| test verdict | Fails only if SLA is not passed, or if there is a test case execution problem. |
Yardstick Test Case Description TC043
| Network Latency Between NFVI Nodes | |
| test case id | OPNFV_YARDSTICK_TC043_Latency_between_NFVI_nodes_ measurements |
| metric | RTT, Round Trip Time |
| test purpose | To do a basic verification that network latency is within acceptable boundaries when packets travel between different nodes. |
| configuration | file: opnfv_yardstick_tc043.yaml Packet size 100 bytes. Total test duration 600 seconds. One ping each 10 seconds. SLA RTT is set to maximum 10 ms. |
| test tool | ping Ping is normally part of any Linux distribution, hence it doesn’t need to be installed. It is also part of the Yardstick Docker image. |
| references | Ping man page ETSI-NFV-TST001 |
| applicability | Test case can be configured with different packet sizes, burst sizes, ping intervals and test duration. SLA is optional. The SLA in this test case serves as an example. Considerably lower RTT is expected, and also normal to achieve in balanced L2 environments. However, to cover most configurations, both bare metal and fully virtualized ones, this value should be possible to achieve and acceptable for black box testing. Many real time applications start to suffer badly if the RTT time is higher than this. Some may suffer bad also close to this RTT, while others may not suffer at all. It is a compromise that may have to be tuned for different configuration purposes. |
| pre_test conditions | Each pod node must have ping included in it. |
| test sequence | description and expected result |
| step 1 | The pod is available. Two nodes as server and client. Ping is invoked and logs are produced and stored. Result: Logs are stored. |
| test verdict | Test should not PASS if any RTT is above the optional SLA value, or if there is a test case execution problem. |
Yardstick Test Case Description TC044
| Memory Utilization | |
| test case id | OPNFV_YARDSTICK_TC044_Memory Utilization |
| metric | Memory utilization |
| test purpose | To evaluate the IaaS compute capability with regards to memory utilization.This test case should be run in parallel to other Yardstick test cases and not run as a stand-alone test case. Measure the memory usage statistics including used memory, free memory, buffer, cache and shared memory. Both average and maximun values are obtained. The purpose is also to be able to spot trends. Test results, graphs and similar shall be stored for comparison reasons and product evolution understanding between different OPNFV versions and/or configurations. |
| configuration | File: memload.yaml (in the ‘samples’ directory)
|
| test tool | free free provides information about unused and used memory and swap space on any computer running Linux or another Unix-like operating system. free is normally part of a Linux distribution, hence it doesn’t needs to be installed. |
| references |
ETSI-NFV-TST001 |
| applicability | Test can be configured with different:
There are default values for each above-mentioned option. Run in background with other test cases. |
| pre-test conditions | The test case image needs to be installed into Glance with free included in the image. No POD specific requirements have been identified. |
| test sequence | description and expected result |
| step 1 | The host is installed as client. The related TC, or TCs, is invoked and free logs are produced and stored. Result: logs are stored. |
| test verdict | None. Memory utilization results are fetched and stored. |
Yardstick Test Case Description TC055
| Compute Capacity | |
| test case id | OPNFV_YARDSTICK_TC055_Compute Capacity |
| metric | Number of cpus, number of cores, number of threads, available memory size and total cache size. |
| test purpose | To evaluate the IaaS compute capacity with regards to hardware specification, including number of cpus, number of cores, number of threads, available memory size and total cache size. Test results, graphs and similar shall be stored for comparison reasons and product evolution understanding between different OPNFV versions and/or configurations. |
| configuration | file: opnfv_yardstick_tc055.yaml There is are no additional configurations to be set for this TC. |
| test tool | /proc/cpuinfo this TC uses /proc/cpuinfo as source to produce compute capacity output. |
| references | /proc/cpuinfo_ ETSI-NFV-TST001 |
| applicability | None. |
| pre-test conditions | No POD specific requirements have been identified. |
| test sequence | description and expected result |
| step 1 | The hosts are installed, TC is invoked and logs are produced and stored. Result: Logs are stored. |
| test verdict | None. Hardware specification are fetched and stored. |
Yardstick Test Case Description TC061
| Network Utilization | |
| test case id | OPNFV_YARDSTICK_TC061_Network Utilization |
| metric | Network utilization |
| test purpose | To evaluate the IaaS network capability with regards to network utilization, including Total number of packets received per second, Total number of packets transmitted per second, Total number of kilobytes received per second, Total number of kilobytes transmitted per second, Number of compressed packets received per second (for cslip etc.), Number of compressed packets transmitted per second, Number of multicast packets received per second, Utilization percentage of the network interface. This test case should be run in parallel to other Yardstick test cases and not run as a stand-alone test case. Measure the network usage statistics from the network devices Average, minimum and maximun values are obtained. The purpose is also to be able to spot trends. Test results, graphs and similar shall be stored for comparison reasons and product evolution understanding between different OPNFV versions and/or configurations. |
| configuration | File: netutilization.yaml (in the ‘samples’ directory)
|
| test tool | sar The sar command writes to standard output the contents of selected cumulative activity counters in the operating system. sar is normally part of a Linux distribution, hence it doesn’t needs to be installed. |
| references |
ETSI-NFV-TST001 |
| applicability | Test can be configured with different:
There are default values for each above-mentioned option. Run in background with other test cases. |
| pre-test conditions | The test case image needs to be installed into Glance with sar included in the image. No POD specific requirements have been identified. |
| test sequence | description and expected result. |
| step 1 | The host is installed as client. The related TC, or TCs, is invoked and sar logs are produced and stored. Result: logs are stored. |
| test verdict | None. Network utilization results are fetched and stored. |
Yardstick Test Case Description TC063
| Storage Capacity | |
| test case id | OPNFV_YARDSTICK_TC063_Storage Capacity |
| metric | Storage/disk size, block size Disk Utilization |
| test purpose | This test case will check the parameters which could decide several models and each model has its specified task to measure. The test purposes are to measure disk size, block size and disk utilization. With the test results, we could evaluate the storage capacity of the host. |
| configuration |
|
| test tool | fdisk A command-line utility that provides disk partitioning functions iostat This is a computer system monitor tool used to collect and show operating system storage input and output statistics. |
| references |
ETSI-NFV-TST001 |
| applicability | Test can be configured with different:
There are default values for each above-mentioned option. Run in background with other test cases. |
| pre-test conditions | The test case image needs to be installed into Glance No POD specific requirements have been identified. |
| test sequence | Output the specific storage capacity of disk information as the sequence into file. |
| step 1 | The pod is available and the hosts are installed. Node5 is used and logs are produced and stored. Result: Logs are stored. |
| test verdict | None. |
Yardstick Test Case Description TC069
| Memory Bandwidth | |
| test case id | OPNFV_YARDSTICK_TC069_Memory Bandwidth |
| metric | Megabyte per second (MBps) |
| test purpose | To evaluate the IaaS compute performance with regards to memory bandwidth. Measure the maximum possible cache and memory performance while reading and writing certain blocks of data (starting from 1Kb and further in power of 2) continuously through ALU and FPU respectively. Measure different aspects of memory performance via synthetic simulations. Each simulation consists of four performances (Copy, Scale, Add, Triad). Test results, graphs and similar shall be stored for comparison reasons and product evolution understanding between different OPNFV versions and/or configurations. |
| configuration | File: opnfv_yardstick_tc069.yaml
|
| test tool | RAMspeed RAMspeed is a free open source command line utility to measure cache and memory performance of computer systems. RAMspeed is not always part of a Linux distribution, hence it needs to be installed in the test image. |
| references |
ETSI-NFV-TST001 |
| applicability | Test can be configured with different:
There are default values for each above-mentioned option. |
| pre-test conditions | The test case image needs to be installed into Glance with RAmspeed included in the image. No POD specific requirements have been identified. |
| test sequence | description and expected result |
| step 1 | The host is installed as client. RAMspeed is invoked and logs are produced and stored. Result: logs are stored. |
| test verdict | Test fails if the measured memory bandwidth is below the SLA value or if there is a test case execution problem. |
Yardstick Test Case Description TC070
| Latency, Memory Utilization, Throughput, Packet Loss | |
| test case id | OPNFV_YARDSTICK_TC070_Latency, Memory Utilization, Throughput,Packet Loss |
| metric | Number of flows, latency, throughput, Memory Utilization, packet loss |
| test purpose | To evaluate the IaaS network performance with regards to flows and throughput, such as if and how different amounts of flows matter for the throughput between hosts on different compute blades. Typically e.g. the performance of a vSwitch depends on the number of flows running through it. Also performance of other equipment or entities can depend on the number of flows or the packet sizes used. The purpose is also to be able to spot trends. Test results, graphs and similar shall be stored for comparison reasons and product evolution understanding between different OPNFV versions and/or configurations. |
| configuration | file: opnfv_yardstick_tc070.yaml Packet size: 64 bytes Number of ports: 1, 10, 50, 100, 300, 500, 750 and 1000. The amount configured ports map from 2 up to 1001000 flows, respectively. Each port amount is run two times, for 20 seconds each. Then the next port_amount is run, and so on. During the test Memory Utilization on both client and server, and the network latency between the client and server are measured. The client and server are distributed on different HW. For SLA max_ppm is set to 1000. |
| test tool | pktgen Pktgen is not always part of a Linux distribution, hence it needs to be installed. It is part of the Yardstick Glance image. (As an example see the /yardstick/tools/ directory for how to generate a Linux image with pktgen included.) ping Ping is normally part of any Linux distribution, hence it doesn’t need to be installed. It is also part of the Yardstick Glance image. (For example also a cirros image can be downloaded, it includes ping) free free provides information about unused and used memory and swap space on any computer running Linux or another Unix-like operating system. free is normally part of a Linux distribution, hence it doesn’t needs to be installed. |
| references | Ping and free man pages ETSI-NFV-TST001 |
| applicability | Test can be configured with different packet sizes, amount of flows and test duration. Default values exist. SLA (optional): max_ppm: The number of packets per million packets sent that are acceptable to lose, not received. |
| pre-test conditions | The test case image needs to be installed into Glance with pktgen included in it. No POD specific requirements have been identified. |
| test sequence | description and expected result |
| step 1 | The hosts are installed, as server and client. pktgen is invoked and logs are produced and stored. Result: Logs are stored. |
| test verdict | Fails only if SLA is not passed, or if there is a test case execution problem. |
Yardstick Test Case Description TC071
| Latency, Cache Utilization, Throughput, Packet Loss | |
| test case id | OPNFV_YARDSTICK_TC071_Latency, Cache Utilization, Throughput,Packet Loss |
| metric | Number of flows, latency, throughput, Cache Utilization, packet loss |
| test purpose | To evaluate the IaaS network performance with regards to flows and throughput, such as if and how different amounts of flows matter for the throughput between hosts on different compute blades. Typically e.g. the performance of a vSwitch depends on the number of flows running through it. Also performance of other equipment or entities can depend on the number of flows or the packet sizes used. The purpose is also to be able to spot trends. Test results, graphs and similar shall be stored for comparison reasons and product evolution understanding between different OPNFV versions and/or configurations. |
| configuration | file: opnfv_yardstick_tc071.yaml Packet size: 64 bytes Number of ports: 1, 10, 50, 100, 300, 500, 750 and 1000. The amount configured ports map from 2 up to 1001000 flows, respectively. Each port amount is run two times, for 20 seconds each. Then the next port_amount is run, and so on. During the test Cache Utilization on both client and server, and the network latency between the client and server are measured. The client and server are distributed on different HW. For SLA max_ppm is set to 1000. |
| test tool | pktgen Pktgen is not always part of a Linux distribution, hence it needs to be installed. It is part of the Yardstick Glance image. (As an example see the /yardstick/tools/ directory for how to generate a Linux image with pktgen included.) ping Ping is normally part of any Linux distribution, hence it doesn’t need to be installed. It is also part of the Yardstick Glance image. (For example also a cirros image can be downloaded, it includes ping) cachestat cachestat is not always part of a Linux distribution, hence it needs to be installed. |
| references | Ping man pages ETSI-NFV-TST001 |
| applicability | Test can be configured with different packet sizes, amount of flows and test duration. Default values exist. SLA (optional): max_ppm: The number of packets per million packets sent that are acceptable to lose, not received. |
| pre-test conditions | The test case image needs to be installed into Glance with pktgen included in it. No POD specific requirements have been identified. |
| test sequence | description and expected result |
| step 1 | The hosts are installed, as server and client. pktgen is invoked and logs are produced and stored. Result: Logs are stored. |
| test verdict | Fails only if SLA is not passed, or if there is a test case execution problem. |
Yardstick Test Case Description TC072
| Latency, Network Utilization, Throughput, Packet Loss | |
| test case id | OPNFV_YARDSTICK_TC072_Latency, Network Utilization, Throughput,Packet Loss |
| metric | Number of flows, latency, throughput, Network Utilization, packet loss |
| test purpose | To evaluate the IaaS network performance with regards to flows and throughput, such as if and how different amounts of flows matter for the throughput between hosts on different compute blades. Typically e.g. the performance of a vSwitch depends on the number of flows running through it. Also performance of other equipment or entities can depend on the number of flows or the packet sizes used. The purpose is also to be able to spot trends. Test results, graphs and similar shall be stored for comparison reasons and product evolution understanding between different OPNFV versions and/or configurations. |
| configuration | file: opnfv_yardstick_tc072.yaml Packet size: 64 bytes Number of ports: 1, 10, 50, 100, 300, 500, 750 and 1000. The amount configured ports map from 2 up to 1001000 flows, respectively. Each port amount is run two times, for 20 seconds each. Then the next port_amount is run, and so on. During the test Network Utilization on both client and server, and the network latency between the client and server are measured. The client and server are distributed on different HW. For SLA max_ppm is set to 1000. |
| test tool | pktgen Pktgen is not always part of a Linux distribution, hence it needs to be installed. It is part of the Yardstick Glance image. (As an example see the /yardstick/tools/ directory for how to generate a Linux image with pktgen included.) ping Ping is normally part of any Linux distribution, hence it doesn’t need to be installed. It is also part of the Yardstick Glance image. (For example also a cirros image can be downloaded, it includes ping) sar The sar command writes to standard output the contents of selected cumulative activity counters in the operating system. sar is normally part of a Linux distribution, hence it doesn’t needs to be installed. |
| references | Ping and sar man pages ETSI-NFV-TST001 |
| applicability | Test can be configured with different packet sizes, amount of flows and test duration. Default values exist. SLA (optional): max_ppm: The number of packets per million packets sent that are acceptable to lose, not received. |
| pre-test conditions | The test case image needs to be installed into Glance with pktgen included in it. No POD specific requirements have been identified. |
| test sequence | description and expected result |
| step 1 | The hosts are installed, as server and client. pktgen is invoked and logs are produced and stored. Result: Logs are stored. |
| test verdict | Fails only if SLA is not passed, or if there is a test case execution problem. |
Yardstick Test Case Description TC073
| Throughput per NFVI node test | |
| test case id | OPNFV_YARDSTICK_TC073_Network latency and throughput between nodes |
| metric | Network latency and throughput |
| test purpose | To evaluate the IaaS network performance with regards to flows and throughput, such as if and how different amounts of packet sizes and flows matter for the throughput between nodes in one pod. |
| configuration | file: opnfv_yardstick_tc073.yaml Packet size: default 1024 bytes. Test length: default 20 seconds. The client and server are distributed on different nodes. For SLA max_mean_latency is set to 100. |
| test tool | netperf Netperf is a software application that provides network bandwidth testing between two hosts on a network. It supports Unix domain sockets, TCP, SCTP, DLPI and UDP via BSD Sockets. Netperf provides a number of predefined tests e.g. to measure bulk (unidirectional) data transfer or request response performance. (netperf is not always part of a Linux distribution, hence it needs to be installed.) |
| references | netperf Man pages ETSI-NFV-TST001 |
| applicability | Test can be configured with different packet sizes and test duration. Default values exist. SLA (optional): max_mean_latency |
| pre-test conditions | The POD can be reached by external ip and logged on via ssh |
| test sequence | description and expected result |
| step 1 | Install netperf tool on each specified node, one is as the server, and the other as the client. |
| step 2 | Log on to the client node and use the netperf command to execute the network performance test |
| step 3 | The throughput results stored. |
| test verdict | Fails only if SLA is not passed, or if there is a test case execution problem. |
Yardstick Test Case Description TC075
| Network Capacity and Scale Testing | |
| test case id | OPNFV_YARDSTICK_TC075_Network_Capacity_and_Scale_testing |
| metric | Number of connections, Number of frames sent/received |
| test purpose | To evaluate the network capacity and scale with regards to connections and frmaes. |
| configuration | file: opnfv_yardstick_tc075.yaml There is no additional configuration to be set for this TC. |
| test tool | netstar Netstat is normally part of any Linux distribution, hence it doesn’t need to be installed. |
| references | Netstat man page ETSI-NFV-TST001 |
| applicability | This test case is mainly for evaluating network performance. |
| pre_test conditions | Each pod node must have netstat included in it. |
| test sequence | description and expected result |
| step 1 | The pod is available. Netstat is invoked and logs are produced and stored. Result: Logs are stored. |
| test verdict | None. Number of connections and frames are fetched and stored. |
OPNFV Feature Test Cases
H A
Yardstick Test Case Description TC019
| Control Node Openstack Service High Availability | |
| test case id | OPNFV_YARDSTICK_TC019_HA: Control node Openstack service down |
| test purpose | This test case will verify the high availability of the service provided by OpenStack (like nova-api, neutro-server) on control node. |
| test method | This test case kills the processes of a specific Openstack service on a selected control node, then checks whether the request of the related Openstack command is OK and the killed processes are recovered. |
| attackers | In this test case, an attacker called “kill-process” is needed. This attacker includes three parameters: 1) fault_type: which is used for finding the attacker’s scripts. It should be always set to “kill-process” in this test case. 2) process_name: which is the process name of the specified OpenStack service. If there are multiple processes use the same name on the host, all of them are killed by this attacker. 3) host: which is the name of a control node being attacked. e.g. -fault_type: “kill-process” -process_name: “nova-api” -host: node1 |
| monitors | In this test case, two kinds of monitor are needed: 1. the “openstack-cmd” monitor constantly request a specific
1) monitor_type: which is used for finding the monitor class and related scritps. It should be always set to “openstack-cmd” for this monitor. 2) command_name: which is the command name used for request
1) monitor_type: which used for finding the monitor class and related scritps. It should be always set to “process” for this monitor. 2) process_name: which is the process name for monitor 3) host: which is the name of the node runing the process e.g. monitor1: -monitor_type: “openstack-cmd” -command_name: “nova image-list” monitor2: -monitor_type: “process” -process_name: “nova-api” -host: node1 |
| metrics | In this test case, there are two metrics: 1)service_outage_time: which indicates the maximum outage time (seconds) of the specified Openstack command request. 2)process_recover_time: which indicates the maximun time (seconds) from the process being killed to recovered |
| test tool | Developed by the project. Please see folder: “yardstick/benchmark/scenarios/availability/ha_tools” |
| references | ETSI NFV REL001 |
| configuration | This test case needs two configuration files: 1) test case file: opnfv_yardstick_tc019.yaml -Attackers: see above “attackers” discription -waiting_time: which is the time (seconds) from the process being killed to stoping monitors the monitors -Monitors: see above “monitors” discription -SLA: see above “metrics” discription 2)POD file: pod.yaml The POD configuration should record on pod.yaml first. the “host” item in this test case will use the node name in the pod.yaml. |
| test sequence | description and expected result |
| step 1 | start monitors: each monitor will run with independently process Result: The monitor info will be collected. |
| step 2 | do attacker: connect the host through SSH, and then execute the kill process script with param value specified by “process_name” Result: Process will be killed. |
| step 3 | stop monitors after a period of time specified by “waiting_time” Result: The monitor info will be aggregated. |
| step 4 | verify the SLA Result: The test case is passed or not. |
| post-action | It is the action when the test cases exist. It will check the status of the specified process on the host, and restart the process if it is not running for next test cases |
| test verdict | Fails only if SLA is not passed, or if there is a test case execution problem. |
Yardstick Test Case Description TC025
| OpenStack Controller Node abnormally shutdown High Availability | |
| test case id | OPNFV_YARDSTICK_TC025_HA: OpenStack Controller Node abnormally shutdown |
| test purpose | This test case will verify the high availability of controller node. When one of the controller node abnormally shutdown, the service provided by it should be OK. |
| test method | This test case shutdowns a specified controller node with some fault injection tools, then checks whether all services provided by the controller node are OK with some monitor tools. |
| attackers | In this test case, an attacker called “host-shutdown” is needed. This attacker includes two parameters: 1) fault_type: which is used for finding the attacker’s scripts. It should be always set to “host-shutdown” in this test case. 2) host: the name of a controller node being attacked. e.g. -fault_type: “host-shutdown” -host: node1 |
| monitors | In this test case, one kind of monitor are needed: 1. the “openstack-cmd” monitor constantly request a specific
1) monitor_type: which is used for finding the monitor class and related scritps. It should be always set to “openstack-cmd” for this monitor. 2) command_name: which is the command name used for request There are four instance of the “openstack-cmd” monitor: monitor1: -monitor_type: “openstack-cmd” -api_name: “nova image-list” monitor2: -monitor_type: “openstack-cmd” -api_name: “neutron router-list” monitor3: -monitor_type: “openstack-cmd” -api_name: “heat stack-list” monitor4: -monitor_type: “openstack-cmd” -api_name: “cinder list” |
| metrics | In this test case, there is one metric: 1)service_outage_time: which indicates the maximum outage time (seconds) of the specified Openstack command request. |
| test tool | Developed by the project. Please see folder: “yardstick/benchmark/scenarios/availability/ha_tools” |
| references | ETSI NFV REL001 |
| configuration | This test case needs two configuration files: 1) test case file: opnfv_yardstick_tc019.yaml -Attackers: see above “attackers” discription -waiting_time: which is the time (seconds) from the process being killed to stoping monitors the monitors -Monitors: see above “monitors” discription -SLA: see above “metrics” discription 2)POD file: pod.yaml The POD configuration should record on pod.yaml first. the “host” item in this test case will use the node name in the pod.yaml. |
| test sequence | description and expected result |
| step 1 | start monitors: each monitor will run with independently process Result: The monitor info will be collected. |
| step 2 | do attacker: connect the host through SSH, and then execute shutdown script on the host Result: The host will be shutdown. |
| step 3 | stop monitors after a period of time specified by “waiting_time” Result: All monitor result will be aggregated. |
| step 4 | verify the SLA Result: The test case is passed or not. |
| post-action | It is the action when the test cases exist. It restarts the specified controller node if it is not restarted. |
| test verdict | Fails only if SLA is not passed, or if there is a test case execution problem. |
Yardstick Test Case Description TC045
| Control Node Openstack Service High Availability - Neutron Server | |
| test case id | OPNFV_YARDSTICK_TC045: Control node Openstack service down - neutron server |
| test purpose | This test case will verify the high availability of the network service provided by OpenStack (neutro-server) on control node. |
| test method | This test case kills the processes of neutron-server service on a selected control node, then checks whether the request of the related Openstack command is OK and the killed processes are recovered. |
| attackers | In this test case, an attacker called “kill-process” is needed. This attacker includes three parameters: 1) fault_type: which is used for finding the attacker’s scripts. It should be always set to “kill-process” in this test case. 2) process_name: which is the process name of the specified OpenStack service. If there are multiple processes use the same name on the host, all of them are killed by this attacker. In this case. This parameter should always set to “neutron- server”. 3) host: which is the name of a control node being attacked. e.g. -fault_type: “kill-process” -process_name: “neutron-server” -host: node1 |
| monitors | In this test case, two kinds of monitor are needed: 1. the “openstack-cmd” monitor constantly request a specific Openstack command, which needs two parameters: 1) monitor_type: which is used for finding the monitor class and related scritps. It should be always set to “openstack-cmd” for this monitor. 2) command_name: which is the command name used for request. In this case, the command name should be neutron related commands. 2. the “process” monitor check whether a process is running on a specific node, which needs three parameters: 1) monitor_type: which used for finding the monitor class and related scritps. It should be always set to “process” for this monitor. 2) process_name: which is the process name for monitor 3) host: which is the name of the node runing the process e.g. monitor1: -monitor_type: “openstack-cmd” -command_name: “neutron agent-list” monitor2: -monitor_type: “process” -process_name: “neutron-server” -host: node1 |
| metrics | In this test case, there are two metrics: 1)service_outage_time: which indicates the maximum outage time (seconds) of the specified Openstack command request. 2)process_recover_time: which indicates the maximun time (seconds) from the process being killed to recovered |
| test tool | Developed by the project. Please see folder: “yardstick/benchmark/scenarios/availability/ha_tools” |
| references | ETSI NFV REL001 |
| configuration | This test case needs two configuration files: 1) test case file: opnfv_yardstick_tc045.yaml -Attackers: see above “attackers” discription -waiting_time: which is the time (seconds) from the process being killed to stoping monitors the monitors -Monitors: see above “monitors” discription -SLA: see above “metrics” discription 2)POD file: pod.yaml The POD configuration should record on pod.yaml first. the “host” item in this test case will use the node name in the pod.yaml. |
| test sequence | description and expected result |
| step 1 | start monitors: each monitor will run with independently process Result: The monitor info will be collected. |
| step 2 | do attacker: connect the host through SSH, and then execute the kill process script with param value specified by “process_name” Result: Process will be killed. |
| step 3 | stop monitors after a period of time specified by “waiting_time” Result: The monitor info will be aggregated. |
| step 4 | verify the SLA Result: The test case is passed or not. |
| post-action | It is the action when the test cases exist. It will check the status of the specified process on the host, and restart the process if it is not running for next test cases |
| test verdict | Fails only if SLA is not passed, or if there is a test case execution problem. |
Yardstick Test Case Description TC046
| Control Node Openstack Service High Availability - Keystone | |
| test case id | OPNFV_YARDSTICK_TC046: Control node Openstack service down - keystone |
| test purpose | This test case will verify the high availability of the user service provided by OpenStack (keystone) on control node. |
| test method | This test case kills the processes of keystone service on a selected control node, then checks whether the request of the related Openstack command is OK and the killed processes are recovered. |
| attackers | In this test case, an attacker called “kill-process” is needed. This attacker includes three parameters: 1) fault_type: which is used for finding the attacker’s scripts. It should be always set to “kill-process” in this test case. 2) process_name: which is the process name of the specified OpenStack service. If there are multiple processes use the same name on the host, all of them are killed by this attacker. In this case. This parameter should always set to “keystone” 3) host: which is the name of a control node being attacked. e.g. -fault_type: “kill-process” -process_name: “keystone” -host: node1 |
| monitors | In this test case, two kinds of monitor are needed: 1. the “openstack-cmd” monitor constantly request a specific Openstack command, which needs two parameters: 1) monitor_type: which is used for finding the monitor class and related scritps. It should be always set to “openstack-cmd” for this monitor. 2) command_name: which is the command name used for request. In this case, the command name should be keystone related commands. 2. the “process” monitor check whether a process is running on a specific node, which needs three parameters: 1) monitor_type: which used for finding the monitor class and related scritps. It should be always set to “process” for this monitor. 2) process_name: which is the process name for monitor 3) host: which is the name of the node runing the process e.g. monitor1: -monitor_type: “openstack-cmd” -command_name: “keystone user-list” monitor2: -monitor_type: “process” -process_name: “keystone” -host: node1 |
| metrics | In this test case, there are two metrics: 1)service_outage_time: which indicates the maximum outage time (seconds) of the specified Openstack command request. 2)process_recover_time: which indicates the maximun time (seconds) from the process being killed to recovered |
| test tool | Developed by the project. Please see folder: “yardstick/benchmark/scenarios/availability/ha_tools” |
| references | ETSI NFV REL001 |
| configuration | This test case needs two configuration files: 1) test case file: opnfv_yardstick_tc046.yaml -Attackers: see above “attackers” discription -waiting_time: which is the time (seconds) from the process being killed to stoping monitors the monitors -Monitors: see above “monitors” discription -SLA: see above “metrics” discription 2)POD file: pod.yaml The POD configuration should record on pod.yaml first. the “host” item in this test case will use the node name in the pod.yaml. |
| test sequence | description and expected result |
| step 1 | start monitors: each monitor will run with independently process Result: The monitor info will be collected. |
| step 2 | do attacker: connect the host through SSH, and then execute the kill process script with param value specified by “process_name” Result: Process will be killed. |
| step 3 | stop monitors after a period of time specified by “waiting_time” Result: The monitor info will be aggregated. |
| step 4 | verify the SLA Result: The test case is passed or not. |
| post-action | It is the action when the test cases exist. It will check the status of the specified process on the host, and restart the process if it is not running for next test cases |
| test verdict | Fails only if SLA is not passed, or if there is a test case execution problem. |
Yardstick Test Case Description TC047
| Control Node Openstack Service High Availability - Glance Api | |
| test case id | OPNFV_YARDSTICK_TC047: Control node Openstack service down - glance api |
| test purpose | This test case will verify the high availability of the image service provided by OpenStack (glance-api) on control node. |
| test method | This test case kills the processes of glance-api service on a selected control node, then checks whether the request of the related Openstack command is OK and the killed processes are recovered. |
| attackers | In this test case, an attacker called “kill-process” is needed. This attacker includes three parameters: 1) fault_type: which is used for finding the attacker’s scripts. It should be always set to “kill-process” in this test case. 2) process_name: which is the process name of the specified OpenStack service. If there are multiple processes use the same name on the host, all of them are killed by this attacker. In this case. This parameter should always set to “glance- api”. 3) host: which is the name of a control node being attacked. e.g. -fault_type: “kill-process” -process_name: “glance-api” -host: node1 |
| monitors | In this test case, two kinds of monitor are needed: 1. the “openstack-cmd” monitor constantly request a specific Openstack command, which needs two parameters: 1) monitor_type: which is used for finding the monitor class and related scritps. It should be always set to “openstack-cmd” for this monitor. 2) command_name: which is the command name used for request. In this case, the command name should be glance related commands. 2. the “process” monitor check whether a process is running on a specific node, which needs three parameters: 1) monitor_type: which used for finding the monitor class and related scritps. It should be always set to “process” for this monitor. 2) process_name: which is the process name for monitor 3) host: which is the name of the node runing the process e.g. monitor1: -monitor_type: “openstack-cmd” -command_name: “glance image-list” monitor2: -monitor_type: “process” -process_name: “glance-api” -host: node1 |
| metrics | In this test case, there are two metrics: 1)service_outage_time: which indicates the maximum outage time (seconds) of the specified Openstack command request. 2)process_recover_time: which indicates the maximun time (seconds) from the process being killed to recovered |
| test tool | Developed by the project. Please see folder: “yardstick/benchmark/scenarios/availability/ha_tools” |
| references | ETSI NFV REL001 |
| configuration | This test case needs two configuration files: 1) test case file: opnfv_yardstick_tc047.yaml -Attackers: see above “attackers” discription -waiting_time: which is the time (seconds) from the process being killed to stoping monitors the monitors -Monitors: see above “monitors” discription -SLA: see above “metrics” discription 2)POD file: pod.yaml The POD configuration should record on pod.yaml first. the “host” item in this test case will use the node name in the pod.yaml. |
| test sequence | description and expected result |
| step 1 | start monitors: each monitor will run with independently process Result: The monitor info will be collected. |
| step 2 | do attacker: connect the host through SSH, and then execute the kill process script with param value specified by “process_name” Result: Process will be killed. |
| step 3 | stop monitors after a period of time specified by “waiting_time” Result: The monitor info will be aggregated. |
| step 4 | verify the SLA Result: The test case is passed or not. |
| post-action | It is the action when the test cases exist. It will check the status of the specified process on the host, and restart the process if it is not running for next test cases |
| test verdict | Fails only if SLA is not passed, or if there is a test case execution problem. |
Yardstick Test Case Description TC048
| Control Node Openstack Service High Availability - Cinder Api | |
| test case id | OPNFV_YARDSTICK_TC048: Control node Openstack service down - cinder api |
| test purpose | This test case will verify the high availability of the volume service provided by OpenStack (cinder-api) on control node. |
| test method | This test case kills the processes of cinder-api service on a selected control node, then checks whether the request of the related Openstack command is OK and the killed processes are recovered. |
| attackers | In this test case, an attacker called “kill-process” is needed. This attacker includes three parameters: 1) fault_type: which is used for finding the attacker’s scripts. It should be always set to “kill-process” in this test case. 2) process_name: which is the process name of the specified OpenStack service. If there are multiple processes use the same name on the host, all of them are killed by this attacker. In this case. This parameter should always set to “cinder- api”. 3) host: which is the name of a control node being attacked. e.g. -fault_type: “kill-process” -process_name: “cinder-api” -host: node1 |
| monitors | In this test case, two kinds of monitor are needed: 1. the “openstack-cmd” monitor constantly request a specific Openstack command, which needs two parameters: 1) monitor_type: which is used for finding the monitor class and related scritps. It should be always set to “openstack-cmd” for this monitor. 2) command_name: which is the command name used for request. In this case, the command name should be cinder related commands. 2. the “process” monitor check whether a process is running on a specific node, which needs three parameters: 1) monitor_type: which used for finding the monitor class and related scritps. It should be always set to “process” for this monitor. 2) process_name: which is the process name for monitor 3) host: which is the name of the node runing the process e.g. monitor1: -monitor_type: “openstack-cmd” -command_name: “cinder list” monitor2: -monitor_type: “process” -process_name: “cinder-api” -host: node1 |
| metrics | In this test case, there are two metrics: 1)service_outage_time: which indicates the maximum outage time (seconds) of the specified Openstack command request. 2)process_recover_time: which indicates the maximun time (seconds) from the process being killed to recovered |
| test tool | Developed by the project. Please see folder: “yardstick/benchmark/scenarios/availability/ha_tools” |
| references | ETSI NFV REL001 |
| configuration | This test case needs two configuration files: 1) test case file: opnfv_yardstick_tc048.yaml -Attackers: see above “attackers” discription -waiting_time: which is the time (seconds) from the process being killed to stoping monitors the monitors -Monitors: see above “monitors” discription -SLA: see above “metrics” discription 2)POD file: pod.yaml The POD configuration should record on pod.yaml first. the “host” item in this test case will use the node name in the pod.yaml. |
| test sequence | description and expected result |
| step 1 | start monitors: each monitor will run with independently process Result: The monitor info will be collected. |
| step 2 | do attacker: connect the host through SSH, and then execute the kill process script with param value specified by “process_name” Result: Process will be killed. |
| step 3 | stop monitors after a period of time specified by “waiting_time” Result: The monitor info will be aggregated. |
| step 4 | verify the SLA Result: The test case is passed or not. |
| post-action | It is the action when the test cases exist. It will check the status of the specified process on the host, and restart the process if it is not running for next test cases |
| test verdict | Fails only if SLA is not passed, or if there is a test case execution problem. |
Yardstick Test Case Description TC049
| Control Node Openstack Service High Availability - Swift Proxy | |
| test case id | OPNFV_YARDSTICK_TC049: Control node Openstack service down - swift proxy |
| test purpose | This test case will verify the high availability of the storage service provided by OpenStack (swift-proxy) on control node. |
| test method | This test case kills the processes of swift-proxy service on a selected control node, then checks whether the request of the related Openstack command is OK and the killed processes are recovered. |
| attackers | In this test case, an attacker called “kill-process” is needed. This attacker includes three parameters: 1) fault_type: which is used for finding the attacker’s scripts. It should be always set to “kill-process” in this test case. 2) process_name: which is the process name of the specified OpenStack service. If there are multiple processes use the same name on the host, all of them are killed by this attacker. In this case. This parameter should always set to “swift- proxy”. 3) host: which is the name of a control node being attacked. e.g. -fault_type: “kill-process” -process_name: “swift-proxy” -host: node1 |
| monitors | In this test case, two kinds of monitor are needed: 1. the “openstack-cmd” monitor constantly request a specific Openstack command, which needs two parameters: 1) monitor_type: which is used for finding the monitor class and related scritps. It should be always set to “openstack-cmd” for this monitor. 2) command_name: which is the command name used for request. In this case, the command name should be swift related commands. 2. the “process” monitor check whether a process is running on a specific node, which needs three parameters: 1) monitor_type: which used for finding the monitor class and related scritps. It should be always set to “process” for this monitor. 2) process_name: which is the process name for monitor 3) host: which is the name of the node runing the process e.g. monitor1: -monitor_type: “openstack-cmd” -command_name: “swift stat” monitor2: -monitor_type: “process” -process_name: “swift-proxy” -host: node1 |
| metrics | In this test case, there are two metrics: 1)service_outage_time: which indicates the maximum outage time (seconds) of the specified Openstack command request. 2)process_recover_time: which indicates the maximun time (seconds) from the process being killed to recovered |
| test tool | Developed by the project. Please see folder: “yardstick/benchmark/scenarios/availability/ha_tools” |
| references | ETSI NFV REL001 |
| configuration | This test case needs two configuration files: 1) test case file: opnfv_yardstick_tc049.yaml -Attackers: see above “attackers” discription -waiting_time: which is the time (seconds) from the process being killed to stoping monitors the monitors -Monitors: see above “monitors” discription -SLA: see above “metrics” discription 2)POD file: pod.yaml The POD configuration should record on pod.yaml first. the “host” item in this test case will use the node name in the pod.yaml. |
| test sequence | description and expected result |
| step 1 | start monitors: each monitor will run with independently process Result: The monitor info will be collected. |
| step 2 | do attacker: connect the host through SSH, and then execute the kill process script with param value specified by “process_name” Result: Process will be killed. |
| step 3 | stop monitors after a period of time specified by “waiting_time” Result: The monitor info will be aggregated. |
| step 4 | verify the SLA Result: The test case is passed or not. |
| post-action | It is the action when the test cases exist. It will check the status of the specified process on the host, and restart the process if it is not running for next test cases |
| test verdict | Fails only if SLA is not passed, or if there is a test case execution problem. |
Yardstick Test Case Description TC050
| OpenStack Controller Node Network High Availability | |
| test case id | OPNFV_YARDSTICK_TC050: OpenStack Controller Node Network High Availability |
| test purpose | This test case will verify the high availability of control node. When one of the controller failed to connect the network, which breaks down the Openstack services on this node. These Openstack service should able to be accessed by other controller nodes, and the services on failed controller node should be isolated. |
| test method | This test case turns off the network interfaces of a specified control node, then checks whether all services provided by the control node are OK with some monitor tools. |
| attackers | In this test case, an attacker called “close-interface” is needed. This attacker includes three parameters: 1) fault_type: which is used for finding the attacker’s scripts. It should be always set to “close-interface” in this test case. 2) host: which is the name of a control node being attacked. 3) interface: the network interface to be turned off. There are four instance of the “close-interface” monitor: attacker1(for public netork): -fault_type: “close-interface” -host: node1 -interface: “br-ex” attacker2(for management netork): -fault_type: “close-interface” -host: node1 -interface: “br-mgmt” attacker3(for storage netork): -fault_type: “close-interface” -host: node1 -interface: “br-storage” attacker4(for private netork): -fault_type: “close-interface” -host: node1 -interface: “br-mesh” |
| monitors | In this test case, the monitor named “openstack-cmd” is needed. The monitor needs needs two parameters: 1) monitor_type: which is used for finding the monitor class and related scritps. It should be always set to “openstack-cmd” for this monitor. 2) command_name: which is the command name used for request There are four instance of the “openstack-cmd” monitor: monitor1: -monitor_type: “openstack-cmd” -command_name: “nova image-list” monitor2: -monitor_type: “openstack-cmd” -command_name: “neutron router-list” monitor3: -monitor_type: “openstack-cmd” -command_name: “heat stack-list” monitor4: -monitor_type: “openstack-cmd” -command_name: “cinder list” |
| metrics | In this test case, there is one metric: 1)service_outage_time: which indicates the maximum outage time (seconds) of the specified Openstack command request. |
| test tool | Developed by the project. Please see folder: “yardstick/benchmark/scenarios/availability/ha_tools” |
| references | ETSI NFV REL001 |
| configuration | This test case needs two configuration files: 1) test case file: opnfv_yardstick_tc050.yaml -Attackers: see above “attackers” discription -waiting_time: which is the time (seconds) from the process being killed to stoping monitors the monitors -Monitors: see above “monitors” discription -SLA: see above “metrics” discription 2)POD file: pod.yaml The POD configuration should record on pod.yaml first. the “host” item in this test case will use the node name in the pod.yaml. |
| test sequence | description and expected result |
| step 1 | start monitors: each monitor will run with independently process Result: The monitor info will be collected. |
| step 2 | do attacker: connect the host through SSH, and then execute the turnoff network interface script with param value specified by “interface”. Result: Network interfaces will be turned down. |
| step 3 | stop monitors after a period of time specified by “waiting_time” Result: The monitor info will be aggregated. |
| step 4 | verify the SLA Result: The test case is passed or not. |
| post-action | It is the action when the test cases exist. It turns up the network interface of the control node if it is not turned up. |
| test verdict | Fails only if SLA is not passed, or if there is a test case execution problem. |
Yardstick Test Case Description TC051
| OpenStack Controller Node CPU Overload High Availability | |
| test case id | OPNFV_YARDSTICK_TC051: OpenStack Controller Node CPU Overload High Availability |
| test purpose | This test case will verify the high availability of control node. When the CPU usage of a specified controller node is stressed to 100%, which breaks down the Openstack services on this node. These Openstack service should able to be accessed by other controller nodes, and the services on failed controller node should be isolated. |
| test method | This test case stresses the CPU uasge of a specified control node to 100%, then checks whether all services provided by the environment are OK with some monitor tools. |
| attackers | In this test case, an attacker called “stress-cpu” is needed. This attacker includes two parameters: 1) fault_type: which is used for finding the attacker’s scripts. It should be always set to “stress-cpu” in this test case. 2) host: which is the name of a control node being attacked. e.g. -fault_type: “stress-cpu” -host: node1 |
| monitors | In this test case, the monitor named “openstack-cmd” is needed. The monitor needs needs two parameters: 1) monitor_type: which is used for finding the monitor class and related scritps. It should be always set to “openstack-cmd” for this monitor. 2) command_name: which is the command name used for request There are four instance of the “openstack-cmd” monitor: monitor1: -monitor_type: “openstack-cmd” -command_name: “nova image-list” monitor2: -monitor_type: “openstack-cmd” -command_name: “neutron router-list” monitor3: -monitor_type: “openstack-cmd” -command_name: “heat stack-list” monitor4: -monitor_type: “openstack-cmd” -command_name: “cinder list” |
| metrics | In this test case, there is one metric: 1)service_outage_time: which indicates the maximum outage time (seconds) of the specified Openstack command request. |
| test tool | Developed by the project. Please see folder: “yardstick/benchmark/scenarios/availability/ha_tools” |
| references | ETSI NFV REL001 |
| configuration | This test case needs two configuration files: 1) test case file: opnfv_yardstick_tc051.yaml -Attackers: see above “attackers” discription -waiting_time: which is the time (seconds) from the process being killed to stoping monitors the monitors -Monitors: see above “monitors” discription -SLA: see above “metrics” discription 2)POD file: pod.yaml The POD configuration should record on pod.yaml first. the “host” item in this test case will use the node name in the pod.yaml. |
| test sequence | description and expected result |
| step 1 | start monitors: each monitor will run with independently process Result: The monitor info will be collected. |
| step 2 | do attacker: connect the host through SSH, and then execute the stress cpu script on the host. Result: The CPU usage of the host will be stressed to 100%. |
| step 3 | stop monitors after a period of time specified by “waiting_time” Result: The monitor info will be aggregated. |
| step 4 | verify the SLA Result: The test case is passed or not. |
| post-action | It is the action when the test cases exist. It kills the process that stresses the CPU usage. |
| test verdict | Fails only if SLA is not passed, or if there is a test case execution problem. |
Yardstick Test Case Description TC052
| OpenStack Controller Node Disk I/O Block High Availability | |
| test case id | OPNFV_YARDSTICK_TC052: OpenStack Controller Node Disk I/O Block High Availability |
| test purpose | This test case will verify the high availability of control node. When the disk I/O of a specified disk is blocked, which breaks down the Openstack services on this node. Read and write services should still be accessed by other controller nodes, and the services on failed controller node should be isolated. |
| test method | This test case blocks the disk I/O of a specified control node, then checks whether the services that need to read or wirte the disk of the control node are OK with some monitor tools. |
| attackers | In this test case, an attacker called “disk-block” is needed. This attacker includes two parameters: 1) fault_type: which is used for finding the attacker’s scripts. It should be always set to “disk-block” in this test case. 2) host: which is the name of a control node being attacked. e.g. -fault_type: “disk-block” -host: node1 |
| monitors | In this test case, two kinds of monitor are needed: 1. the “openstack-cmd” monitor constantly request a specific Openstack command, which needs two parameters: 1) monitor_type: which is used for finding the monitor class and related scripts. It should be always set to “openstack-cmd” for this monitor. 2) command_name: which is the command name used for request. e.g. -monitor_type: “openstack-cmd” -command_name: “nova flavor-list” 2. the second monitor verifies the read and write function by a “operation” and a “result checker”. the “operation” have two parameters: 1) operation_type: which is used for finding the operation class and related scripts. 2) action_parameter: parameters for the operation. the “result checker” have three parameters: 1) checker_type: which is used for finding the reuslt checker class and realted scripts. 2) expectedValue: the expected value for the output of the checker script. 3) condition: whether the expected value is in the output of checker script or is totally same with the output. In this case, the “operation” adds a flavor and the “result checker” checks whether ths flavor is created. Their parameters show as follows: operation: -operation_type: “nova-create-flavor” -action_parameter:
result checker: -checker_type: “check-flavor” -expectedValue: “test-001” -condition: “in” |
| metrics | In this test case, there is one metric: 1)service_outage_time: which indicates the maximum outage time (seconds) of the specified Openstack command request. |
| test tool | Developed by the project. Please see folder: “yardstick/benchmark/scenarios/availability/ha_tools” |
| references | ETSI NFV REL001 |
| configuration | This test case needs two configuration files: 1) test case file: opnfv_yardstick_tc052.yaml -Attackers: see above “attackers” discription -waiting_time: which is the time (seconds) from the process being killed to stoping monitors the monitors -Monitors: see above “monitors” discription -SLA: see above “metrics” discription 2)POD file: pod.yaml The POD configuration should record on pod.yaml first. the “host” item in this test case will use the node name in the pod.yaml. |
| test sequence | description and expected result |
| step 1 | do attacker: connect the host through SSH, and then execute the block disk I/O script on the host. Result: The disk I/O of the host will be blocked |
| step 2 | start monitors: each monitor will run with independently process Result: The monitor info will be collected. |
| step 3 | do operation: add a flavor |
| step 4 | do result checker: check whether the falvor is created |
| step 5 | stop monitors after a period of time specified by “waiting_time” Result: The monitor info will be aggregated. |
| step 6 | verify the SLA Result: The test case is passed or not. |
| post-action | It is the action when the test cases exist. It excutes the release disk I/O script to release the blocked I/O. |
| test verdict | Fails if monnitor SLA is not passed or the result checker is not passed, or if there is a test case execution problem. |
Yardstick Test Case Description TC053
| OpenStack Controller Load Balance Service High Availability | |
| test case id | OPNFV_YARDSTICK_TC053: OpenStack Controller Load Balance Service High Availability |
| test purpose | This test case will verify the high availability of the load balance service(current is HAProxy) that supports OpenStack on controller node. When the load balance service of a specified controller node is killed, whether other load balancers on other controller nodes will work, and whether the controller node will restart the load balancer are checked. |
| test method | This test case kills the processes of load balance service on a selected control node, then checks whether the request of the related Openstack command is OK and the killed processes are recovered. |
| attackers | In this test case, an attacker called “kill-process” is needed. This attacker includes three parameters: 1) fault_type: which is used for finding the attacker’s scripts. It should be always set to “kill-process” in this test case. 2) process_name: which is the process name of the specified OpenStack service. If there are multiple processes use the same name on the host, all of them are killed by this attacker. In this case. This parameter should always set to “swift- proxy”. 3) host: which is the name of a control node being attacked. e.g. -fault_type: “kill-process” -process_name: “haproxy” -host: node1 |
| monitors | In this test case, two kinds of monitor are needed: 1. the “openstack-cmd” monitor constantly request a specific Openstack command, which needs two parameters: 1) monitor_type: which is used for finding the monitor class and related scritps. It should be always set to “openstack-cmd” for this monitor. 2) command_name: which is the command name used for request. 2. the “process” monitor check whether a process is running on a specific node, which needs three parameters: 1) monitor_type: which used for finding the monitor class and related scripts. It should be always set to “process” for this monitor. 2) process_name: which is the process name for monitor 3) host: which is the name of the node runing the process In this case, the command_name of monitor1 should be services that is supported by load balancer and the process- name of monitor2 should be “haproxy”, for example: e.g. monitor1: -monitor_type: “openstack-cmd” -command_name: “nova image-list” monitor2: -monitor_type: “process” -process_name: “haproxy” -host: node1 |
| metrics | In this test case, there are two metrics: 1)service_outage_time: which indicates the maximum outage time (seconds) of the specified Openstack command request. 2)process_recover_time: which indicates the maximun time (seconds) from the process being killed to recovered |
| test tool | Developed by the project. Please see folder: “yardstick/benchmark/scenarios/availability/ha_tools” |
| references | ETSI NFV REL001 |
| configuration | This test case needs two configuration files: 1) test case file: opnfv_yardstick_tc053.yaml -Attackers: see above “attackers” discription -waiting_time: which is the time (seconds) from the process being killed to stoping monitors the monitors -Monitors: see above “monitors” discription -SLA: see above “metrics” discription 2)POD file: pod.yaml The POD configuration should record on pod.yaml first. the “host” item in this test case will use the node name in the pod.yaml. |
| test sequence | description and expected result |
| step 1 | start monitors: each monitor will run with independently process Result: The monitor info will be collected. |
| step 2 | do attacker: connect the host through SSH, and then execute the kill process script with param value specified by “process_name” Result: Process will be killed. |
| step 3 | stop monitors after a period of time specified by “waiting_time” Result: The monitor info will be aggregated. |
| step 4 | verify the SLA Result: The test case is passed or not. |
| post-action | It is the action when the test cases exist. It will check the status of the specified process on the host, and restart the process if it is not running for next test cases. |
| test verdict | Fails only if SLA is not passed, or if there is a test case execution problem. |
Yardstick Test Case Description TC054
| OpenStack Virtual IP High Availability | |
| test case id | OPNFV_YARDSTICK_TC054: OpenStack Virtual IP High Availability |
| test purpose | This test case will verify the high availability for virtual ip in the environment. When master node of virtual ip is abnormally shutdown, connection to virtual ip and the services binded to the virtual IP it should be OK. |
| test method | This test case shutdowns the virtual IP master node with some fault injection tools, then checks whether virtual ips can be pinged and services binded to virtual ip are OK with some monitor tools. |
| attackers | In this test case, an attacker called “control-shutdown” is needed. This attacker includes two parameters: 1) fault_type: which is used for finding the attacker’s scripts. It should be always set to “control-shutdown” in this test case. 2) host: which is the name of a control node being attacked. In this case the host should be the virtual ip master node, that means the host ip is the virtual ip, for exapmle: -fault_type: “control-shutdown” -host: node1(the VIP Master node) |
| monitors | In this test case, two kinds of monitor are needed: 1. the “ip_status” monitor that pings a specific ip to check the connectivity of this ip, which needs two parameters: 1) monitor_type: which is used for finding the monitor class and related scripts. It should be always set to “ip_status” for this monitor. 2) ip_address: The ip to be pinged. In this case, ip_address should be the virtual IP. 2. the “openstack-cmd” monitor constantly request a specific Openstack command, which needs two parameters: 1) monitor_type: which is used for finding the monitor class and related scripts. It should be always set to “openstack-cmd” for this monitor. 2) command_name: which is the command name used for request. e.g. monitor1: -monitor_type: “ip_status” -host: 192.168.0.2 monitor2: -monitor_type: “openstack-cmd” -command_name: “nova image-list” |
| metrics | In this test case, there are two metrics: 1) ping_outage_time: which-indicates the maximum outage time to ping the specified host. 2)service_outage_time: which indicates the maximum outage time (seconds) of the specified Openstack command request. |
| test tool | Developed by the project. Please see folder: “yardstick/benchmark/scenarios/availability/ha_tools” |
| references | ETSI NFV REL001 |
| configuration | This test case needs two configuration files: 1) test case file: opnfv_yardstick_tc054.yaml -Attackers: see above “attackers” discription -waiting_time: which is the time (seconds) from the process being killed to stoping monitors the monitors -Monitors: see above “monitors” discription -SLA: see above “metrics” discription 2)POD file: pod.yaml The POD configuration should record on pod.yaml first. the “host” item in this test case will use the node name in the pod.yaml. |
| test sequence | description and expected result |
| step 1 | start monitors: each monitor will run with independently process Result: The monitor info will be collected. |
| step 2 | do attacker: connect the host through SSH, and then execute the shutdown script on the VIP master node. Result: VIP master node will be shutdown |
| step 3 | stop monitors after a period of time specified by “waiting_time” Result: The monitor info will be aggregated. |
| step 4 | verify the SLA Result: The test case is passed or not. |
| post-action | It is the action when the test cases exist. It restarts the original VIP master node if it is not restarted. |
| test verdict | Fails only if SLA is not passed, or if there is a test case execution problem. |
IPv6
Yardstick Test Case Description TC027
| IPv6 connectivity between nodes on the tenant network | |
| test case id | OPNFV_YARDSTICK_TC027_IPv6 connectivity |
| metric | RTT, Round Trip Time |
| test purpose | To do a basic verification that IPv6 connectivity is within acceptable boundaries when ipv6 packets travel between hosts located on same or different compute blades. The purpose is also to be able to spot trends. Test results, graphs and similar shall be stored for comparison reasons and product evolution understanding between different OPNFV versions and/or configurations. |
| configuration | file: opnfv_yardstick_tc027.yaml Packet size 56 bytes. SLA RTT is set to maximum 30 ms. ipv6 test case can be configured as three independent modules (setup, run, teardown). if you only want to setup ipv6 testing environment, do some tests as you want, “run_step” of task yaml file should be configured as “setup”. if you want to setup and run ping6 testing automatically, “run_step” should be configured as “setup, run”. and if you have had a environment which has been setup, you only wan to verify the connectivity of ipv6 network, “run_step” should be “run”. Of course, default is that three modules run sequentially. |
| test tool | ping6 Ping6 is normally part of Linux distribution, hence it doesn’t need to be installed. |
| references |
ETSI-NFV-TST001 |
| applicability | Test case can be configured with different run step you can run setup, run benchmark, teardown independently SLA is optional. The SLA in this test case serves as an example. Considerably lower RTT is expected. |
| pre-test conditions | The test case image needs to be installed into Glance with ping6 included in it. For Brahmaputra, a compass_os_nosdn_ha deploy scenario is need. more installer and more sdn deploy scenario will be supported soon |
| test sequence | description and expected result |
| step 1 | To setup IPV6 testing environment: 1. disable security group 2. create (ipv6, ipv4) router, network and subnet 3. create VRouter, VM1, VM2 |
| step 2 | To run ping6 to verify IPV6 connectivity : 1. ssh to VM1 2. Ping6 to ipv6 router from VM1 3. Get the result(RTT) and logs are stored |
| step 3 | To teardown IPV6 testing environment 1. delete VRouter, VM1, VM2 2. delete (ipv6, ipv4) router, network and subnet 3. enable security group |
| test verdict | Test should not PASS if any RTT is above the optional SLA value, or if there is a test case execution problem. |
KVM
Yardstick Test Case Description TC028
| KVM Latency measurements | |
| test case id | OPNFV_YARDSTICK_TC028_KVM Latency measurements |
| metric | min, avg and max latency |
| test purpose | To evaluate the IaaS KVM virtualization capability with regards to min, avg and max latency. The purpose is also to be able to spot trends. Test results, graphs and similar shall be stored for comparison reasons and product evolution understanding between different OPNFV versions and/or configurations. |
| configuration | file: samples/cyclictest-node-context.yaml |
| test tool | Cyclictest (Cyclictest is not always part of a Linux distribution, hence it needs to be installed. As an example see the /yardstick/tools/ directory for how to generate a Linux image with cyclictest included.) |
| references | Cyclictest |
| applicability | This test case is mainly for kvm4nfv project CI verify. Upgrade host linux kernel, boot a gust vm update it’s linux kernel, and then run the cyclictest to test the new kernel is work well. |
| pre-test conditions | The test kernel rpm, test sequence scripts and test guest image need put the right folders as specified in the test case yaml file. The test guest image needs with cyclictest included in it. No POD specific requirements have been identified. |
| test sequence | description and expected result |
| step 1 | The host and guest os kernel is upgraded. Cyclictest is invoked and logs are produced and stored. Result: Logs are stored. |
| test verdict | Fails only if SLA is not passed, or if there is a test case execution problem. |
Parser
Yardstick Test Case Description TC040
| Verify Parser Yang-to-Tosca | |
| test case id | OPNFV_YARDSTICK_TC040 Verify Parser Yang-to-Tosca |
| metric |
|
| test purpose | To verify the function of Yang-to-Tosca in Parser. |
| configuration | file: opnfv_yardstick_tc040.yaml yangfile: the path of the yangfile which you want to convert toscafile: the path of the toscafile which is your expected outcome. |
| test tool | Parser (Parser is not part of a Linux distribution, hence it needs to be installed. As an example see the /yardstick/benchmark/scenarios/parser/parser_setup.sh for how to install it manual. Of course, it will be installed and uninstalled automatically when you run this test case by yardstick) |
| references | Parser |
| applicability | Test can be configured with different path of yangfile and toscafile to fit your real environment to verify Parser |
| pre-test conditions | No POD specific requirements have been identified. it can be run without VM |
| test sequence | description and expected result |
| step 1 | parser is installed without VM, running Yang-to-Tosca module to convert yang file to tosca file, validating output against expected outcome. Result: Logs are stored. |
| test verdict | Fails only if output is different with expected outcome or if there is a test case execution problem. |
Yardstick Test Case Description TC074
| Storperf | |
| test case id | OPNFV_YARDSTICK_TC074_Storperf |
| metric | Storage performance |
| test purpose | Storperf integration with yardstick. The purpose of StorPerf is to provide a tool to measure block and object storage performance in an NFVI. When complemented with a characterization of typical VF storage performance requirements, it can provide pass/fail thresholds for test, staging, and production NFVI environments. The benchmarks developed for block and object storage will be sufficiently varied to provide a good preview of expected storage performance behavior for any type of VNF workload. |
| configuration | file: opnfv_yardstick_tc074.yaml
|
| test tool |
StorPerf is a tool to measure block and object storage performance in an NFVI. StorPerf is delivered as a Docker container from https://hub.docker.com/r/opnfv/storperf/tags/. |
| references |
ETSI-NFV-TST001 |
| applicability | Test can be configured with different:
|
| pre-test conditions | If you do not have an Ubuntu 14.04 image in Glance, you will need to add one. A key pair for launching agents is also required. Storperf is required to be installed in the environment. There are two possible methods for Storperf installation:
Running StorPerf on Jump Host Requirements:
Running StorPerf in a VM Requirements:
No POD specific requirements have been identified. |
| test sequence | description and expected result |
| step 1 | The Storperf is installed and Ubuntu 14.04 image is stored in glance. TC is invoked and logs are produced and stored. Result: Logs are stored. |
| test verdict | None. Storage performance results are fetched and stored. |
virtual Traffic Classifier
Yardstick Test Case Description TC006
| Network Performance | |
| test case id | OPNFV_YARDSTICK_TC006_Virtual Traffic Classifier Data Plane Throughput Benchmarking Test. |
| metric | Throughput |
| test purpose | To measure the throughput supported by the virtual Traffic Classifier according to the RFC2544 methodology for a user-defined set of vTC deployment configurations. |
| configuration | file: file: opnfv_yardstick_tc006.yaml
|
| test tool | DPDK pktgen DPDK Pktgen is not part of a Linux distribution, hence it needs to be installed by the user. |
| references | DPDK Pktgen: DPDKpktgen ETSI-NFV-TST001 RFC 2544: rfc2544 |
| applicability | Test can be configured with different flavors, vNIC type and packet sizes. Default values exist as specified above. The vNIC type and flavor MUST be specified by the user. |
| pre-test | The vTC has been successfully instantiated and configured. The user has correctly assigned the values to the deployment
|
| test sequence | Description and expected results |
| step 1 | The vTC is deployed, according to the user-defined configuration |
| step 2 | The vTC is correctly deployed and configured as necessary The initialization script has been correctly executed and vTC is ready to receive and process the traffic. |
| step 3 | Test case is executed with the selected parameters: - vTC flavor - vNIC type - packet size The traffic is sent to the vTC using the maximum available traffic rate for 60 seconds. |
| step 4 | The vTC instance forwards all the packets back to the packet generator for 60 seconds, as specified by RFC 2544. Steps 3 and 4 are executed different times, with different rates in order to find the maximum supported traffic rate according to the current definition of throughput in RFC 2544. |
| test verdict | The result of the test is a number between 0 and 100 which represents the throughput in terms of percentage of the available pktgen NIC bandwidth. |
Yardstick Test Case Description TC007
| Network Performance | |
| test case id |
|
| metric | Throughput |
| test purpose | To measure the throughput supported by the virtual Traffic Classifier according to the RFC2544 methodology for a user-defined set of vTC deployment configurations in the presence of noisy neighbours. |
| configuration | file: opnfv_yardstick_tc007.yaml
|
| test tool | DPDK pktgen DPDK Pktgen is not part of a Linux distribution, hence it needs to be installed by the user. |
| references |
ETSI-NFV-TST001 |
| applicability | Test can be configured with different flavors, vNIC type and packet sizes. Default values exist as specified above. The vNIC type and flavor MUST be specified by the user. |
| pre-test | The vTC has been successfully instantiated and configured. The user has correctly assigned the values to the deployment
|
| test sequence | Description and expected results |
| step 1 | The noisy neighbours are deployed as required by the user. |
| step 2 | The vTC is deployed, according to the configuration required by the user |
| step 3 | The vTC is correctly deployed and configured as necessary. The initialization script has been correctly executed and the vTC is ready to receive and process the traffic. |
| step 4 | Test case is executed with the parameters specified by the user:
|
| step 5 | The vTC instance forwards all the packets back to the packet generator for 60 seconds, as specified by RFC 2544. Steps 4 and 5 are executed different times with different with different traffic rates, in order to find the maximum supported traffic rate, accoring to the current definition of throughput in RFC 2544. |
| test verdict | The result of the test is a number between 0 and 100 which represents the throughput in terms of percentage of the available pktgen NIC bandwidth. |
Yardstick Test Case Description TC020
| Network Performance | |
| test case id | OPNFV_YARDSTICK_TC0020_Virtual Traffic Classifier Instantiation Test |
| metric | Failure |
| test purpose | To verify that a newly instantiated vTC is ‘alive’ and functional and its instantiation is correctly supported by the infrastructure. |
| configuration | file: opnfv_yardstick_tc020.yaml
|
| test tool | DPDK pktgen DPDK Pktgen is not part of a Linux distribution, hence it needs to be installed by the user. |
| references |
ETSI-NFV-TST001 |
| applicability | Test can be configured with different flavors, vNIC type and packet sizes. Default values exist as specified above. The vNIC type and flavor MUST be specified by the user. |
| pre-test | The vTC has been successfully instantiated and configured. The user has correctly assigned the values to the deployment
|
| test sequence | Description and expected results |
| step 1 | The vTC is deployed, according to the configuration provided by the user. |
| step 2 | The vTC is correctly deployed and configured as necessary. The initialization script has been correctly executed and the vTC is ready to receive and process the traffic. |
| step 3 | Test case is executed with the parameters specified by the the user: - vTC flavor - vNIC type A constant rate traffic is sent to the vTC for 10 seconds. |
| step 4 | The vTC instance tags all the packets and sends them back to the packet generator for 10 seconds. The framework checks that the packet generator receives back all the packets with the correct tag from the vTC. |
| test verdict | The vTC is deemed to be successfully instantiated if all packets are sent back with the right tag as requested, else it is deemed DoA (Dead on arrival) |
Yardstick Test Case Description TC021
| Network Performance | |
| test case id | OPNFV_YARDSTICK_TC0021_Virtual Traffic Classifier Instantiation Test in Presence of Noisy Neighbours |
| metric | Failure |
| test purpose | To verify that a newly instantiated vTC is ‘alive’ and functional and its instantiation is correctly supported by the infrastructure in the presence of noisy neighbours. |
| configuration | file: opnfv_yardstick_tc021.yaml
|
| test tool | DPDK pktgen DPDK Pktgen is not part of a Linux distribution, hence it needs to be installed by the user. |
| references | DPDK Pktgen: DPDK Pktgen: DPDKpktgen ETSI-NFV-TST001 RFC 2544: rfc2544 |
| applicability | Test can be configured with different flavors, vNIC type and packet sizes. Default values exist as specified above. The vNIC type and flavor MUST be specified by the user. |
| pre-test | The vTC has been successfully instantiated and configured. The user has correctly assigned the values to the deployment
|
| test sequence | Description and expected results |
| step 1 | The noisy neighbours are deployed as required by the user. |
| step 2 | The vTC is deployed, according to the configuration provided by the user. |
| step 3 | The vTC is correctly deployed and configured as necessary. The initialization script has been correctly executed and the vTC is ready to receive and process the traffic. |
| step 4 | Test case is executed with the selected parameters: - vTC flavor - vNIC type A constant rate traffic is sent to the vTC for 10 seconds. |
| step 5 | The vTC instance tags all the packets and sends them back to the packet generator for 10 seconds. The framework checks if the packet generator receives back all the packets with the correct tag from the vTC. |
| test verdict | The vTC is deemed to be successfully instantiated if all packets are sent back with the right tag as requested, else it is deemed DoA (Dead on arrival) |
Templates
Yardstick Test Case Description TCXXX
| test case slogan e.g. Network Latency | |
| test case id | e.g. OPNFV_YARDSTICK_TC001_NW Latency |
| metric | what will be measured, e.g. latency |
| test purpose | describe what is the purpose of the test case |
| configuration | what .yaml file to use, state SLA if applicable, state test duration, list and describe the scenario options used in this TC and also list the options using default values. |
| test tool | e.g. ping |
| references | e.g. RFCxxx, ETSI-NFVyyy |
| applicability | describe variations of the test case which can be performend, e.g. run the test for different packet sizes |
| pre-test conditions | describe configuration in the tool(s) used to perform the measurements (e.g. fio, pktgen), POD-specific configuration required to enable running the test |
| test sequence | description and expected result |
| step 1 | use this to describe tests that require sveveral steps e.g collect logs. Result: what happens in this step e.g. logs collected |
| step 2 | remove interface Result: interface down. |
| step N | what is done in step N Result: what happens |
| test verdict | expected behavior, or SLA, pass/fail criteria |
Task Template Syntax
Basic template syntax
A nice feature of the input task format used in Yardstick is that it supports the template syntax based on Jinja2. This turns out to be extremely useful when, say, you have a fixed structure of your task but you want to parameterize this task in some way. For example, imagine your input task file (task.yaml) runs a set of Ping scenarios:
# Sample benchmark task config file
# measure network latency using ping
schema: "yardstick:task:0.1"

scenarios:
-
  type: Ping
  options:
    packetsize: 200
  host: athena.demo
  target: ares.demo

  runner:
    type: Duration
    duration: 60
    interval: 1

  sla:
    max_rtt: 10
    action: monitor

context:
    ...
Let’s say you want to run the same set of scenarios with the same runner/ context/sla, but you want to try another packetsize to compare the performance. The most elegant solution is then to turn the packetsize name into a template variable:
# Sample benchmark task config file
# measure network latency using ping

schema: "yardstick:task:0.1"
scenarios:
-
  type: Ping
  options:
    packetsize: {{packetsize}}
  host: athena.demo
  target: ares.demo

  runner:
    type: Duration
    duration: 60
    interval: 1

  sla:
    max_rtt: 10
    action: monitor

context:
    ...
and then pass the argument value for {{packetsize}} when starting a task with this configuration file. Yardstick provides you with different ways to do that:
1.Pass the argument values directly in the command-line interface (with either a JSON or YAML dictionary):
yardstick task start samples/ping-template.yaml
--task-args'{"packetsize":"200"}'
2.Refer to a file that specifies the argument values (JSON/YAML):
yardstick task start samples/ping-template.yaml --task-args-file args.yaml
Using the default values
Note that the Jinja2 template syntax allows you to set the default values for your parameters. With default values set, your task file will work even if you don’t parameterize it explicitly while starting a task. The default values should be set using the {% set ... %} clause (task.yaml). For example:
# Sample benchmark task config file
# measure network latency using ping
schema: "yardstick:task:0.1"
{% set packetsize = packetsize or "100" %}
scenarios:
-
  type: Ping
  options:
  packetsize: {{packetsize}}
  host: athena.demo
  target: ares.demo

  runner:
    type: Duration
    duration: 60
    interval: 1
  ...
If you don’t pass the value for {{packetsize}} while starting a task, the default one will be used.
Advanced templates
Yardstick makes it possible to use all the power of Jinja2 template syntax, including the mechanism of built-in functions. As an example, let us make up a task file that will do a block storage performance test. The input task file (fio-template.yaml) below uses the Jinja2 for-endfor construct to accomplish that:
#Test block sizes of 4KB, 8KB, 64KB, 1MB
#Test 5 workloads: read, write, randwrite, randread, rw
schema: "yardstick:task:0.1"

 scenarios:
{% for bs in ['4k', '8k', '64k', '1024k' ] %}
  {% for rw in ['read', 'write', 'randwrite', 'randread', 'rw' ] %}
-
  type: Fio
  options:
    filename: /home/ubuntu/data.raw
    bs: {{bs}}
    rw: {{rw}}
    ramp_time: 10
  host: fio.demo
  runner:
    type: Duration
    duration: 60
    interval: 60

  {% endfor %}
{% endfor %}
context
    ...
Glossary
- API
- Application Programming Interface
- DPDK
- Data Plane Development Kit
- DPI
- Deep Packet Inspection
- DSCP
- Differentiated Services Code Point
- IGMP
- Internet Group Management Protocol
- IOPS
- Input/Output Operations Per Second
- NFVI
- Network Function Virtualization Infrastructure
- NIC
- Network Interface Controller
- PBFS
- Packet Based per Flow State
- QoS
- Quality of Service
- SR-IOV
- Single Root IO Virtualization
- SUT
- System Under Test
- ToS
- Type of Service
- VLAN
- Virtual LAN
- VM
- Virtual Machine
- VNF
- Virtual Network Function
- VNFC
- Virtual Network Function Component
- VTC
- Virtual Traffic Classifier
References
OPNFV
- Parser wiki: https://wiki.opnfv.org/parser
- Pharos wiki: https://wiki.opnfv.org/pharos
- VTC: https://wiki.opnfv.org/vtc
- Yardstick CI: https://build.opnfv.org/ci/view/yardstick/
- Yardstick and ETSI TST001 presentation: https://wiki.opnfv.org/_media/opnfv_summit_-_bridging_opnfv_and_etsi.pdf
- Yardstick Project presentation: https://wiki.opnfv.org/_media/opnfv_summit_-_yardstick_project.pdf
- Yardstick wiki: https://wiki.opnfv.org/yardstick
References used in Test Cases
- cachestat: https://github.com/brendangregg/perf-tools/tree/master/fs
- cirros-image: https://download.cirros-cloud.net
- cyclictest: https://rt.wiki.kernel.org/index.php/Cyclictest
- DPDKpktgen: https://github.com/Pktgen/Pktgen-DPDK/
- DPDK supported NICs: http://dpdk.org/doc/nics
- fdisk: http://www.tldp.org/HOWTO/Partition/fdisk_partitioning.html
- fio: http://www.bluestop.org/fio/HOWTO.txt
- free: http://manpages.ubuntu.com/manpages/trusty/en/man1/free.1.html
- iperf3: https://iperf.fr/
- iostat: http://linux.die.net/man/1/iostat
- Lmbench man-pages: http://manpages.ubuntu.com/manpages/trusty/lat_mem_rd.8.html
- Memory bandwidth man-pages: http://manpages.ubuntu.com/manpages/trusty/bw_mem.8.html
- mpstat man-pages: http://manpages.ubuntu.com/manpages/trusty/man1/mpstat.1.html
- netperf: http://www.netperf.org/netperf/training/Netperf.html
- pktgen: https://www.kernel.org/doc/Documentation/networking/pktgen.txt
- RAMspeed: http://alasir.com/software/ramspeed/
- sar: http://linux.die.net/man/1/sar
- SR-IOV: https://wiki.openstack.org/wiki/SR-IOV-Passthrough-For-Networking
- Storperf: https://wiki.opnfv.org/display/storperf/Storperf
- unixbench: https://github.com/kdlucas/byte-unixbench/blob/master/UnixBench
Research
- NCSRD: http://www.demokritos.gr/?lang=en
- T-NOVA: http://www.t-nova.eu/
- T-NOVA Results: http://www.t-nova.eu/results/
Standards
- ETSI NFV: http://www.etsi.org/technologies-clusters/technologies/nfv
- ETSI GS-NFV TST 001: https://docbox.etsi.org/ISG/NFV/Open/Drafts/TST001_-_Pre-deployment_Validation/
- RFC2544: https://www.ietf.org/rfc/rfc2544.txt