StorPerf
StorPerf is an OPNFV testing project aimed to measure the performance of the Cinder subsystem.
- Project Wiki: https://wiki.opnfv.org/display/storperf
- Project Repository: https://git.opnfv.org/storperf
- Project Artifacts: https://hub.docker.com/r/opnfv/storperf/
- Continuous Integration https://build.opnfv.org/ci/view/storperf/
StorPerf Installation Guide
1. StorPerf Installation Guide
1.1. OpenStack Prerequisites
If you do not have an Ubuntu 16.04 image in Glance, you will need to add one. You also need to create the StorPerf flavor, or choose one that closely matches. For Ubuntu 16.04, it must have a minimum of a 4 GB disk. It should also have about 8 GB RAM to support FIO’s memory mapping of written data blocks to ensure 100% coverage of the volume under test.
There are scripts in storperf/ci directory to assist, or you can use the follow code snippets:
# Put an Ubuntu Image in glance
wget -q https://cloud-images.ubuntu.com/releases/16.04/release/ubuntu-16.04-server-cloudimg-amd64-disk1.img
openstack image create "Ubuntu 16.04 x86_64" --disk-format qcow2 --public \
    --container-format bare --file ubuntu-16.04-server-cloudimg-amd64-disk1.img

# Create StorPerf flavor
openstack flavor create storperf \
    --id auto \
    --ram 8192 \
    --disk 4 \
    --vcpus 2
1.1.1. OpenStack Credentials
You must have your OpenStack Controller environment variables defined and passed to the StorPerf container. The easiest way to do this is to put the rc file contents into a clean file called admin.rc that looks similar to this for V2 authentication:
cat << 'EOF' > admin.rc
OS_AUTH_URL=http://10.13.182.243:5000/v2.0
OS_TENANT_ID=e8e64985506a4a508957f931d1800aa9
OS_TENANT_NAME=admin
OS_PROJECT_NAME=admin
OS_USERNAME=admin
OS_PASSWORD=admin
OS_REGION_NAME=RegionOne
EOF
For V3 authentication, at a minimum, use the following:
cat << 'EOF' > admin.rc
OS_AUTH_URL=http://10.10.243.14:5000/v3
OS_USERNAME=admin
OS_PASSWORD=admin
OS_PROJECT_DOMAIN_NAME=Default
OS_PROJECT_NAME=admin
OS_USER_DOMAIN_NAME=Default
EOF
Additionally, if you want your results published to the common OPNFV Test Results DB, add the following:
TEST_DB_URL=http://testresults.opnfv.org/testapi
1.2. Planning
StorPerf is delivered as a series of Docker containers managed by docker-compose. There are two possible methods for installation:
- Run container on bare metal
- Run container in a VM
Requirements:
- Docker and docker-compose must be installed * (note: sudo may be required if user is not part of docker group)
- OpenStack Controller credentials are available
- Host has access to the OpenStack Controller API
- Host must have internet connectivity for downloading docker image
- Enough OpenStack floating IPs must be available to match your agent count
- A local directory for holding the Carbon DB Whisper files
Local disk used for the Carbon DB storage as the default size of the docker container is only 10g. Here is an example of how to create a local storage directory and set its permissions so that StorPerf can write to it:
mkdir -p ./carbon
sudo chown 33:33 ./carbon
1.3. Ports
The following ports are exposed if you use the supplied docker-compose.yaml file:
- 5000 for StorPerf ReST API and Swagger UI
Note: Port 8000 is no longer exposed and graphite can be accesed via http://storperf:5000/graphite
1.4. Running StorPerf Container
As of Euphrates (development) release (June 2017), StorPerf has changed to use docker-compose in order to start its services.
Docker compose requires a local file to be created in order to define the services that make up the full StorPerf application. This file can be:
- Manually created
- Downloaded from the StorPerf git repo, or
- Create via a helper script from the StorPerf git repo
Manual creation involves taking the sample in the StorPerf git repo and typing in the contents by hand on your target system.
1.5. Downloading From Git Repo
wget https://raw.githubusercontent.com/opnfv/storperf/master/docker-compose/docker-compose.yaml
sha256sum docker-compose.yaml
which should result in:
968c0c2d7c0e24f6777c33b37d9b4fd885575155069fb760405ec8214b2eb672 docker-compose.yaml
To run, you must specify two environment variables:
- ENV_FILE, which points to your OpenStack admin.rc as noted above.
- CARBON_DIR, which points to a directory that will be mounted to store the raw metrics.
- TAG, which specified the Docker tag for the build (ie: latest, danube.3.0, etc).
The following command will start all the StorPerf services:
TAG=latest ENV_FILE=./admin.rc CARBON_DIR=./carbon/ docker-compose pull
TAG=latest ENV_FILE=./admin.rc CARBON_DIR=./carbon/ docker-compose up -d
StorPerf is now available at http://docker-host:5000/
1.6. Downloading Helper Tool
A tool to help you get started with the docker-compose.yaml can be downloaded from:
wget https://raw.githubusercontent.com/opnfv/storperf/master/docker-compose/create-compose.py
sha256sum create-compose.py
which should result in:
00649e02237d27bf0b40d1a66160a68a56c9f5e1ceb78d7858e30715cf4350e3 create-compose.py
Note: The script will run fine on python3. Install python future package to avoid error on python2.
pip install future
1.6.1. Docker Exec
If needed, the container can be entered with docker exec. This is not normally required.
docker exec -it storperf-master bash
1.7. Pulling StorPerf Container
1.7.1. Master (Euphrates)
StorPerf has switched to docker-compose in the latest version. The tag for pulling the latest master Euphrates container is:
docker pull opnfv/storperf-master:latest
docker pull opnfv/storperf-reporting:latest
docker pull opnfv/storperf-httpfrontend:latest
docker pull opnfv/storperf-swaggerui:latest
docker pull opnfv/storperf-graphite:latest
However, by itself, this will no longer provide full functionality. Full instructions are provided in the Running StorPerf Container section of this document.
1.7.3. Colorado
The tag for the latest stable Colorado release is:
docker pull opnfv/storperf:colorado.0.1
1.7.4. Brahmaputra
The tag for the latest stable Brahmaputra release is:
docker pull opnfv/storperf:brahmaputra.1.2
1.8. StorPerf on ARM Processors
StorPerf now supports docker images on ARM processors as well. However, at the moment there is no upstream image on DockerHub. The user needs to manually build it. Firstly, clone StorPerf repository from GitHub
git clone https://git.opnfv.org/storperf
cd storperf/docker/
Next, build and setup the docker images
TAG=aarch64 ENV_FILE=./admin.rc CARBON_DIR=./carbon docker-compose -f local-docker-compose.yaml build
TAG=aarch64 ENV_FILE=./admin.rc CARBON_DIR=./carbon docker-compose -f local-docker-compose.yaml up -d
StorPerf User Guide
1. StorPerf Introduction
The purpose of StorPerf is to provide a tool to measure ephemeral and block storage performance of OpenStack.
A key challenge to measuring disk performance is to know when the disk (or, for OpenStack, the virtual disk or volume) is performing at a consistent and repeatable level of performance. Initial writes to a volume can perform poorly due to block allocation, and reads can appear instantaneous when reading empty blocks. How do we know when the data reported is valid? The Storage Network Industry Association (SNIA) has developed methods which enable manufacturers to set, and customers to compare, the performance specifications of Solid State Storage devices. StorPerf applies this methodology to OpenStack Cinder and Glance services to provide a high level of confidence in the performance metrics in the shortest reasonable time.
1.1. How Does StorPerf Work?
Once launched, StorPerf presents you with a ReST interface, along with a Swagger UI that makes it easier to form HTTP ReST requests. Issuing an HTTP POST to the configurations API causes StorPerf to talk to your OpenStack’s heat service to create a new stack with as many agent VMs and attached Cinder volumes as you specify.
After the stack is created, you can issue one or more jobs by issuing a POST to the jobs ReST API. The job is the smallest unit of work that StorPerf can use to measure the disk’s performance.
While the job is running, StorPerf collects the performance metrics from each of the disks under test every minute. Once the trend of metrics match the criteria specified in the SNIA methodology, the job automatically terminates and the valid set of metrics are available for querying.
What is the criteria? Simply put, it specifies that when the metrics measured start to “flat line” and stay within that range for the specified amount of time, then the metrics are considered to be indicative of a repeatable level of performance.
1.2. What Data Can I Get?
StorPerf provides the following metrics:
- IOPS
- Bandwidth (number of kilobytes read or written per second)
- Latency
These metrics are available for every job, and for the specific workloads, I/O loads and I/O types (read, write) associated with the job.
As of this time, StorPerf only provides textual reports of the metrics.
2. StorPerf Test Execution Guide
2.1. Prerequisites
This guide requires StorPerf to be running and have its ReST API accessible. If the ReST API is not running on port 5000, adjust the commands provided here as needed.
2.2. Interacting With StorPerf
Once the StorPerf container has been started and the ReST API exposed, you can interact directly with it using the ReST API. StorPerf comes with a Swagger interface that is accessible through the exposed port at:
http://StorPerf:5000/swagger/index.html
The typical test execution follows this pattern:
- Configure the environment
- Initialize the cinder volumes
- Execute one or more performance runs
- Delete the environment
2.3. Configure The Environment
The following pieces of information are required to prepare the environment:
- The number of VMs/Cinder volumes to create
- The Glance image that holds the VM operating system to use. StorPerf has only been tested with Ubuntu 16.04
- The OpenStack flavor to use when creating the VMs
- The name of the public network that agents will use
- The size, in gigabytes, of the Cinder volumes to create
- The availability zone (optional) in which the VM is to be launched. Defaults to nova.
- The username (optional) if we specify a custom image.
- The password (optional) for the above image.
The ReST API is a POST to http://StorPerf:5000/api/v1.0/configurations and takes a JSON payload as follows.
{
  "agent_count": int,
  "agent_flavor": string
  "agent_image": string,
  "public_network": string,
  "volume_size": int,
  "availability_zone": string,
  "username": string,
  "password": string
}
This call will block until the stack is created, at which point it will return the OpenStack heat stack id.
2.4. Initialize the Cinder Volumes
Before executing a test run for the purpose of measuring performance, it is necessary to fill the Cinder volume with random data. Failure to execute this step can result in meaningless numbers, especially for read performance. Most Cinder drivers are smart enough to know what blocks contain data, and which do not. Uninitialized blocks return “0” immediately without actually reading from the volume.
Initiating the data fill looks the same as a regular performance test, but uses the special workload called “_warm_up”. StorPerf will never push _warm_up data to the OPNFV Test Results DB, nor will it terminate the run on steady state. It is guaranteed to run to completion, which fills 100% of the volume with random data.
The ReST API is a POST to http://StorPerf:5000/api/v1.0/jobs and takes a JSON payload as follows.
{
   "workload": "_warm_up"
}
This will return a job ID as follows.
{
  "job_id": "edafa97e-457e-4d3d-9db4-1d6c0fc03f98"
}
This job ID can be used to query the state to determine when it has completed. See the section on querying jobs for more information.
2.5. Execute a Performance Run
Performance runs can execute either a single workload, or iterate over a matrix of workload types, block sizes and queue depths.
2.5.1. Workload Types
- rr
- Read, Random. 100% read of random blocks
- rs
- Read, Sequential. 100% read of sequential blocks of data
- rw
- Read / Write Mix, Random. 70% random read, 30% random write
- wr
- Write, Random. 100% write of random blocks
- ws
- Write, Sequential. 100% write of sequential blocks.
2.5.2. Block Sizes
A comma delimited list of the different block sizes to use when reading and writing data. Note: Some Cinder drivers (such as Ceph) cannot support block sizes larger than 16k (16384).
2.5.3. Queue Depths
A comma delimited list of the different queue depths to use when reading and writing data. The queue depth parameter causes FIO to keep this many I/O requests outstanding at one time. It is used to simulate traffic patterns on the system. For example, a queue depth of 4 would simulate 4 processes constantly creating I/O requests.
2.5.4. Deadline
The deadline is the maximum amount of time in minutes for a workload to run. If steady state has not been reached by the deadline, the workload will terminate and that particular run will be marked as not having reached steady state. Any remaining workloads will continue to execute in order.
{
   "block_sizes": "2048,16384",
   "deadline": 20,
   "queue_depths": "2,4",
   "workload": "wr,rr,rw"
}
2.5.5. Metadata
A job can have metadata associated with it for tagging. The following metadata is required in order to push results to the OPNFV Test Results DB:
"metadata": {
    "disk_type": "HDD or SDD",
    "pod_name": "OPNFV Pod Name",
    "scenario_name": string,
    "storage_node_count": int,
    "version": string,
    "build_tag": string,
    "test_case": "snia_steady_state"
}
2.6. Query Jobs Information
By issuing a GET to the job API http://StorPerf:5000/api/v1.0/jobs?job_id=<ID>, you can fetch information about the job as follows:
- &type=status: to report on the status of the job.
- &type=metrics: to report on the collected metrics.
- &type=metadata: to report back any metadata sent with the job ReST API
2.6.1. Status
The Status field can be: - Running to indicate the job is still in progress, or - Completed to indicate the job is done. This could be either normal completion
or manually terminated via HTTP DELETE call.
Workloads can have a value of: - Pending to indicate the workload has not yet started, - Running to indicate this is the active workload, or - Completed to indicate this workload has completed.
This is an example of a type=status call.
{
  "Status": "Running",
  "TestResultURL": null,
  "Workloads": {
    "eeb2e587-5274-4d2f-ad95-5c85102d055e.ws.queue-depth.1.block-size.16384": "Pending",
    "eeb2e587-5274-4d2f-ad95-5c85102d055e.ws.queue-depth.1.block-size.4096": "Pending",
    "eeb2e587-5274-4d2f-ad95-5c85102d055e.ws.queue-depth.1.block-size.512": "Pending",
    "eeb2e587-5274-4d2f-ad95-5c85102d055e.ws.queue-depth.4.block-size.16384": "Running",
    "eeb2e587-5274-4d2f-ad95-5c85102d055e.ws.queue-depth.4.block-size.4096": "Pending",
    "eeb2e587-5274-4d2f-ad95-5c85102d055e.ws.queue-depth.4.block-size.512": "Pending",
    "eeb2e587-5274-4d2f-ad95-5c85102d055e.ws.queue-depth.8.block-size.16384": "Completed",
    "eeb2e587-5274-4d2f-ad95-5c85102d055e.ws.queue-depth.8.block-size.4096": "Pending",
    "eeb2e587-5274-4d2f-ad95-5c85102d055e.ws.queue-depth.8.block-size.512": "Pending"
  }
}
If the job_id is not provided along with type status, then all jobs are returned along with their status. Metrics ~~~~~~~ Metrics can be queried at any time during or after the completion of a run. Note that the metrics show up only after the first interval has passed, and are subject to change until the job completes.
This is a sample of a type=metrics call.
{
  "rw.queue-depth.1.block-size.512.read.bw": 52.8,
  "rw.queue-depth.1.block-size.512.read.iops": 106.76199999999999,
  "rw.queue-depth.1.block-size.512.read.lat_ns.mean": 93.176,
  "rw.queue-depth.1.block-size.512.write.bw": 22.5,
  "rw.queue-depth.1.block-size.512.write.iops": 45.760000000000005,
  "rw.queue-depth.1.block-size.512.write.lat_ns.mean": 21764.184999999998
}
2.7. Abort a Job
Issuing an HTTP DELETE to the job api http://StorPerf:5000/api/v1.0/jobs will force the termination of the whole job, regardless of how many workloads remain to be executed.
curl -X DELETE --header 'Accept: application/json' http://StorPerf:5000/api/v1.0/jobs
2.8. List all Jobs
A list of all Jobs can also be queried. You just need to issue a GET request without any Job ID.
curl -X GET --header 'Accept: application/json' http://StorPerf/api/v1.0/jobs
2.9. Delete the Environment
After you are done testing, you can have StorPerf delete the Heat stack by issuing an HTTP DELETE to the configurations API.
curl -X DELETE --header 'Accept: application/json' http://StorPerf:5000/api/v1.0/configurations
You may also want to delete an environment, and then create a new one with a different number of VMs/Cinder volumes to test the impact of the number of VMs in your environment.
2.10. Viewing StorPerf Logs
Logs are an integral part of any application as they help debugging the application. The user just needs to issue an HTTP request. To view the entire logs
curl -X GET --header 'Accept: application/json' http://StorPerf:5000/api/v1.0/logs?lines=all
Alternatively, one can also view a certain amount of lines by specifying the number in the request. If no lines are specified, then last 35 lines are returned
curl -X GET --header 'Accept: application/json' http://StorPerf:5000/api/v1.0/logs?lines=12
3. Storperf Reporting Module
3.1. About this project
- This project aims to create a series of graphs to support the SNIA reports.
- All data for the reports can be fetched either from the OPNFV Test Results DB, or locally from StorPerf’s own database of current run data.
- The report code may be stored in either the Releng repository (so it can be included in the Test Results Dashboards), or locally in StorPerf’s own git repository.
- The report (generated by the reporting module) looks like the following example:
3.2. Usage
- Enter the URL for the location of the data for which you want to generate the report.
- Note: You can test the module using the testdata present in the directory
storperf-reporting/src/static/testdata. Instead of the URL enter the filename present in the testdata directory, eg. local-data.json - After entering the URL, you are taken to the page showing the details of the all the jobs present in the data.
- Click on the Click here to view details to see the different block sizes for the respective job.
- Click on the block size and select the parameter for which you want to view the graph.
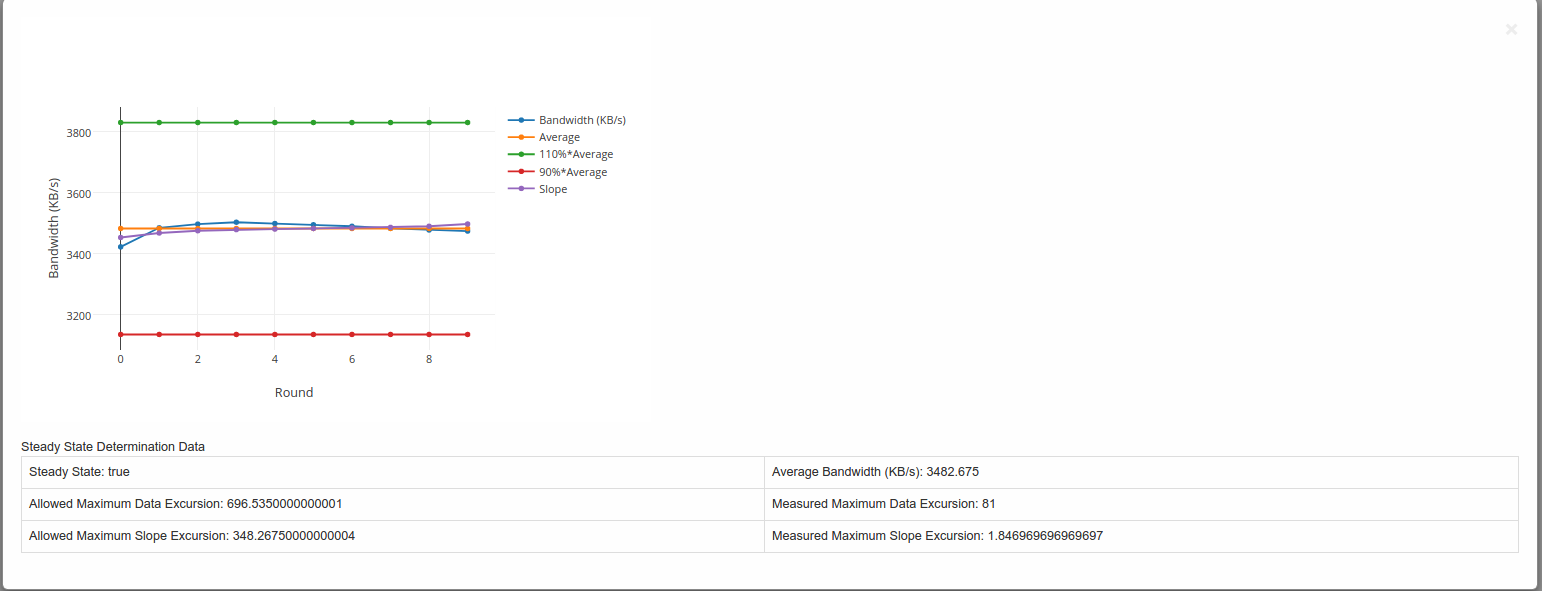
3.3. Graph Explanation
Example of a graph generated is shown below:-
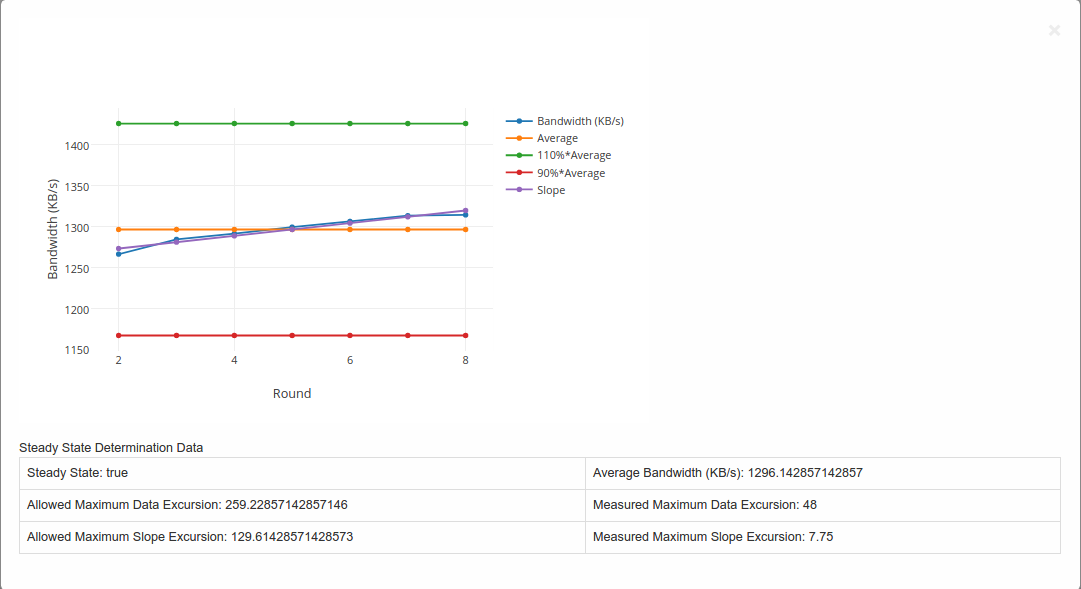
Steady State Convergence Graph
- This graph shows the values as reported by StorPerf for the actual and average throughput.
- Also shown is the average +-10% and the slope.
- It serves to visually demonstrate the compliance to the steady state definition.
- The allowed maximum data excursion is 20% of the average (or average x 0.20)
- The allowed maximum slope excursion is 10% of the average.
- The measured data excursion is the value from range.
- The measured slope excursion is the value from range
3.4. Workflow
A Flask server is used to fetch the data and is sent to the client side for formation of the graphs (Using Javascript).
3.4.1. Steps involved
- Step 1: Data is fetched from the OPNFV Test Results ReST API
- Step 2: The fields “report_data” and “metrics” are taken from the JSON object retrieved in the above step and sent to the client side.
- Step 3: The “report_data” is obtained by the client side and a parser written in Javascript along with Plotly.js forms the graphs.
3.5. Directory structure
storperf/docker/storperf-reporting/ contains the code used for this project.
The file structure is as follows:-
storperf-reporting
|+-- Dockerfile                         # Dockerfile for the storperf-reporting container
|+-- requirements.txt                   # pip requirements for the container
+-- src                                 # Contains the code for the flask server
    |+-- app.py                         # Code to run the flask application
    |+-- static                         # Contains the static files (js,css)
    |   |+-- css                        # Contains css files
    |   |   `-- bootstrap.min.css
    |   |+-- images
    |   |+-- js                         # Contains the javascript files
    |   |   |-- bootstrap.min.js
    |   |   |-- Chart.min.js
    |   |   |-- jquery-2.1.3.min.js
    |   |   |-- jquery.bootpag.min.js
    |   |   `-- plotly-latest.min.js    # Used for plotting the graphs
    |   `-- testdata                    # Contains testing data for the module
    `-- templates
        |-- index.html
        |-- plot_jobs.html
        |-- plot_multi_data.html
        `-- plot_tables.html
3.6. Graphing libraries and tools
- Plotly.js is used as the graphing library for this project (Link: https://plot.ly/javascript/)
- Bootstrap is used for the UI of the project.
StorPerf Dev Guide
1. StorPerf Dev Guide
1.1. Initial Set up
1.1.1. Getting the Code
Replace your LFID with your actual Linux Foundation ID.
git clone ssh://YourLFID@gerrit.opnfv.org:29418/storperf
1.1.2. Virtual Environment
It is preferred to use virtualenv for Python dependencies. This way it is known exactly what libraries are needed, and can restart from a clean state at any time to ensure any library is not missing. Simply running the script:
ci/verify.sh
from inside the storperf directory will automatically create a virtualenv in the home directory called ‘storperf_venv’. This will be used as the Python interpreter for the IDE.
1.1.3. Docker Version
In order to run the full set of StorPerf services, docker and docker-compose are required to be installed. This requires docker 17.05 at a minimum.
https://docs.docker.com/engine/installation/linux/docker-ce/ubuntu/
1.2. IDE
While PyCharm as an excellent IDE, some aspects of it require licensing, and the PyDev Plugin for Eclipse (packaged as LiClipse) is fully open source (although donations are welcome). Therefore this section focuses on using LiClipse for StorPerf development.
1.2.1. Download
http://www.liclipse.com/download.html
1.2.2. Storperf virtualenv Interpretor
Setting up interpreter under PyDev (LiClipse):
- Go to Project -> Properties, PyDev Interpreter:
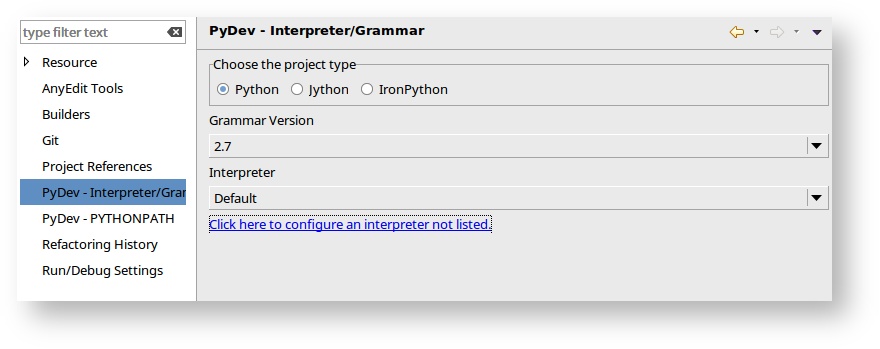
- Click to configure an interpreter not listed.
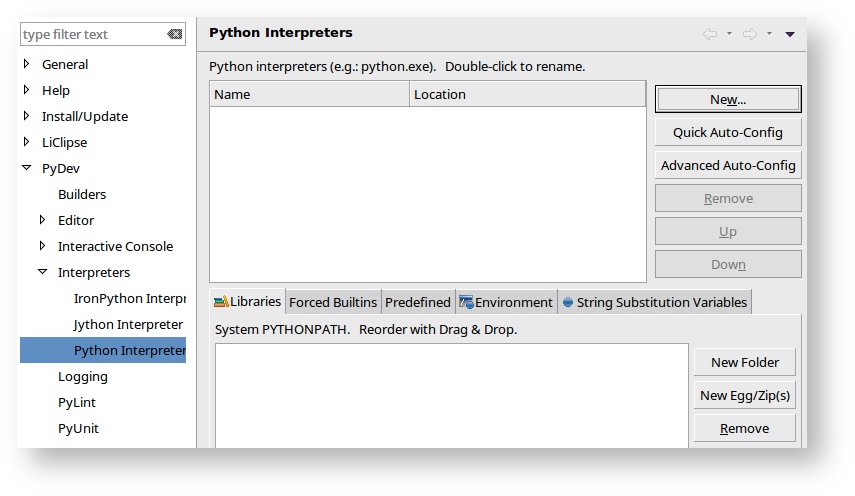
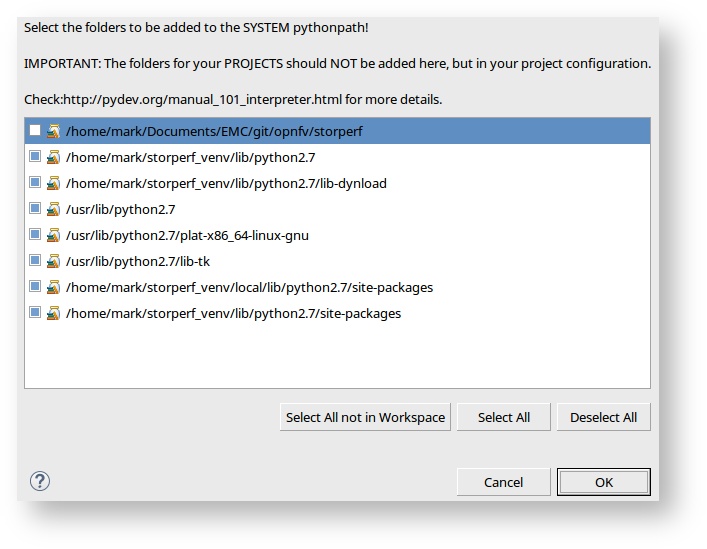
- Click New, and create a new interpreter called StorPerf that points to your Virtual Env.
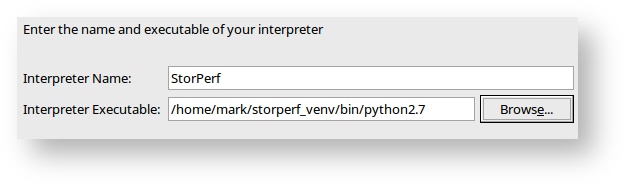
- You should get a pop up similar to:
- And then you can change the Interpreter to StorPerf.
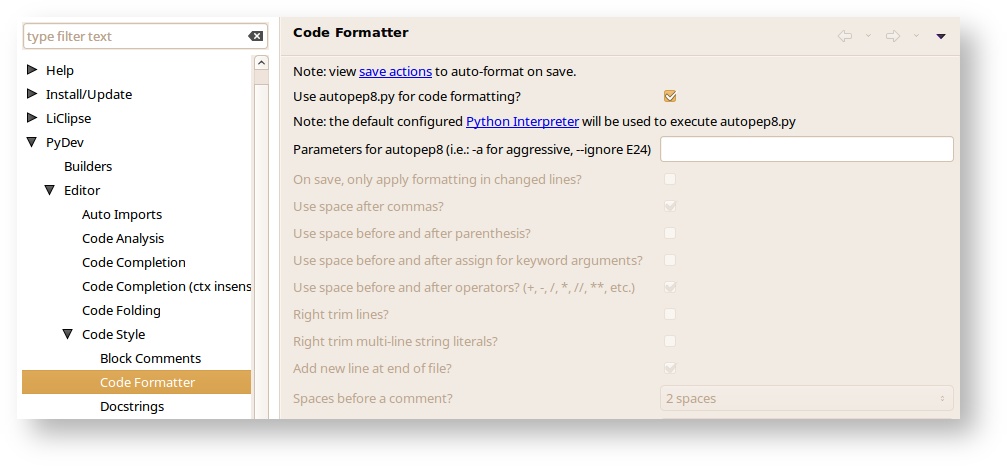
1.2.3. Code Formatting
Pep8 and Flake8 rule. These are part of the Gerrit checks and I’m going to start enforcing style guidelines soon.
- Go to Window -> Preferences, under PyDev, Editor, Code Style, Code Formatter and select autopep8.py for code formatting.
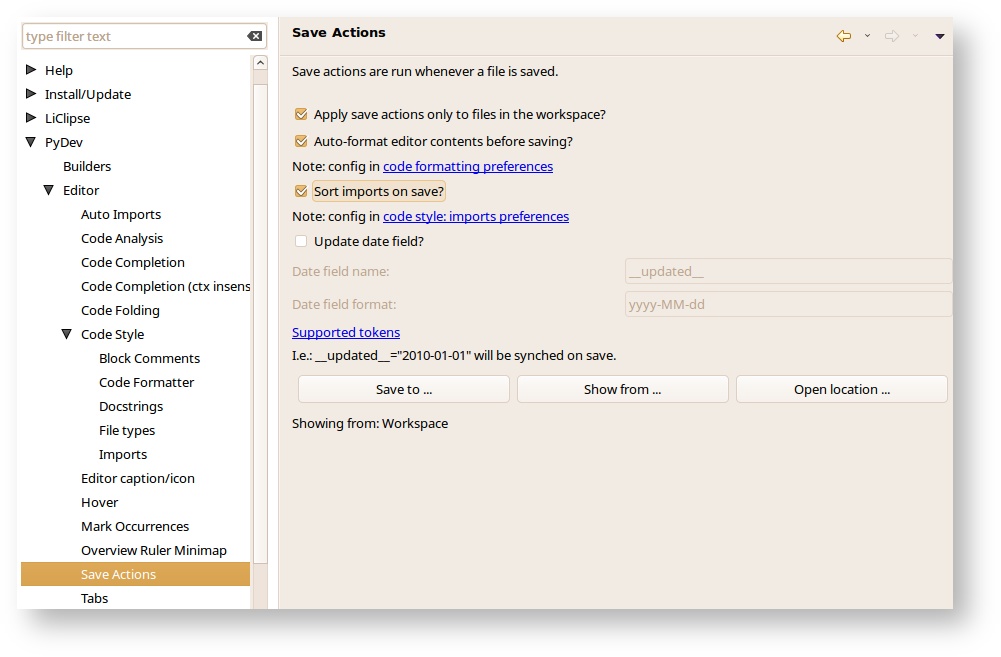
- Next, under Save Actions, enable “Auto-format editor contents before saving”, and “Sort imports on save”.
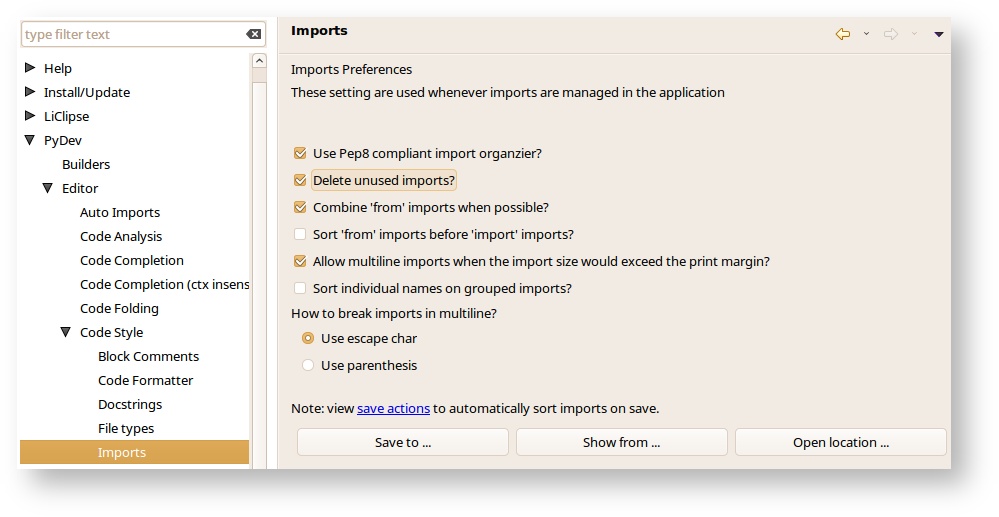
- And under Imports, select Delete unused imports.
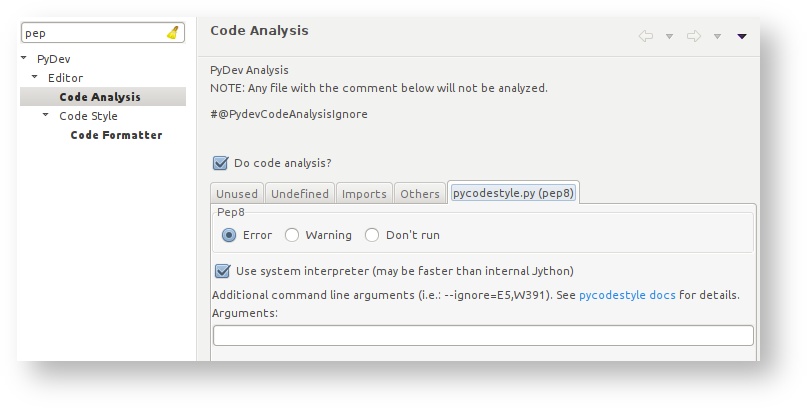
- Go to PyDev -> Editor -> Code Analysis and under the pycodestye.py (pep8), select Pep8 as Error. This flag highlight badly formatted lines as errors. These must be fixed before Jenkins will +1 any review.
1.2.4. Import Storperf as Git Project
I prefer to do the git clone from the command line, and then import that as a local project in LiClipse.
- From the menu: File -> Import Project
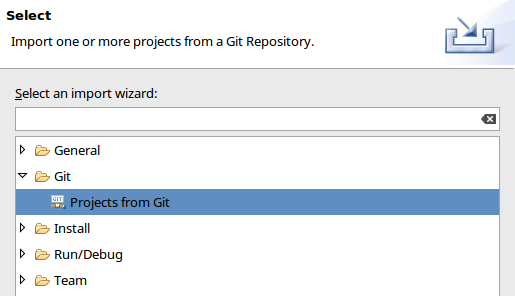
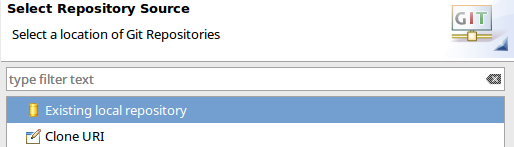
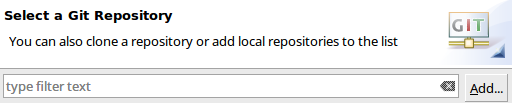
- Browse to the directory where you cloned StorPerf
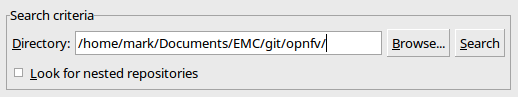
- You should now have storperf as a valid local git repo:
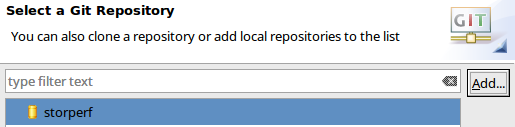
- Choose Import as general project
1.3. Unit Tests
1.3.1. Running from CLI
You technically already did when you ran:
ci/verify.sh
The shortcut to running the unit tests again from the command line is:
source ~/storperf_venv/bin/activate
nosetests --with-xunit \
      --with-coverage \
      --cover-package=storperf\
      --cover-xml \
      storperf
Note
You must be in the top level storperf directory in order to run the tests.
1.3.2. Set up under LiClipse
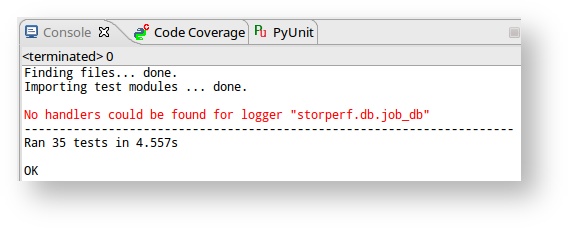
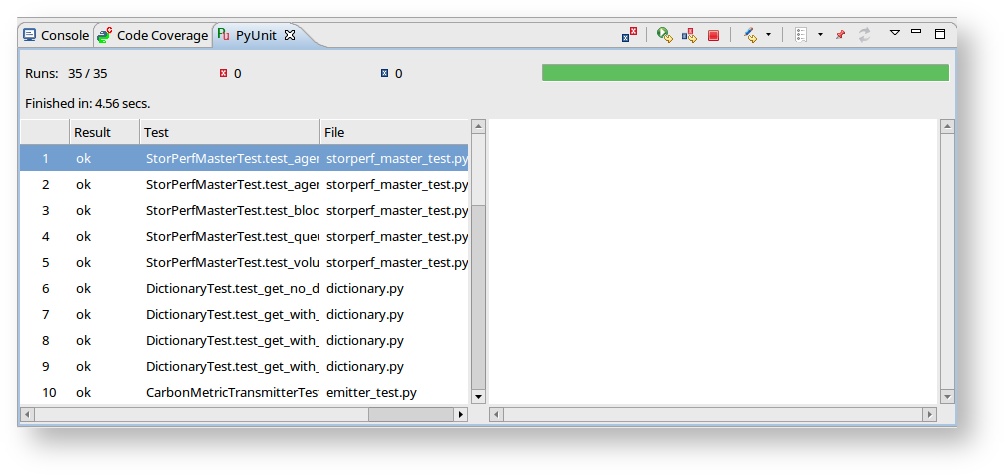
Running the tests:
Right click on the tests folder and select Run as Python Unit Test. Chances are, you’ll get:
Traceback (most recent call last):
  File "/home/mark/Documents/EMC/git/opnfv/storperf/storperf/tests/storperf_master_test.py", line 24, in setUp
    self.storperf = StorPerfMaster()
  File "/home/mark/Documents/EMC/git/opnfv/storperf/storperf/storperf_master.py", line 38, in __init__
    template_file = open("storperf/resources/hot/agent-group.yaml")
IOError: [Errno 2] No such file or directory: 'storperf/resources/hot/agent-group.yaml'
This means we need to set the working directory of the run configuration.
- Under the menu: Run -> Run Configurations:
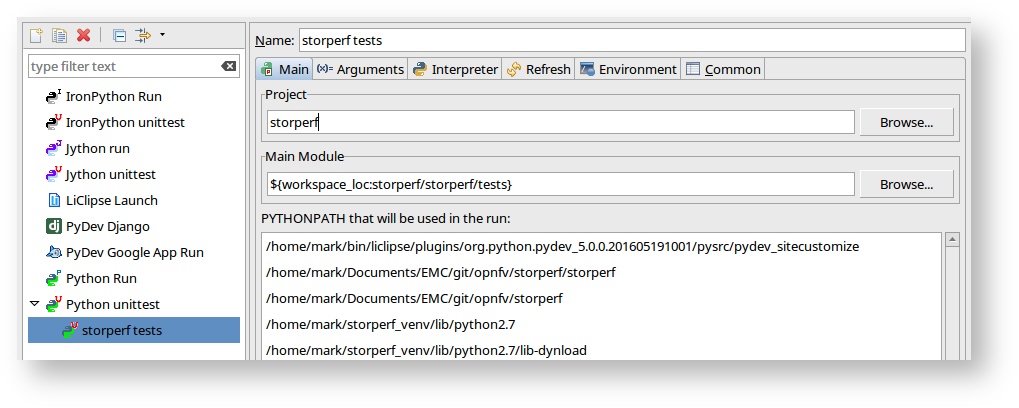
- Go to the Arguments tab and change the radio button for Working Directory to “Default”
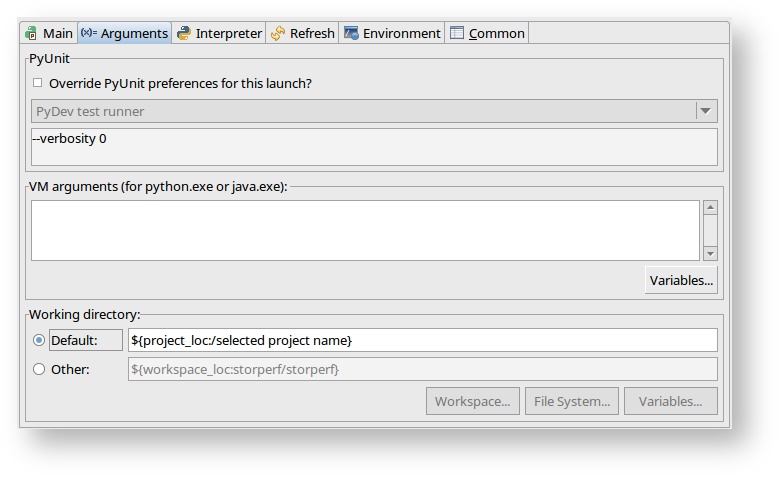
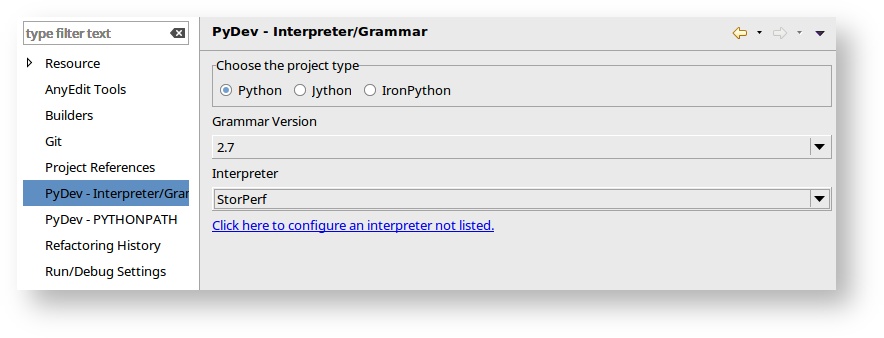
- And on interpreter tab, change the interpreter to StorPerf:
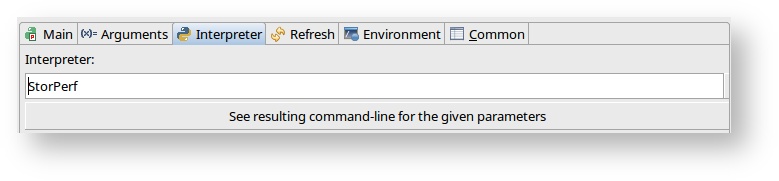
- Click Apply. From now on, the run should be clean:
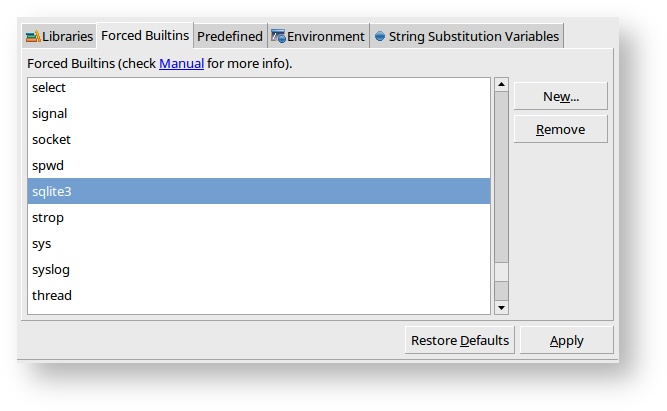
1.3.3. Adding builtins
For some reason, sqlite needs to be added as a builtin.
- Go to Window -> Preferences, PyDev > Interpreters > Python Interpreter and select the StorPerf interpreter:
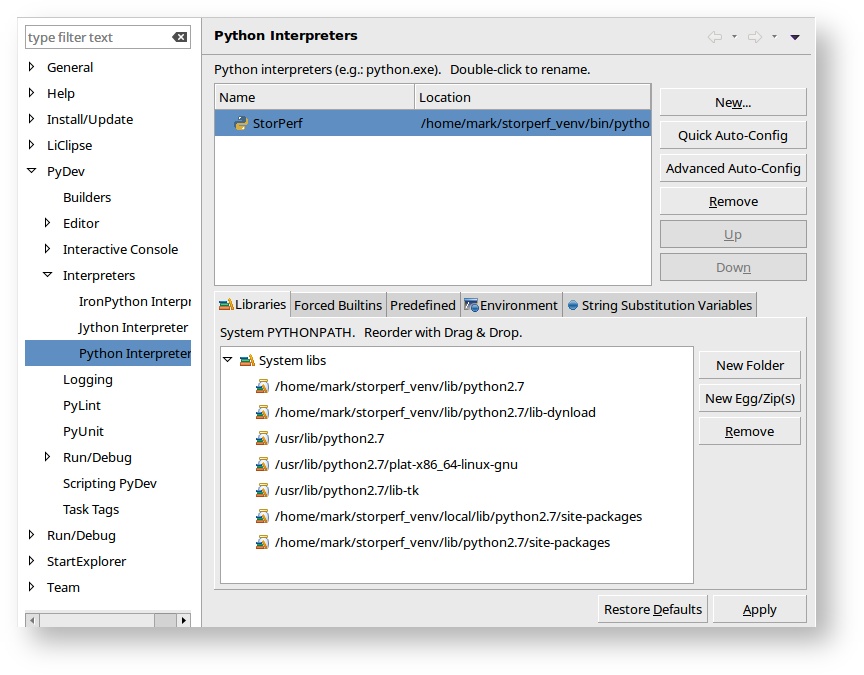
- Go to the Forced Builtins tab, click New and add sqlite3.
1.4. Gerrit
Installing and configuring Git and Git-Review is necessary in order to follow this guide. The Getting Started page will provide you with some help for that.
1.4.1. Committing the code with Gerrit
- Open a terminal window and set the project’s directory to the working directory using the cd command. In this case “/home/tim/OPNFV/storperf” is the path to the StorPerf project folder on my computer. Replace this with the path of your own project.
cd /home/tim/OPNFV/storperf
- Start a new topic for your change.
git checkout -b TOPIC-BRANCH
- Tell Git which files you would like to take into account for the next commit. This is called ‘staging’ the files, by placing them into the staging area, using the ‘git add’ command (or the synonym ‘git stage’ command).
git add storperf/utilities/math.py
git add storperf/tests/utilities/math.py
...
- Alternatively, you can choose to stage all files that have been modified (that is the files you have worked on) since the last time you generated a commit, by using the -a argument.
git add -a
- Git won’t let you push (upload) any code to Gerrit if you haven’t pulled the latest changes first. So the next step is to pull (download) the latest changes made to the project by other collaborators using the ‘pull’ command.
git pull
- Now that you have the latest version of the project and you have staged the files you wish to push, it is time to actually commit your work to your local Git repository.
git commit --signoff -m "Title of change

Test of change that describes in high level what
was done. There is a lot of documentation in code
so you do not need to repeat it here.

JIRA: STORPERF-54"
The message that is required for the commit should follow a specific set of rules. This practice allows to standardize the description messages attached to the commits, and eventually navigate among the latter more easily. This document happened to be very clear and useful to get started with that.
1.4.2. Pushing the code to Git for review
- Now that the code has been comitted into your local Git repository the following step is to push it online to Gerrit for it to be reviewed. The command we will use is ‘git review’.
git review
- This will automatically push your local commit into Gerrit, and the command should get back to you with a Gerrit URL that looks like this :
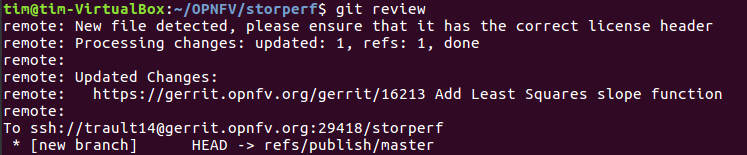
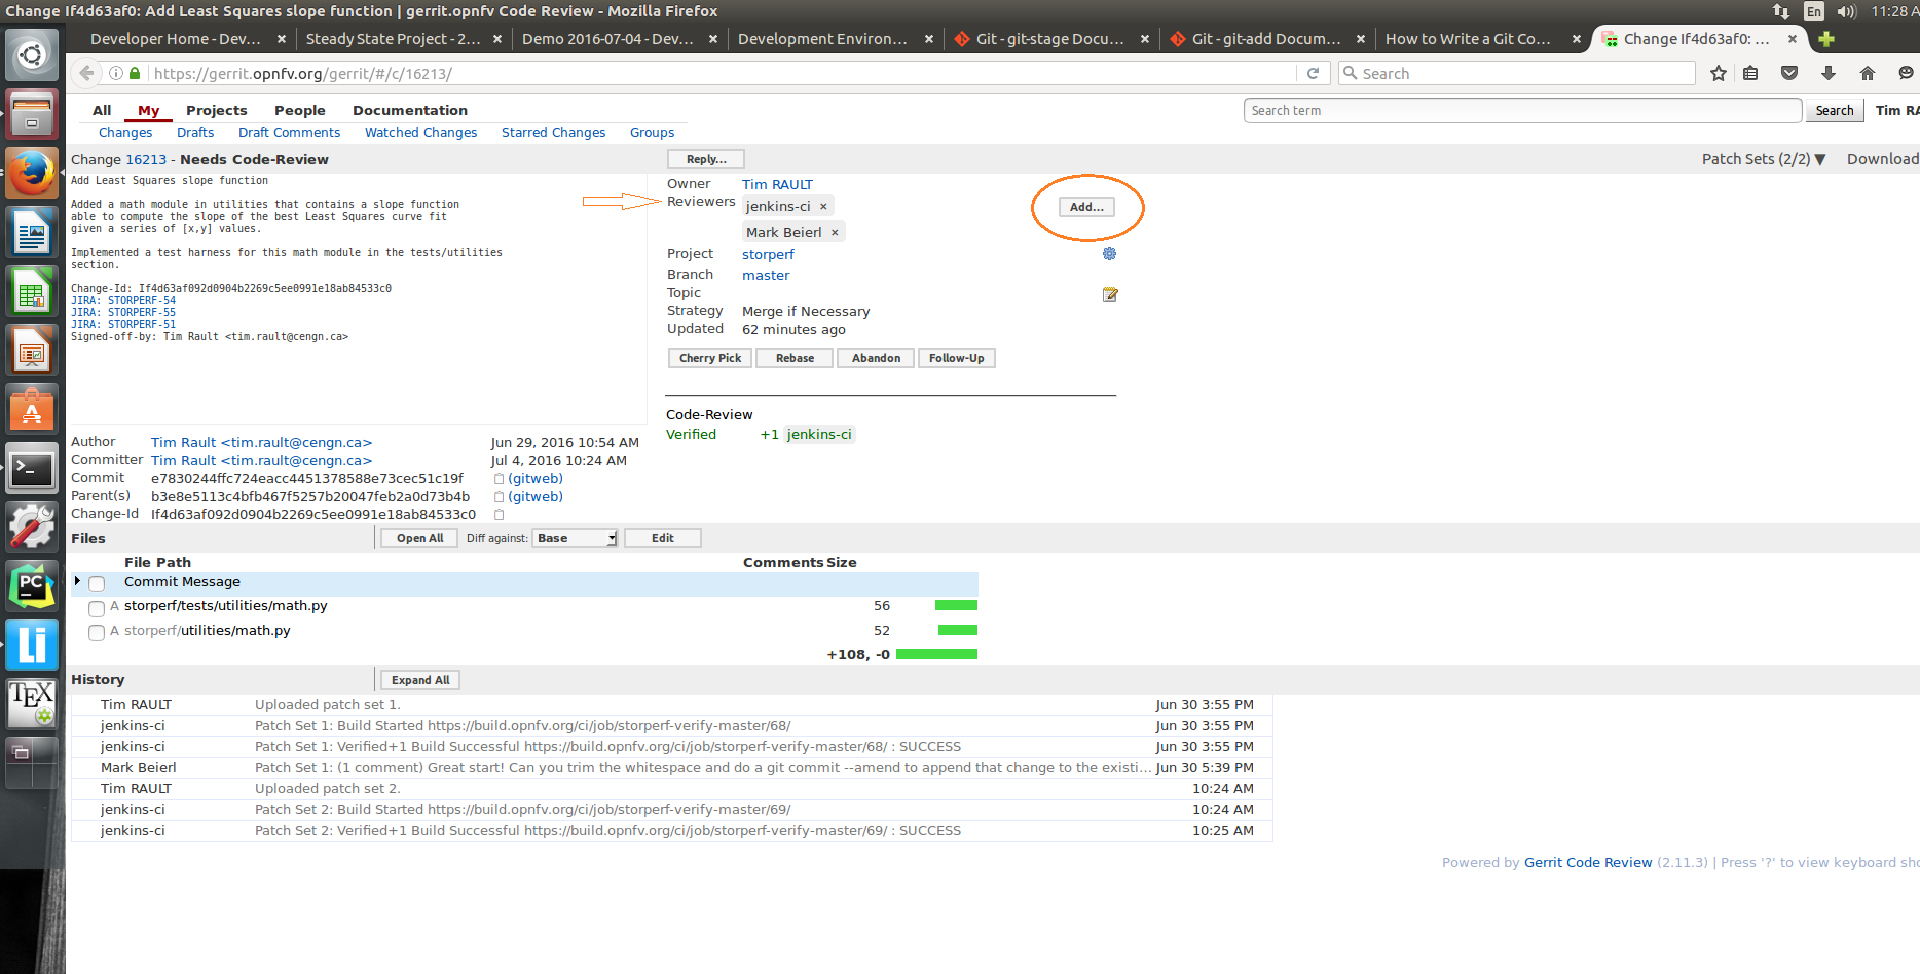
- The OPNFV-Gerrit-Bot in #opnfv-storperf IRC channel will send a message with the URL as well.

- Copy/Paste the URL into a web browser to get to the Gerrit code review you have just generated, and click the ‘add’ button to add reviewers to review your changes :
Note
Check out this section if the git review command returns to you with an “access denied” error.
1.4.3. Fetching a Git review
If you want to collaborate with another developer, you can fetch their review by the Gerrit change id (which is part of the URL, and listed in the top left as Change NNNNN).
git review -d 16213
would download the patchset for change 16213. If there were a topic branch associated with it, it would switch you to that branch, allowing you to look at different patch sets locally at the same time without conflicts.
1.4.4. Modifying the code under review in Gerrit
At the same time the code is being reviewed in Gerrit, you may need to edit it to make some changes and then send it back for review. The following steps go through the procedure.
- Once you have modified/edited your code files under your IDE, you will have to stage them. The ‘status’ command is very helpful at this point as it provides an overview of Git’s current state.
git status
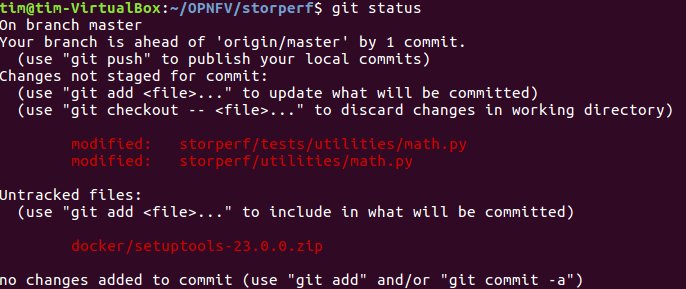
- The output of the command provides us with the files that have been modified after the latest commit (in this case I modified storperf/tests/utilities/ math.py and storperf/utilities/math.py).
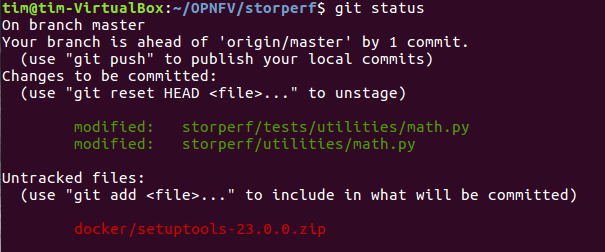
- We can now stage the files that have been modified as part of the Gerrit code review edition/modification/improvement :
git add storperf/tests/utilities/math.py
git add storperf/utilities/math.py
- The ‘git status’ command should take this into consideration :
- It is now time to commit the newly modified files, but the objective here is not to create a new commit, we simply want to inject the new changes into the previous commit. We can achieve that with the ‘–amend’ option on the ‘commit’ command :
git commit --amend
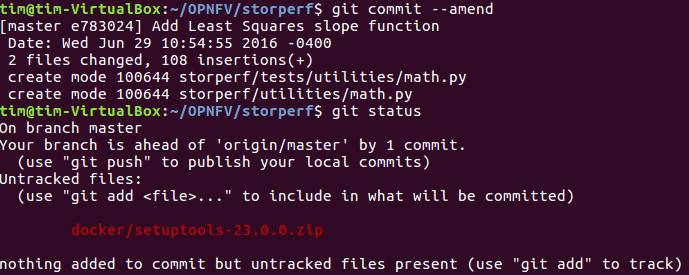
- If the commit was successful, the ‘status’ command should not return the updated files as about to be committed.
- The final step consists in pushing the newly modified commit to Gerrit.
git review
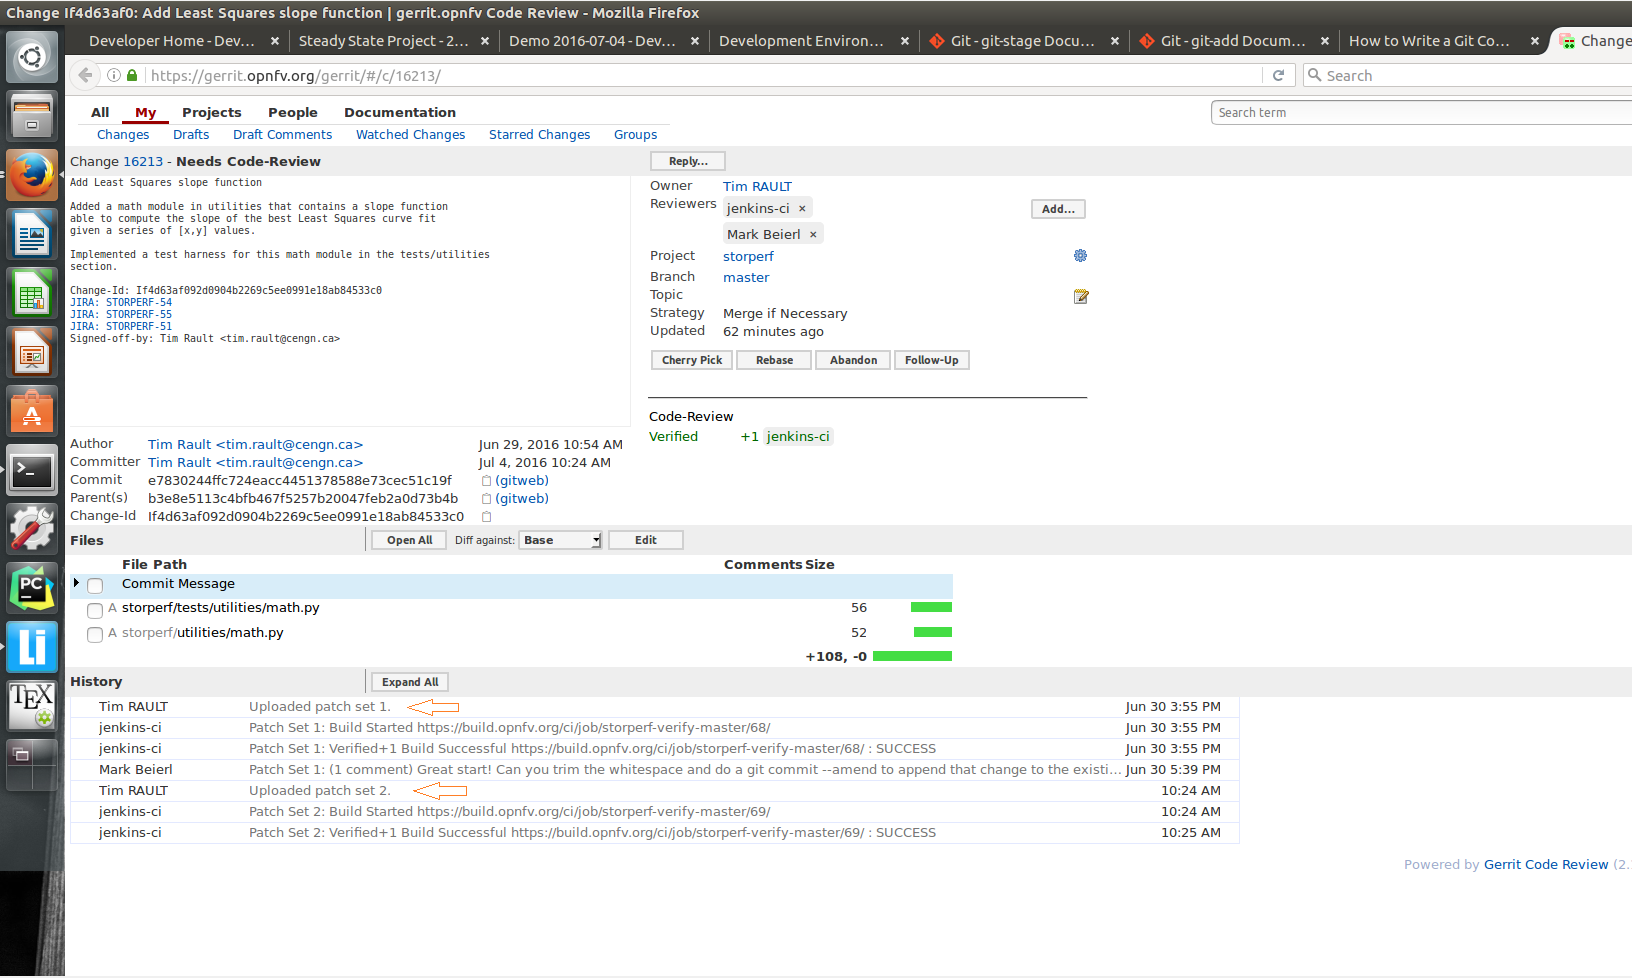
The Gerrit code review should be updated, which results in a ‘patch set 2’ notification appearing in the history log. ‘patch set 1’ being the original code review proposition.
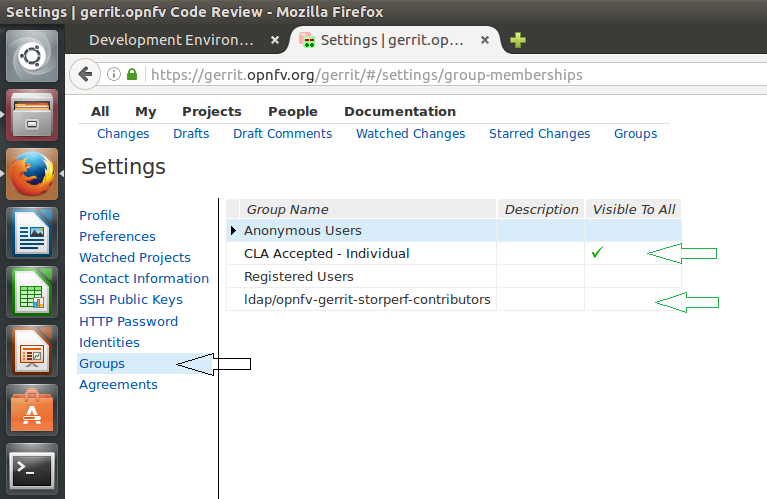
1.4.5. If Gerrit upload is denied
The ‘git review’ command might return to you with an “access denied” error that looks like this :
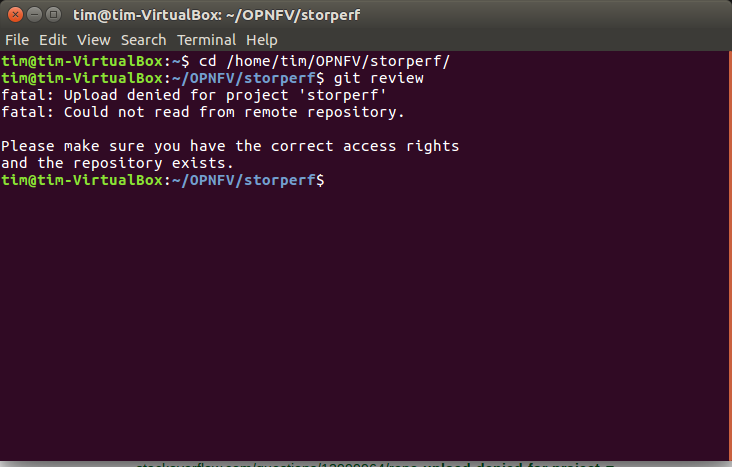
In this case, you need to make sure your Gerrit account has been added as a member of the StorPerf contributors group : ldap/opnfv-gerrit-storperf- contributors. You also want to check that have signed the CLA (Contributor License Agreement), if not you can sign it in the “Agreements” section of your Gerrit account :