QTIP - Platform Performance Benchmarking
QTIP is the project for Platform Performance Benchmarking in OPNFV. It aims to provide user a simple indicator for performance, simple but supported by comprehensive testing data and transparent calculation formula.
QTIP Release Notes
Danube
This document provides the release notes for Danube of QTIP.
Version history
| Date | Ver. | Author | Comment |
| 2017-03-30 | Danube 1.0 | Yujun Zhang | |
| 2017-05-04 | Danube 2.0 | Yujun Zhang |
Important notes
QTIP is totally reworked in Danube release. The legacy benchmarks released in Brahmaputra (compute, network and storage) are deprecated.
Summary
QTIP Danube release introduces QPI, a.k.a. QTIP Performance Index, which is calculated from metrics collected in performance tests.
A PoC of compute performance benchmark plan is provided as a sample use case.
Available benchmark plans can be listed, shown and executed from command line or over API.
Release Data
| Project | QTIP |
| Repo/commit-ID | qtip/danube.2.0 |
| Release designation | Danube bug fix release |
| Release date | 2017-05-04 |
| Purpose of the delivery | OPNFV quality assurance |
Version change
New in Danube 2.0
- Bug fix in regex of ssl
Module version changes
The following Python packages are used in this release:
ansible==2.1.2.0
click==6.7
connexion==1.1.5
Jinja2==2.9.5
numpy==1.12.1
paramiko==2.1.2
pbr==2.0.0
prettytable==0.7.2
six==1.10.0
PyYAML==3.12
It is considered as a baseline for future releases.
Reason for version
Features additions
- Compute QPI (QTIP Performance Index) specification and benchmarking plan
- Command line interface
- API server
Framework evolution
The following components are implemented and integrated
- Native runner
- File loader
- Ansible driver
- Logfile collector
- Grep parser
- Console reporter
See JIRA for full change log
Deliverables
Software
- QTIP Docker image (tag: danube.2.0)
- QTIP Docker image (tag: danube.1.0)
Known Limitations, Issues and Workarounds
Limitations
- The compute benchmark plan is hard coded in native runner
- Baseline for Compute QPI is not created yet, therefore scores are not available
Known issues
- QTIP-230 - logger warns about socket /dev/log when running in container
Test Result
QTIP has undergone QA test runs with the following results:
| TEST-SUITES | Results: |
| qtip-verify-danube | 94/94 passed |
| qtip-os-nosdn-kvm-ha-zte-pod3-daily-danube | Successful |
| qtip-os-nosdn-nofeature-ha-zte-pod3-daily-danube | Successful |
| qtip-os-odl_l2-nofeature-ha-zte-pod1-daily-danube | Successful |
Brahmaputra
NOTE: The release note for OPNFV Brahmaputra is missing. This is a copy of the README.
QTIP Benchmark Suite
QTIP is a benchmarking suite intended to benchmark the following components of the OPNFV Platform:
- Computing components
- Networking components
- Storage components
The efforts in QTIP are mostly focused on identifying
- Benchmarks to run
- Test cases in which these benchmarks to run
- Automation of suite to run benchmarks within different test cases
- Collection of test results
QTIP Framework can now be called: (qtip.py).
The Framework can run 5 computing benchmarks:
- Dhrystone
- Whetstone
- RamBandwidth
- SSL
- nDPI
These benchmarks can be run in 2 test cases:
- VM vs Baremetal
- Baremetal vs Baremetal
Instructions to run the script:
- Download and source the OpenStack adminrc file for the deployment on which you want to create the VM for benchmarking
- run python qtip.py -s {SUITE} -b {BENCHMARK}
- run python qtip.py -h for more help
- list of benchmarks can be found in the qtip/test_cases directory
- SUITE refers to compute, network or storage
Requirements:
- Ansible 1.9.2
- Python 2.7
- PyYAML
Configuring Test Cases:
Test cases can be found within the test_cases directory. For each Test case, a Config.yaml file contains the details for the machines upon which the benchmarks would run. Edit the IP and the Password fields within the files for the machines on which the benchmark is to run. A robust framework that would allow to include more tests would be included within the future.
Jump Host requirements:
The following packages should be installed on the server from which you intend to run QTIP.
1: Heat Client 2: Glance Client 3: Nova Client 4: Neutron Client 5: wget 6: PyYaml
Networking
1: The Host Machines/compute nodes to be benchmarked should have public/access network 2: The Host Machines/compute nodes should allow Password Login
QTIP support for Foreman
{TBA}
QTIP Installation & Configuration
Configuration
QTIP currently supports by using a Docker image. Detailed steps about setting up QTIP can be found below.
To use QTIP you should have access to an OpenStack environment, with at least Nova, Neutron, Glance, Keystone and Heat installed. Add a brief introduction to configure OPNFV with this specific installer
Installing QTIP using Docker
QTIP docker image
QTIP has a Docker images on the docker hub. Pulling opnfv/qtip docker image from docker hub:
docker pull opnfv/qtip:stable
Verify that opnfv/qtip has been downloaded. It should be listed as an image by
running the following command.
docker images
Run and enter the docker instance
1. If you want to run benchmarks:
envs="INSTALLER_TYPE={INSTALLER_TYPE} -e INSTALLER_IP={INSTALLER_IP}"
docker run -p [HOST_IP:]<HOST_PORT>:5000 --name qtip -id -e $envs opnfv/qtip
docker exec -i -t qtip /bin/bash
INSTALLER_TYPE should be one of OPNFV installer, e.g. apex, compass, daisy, fuel
and joid. Currenty, QTIP only supports installer fuel.
INSTALLER_IP is the ip address of the installer that can be accessed by QTIP.
2. If you do not want to run any benchmarks:
docker run --name qtip -id opnfv/qtip
docker exec -i -t qtip /bin/bash
Now you are in the container and QTIP can be found in the /repos/qtip and can
be navigated to using the following command.
cd repos/qtip
Install from source code
You may try out the latest version of QTIP by installing from source code. It is recommended to run it under Python
virtualenv so it won’t screw system libraries.
Run the following commands:
git clone https://git.opnfv.org/qtip && cd qtip
virtualenv .venv && source .venv/bin/activate
pip install -e .
Use the following command to exit virtualenv:
deactivate
Re-enter the virtualenv with:
cd <qtip-directory>
source .venv/bin/activate
Environment configuration
Hardware configuration
QTIP does not have specific hardware requriements, and it can runs over any OPNFV installer.
Jumphost configuration
Installer Docker on Jumphost, which is used for running QTIP image.
You can refer to these links:
Ubuntu: https://docs.docker.com/engine/installation/linux/ubuntu/
Centos: https://docs.docker.com/engine/installation/linux/centos/
Platform components configuration
Describe the configuration of each component in the installer.
QTIP User Guide
Overview
QTIP is the project for Platform Performance Benchmarking in OPNFV. It aims to provide user a simple indicator for performance, simple but supported by comprehensive testing data and transparent calculation formula.
QTIP introduces a concept called QPI, a.k.a. QTIP Performance Index, which aims to be a TRUE indicator of performance. TRUE reflects the core value of QPI in four aspects
- Transparent: being an open source project, user can inspect all details behind QPI, e.g. formulas, metrics, raw data
- Reliable: the integrity of QPI will be guaranteed by traceability in each step back to raw test result
- Understandable: QPI is broke down into section scores, and workload scores in report to help user to understand
- Extensible: users may create their own QPI by composing the existed metrics in QTIP or extend new metrics
Benchmarks
The builtin benchmarks of QTIP are located in <package_root>/benchmarks folder
- QPI: specifications about how an QPI is calculated and sources of metrics
- metric: performance metrics referred in QPI, currently it is categorized by performance testing tools
- plan: executable benchmarking plan which collects metrics and calculate QPI
Run with Ansible
QTIP benchmarking tasks are built upon Ansible playbooks and roles. If you are familiar with Ansible, it is possible
to run it with ansible-playbook command.
Create workspace
There is a playbook in tests/integration used for creating a new workspace for QTIP benchmarking:
cd qtip/tests/integration
ansible-playbook workspace-create.yml
You will be prompted for required information for the Pod under test:
(qtip) ➜  integration git:(master) ✗ ansible-playbook workspace-create.yml
name of the pod under test (used in reporting) [qtip-pod]:
scenario deployed in the pod: [default]:
installer type of the pod (apex|fuel|other) [fuel]:
master host/vm of the installer (accessible by `ssh <hostname>`): f5
workspace name (new directory will be created) [workspace]:

PLAY [localhost] ***************************************************************

TASK [qtip-workspace : generating workspace] ***********************************

PLAY RECAP *********************************************************************
localhost                  : ok=0    changed=0    unreachable=0    failed=0
You may hit Enter to accept default value
NOTE: if this playbook is moved to other directory, configuration in ansible.cfg needs to be updated accordingly.
The ansible roles from QTIP, i.e. <path_of_qtip>/resources/ansible_roles must be added to roles_path in
Ansible configuration file. For example:
roles_path = ../../resources/ansible_roles
Executing benchmark
Before executing the setup playbook, make sure ~/.ssh/config has been configured properly so that you can login the
master node “directly”. Skip next section, if you can login with ssh <master-host> from localhost,
SSH access to master node
It is common that the master node is behind some jump host. In this case, ssh option ProxyCommand and ssh-agent
shall be required.
Assume that you need to login to deploy server, then login to the master node from there. An example configuration is as following:
Host fuel-deploy
  HostName 172.50.0.250
  User root

Host fuel-master
  HostName 192.168.122.63
  User root
  ProxyCommand ssh -o 'ForwardAgent yes' apex-deploy 'ssh-add && nc %h %p'
If several jumps are required to reach the master node, we may chain the jump hosts like below:
Host jumphost
  HostName 10.62.105.31
  User zte
  Port 22

Host fuel-deploy
  HostName 172.50.0.250
  User root
  ProxyJump jumphost

Host fuel-master
  HostName 192.168.122.63
  User root
  ProxyCommand ssh -o 'ForwardAgent yes' apex-deploy 'ssh-add && nc %h %p'
NOTE: ProxyJump is equivalent to the long ProxyCommand option, but it is only available since OpenSSH 7.3
Setup testing environment
Run the setup playbook to generate ansible inventory of system under test by querying the slave nodes from the installer master:
cd workspace
ansible-playbook setup.yml
Currently, QTIP supports automatic discovery from apex and fuel
It will update the hosts and ssh.cfg
Run the tests
It is important to note that ssh-agent is required to run the tests. It must started correctly to ensure execution. The way to do it is
eval $(ssh-agent)
One can also kill the process as
eval $(ssh-agent -k)
Run the benchmarks with the following command:
ansible-playbook run.yml
CAVEAT: QTIP will install required packages in system under test.
Inspect the results
The test results and calculated output are stored in results:
current/
    node-2/
        arithmetic/
            metric.json
            report
            unixbench.log
        dpi/
        ...
    node-4/
    ...
    qtip-pod-qpi.json
qtip-pod-20170425-1710/
qtip-pod-20170425-1914/
...
The folders are named as <pod_name>-<start_time>/ and the results are organized by hosts under test. Inside each
host, the test data are organized by metrics as defined in QPI specification.
For each metrics, it usually includes the following content
- log file generated by the performance testing tool
- metrics collected from the log files
- reported rendered with the metrics collected
Teardown the test environment
QTIP will create temporary files for testing in system under test. Execute the teardown playbook to clean it up:
ansible-playbook teardown.yml
CLI User Manual
QTIP consists of a number of benchmarking tools or metrics, grouped under QPI’s. QPI’s map to the different components of a NFVI ecosystem, such as compute, network and storage. Depending on the type of application, a user may group them under plans.
QTIP CLI provides interface to all of the above the components. A help page provides a list of all the commands along with a short description.
qtip [-h|--help]
Typically a complete plan is executed at the target environment. QTIP defaults to a number of sample plans. A list of all the available plans can be viewed
qtip plan list
In order to view the details about a specific plan.
qtip plan show <plan_name>
where plan_name is one of those listed from the previous command.
To execute a complete plan
qtip plan run <plan_name> -p <path_to_result_directory>
QTIP does not limit result storage at a specific directory. Instead a user may specify his own result storage as above. An important thing to remember is to provide absolute path of result directory.
mkdir result
qtip plan run <plan_name> -p $PWD/result
Similarly, the same commands can be used for the other two components making up the plans, i.e QPI’s and metrics. For example, in order to run a single metric
qtip metric run <metric_name> -p $PWD/result
The same can be applied for a QPI.
QTIP also provides the utility to view benchmarking results on the console. One just need to provide to where the results are stored. Extending the example above
qtip report show <metric_name> -p $PWD/result
Debug option helps identify the error by providing a detailed traceback. It can be enabled as
qtip [-d|--debug] plan run <plan_name>
API User Manual
QTIP consists of a number of benchmarking tools or metrics, grouped under QPI’s. QPI’s map to the different components of an NFVI ecosystem, such as compute, network and storage. Depending on the type of application, a user may group them under plans.
QTIP API provides a RESTful interface to all of the above components. User can retrieve list of plans, QPIs and metrics and their individual information.
Running
After installing QTIP. API server can be run using command qtip-api on the local machine.
All the resources and their corresponding operation details can be seen at /v1.0/ui.
The whole API specification in json format can be seen at /v1.0/swagger.json.
The data models are given below:
- Plan
- Metric
- QPI
Plan:
{
  "name": <plan name>,
  "description": <plan profile>,
  "info": <{plan info}>,
  "config": <{plan configuration}>,
  "QPIs": <[list of qpis]>,
},
Metric:
{
  "name": <metric name>,
  "description": <metric description>,
  "links": <[links with metric information]>,
  "workloads": <[cpu workloads(single_cpu, multi_cpu]>,
},
QPI:
{
  "name": <qpi name>,
  "description": <qpi description>,
  "formula": <formula>,
  "sections": <[list of sections with different metrics and formulaes]>,
}
The API can be described as follows
Plans:
Method Path Description GET /v1.0/plans Get the list of of all plans GET /v1.0/plans/{name} Get details of the specified plan
Metrics:
Method Path Description GET /v1.0/metrics Get the list of all metrics GET /v1.0/metrics/{name} Get details of specified metric
QPIs:
Method Path Description GET /v1.0/qpis Get the list of all QPIs GET /v1.0/qpis/{name} Get details of specified QPI
- Note:
- running API with connexion cli does not require base path (/v1.0/) in url
Compute Performance Benchmarking
The compute QPI aims to benchmark the compute components of an OPNFV platform. Such components include, the CPU performance, the memory performance.
The compute QPI consists of both synthetic and application specific benchmarks to test compute components.
All the compute benchmarks could be run in the scenario: On Baremetal Machines provisioned by an OPNFV installer (Host machines)
Note: The Compute benchmank constains relatively old benchmarks such as dhrystone and whetstone. The suite would be updated for better benchmarks such as Linbench for the OPNFV E release.
Getting started
Notice: All descriptions are based on QTIP container.
Inventory File
QTIP uses Ansible to trigger benchmark test. Ansible uses an inventory file to
determine what hosts to work against. QTIP can automatically generate a inventory
file via OPNFV installer. Users also can write their own inventory infomation into
/home/opnfv/qtip/hosts. This file is just a text file containing a list of host
IP addresses. For example:
[hosts]
10.20.0.11
10.20.0.12
QTIP key Pair
QTIP use a SSH key pair to connect to remote hosts. When users execute compute QPI,
QTIP will generate a key pair named QtipKey under /home/opnfv/qtip/ and pass
public key to remote hosts.
If environment variable CI_DEBUG is set to true, users should delete it by manual. If CI_DEBUG is not set or set to false, QTIP will delete the key from remote hosts before the execution ends. Please make sure the key deleted from remote hosts or it can introduce a security flaw.
Commands
In a QTIP container, you can run compute QPI by using QTIP CLI:
mkdir result
qtip plan run <plan_name> -p $PWD/result
QTIP generates results in the $PWD/result directory are listed down under the
timestamp name.
you can get more details from userguide/cli.rst.
Metrics
The benchmarks include:
Dhrystone 2.1
Dhrystone is a synthetic benchmark for measuring CPU performance. It uses integer calculations to evaluate CPU capabilities. Both Single CPU performance is measured along multi-cpu performance.
Dhrystone, however, is a dated benchmark and has some short comings. Written in C, it is a small program that doesn’t test the CPU memory subsystem. Additionally, dhrystone results could be modified by optimizing the compiler and insome cases hardware configuration.
References: http://www.eembc.org/techlit/datasheets/dhrystone_wp.pdf
Whetstone
Whetstone is a synthetic benchmark to measure CPU floating point operation performance. Both Single CPU performance is measured along multi-cpu performance.
Like Dhrystone, Whetstone is a dated benchmark and has short comings.
References:
OpenSSL Speed
OpenSSL Speed can be used to benchmark compute performance of a machine. In QTIP, two OpenSSL Speed benchmarks are incorporated:
- RSA signatunes/sec signed by a machine
- AES 128-bit encryption throughput for a machine for cipher block sizes
References:
RAMSpeed
RAMSpeed is used to measure a machine’s memory perfomace. The problem(array)size is large enough to ensure Cache Misses so that the main machine memory is used.
INTmem and FLOATmem benchmarks are executed in 4 different scenarios:
- Copy: a(i)=b(i)
- Add: a(i)=b(i)+c(i)
- Scale: a(i)=b(i)*d
- Tniad: a(i)=b(i)+c(i)*d
INTmem uses integers in these four benchmarks whereas FLOATmem uses floating points for these benchmarks.
References:
DPI
nDPI is a modified variant of OpenDPI, Open source Deep packet Inspection, that is maintained by ntop. An example application called pcapreader has been developed and is available for use along nDPI.
A sample .pcap file is passed to the pcapreader application. nDPI classifies traffic in the pcap file into different categories based on string matching. The pcapreader application provides a throughput number for the rate at which traffic was classified, indicating a machine’s computational performance. The results are run 10 times and an average is taken for the obtained number.
nDPI may provide non consistent results and was added to Brahmaputra for experimental purposes
References:
http://www.ntop.org/products/deep-packet-inspection/ndpi/
http://www.ntop.org/wp-content/uploads/2013/12/nDPI_QuickStartGuide.pdf
QTIP Developer Guide
Overview
QTIP uses Python as primary programming language and build the framework from the following packages
| Module | Package |
|---|---|
| api | Connexion - API first applications with OpenAPI/Swagger and Flask |
| cli | Click - the “Command Line Interface Creation Kit” |
| template | Jinja2 - a full featured template engine for Python |
| docs | sphinx - a tool that makes it easy to create intelligent and beautiful documentation |
| testing | pytest - a mature full-featured Python testing tool that helps you write better programs |
Source Code
The structure of repository is based on the recommended sample in The Hitchhiker’s Guide to Python
| Path | Content |
|---|---|
./benchmarks/ |
builtin benchmark assets including plan, QPI and metrics |
./contrib/ |
independent project/plugin/code contributed to QTIP |
./docker/ |
configuration for building Docker image for QTIP deployment |
./docs/ |
release notes, user and developer documentation, design proposals |
./legacy/ |
legacy obsoleted code that is unmaintained but kept for reference |
./opt/ |
optional component, e.g. scripts to setup infrastructure services for QTIP |
./qtip/ |
the actual package |
./tests/ |
package functional and unit tests |
./third-party/ |
third part included in QTIP project |
Coding Style
QTIP follows OpenStack Style Guidelines for source code and commit message.
Specially, it is recommended to link each patch set with a JIRA issue. Put:
JIRA: QTIP-n
in commit message to create an automatic link.
Testing
All testing related code are stored in ./tests/
| Path | Content |
|---|---|
./tests/data/ |
data fixtures for testing |
./tests/unit/ |
unit test for each module, follow the same layout as ./qtip/ |
./conftest.py |
pytest configuration in project scope |
tox is used to automate the testing tasks
cd <project_root>
pip install tox
tox
The test cases are written in pytest. You may run it selectively with
pytest tests/unit/reporter
Branching
Stable branches are created when features are frozen for next release. According to OPNFV release milestone description, stable branch window is open on MS6 and closed on MS7.
- Contact gerrit admin <opnfv-helpdesk@rt.linuxfoundation.org> to create branch for project.
- Setup qtip jobs and docker jobs for stable branch in releng
- Follow instructions for stable branch.
NOTE: we do NOT create branches for feature development as in the popular GitHub Flow
Releasing
Tag Deliverable and write release note
Git repository
Follow the example in Git Tagging Instructions for Danube to tag the source code:
git fetch gerrit
git checkout stable/<release-name>
git tag -am "<release-version>" <release-version>
git push gerrit <release-version>
Docker image
- Login OPNFV Jenkins
- Go to the `qtip-docker-build-push-<release>`_ and click “Build With Parameters”
- Fill in
RELEASE_VERSIONwith version number not including release name, e.g.1.0 - Trigger a manual build
Python Package
QTIP is also available as a Python Package. It is hosted on the Python Package Index(PyPI).
- Install twine with
pip install twine - Build the distributions
python setup.py sdist bdist_wheel - Upload the distributions built with
twine upload dist/*
NOTE: only package maintainers are permitted to upload the package versions.
Release note
Create release note under qtip/docs/release/release-notes and update index.rst
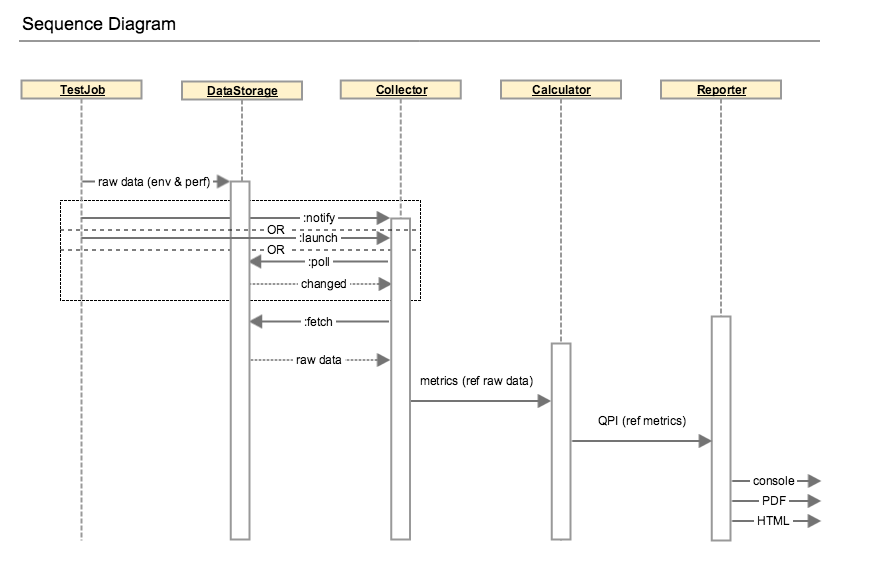
Architecture
In Danube, QTIP releases its standalone mode, which is also know as solo:
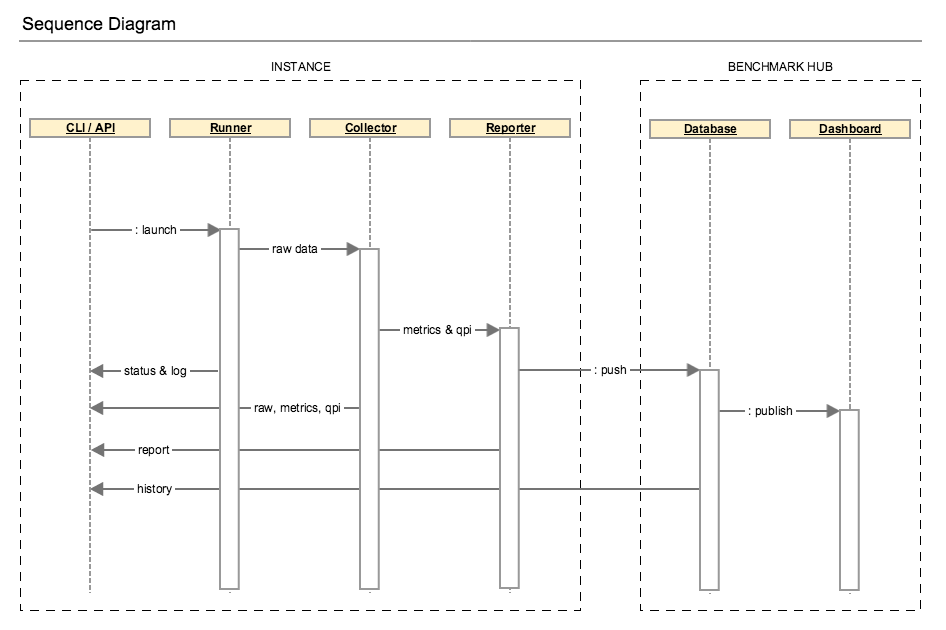
The runner could be launched from CLI (command line interpreter) or API (application programming interface) and drives the testing jobs. The generated data including raw performance data and testing environment are fed to collector. Performance metrics will be parsed from the raw data and used for QPI calculation. Then the benchmark report is rendered with the benchmarking results.
The execution can be detailed in the diagram below:
Framework
QTIP is built upon Ansible by extending modules, playbook roles and plugins.
Modules
QTIP creates dedicated modules to gather slave node list and information from installer master. See embedded document
in qtip/ansible_library/modules for details
Plugins
Stored in qtip/ansible_library/plugins
Action plugins
Several action plugins have been created for test data post processing
- collect - parse and collect metrics from raw test results like log files
- calculate - calculate score according to specification
- aggregate - aggregate calculated results from all hosts under test
Playbook roles
QTIP roles
- qtip - main qtip tasks
- qtip-common - common tasks required in QTIP
- qtip-workspace - generate a workspace for running benchmarks
qtip roles should be included with a specified action and output directory, e.g.:
- { role: inxi, output: "{{ qtip_results }}/sysinfo", tags: [run, inxi, sysinfo] }
testing roles
Testing roles are organized by testing tools
- inxi - system information tool
- nDPI
- openssl
- ramspeed
- unixbench
supporting roles
- opnfv-testapi - report result to testapi
Tags
Tags are used to categorize the test tasks from different aspects.
- stages like
run,collect,calculate,aggregate,report - test tools like
inxi,ndpiand etc - information or metrics like
sysinfo,dpi,ssl
Use
ansible-playbook run.yml --list-tagsto list all tagsansible-playbook run.yml --list-tasksto list all tasks
During development of post processing, you may skip run stage to save time, e.g.
ansible-playbook run.yml --tags collect,calculate,aggregate
CLI - Command Line Interface
QTIP consists of different tools(metrics) to benchmark the NFVI. These metrics fall under different NFVI subsystems(QPI’s) such as compute, storage and network. A plan consists of one or more QPI’s, depending upon how the end user would want to measure performance. CLI is designed to help the user, execute benchmarks and view respective scores.
Framework
QTIP CLI has been created using the Python package Click, Command Line Interface Creation Kit. It has been chosen for number of reasons. It presents the user with a very simple yet powerful API to build complex applications. One of the most striking features is command nesting.
As explained, QTIP consists of metrics, QPI’s and plans. CLI is designed to provide interface to all these components. It is responsible for execution, as well as provide listing and details of each individual element making up these components.
Design
CLI’s entry point extends Click’s built in MultiCommand class object. It provides two methods, which are overridden to provide custom configurations.
class QtipCli(click.MultiCommand):

    def list_commands(self, ctx):
        rv = []
        for filename in os.listdir(cmd_folder):
            if filename.endswith('.py') and \
                filename.startswith('cmd_'):
                rv.append(filename[4:-3])
        rv.sort()
        return rv

    def get_command(self, ctx, name):
        try:
            if sys.version_info[0] == 2:
                name = name.encode('ascii', 'replace')
            mod = __import__('qtip.cli.commands.cmd_' + name,
                             None, None, ['cli'])
        except ImportError:
            return
        return mod.cli
Commands and subcommands will then be loaded by the get_command method above.
Extending the Framework
Framework can be easily extended, as per the users requirements. One such example can be to override the builtin configurations with user defined ones. These can be written in a file, loaded via a Click Context and passed through to all the commands.
class Context:

    def __init__():

        self.config = ConfigParser.ConfigParser()
        self.config.read('path/to/configuration_file')

    def get_paths():

        paths = self.config.get('section', 'path')
        return paths
The above example loads configuration from user defined paths, which then need to be provided to the actual command definitions.
from qtip.cli.entry import Context

pass_context = click.make_pass_decorator(Context, ensure=False)

@cli.command('list', help='List the Plans')
@pass_context
def list(ctx):
    plans = Plan.list_all(ctx.paths())
    table = utils.table('Plans', plans)
    click.echo(table)
API - Application Programming Interface
QTIP consists of different tools(metrics) to benchmark the NFVI. These metrics fall under different NFVI subsystems(QPI’s) such as compute, storage and network. A plan consists of one or more QPI’s, depending upon how the end-user would want to measure performance. API is designed to expose a RESTful interface to the user for executing benchmarks and viewing respective scores.
Framework
QTIP API has been created using the Python package Connexion. It has been chosen for a number of reasons. It follows API First approach to create micro-services. Hence, firstly the API specifications are defined from the client side perspective, followed by the implementation of the micro-service. It decouples the business logic from routing and resource mapping making design and implementation cleaner.
It has two major components:
API Specifications
The API specification is defined in a yaml or json file. Connexion follows Open API specification to determine the design and maps the endpoints to methods in python.
- Micro-service Implementation
- Connexion maps the
operationIdcorresponding to every operation in API Specification to methods in python which handles request and responses.
As explained, QTIP consists of metrics, QPI’s and plans. The API is designed to provide a RESTful interface to all these components. It is responsible to provide listing and details of each individual element making up these components.
Design
Specification
API’s entry point (main) runs connexion App class object after adding API Specification
using App.add_api method. It loads specification from swagger.yaml file by specifying
specification_dir.
Connexion reads API’s endpoints(paths), operations, their request and response parameter
details and response definitions from the API specification i.e. swagger.yaml in this case.
Following example demonstrates specification for the resource plans.
paths:
  /plans/{name}:
    get:
      summary: Get a plan by plan name
      operationId: qtip.api.controllers.plan.get_plan
      tags:
        - Plan
        - Standalone
      parameters:
        - name: name
          in: path
          description: Plan name
          required: true
          type: string
      responses:
        200:
          description: Plan information
          schema:
            $ref: '#/definitions/Plan'
        404:
          description: Plan not found
          schema:
            $ref: '#/definitions/Error'
        501:
          description: Resource not implemented
          schema:
            $ref: '#/definitions/Error'
        default:
          description: Unexpected error
          schema:
            $ref: '#/definitions/Error'
definitions:
  Plan:
    type: object
    required:
      - name
    properties:
      name:
        type: string
      description:
        type: string
      info:
        type: object
      config:
        type: object
Every operationId in above operations corresponds to a method in controllers.
QTIP has three controller modules each for plan, QPI and metric. Connexion will
read these mappings and automatically route endpoints to business logic.
Swagger Editor can be explored to play with more such examples and to validate the specification.
Controllers
The request is handled through these methods and response is sent back to the client. Connexion takes care of data validation.
@common.check_endpoint_for_error(resource='Plan')
def get_plan(name):
    plan_spec = plan.Plan(name)
    return plan_spec.content
In above code get_plan takes a plan name and return its content.
The decorator check_endpoint_for_error defined in common is used to handle error
and return a suitable error response.
During Development the server can be run by passing specification file(swagger.yaml
in this case) to connexion cli -
connexion run <path_to_specification_file> -v
Extending the Framework
Modifying Existing API:
API can be modified by adding entries in
swagger.yamland adding the corresponding controller mapped fromoperationID.Adding endpoints:
New endpoints can be defined in
pathssection inswagger.yaml. To add a new resource dummy -paths: /dummies: get: summary: Get all dummies operationId: qtip.api.controllers.dummy.get_dummies tags: - dummy responses: 200: description: Foo information schema: $ref: '#/definitions/Dummy default: description: Unexpected error schema: $ref: '#/definitions/Error'And then model of the resource can be defined in the
definitionssection.definitions: Dummy: type: object required: - name properties: name: type: string description: type: string id: type: string
- Adding controller methods:
Methods for handling requests and responses for every operation for the endpoint added can be implemented in
controller.In
controllers.dummydef get_dummies(): all_dummies = [<code to get all dummies>] return all_dummies, httplib.OK- Adding error responses
Decorators for handling errors are defined in
common.pyinapi.from qtip.api import common @common.check_endpoint_for_error(resource='dummy',operation='get') def get_dummies() all_dummies = [<code to get all dummies>] return all_dummies
Adding new API:
API can easily be extended by adding more APIs to
Connexion.Appclass object usingadd_apiclass method.In
__main__def get_app(): app = connexion.App(__name__, specification_dir=swagger_dir) app.add_api('swagger.yaml', base_path='/v1.0', strict_validation=True) return appExtending it to add new APIs. The new API should have all endpoints mapped using
operationId.from qtip.api import __main__ my_app = __main__.get_app() my_app.add_api('new_api.yaml',base_path'api2',strict_validation=True) my_app.run(host="0.0.0.0", port=5000)
Compute QPI
The compute QPI gives user an overall score for system compute performace.
Summary
The compute QPI are calibrated a ZTE E9000 server as a baseline with score of 2500 points. Higher scores are better, with double the score indicating double the performance. The compute QPI provides three different kinds of scores:
- Workload Scores
- Section Scores
- Compute QPI Scores
Baseline
ZTE E9000 server with an 2 Deca core Intel Xeon CPU processor,128560.0MB Memory.
Workload Scores
Each time a workload is executed QTIP calculates a score based on the computer’s performance compared to the baseline performance.
Section Scores
QTIP uses a number of different tests, or workloads, to measure performance. The workloads are divided into five different sections:
| Section | Detail | Indication |
|---|---|---|
| Integer | Integer workloads measure the integer instruction performace of host or vm by performing Dhrystone test. | All app relies on integer performance |
| Floating point | Floating point workloads measure the floating pointperfo rmance by performing Whetstone test. | Floating point performance is especially important in video games,digital content creation applications. |
| Memory | Memory workloads measure memory bandwidth by performing RamSpeed test. | Software working with cipher large amounts data relies on SSL Performace. |
| DPI | DPI workloads measure deep-packet inspection speed by performing nDPI test. | Software working with network packet anlysis relies on DPI performance. |
| SSL | SSL Performance workloads measure cipher speeds by using the OpenSSL tool. | Software working with cipher large amounts data relies on SSL Performace |
A section score is the geometric mean of all the workload scores for workloads that are part of the section. These scores are useful for determining the performance of the computer in a particular area.
Compute QPI Scores
The compute QPI score is the weighted arithmetic mean of the five section scores. The compute QPI score provides a way to quickly compare performance across different computers and different platforms without getting bogged down in details.