QTIP Developer Guide
Overview
QTIP uses Python as primary programming language and build the framework from the following packages
| Module | Package |
|---|---|
| api | Connexion - API first applications with OpenAPI/Swagger and Flask |
| cli | Click - the “Command Line Interface Creation Kit” |
| template | Jinja2 - a full featured template engine for Python |
| docs | sphinx - a tool that makes it easy to create intelligent and beautiful documentation |
| testing | pytest - a mature full-featured Python testing tool that helps you write better programs |
Source Code
The structure of repository is based on the recommended sample in The Hitchhiker’s Guide to Python
| Path | Content |
|---|---|
./benchmarks/ |
builtin benchmark assets including plan, QPI and metrics |
./contrib/ |
independent project/plugin/code contributed to QTIP |
./docker/ |
configuration for building Docker image for QTIP deployment |
./docs/ |
release notes, user and developer documentation, design proposals |
./legacy/ |
legacy obsoleted code that is unmaintained but kept for reference |
./opt/ |
optional component, e.g. scripts to setup infrastructure services for QTIP |
./qtip/ |
the actual package |
./tests/ |
package functional and unit tests |
./third-party/ |
third part included in QTIP project |
Coding Style
QTIP follows OpenStack Style Guidelines for source code and commit message.
Specially, it is recommended to link each patch set with a JIRA issue. Put:
JIRA: QTIP-n
in commit message to create an automatic link.
Testing
All testing related code are stored in ./tests/
| Path | Content |
|---|---|
./tests/data/ |
data fixtures for testing |
./tests/unit/ |
unit test for each module, follow the same layout as ./qtip/ |
./conftest.py |
pytest configuration in project scope |
tox is used to automate the testing tasks
cd <project_root>
pip install tox
tox
The test cases are written in pytest. You may run it selectively with
pytest tests/unit/reporter
Branching
Stable branches are created when features are frozen for next release. According to OPNFV release milestone description, stable branch window is open on MS6 and closed on MS7.
- Contact gerrit admin <opnfv-helpdesk@rt.linuxfoundation.org> to create branch for project.
- Setup qtip jobs and docker jobs for stable branch in releng
- Follow instructions for stable branch.
NOTE: we do NOT create branches for feature development as in the popular GitHub Flow
Releasing
Tag Deliverable and write release note
Git repository
Follow the example in Git Tagging Instructions for Danube to tag the source code:
git fetch gerrit
git checkout stable/<release-name>
git tag -am "<release-version>" <release-version>
git push gerrit <release-version>
Docker image
- Login OPNFV Jenkins
- Go to the `qtip-docker-build-push-<release>`_ and click “Build With Parameters”
- Fill in
RELEASE_VERSIONwith version number not including release name, e.g.1.0 - Trigger a manual build
Python Package
QTIP is also available as a Python Package. It is hosted on the Python Package Index(PyPI).
- Install twine with
pip install twine - Build the distributions
python setup.py sdist bdist_wheel - Upload the distributions built with
twine upload dist/*
NOTE: only package maintainers are permitted to upload the package versions.
Release note
Create release note under qtip/docs/release/release-notes and update index.rst
Run with Ansible
QTIP benchmarking tasks are built upon Ansible playbooks and roles. If you are familiar with Ansible, it is possible
to run it with ansible-playbook command. And it is useful during development of ansible modules or testing roles.
Create workspace
There is a playbook in resources/ansible_roles/qtip-workspace used for creating a new workspace:
cd resources/ansible_roles/qtip-workspace
ansible-playbook create.yml
NOTE: if this playbook is moved to other directory, configuration in ansible.cfg needs to be updated accordingly.
The ansible roles from QTIP, i.e. <path_of_qtip>/resources/ansible_roles must be added to roles_path in
Ansible configuration file. For example:
roles_path = ~/qtip/resources/ansible_roles
Executing benchmark
Before executing the setup playbook, make sure ~/.ssh/config has been configured properly so that you can login the
master node “directly”. Skip next section, if you can login with ssh <master-host> from localhost,
SSH access to master node
It is common that the master node is behind some jump host. In this case, ssh option ProxyCommand and ssh-agent
shall be required.
Assume that you need to login to deploy server, then login to the master node from there. An example configuration is as following:
Host fuel-deploy
  HostName 172.50.0.250
  User root

Host fuel-master
  HostName 192.168.122.63
  User root
  ProxyCommand ssh -o 'ForwardAgent yes' apex-deploy 'ssh-add && nc %h %p'
If several jumps are required to reach the master node, we may chain the jump hosts like below:
Host jumphost
  HostName 10.62.105.31
  User zte
  Port 22

Host fuel-deploy
  HostName 172.50.0.250
  User root
  ProxyJump jumphost

Host fuel-master
  HostName 192.168.122.63
  User root
  ProxyCommand ssh -o 'ForwardAgent yes' apex-deploy 'ssh-add && nc %h %p'
NOTE: ProxyJump is equivalent to the long ProxyCommand option, but it is only available since OpenSSH 7.3
Automatic setup
- Modify
<workspace>/group_vars/all.ymlto set installer information correctly - Modify
<workspace>/hostsfile to set installer master host correctly
#. Run the setup playbook to generate ansible inventory of system under test by querying the slave nodes from the installer master:
cd workspace
ansible-playbook setup.yml
It will update the hosts and ssh.cfg
Currently, QTIP supports automatic discovery from apex and fuel.
Manual setup
If your installer is not supported or you are
testing hosts not managed by installer, you may add them manually in [compute] group in <workspace>/hosts:
[compute:vars]
ansible_ssh_common_args=-F ./ssh.cfg

[compute]
node-2
node-4
node-6
node-7
And ssh.cfg for ssh connection configuration:
Host node-5
  HostName 10.20.5.12
  User root
Run the tests
Run the benchmarks with the following command:
ansible-playbook run.yml
CAVEAT: QTIP will install required packages in system under test.
Inspect the results
The test results and calculated output are stored in results:
current/
    node-2/
        arithmetic/
            metric.json
            report
            unixbench.log
        dpi/
        ...
    node-4/
    ...
    qtip-pod-qpi.json
qtip-pod-20170425-1710/
qtip-pod-20170425-1914/
...
The folders are named as <pod_name>-<start_time>/ and the results are organized by hosts under test. Inside each
host, the test data are organized by metrics as defined in QPI specification.
For each metrics, it usually includes the following content
- log file generated by the performance testing tool
- metrics collected from the log files
- reported rendered with the metrics collected
Teardown the test environment
QTIP will create temporary files for testing in system under test. Execute the teardown playbook to clean it up:
ansible-playbook teardown.yml
Architecture
In Danube, QTIP releases its standalone mode, which is also know as solo:
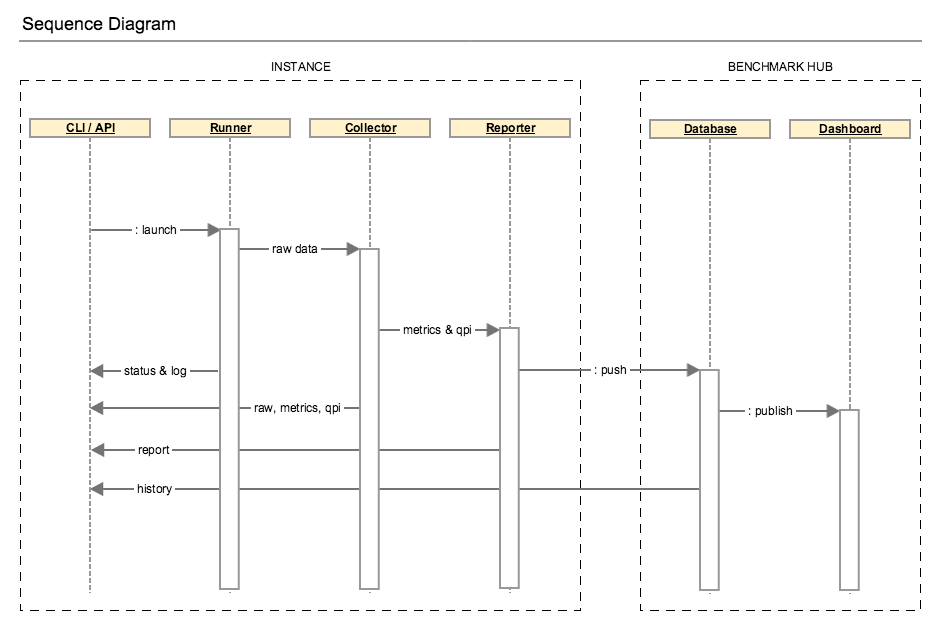
The runner could be launched from CLI (command line interpreter) or API (application programming interface) and drives the testing jobs. The generated data including raw performance data and testing environment are fed to collector. Performance metrics will be parsed from the raw data and used for QPI calculation. Then the benchmark report is rendered with the benchmarking results.
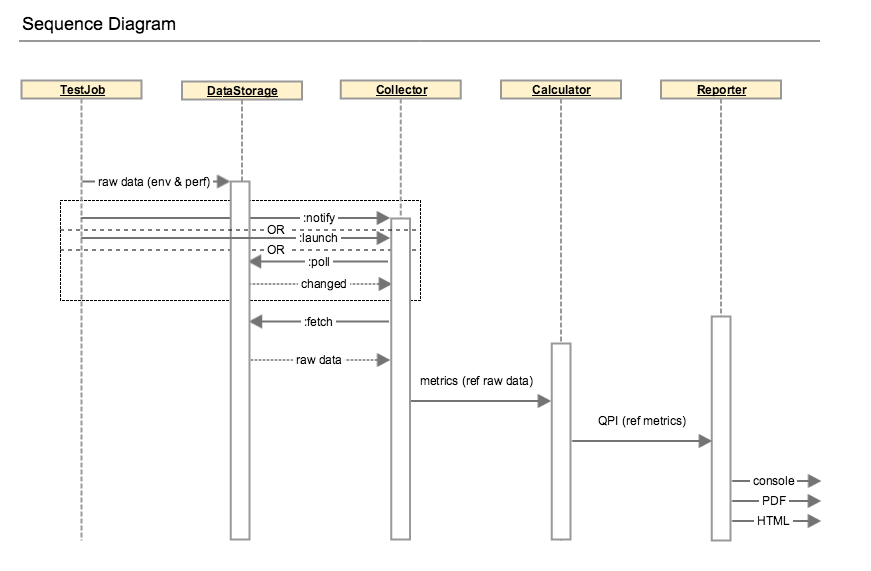
The execution can be detailed in the diagram below:
Framework
QTIP is built upon Ansible by extending modules, playbook roles and plugins.
Modules
QTIP creates dedicated modules to gather slave node list and information from installer master. See embedded document
in qtip/ansible_library/modules for details
Plugins
Stored in qtip/ansible_library/plugins
Action plugins
Several action plugins have been created for test data post processing
- collect - parse and collect metrics from raw test results like log files
- calculate - calculate score according to specification
- aggregate - aggregate calculated results from all hosts under test
Playbook roles
QTIP roles
- qtip - main qtip tasks
- qtip-common - common tasks required in QTIP
- qtip-workspace - generate a workspace for running benchmarks
qtip roles should be included with a specified action and output directory, e.g.:
- { role: inxi, output: "{{ qtip_results }}/sysinfo", tags: [run, inxi, sysinfo] }
testing roles
Testing roles are organized by testing tools
- inxi - system information tool
- nDPI
- openssl
- ramspeed
- unixbench
supporting roles
- opnfv-testapi - report result to testapi
Tags
Tags are used to categorize the test tasks from different aspects.
- stages like
run,collect,calculate,aggregate,report - test tools like
inxi,ndpiand etc - information or metrics like
sysinfo,dpi,ssl
Use
ansible-playbook run.yml --list-tagsto list all tagsansible-playbook run.yml --list-tasksto list all tasks
During development of post processing, you may skip run stage to save time, e.g.
ansible-playbook run.yml --tags collect,calculate,aggregate
CLI - Command Line Interface
QTIP consists of different tools(metrics) to benchmark the NFVI. These metrics fall under different NFVI subsystems(QPI’s) such as compute, storage and network. A plan consists of one or more QPI’s, depending upon how the end user would want to measure performance. CLI is designed to help the user, execute benchmarks and view respective scores.
Framework
QTIP CLI has been created using the Python package Click, Command Line Interface Creation Kit. It has been chosen for number of reasons. It presents the user with a very simple yet powerful API to build complex applications. One of the most striking features is command nesting.
As explained, QTIP consists of metrics, QPI’s and plans. CLI is designed to provide interface to all these components. It is responsible for execution, as well as provide listing and details of each individual element making up these components.
Design
CLI’s entry point extends Click’s built in MultiCommand class object. It provides two methods, which are overridden to provide custom configurations.
class QtipCli(click.MultiCommand):

    def list_commands(self, ctx):
        rv = []
        for filename in os.listdir(cmd_folder):
            if filename.endswith('.py') and \
                filename.startswith('cmd_'):
                rv.append(filename[4:-3])
        rv.sort()
        return rv

    def get_command(self, ctx, name):
        try:
            if sys.version_info[0] == 2:
                name = name.encode('ascii', 'replace')
            mod = __import__('qtip.cli.commands.cmd_' + name,
                             None, None, ['cli'])
        except ImportError:
            return
        return mod.cli
Commands and subcommands will then be loaded by the get_command method above.
Extending the Framework
Framework can be easily extended, as per the users requirements. One such example can be to override the builtin configurations with user defined ones. These can be written in a file, loaded via a Click Context and passed through to all the commands.
class Context:

    def __init__():

        self.config = ConfigParser.ConfigParser()
        self.config.read('path/to/configuration_file')

    def get_paths():

        paths = self.config.get('section', 'path')
        return paths
The above example loads configuration from user defined paths, which then need to be provided to the actual command definitions.
from qtip.cli.entry import Context

pass_context = click.make_pass_decorator(Context, ensure=False)

@cli.command('list', help='List the Plans')
@pass_context
def list(ctx):
    plans = Plan.list_all(ctx.paths())
    table = utils.table('Plans', plans)
    click.echo(table)
API - Application Programming Interface
QTIP consists of different tools(metrics) to benchmark the NFVI. These metrics fall under different NFVI subsystems(QPI’s) such as compute, storage and network. A plan consists of one or more QPI’s, depending upon how the end-user would want to measure performance. API is designed to expose a RESTful interface to the user for executing benchmarks and viewing respective scores.
Framework
QTIP API has been created using the Python package Connexion. It has been chosen for a number of reasons. It follows API First approach to create micro-services. Hence, firstly the API specifications are defined from the client side perspective, followed by the implementation of the micro-service. It decouples the business logic from routing and resource mapping making design and implementation cleaner.
It has two major components:
API Specifications
The API specification is defined in a yaml or json file. Connexion follows Open API specification to determine the design and maps the endpoints to methods in python.
- Micro-service Implementation
- Connexion maps the
operationIdcorresponding to every operation in API Specification to methods in python which handles request and responses.
As explained, QTIP consists of metrics, QPI’s and plans. The API is designed to provide a RESTful interface to all these components. It is responsible to provide listing and details of each individual element making up these components.
Design
Specification
API’s entry point (main) runs connexion App class object after adding API Specification
using App.add_api method. It loads specification from swagger.yaml file by specifying
specification_dir.
Connexion reads API’s endpoints(paths), operations, their request and response parameter
details and response definitions from the API specification i.e. swagger.yaml in this case.
Following example demonstrates specification for the resource plans.
paths:
  /plans/{name}:
    get:
      summary: Get a plan by plan name
      operationId: qtip.api.controllers.plan.get_plan
      tags:
        - Plan
        - Standalone
      parameters:
        - name: name
          in: path
          description: Plan name
          required: true
          type: string
      responses:
        200:
          description: Plan information
          schema:
            $ref: '#/definitions/Plan'
        404:
          description: Plan not found
          schema:
            $ref: '#/definitions/Error'
        501:
          description: Resource not implemented
          schema:
            $ref: '#/definitions/Error'
        default:
          description: Unexpected error
          schema:
            $ref: '#/definitions/Error'
definitions:
  Plan:
    type: object
    required:
      - name
    properties:
      name:
        type: string
      description:
        type: string
      info:
        type: object
      config:
        type: object
Every operationId in above operations corresponds to a method in controllers.
QTIP has three controller modules each for plan, QPI and metric. Connexion will
read these mappings and automatically route endpoints to business logic.
Swagger Editor can be explored to play with more such examples and to validate the specification.
Controllers
The request is handled through these methods and response is sent back to the client. Connexion takes care of data validation.
@common.check_endpoint_for_error(resource='Plan')
def get_plan(name):
    plan_spec = plan.Plan(name)
    return plan_spec.content
In above code get_plan takes a plan name and return its content.
The decorator check_endpoint_for_error defined in common is used to handle error
and return a suitable error response.
During Development the server can be run by passing specification file(swagger.yaml
in this case) to connexion cli -
connexion run <path_to_specification_file> -v
Extending the Framework
Modifying Existing API:
API can be modified by adding entries in
swagger.yamland adding the corresponding controller mapped fromoperationID.Adding endpoints:
New endpoints can be defined in
pathssection inswagger.yaml. To add a new resource dummy -paths: /dummies: get: summary: Get all dummies operationId: qtip.api.controllers.dummy.get_dummies tags: - dummy responses: 200: description: Foo information schema: $ref: '#/definitions/Dummy default: description: Unexpected error schema: $ref: '#/definitions/Error'And then model of the resource can be defined in the
definitionssection.definitions: Dummy: type: object required: - name properties: name: type: string description: type: string id: type: string
- Adding controller methods:
Methods for handling requests and responses for every operation for the endpoint added can be implemented in
controller.In
controllers.dummydef get_dummies(): all_dummies = [<code to get all dummies>] return all_dummies, httplib.OK- Adding error responses
Decorators for handling errors are defined in
common.pyinapi.from qtip.api import common @common.check_endpoint_for_error(resource='dummy',operation='get') def get_dummies() all_dummies = [<code to get all dummies>] return all_dummies
Adding new API:
API can easily be extended by adding more APIs to
Connexion.Appclass object usingadd_apiclass method.In
__main__def get_app(): app = connexion.App(__name__, specification_dir=swagger_dir) app.add_api('swagger.yaml', base_path='/v1.0', strict_validation=True) return appExtending it to add new APIs. The new API should have all endpoints mapped using
operationId.from qtip.api import __main__ my_app = __main__.get_app() my_app.add_api('new_api.yaml',base_path'api2',strict_validation=True) my_app.run(host="0.0.0.0", port=5000)
Web Portal for Benchmarking Services
QTIP consists of different tools(metrics) to benchmark the NFVI. These metrics fall under different NFVI subsystems(QPI’s) such as compute, storage and network. QTIP benchmarking tasks are built upon Ansible playbooks and roles. QTIP web portal is a platform to expose QTIP as a benchmarking service hosted on a central host.
Framework
The web travel has been developed on Python Django framework. Dig into the documentation to learn about Django.
Design
Django is a MTV (Model Template View) framework. Database objects are mapped to models in models.py. Views handle the
requests from client side and interact with database using Django ORM. Templates are responsible for
UI rendering based on response context from Views.
Models
Task
Tasks keep track of every benchmark run through QTIP-Web Services. Whenever you run a benchmark, a new task is created which keep track of time stats and log task progress and ansible output for the respective playbook.
Task
    start_time
    end_time
    status
    run_time
    repo
    log
Views
ReposView
- Base class - LoginRequiredMixin, CreateView
Class based view for listing and add new repos
RepoUpdate
- Base class - LoginRequiredMixin, UpdateView
Class based View for listing and updating an existing repo details.
Both ReposView and RepoUpdate View use same template ``repo_form.html``. The context has an extra variable ``template_role`` which is used to distinguish if repo form is for create or edit operation.
Run
- Base class - LoginRequiredMixin, View
- template name - run.html
Class based View for adding new task and run benchmark based on task details. The logs are saved
in logs/run_<log_id> directory.
Compute QPI
The compute QPI gives user an overall score for system compute performace.
Summary
The compute QPI are calibrated a ZTE E9000 server as a baseline with score of 2500 points. Higher scores are better, with double the score indicating double the performance. The compute QPI provides three different kinds of scores:
- Workload Scores
- Section Scores
- Compute QPI Scores
Baseline
ZTE E9000 server with an 2 Deca core Intel Xeon CPU processor,128560.0MB Memory.
Workload Scores
Each time a workload is executed QTIP calculates a score based on the computer’s performance compared to the baseline performance.
Section Scores
QTIP uses a number of different tests, or workloads, to measure performance. The workloads are divided into five different sections:
| Section | Detail | Indication |
|---|---|---|
| Arithmetic | Arithmetic workloads measure integer operations floating point operations and mathematical functions with whetstone and dhrystone instructions. | Software with heavy calculation tasks. |
| Memory | Memory workloads measure memory transfer performance with RamSpeed test. | Software working with large scale data operation. |
| DPI | DPI workloads measure deep-packet inspection speed by performing nDPI test. | Software working with network packet analysis relies on DPI performance. |
| SSL | SSL Performance workloads measure cipher speeds by using the OpenSSL tool. | Software working with cipher large amounts data relies on SSL Performance. |
A section score is the geometric mean of all the workload scores for workloads that are part of the section. These scores are useful for determining the performance of the computer in a particular area.
Compute QPI Scores
The compute QPI score is the weighted arithmetic mean of the five section scores. The compute QPI score provides a way to quickly compare performance across different computers and different platforms without getting bogged down in details.
Storage QPI
The storage QPI gives user an overall score for storage performance.
The measurement is done by StorPerf.
System Information
System Information are environmental parameters and factors may affect storage performance:
| System Factors | Detail | Extraction Method |
| Ceph Node List | List of nodes which has ceph-osd roles. For example [node-2, node-3, node-4]. | Getting from return result of installer node list CLI command. |
| Ceph Client RDB Cache Mode | Values: “None”, “write-through”, “write-back”. | Getting from value of “rbd cache” and “rbd cache max dirty” keys in client section of ceph configuration; To enable write-through mode, set rbd cache max dirty to 0. |
| Ceph Client RDB Cache Size | The RBD cache size in bytes. Default is 32 MiB. | Getting from value of “rdb cache size” key in client section of ceph configuration. |
| Ceph OSD Tier Cache Mode | Values: “None”, “Write-back”, “Readonly”. | Getting from ceph CLI “ceph report” output info. |
| Use SSD Backed OSD Cache | Values: “Yes”, “No”. | Getting from POD description and CEPH CLI “ceph-disk list” output info. |
| Use SSD For Journal | Values: “Yes”, “No”. | Getting from POD description and CEPH CLI “ceph-disk list” output info. |
| Ceph Cluster Network Bandwidth | Values: “1G”, “10G”, “40G”. | Getting from physical interface information in POD description, “ifconfig” output info on ceph osd node, and value of “cluster network” key in global section of ceph configuration. |
Test Condition
| Test Condition | Detail | Extraction Method |
| Number of Testing VMs | Number of VMs which are created, during running Storperf test case. | It equals the number of Cinder nodes of the SUT. |
| Distribution of Testing VMS | Number of VMs on each computer node, for example [(node-2: 1), (node-3: 2))]. | Recording the distribution when runing Storperf test case. |
Baseline
Baseline is established by testing with a set of work loads:
- Queue depth (1, 2, 8)
- Block size (2KB, 8KB, 16KB)
- Read write - sequential read - sequential write - random read - random write - random mixed read write 70/30
Metrics
- Throughput: data transfer rate
- IOPS: I/O operations per second
- Latency: response time
Workload Scores
For each test run, if an equivalent work load in baseline is available, a score will be calculated by comparing the result to baseline.
Section Scores
| Section | Detail | Indication |
|---|---|---|
| IOPS | Read write I/O Operation per second under steady state Workloads : random read/write | Important for frequent storage access such as event sinks |
| Throughput | Read write data transfer rate under steady state Workloads: sequential read/write, block size 16KB | Important for high throughput services such as video server |
| Latency | Average response latency under steady state Workloads: all | Important for real time applications |
Section score is the geometric mean of all workload score.
Storage QPI
Storage QPI is the weighted arithmetic mean of all section scores.