Calipso.io
Product Description and Value
Copyright (c) 2017 Koren Lev (Cisco Systems), Yaron Yogev (Cisco Systems) and others
All rights reserved. This program and the accompanying materials
are made available under the terms of the Apache License, Version 2.0
which accompanies this distribution, and is available at
http://www.apache.org/licenses/LICENSE-2.0

Virtual and Physical networking low level details and inter-connections,
dependencies in OpenStack, Docker or Kubernetes environments are
currently invisible and abstracted, by design, so data is not exposed
through any API or UI.
During virtual networking failures, troubleshooting takes substantial
amount of time due to manual discovery and analysis.
Maintenance work needs to happen in the data center, virtual and
physical networking (controlled or not) are impacted.
Most of the times, the impact of any of the above scenarios is
catastrophic.
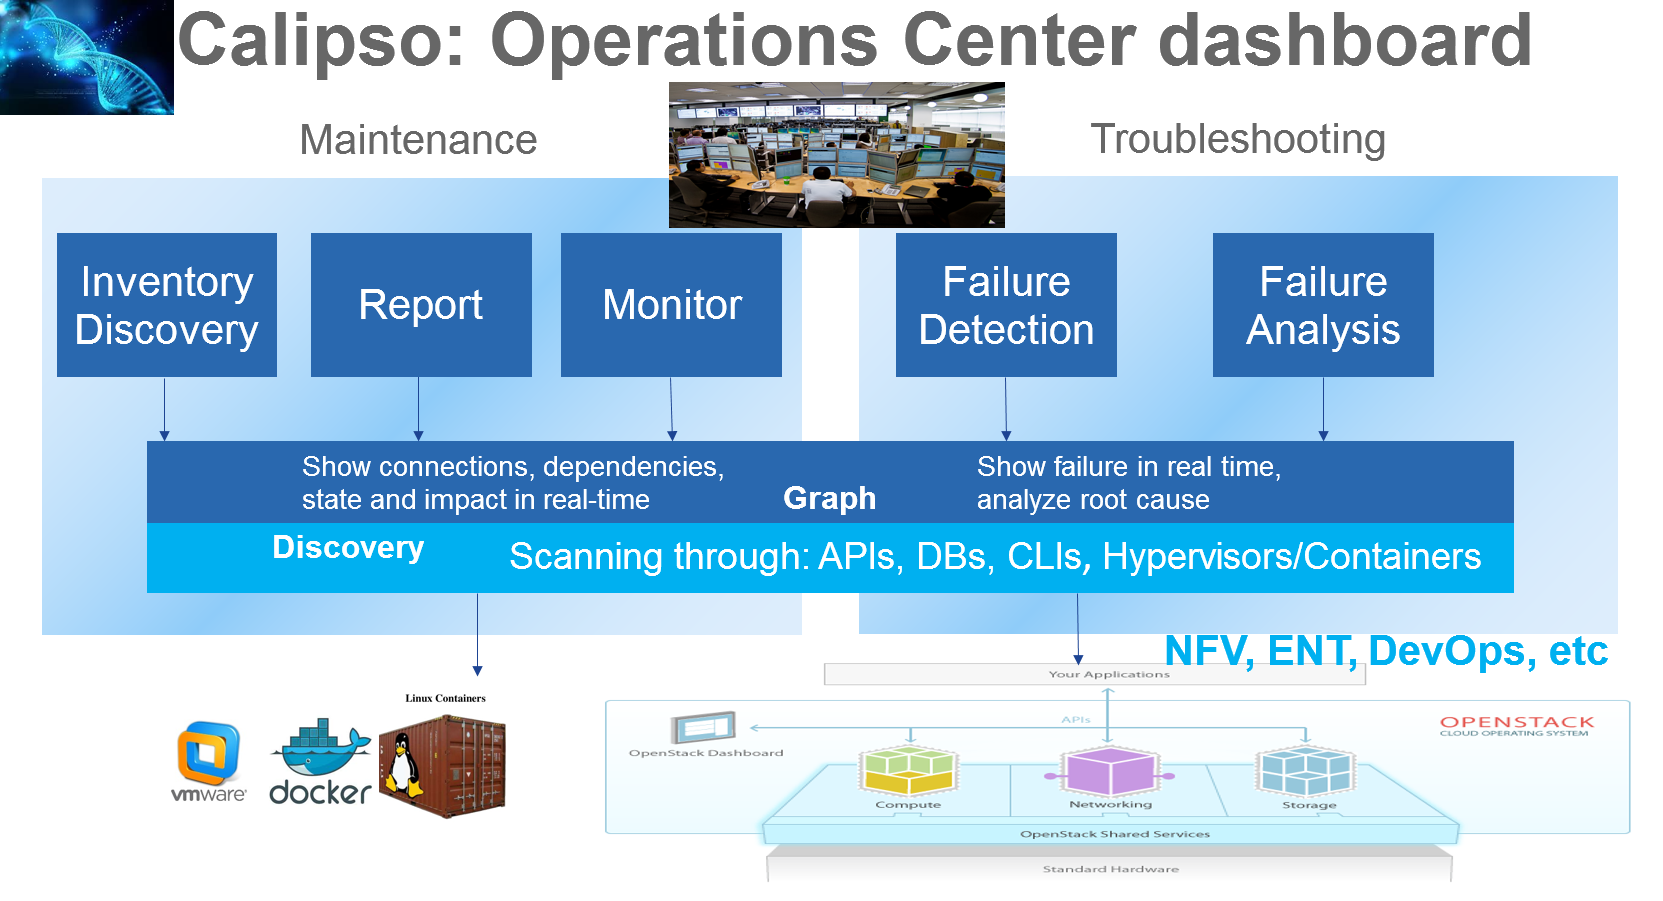
Project “Calipso” tries to illuminate complex virtual networking with
real time operational state visibility for large and highly distributed
Virtual Infrastructure Management (VIM).
Customer needs during maintenance:
Visualize the networking topology, easily pinpointing the location
needed for maintenance and show the impact of maintenance work needed in
that location.
Administrator can plan ahead easily and report up his command chain the
detailed impact – Calipso substantially lower the admin time and
overhead needed for that reporting.
Customer need during troubleshooting:
Visualize and pinpointing the exact location of the failure in the
networking chain, using a suspected ‘focal point’ (ex: a VM that cannot
communicate).
Monitor the networking location and alerting till the problem is
resolved. Calipso also covers pinpointing the root cause.
Calipso is for multiple distributions/plugins and many virtual
environment variances:
We built a fully tested unified model to deal with many variances.
Supporting in initial release: VPP, OVS, LXB with all type drivers
possible, onto 5 different OS distributions, totaling to more than 60
variances (see Calipso-model guide).
New classes per object, link and topology can be programmed (see
development guide).
Detailed Monitoring:
Calipso provides visible insights using smart discovery and virtual
topological representation in graphs, with monitoring per object in the
graph inventory to reduce error vectors and troubleshooting, maintenance
cycles for VIM operators and administrators.
We believe that Stability is driven by accurate Visibility.
Table of Contents
Calipso.io Product Description and Value 1
1 About 4
1.1 Project Description 4
2 Main modules 5
2.1 High level module descriptions 5
2.2 High level functionality 5
3 Customer Requirements 6
3.1 Releases and Distributions 7
About
Project Description
Calipso interfaces with the virtual infrastructure (like OpenStack)
through API, DB and CLI adapters, discovers the specific
distribution/plugins in-use, their versions and based on that collects
detailed data regarding running objects in the underlying workers and
processes running on the different hosts. Calipso analyzes the inventory
for inter-relationships and keeps them in a common and highly adaptive
data model.
Calipso then represents the inter-connections as real-time topologies
using automatic updates per changes in VIM, monitors the related objects
and analyzes the data for impact and root-cause analysis.
This is done with the objective to lower and potentially eliminate
complexity and lack of visibility from the VIM layers as well as to
offer a common and coherent representation of all physical and virtual
network components used under the VIM, all exposed through an API.
Calipso is developed to work with different OpenStack flavors, plugins
and installers.
Calipso is developed to save network admins discovery and
troubleshooting cycles of the networking aspects. Calipso helps estimate
the impact of several micro failure in the infrastructure to allow
appropriate resolutions.
Calipso focuses on scenarios, which requires VIM/OpenStack maintenance
and troubleshooting enhancements using operations dashboards i.e.
connectivity, topology and related stats – as well as their correlation.
Main modules
High level module descriptions
Calipso modules included with initial release:
- Scanning: detailed inventory discovery and inter-connection
analysis, smart/logical and automated learning from the VIM, based on
specific environment version/type etc.
- Listening: Attach to VIM message BUS and update changes in real
time.
- Visualization: represent the result of the discovery in browsable
graph topology and tree.
- Monitoring: Health and status for all discovered objects and
inter-connections: use the discovered data to configure monitoring
agents and gather monitoring results.
- Analysis: some traffic analysis, impact and root-cause analysis for
troubleshooting.
- API: allow integration with Calipso application’s inventory and
monitoring results.
- Database: Mongo based
- LDAP: pre-built integration for smooth attachment to corporate
directories.
For Monitoring we are planning to utilize the work done by ‘Sensu’ and
‘Barometer’.
The project also develops required enhancements to individual components
in OpenStack like Neutron, Telemetry API and the different OpenStack
monitoring agents in order to provide a baseline for “Operations APIs”.
High level functionality
Scanning:
Calipso uses API, Database and Command-Line adapters for interfacing
with the Cloud infrastructure to logically discover every networking
component and it’s relationships with others, building a smart topology
and inventory.
Automated setup:
Calipso uses Sensu framework for Monitoring. It automatically deploys
and configures the necessary configuration files on all hosts, writes
customized checks and handlers to setup monitoring per inventory object.
Modeled analysis:
Calipso uses a unique logical model to help facilitate the topology
discovery, analysis of inter-connections and dependencies. Impact
Analysis is embedded, other types of analysis is possible through a
plugin framework.
Visualization:
Using its unique dependency model calipso visualize topological
inventory and monitoring results, in a highly customizable and modeled
UI framework
Monitoring:
After collecting the data, from processes and workers provisioned by the
cloud management systems, calipso dynamically checks for health and
availability, as a baseline for SLA monitoring.
Reporting:
Calipso allows networking administrators to operate, plan for
maintenance or troubleshooting and provides an easy to use hierarchical
representation of all the virtual networking components.
Customer Requirements
We identified an operational challenge: lack of visibility that leads to
limited stability.
The lack of operational tooling coupled with the reality of deployment
tools really needs to get solved to decrease the complexity as well as
assist not only deploying but also supporting OpenStack and other cloud
stacks.
Calispo integrates well with installers like Apex to offer enhanced day
2 operations.
Releases and Distributions
Calipso is distributed for enterprises - ‘S’ release, through
calipso.io, and for service providers - ‘P’ release, through OPNFV.
Calipso.io
Administration Guide
Copyright (c) 2017 Koren Lev (Cisco Systems), Yaron Yogev (Cisco Systems) and others
All rights reserved. This program and the accompanying materials
are made available under the terms of the Apache License, Version 2.0
which accompanies this distribution, and is available at
http://www.apache.org/licenses/LICENSE-2.0
Project “Calipso” tries to illuminate complex virtual networking with
real time operational state visibility for large and highly distributed
Virtual Infrastructure Management (VIM).
Calipso provides visible insights using smart discovery and virtual
topological representation in graphs, with monitoring per object in the
graph inventory to reduce error vectors and troubleshooting, maintenance
cycles for VIM operators and administrators.
Calipso model, described in this document, was built for
multi-environment and many VIM variances, the model was tested
successfully (as of Aug 27th) against 60 different VIM
variances (Distributions, Versions, Networking Drivers and Types).
Table of Contents
Calipso.io Administration Guide 1
1 Environments config 3
2 UI overview 5
2.1 User management 7
2.2 Logging in and out 8
2.3 Messaging check 9
2.4 Adding a new environment 9
3 Preparing an environment for scanning 10
3.1 Where to deploy Calipso application 10
3.2 Environment setup 10
3.3 Filling the environment config data 11
3.4 Testing the connections 11
4 Links and Cliques 12
4.1 Adding environment clique_types 13
5 Environment scanning 14
5.1 UI scanning request 14
5.2 UI scan schedule request 16
5.3 API scanning request 17
5.4 CLI scanning in the calipso-scan container 18
5.4.1 Clique Scanning 19
5.4.2 Viewing results 20
6 Editing or deleting environments 20
7 Event-based scanning 21
7.1 Enabling event-based scanning 21
7.2 Event-based handling details 22
8 ACI scanning 34
9 Monitoring enablement 36
10 Modules data flows 38
Environments config
Environment is defined as a certain type of Virtual Infrastructure
facility the runs under a single unified Management (like an
OpenStack facility).
Everything in Calipso application rely on environments config, this
is maintained in the “environments_config” collection in the
mongo Calipso DB.
Environment configs are pushed down to Calipso DB either through UI
or API (and only in OPNFV case Calipso provides an automated program
to build all needed environments_config parameters for an ‘Apex’
distribution automatically).
When scanning and discovering items Calipso uses this configuration
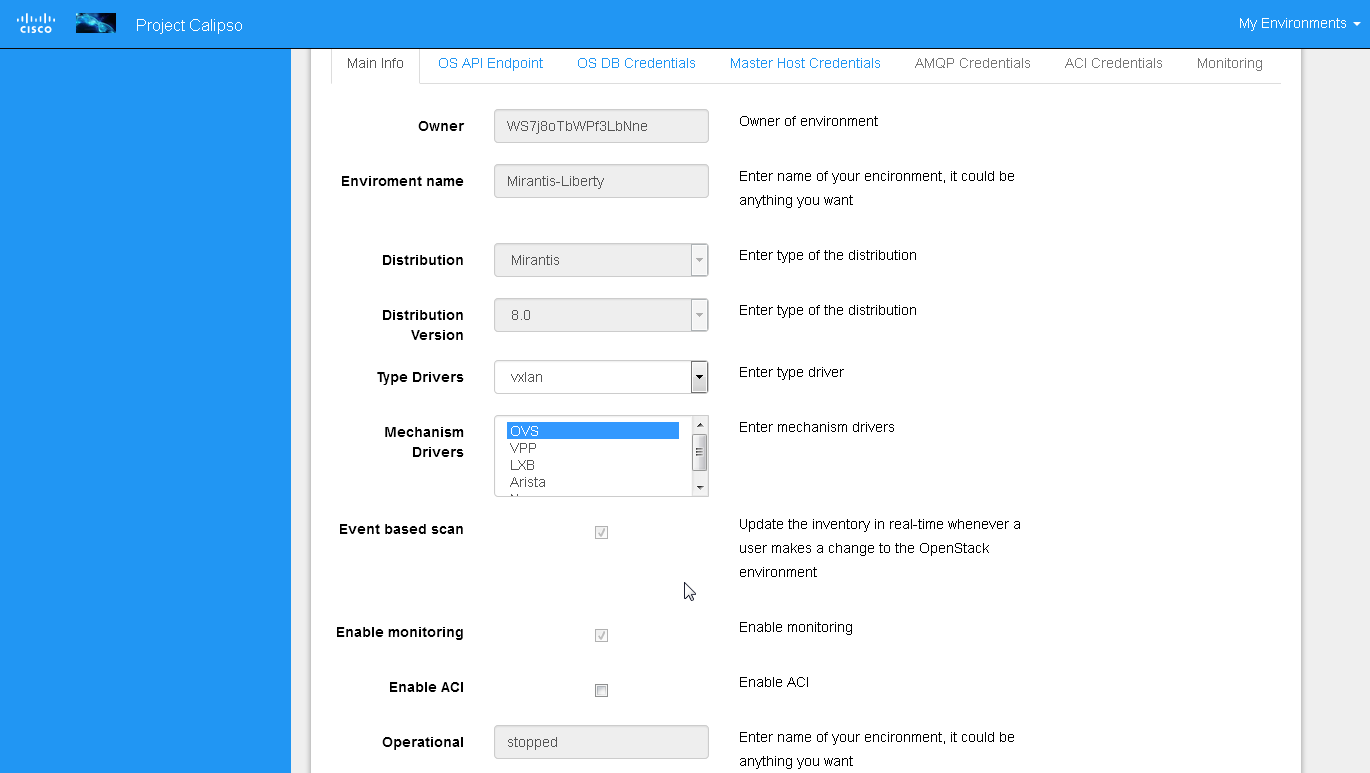
document for successful scanning results, here is an example of an
environment config document:
**{ **
**“name”: “DEMO-ENVIRONMENT-SCHEME”, **
**“enable_monitoring”: true, **
**“last_scanned”: “filled-by-scanning”, **
**“app_path”: “/home/scan/calipso_prod/app”, **
**“type”: “environment”, **
**“distribution”: “Mirantis”, **
**“distribution_version”: “8.0”, **
**“mechanism_drivers”: [“OVS”], **
“type_drivers”: “vxlan”
**“operational”: “stopped”, **
**“listen”: true, **
**“scanned”: false, **
“configuration”: [
{
**“name”: “OpenStack”, **
**“port”:”5000”, **
**“user”: “adminuser”, **
**“pwd”: “dummy_pwd”, **
**“host”: “10.0.0.1”, **
“admin_token”: “dummy_token”
**}, **
{
**“name”: “mysql”, **
**“pwd”: “dummy_pwd”, **
**“host”: “10.0.0.1”, **
**“port”: “3307”, **
“user”: “mysqluser”
**}, **
{
**“name”: “CLI”, **
**“user”: “sshuser”, **
**“host”: “10.0.0.1”, **
“pwd”: “dummy_pwd”
**}, **
{
**“name”: “AMQP”, **
**“pwd”: “dummy_pwd”, **
**“host”: “10.0.0.1”, **
**“port”: “5673”, **
“user”: “rabbitmquser”
**}, **
{
**“name”: “Monitoring”, **
**“ssh_user”: “root”, **
**“server_ip”: “10.0.0.1”, **
**“ssh_password”: “dummy_pwd”, **
**“rabbitmq_pass”: “dummy_pwd”, **
**“rabbitmq_user”: “sensu”, **
**“rabbitmq_port”: “5671”, **
**“provision”: “None”, **
**“env_type”: “production”, **
**“ssh_port”: “20022”, **
**“config_folder”: “/local_dir/sensu_config”, **
**“server_name”: “sensu_server”, **
**“type”: “Sensu”, **
“api_port”: NumberInt(4567)
**}, **
{
**“name”: “ACI”, **
**“user”: “admin”, **
**“host”: “10.1.1.104”, **
“pwd”: “dummy_pwd”
}
**], **
**“user”: “wNLeBJxNDyw8G7Ssg”, **
“auth”: {
“view-env”: [
“wNLeBJxNDyw8G7Ssg”
**], **
“edit-env”: [
“wNLeBJxNDyw8G7Ssg”
]
**}, **
}
Here is a brief explanation of the purpose of major keys in this
environment configuration doc:
Distribution: captures type of VIM, used for scanning of
objects, links and cliques.
Distribution_version: captures version of VIM distribution,
used for scanning of objects, links and cliques.
Mechanism_driver: captures virtual switch type used by the VIM,
used for scanning of objects, links and cliques.
Type_driver: captures virtual switch tunneling type used by the
switch, used for scanning of objects, links and cliques.
Listen: defines whether or not to use Calipso listener against
the VIM BUS for updating inventory in real-time from VIM events.
Scanned: defines whether or not Calipso ran a full and a
successful scan against this environment.
Last_scanned: end time of last scan.
Operational: defines whether or not VIM environment endpoints
are up and running.
Enable_monitoring: defines whether or not Calipso should deploy
monitoring of the inventory objects running inside all environment
hosts.
Configuration-OpenStack: defines credentials for OpenStack API
endpoints access.
Configuration-mysql: defines credentials for OpenStack DB
access.
Configuration-CLI: defines credentials for servers CLI access.
Configuration-AMQP: defines credentials for OpenStack BUS
access.
Configuration-Monitoring: defines credentials and setup for
Calipso sensu server (see monitoring-guide for details).
Configuration-ACI: defines credentials for ACI switched
management API, if exists.
User and auth: used for UI authorizations to view and edit this
environment.
App-path: defines the root directory of the scanning
application.
* This guide will help you understand how-to add new environment
through the provided Calispo UI module and then how-to use this
environment (and potentially many others) for scanning and real-time
inventories collection.
UI overview
Cloud administrator can use the Calipso UI for he’s daily tasks.
Once Calipso containers are running (see quickstart-guide) the UI
will be available at:
http://server-ip:80 , default login credentials: admin/123456.
Before logging in, while at the main landing page, a generic
information is provided.
Post login, at the main dashboard you can click on “Get started” and
view a short guide for using some of the basic UI functions,
available at:
server-ip/getstarted.
The main areas of interest are shown in the following screenshot:
Main areas on UI:
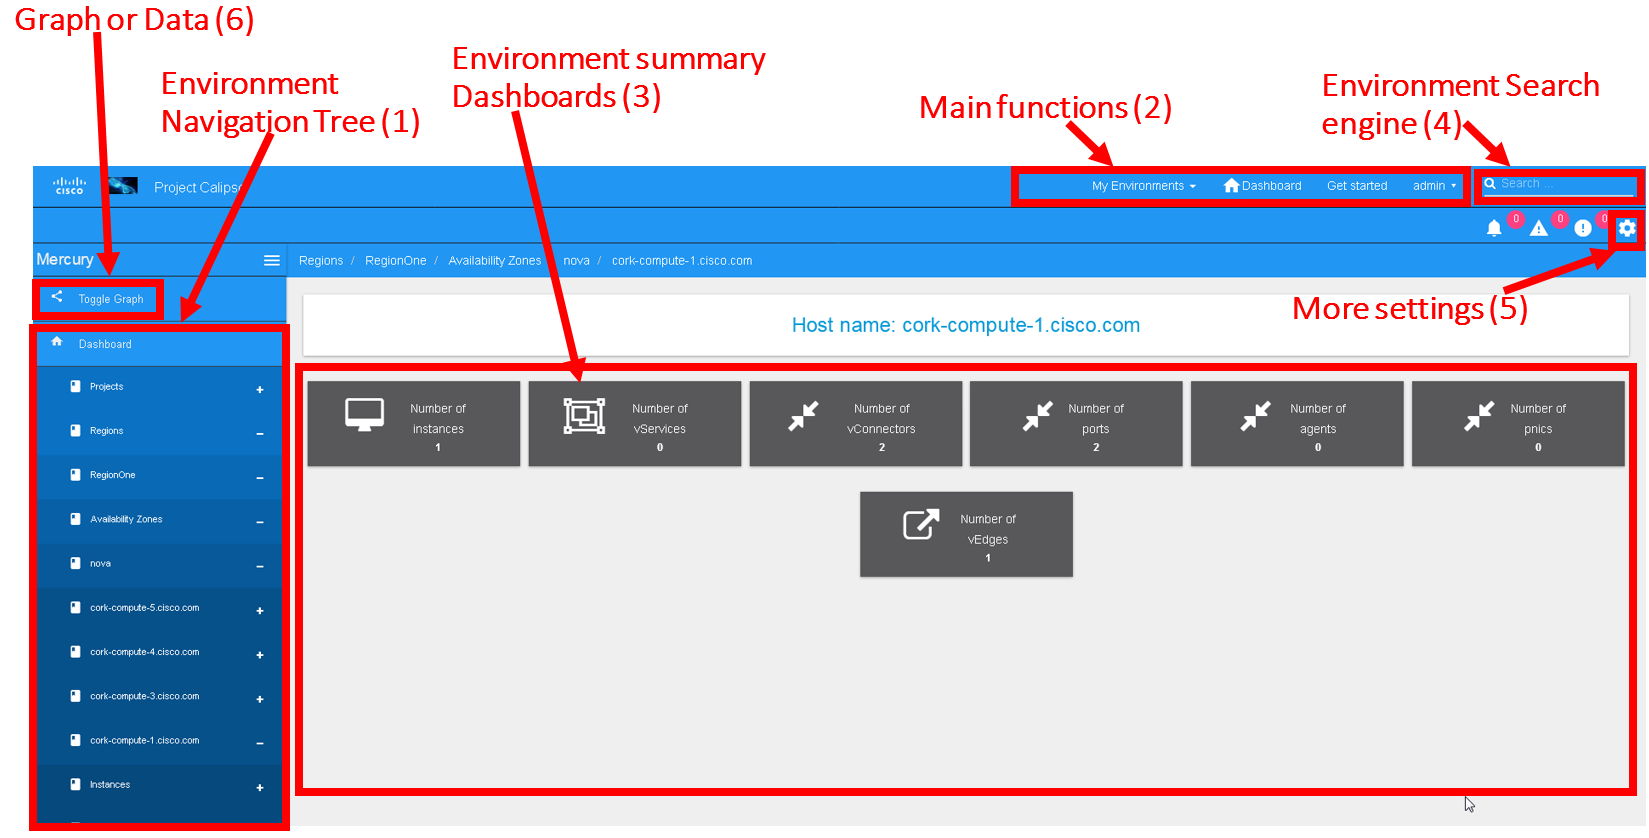
Main areas details:
Navigation Tree(1): Hierarchy searching through the inventory
using objects and parents details, to lookup a focal point of
interest for graphing or data gathering.
Main functions (2): Jumping between highest level dashboard (all
environments), specific environment and some generic help is
provided in this area.
Environment Summary (3): The central area where the data is
exposed, either through graph or through widget-attribute-listing.
Search engine (4): Finding interesting focal points faster
through basic object naming lookups, then clicking on results to get
transferred directly to that specific object dashboard. Searches are
conducted across all environments.
More settings (5): In this area the main collections of data are
exposed, like scans, schedules, messaging, clique_types,
link_types and others.
Graph or Data toggle (6): When focusing on a certain focal
point, this button allows changing from a graph-view to simple
data-view per request, if no graph is available for a certain object
the data-view is used by default, if information is missing try this
button first to make sure the correct view is chosen.
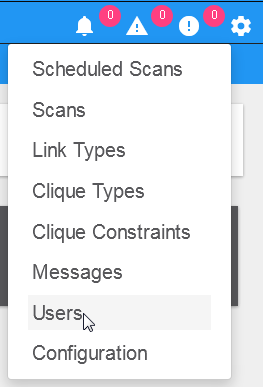
User management
The first place an administrator might use is the user’s
configurations, this is where a basic RBAC is provided for
authorizing access to the UI functions. Use the ‘settings’ button
and choose ‘users’ to access:
Editing the admin user password is allowed here:
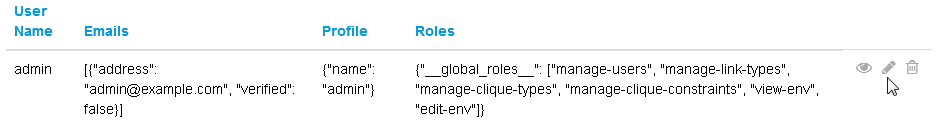
Note:
The ‘admin’ user is allowed all functions on all environments, you
shouldn’t change this behavior and you should never delete this
user, or you’ll need re-install Calipso.
Adding new user is provided when clicking the “Create new user”
option:
Creating a new user:
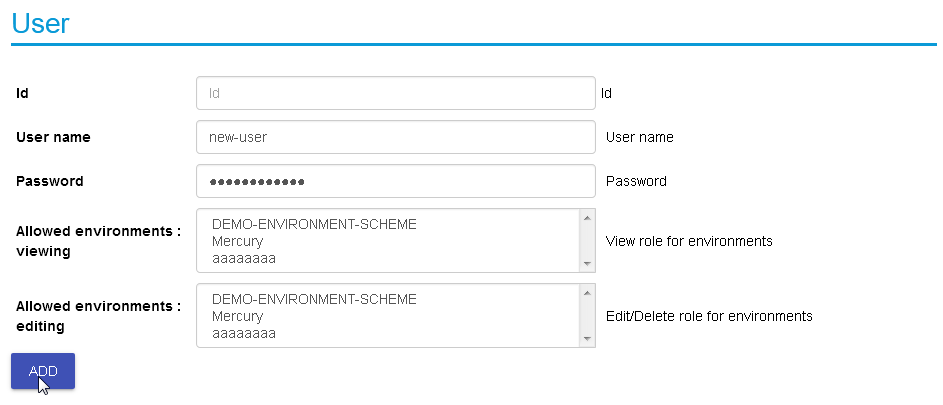
Before environments are configured there is not a lot of options
here, once environments are defined (one or more), users can be
allowed to edit or view-only those environments.
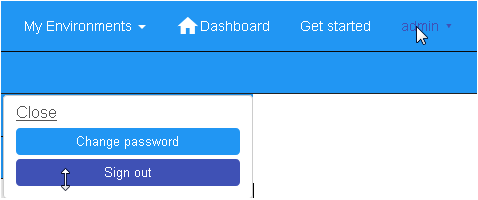
Logging in and out
To logout and re-login with different user credentials you can click
the username option and choose to sign out:
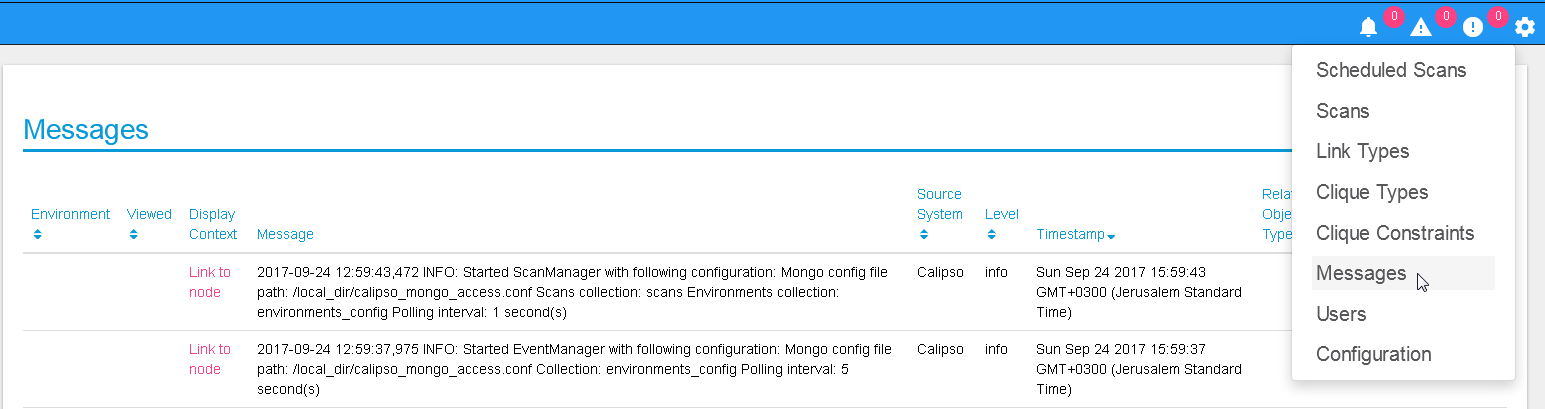
Messaging check
When calispo-scan and calipso-listen containers are running, they
provide basic messages on their processes status, this should be
exposed thorough the messaging system up to the UI, to validate this
choose ‘messages’ from the settings button:
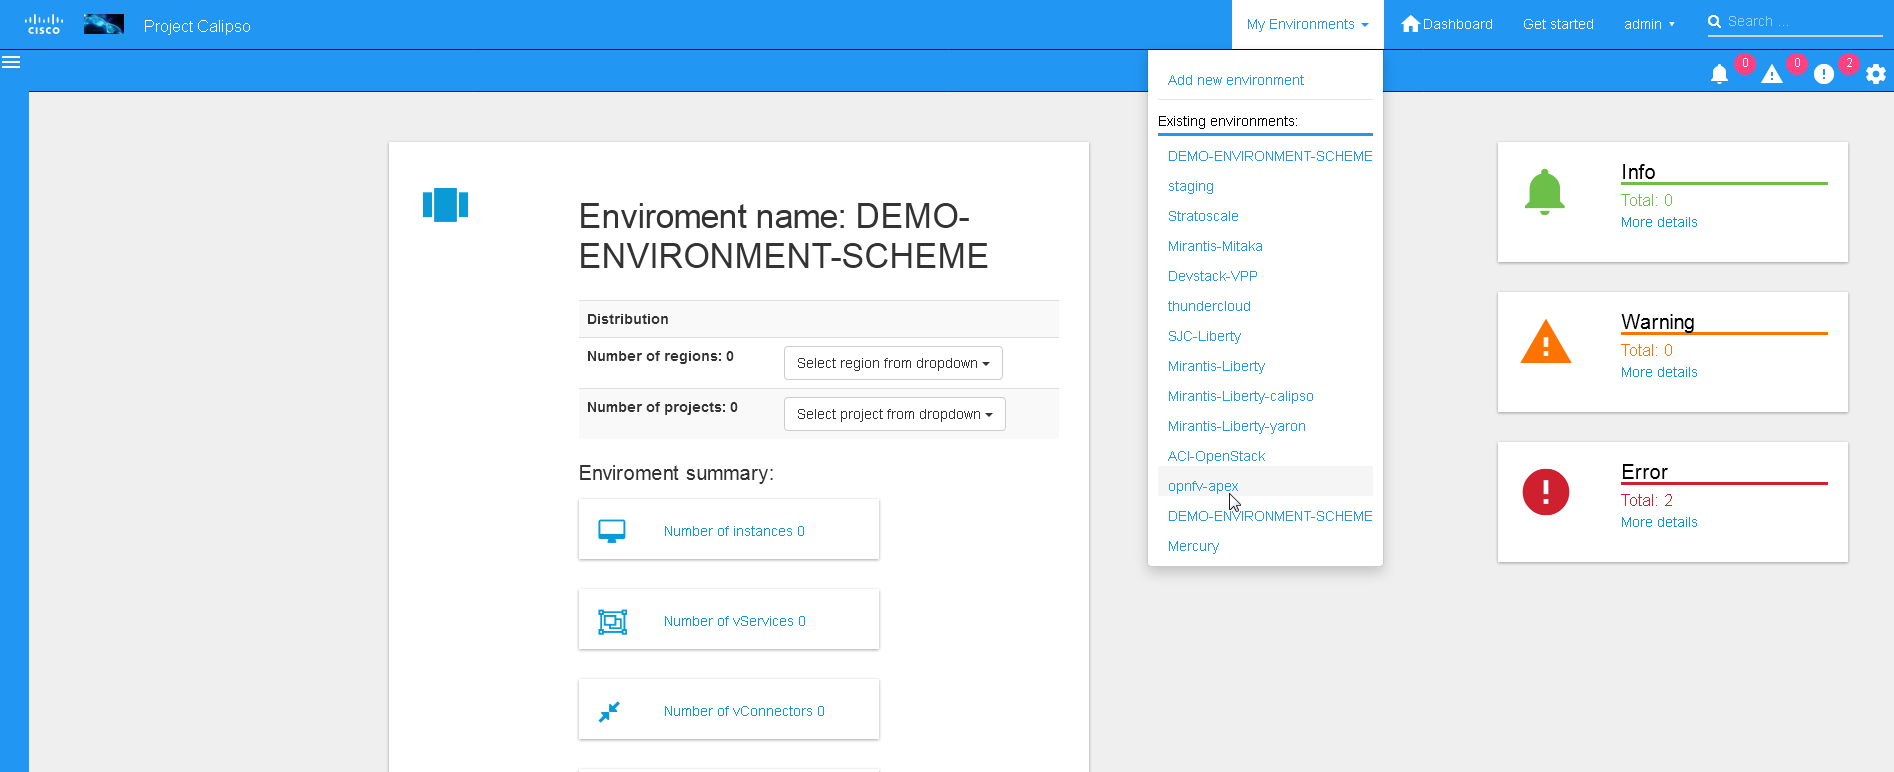
Adding a new environment
As explained above, environment configuration is the pre requisite
for any Calipso data gathering, goto “My Environments” -> and “Add
new Environment” to start building the environment configuration
scheme:
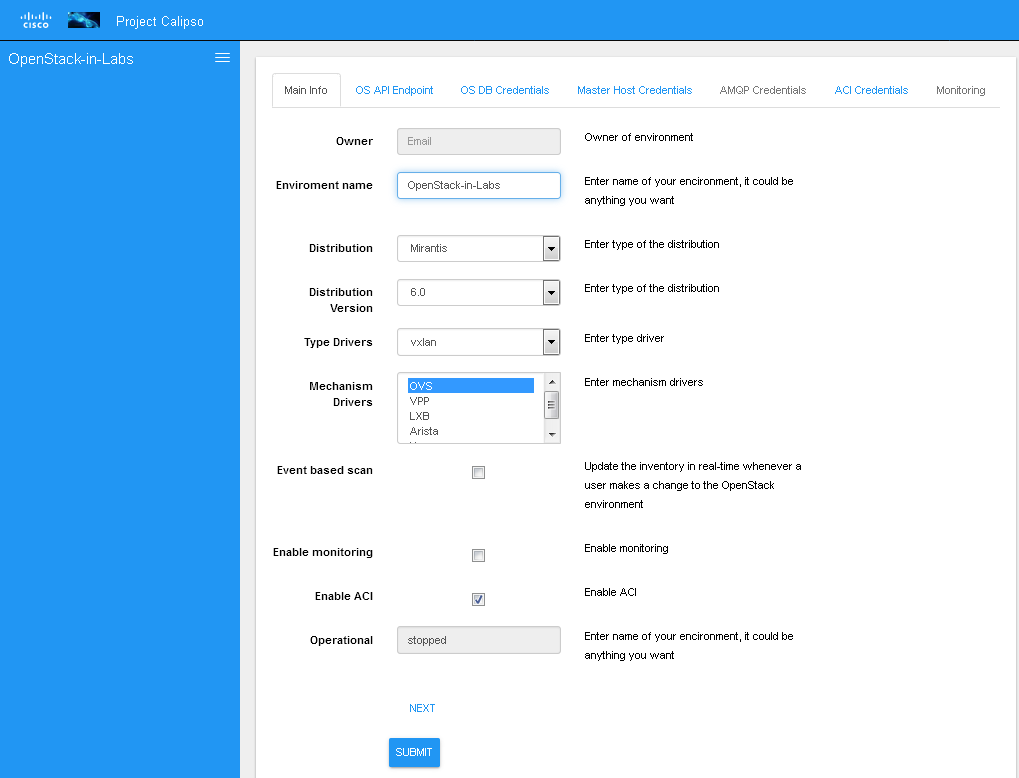
Note: this is automated with OPNFV apex distro, where Calipso
auto-discovers all credentials
Preparing an environment for scanning
Some preparation is needed for allowing Calipso to successfully
gather data from the underlying systems running in the virtual
infrastructure environment. This chapter explain the basic
requirements and provide recommendations.
Where to deploy Calipso application
Calipso application replaces the manual discovery steps typically
done by the administrator on every maintenance and troubleshooting
cycles, It needs to have the administrators privileges and is most
accurate when placed on one of the controllers or a“jump server”
deployed as part of the cloud virtual infrastructure, Calipso calls
this server a “Master host”.
Consider Calipso as yet another cloud infrastructure module, similar
to neutron, nova.
Per supported distributions we recommend installing the Calipso
application at:
- Mirantis: on the ‘Fuel’ or ‘MCP’ server.
- RDO/Packstack: where the ansible playbooks are deployed.
- Canonical/Ubuntu: on the juju server.
- Triple-O/Apex: on the jump host server.
Environment setup
The following steps should be taken to enable Calispo’s scanner and
listener to connect to the environment controllers and compute
hosts:
OpenStack API endpoints : Remote access user accessible from the
master host with the required credentials and allows typical ports:
5000, 35357, 8777, 8773, 8774, 8775, 9696
OpenStack DB (MariaDB or MySQL): Remote access user accessible from
the master host to ports 3306 or 3307 allowed access to all Databases
as read-only.
Master host SSH access: Remote access user with sudo privileges
accessible from the master host through either user/pass or rsa keys,
the master host itself should then be allowed access using rsa-keys
(password-less) to all other infrastructure hosts, all allowing to
run sudo CLI commands over tty, when commands entered from the master
host source itself.
AMQP message BUS (like Rabbitmq): allowed remote access from the
master host to listen for all events generated using a guest account
with a password.
Physical switch controller (like ACI): admin user/pass accessed from
master host.
Note: The current lack of operational toolsets like Calipso forces
the use of the above scanning methods, the purpose of Calipso is to
deploy its scanning engine as an agent on all environment hosts, in
such scenario the requirements above might be deprecated and the
scanning itself can be made more efficient.
Filling the environment config data
As explained in chapter 1 above, environment configuration is the
pre requisite and all data required is modeled as described. See
api-guide for details on submitting those details through calispo
api module. When using the UI module, follow the sections tabs and
fill the needed data per help messages and the explanations in
chapter 1.
Only the AMQP, Monitoring and ACI sections in environment_config
documents are optional, per the requirements detailed below on this
guide.
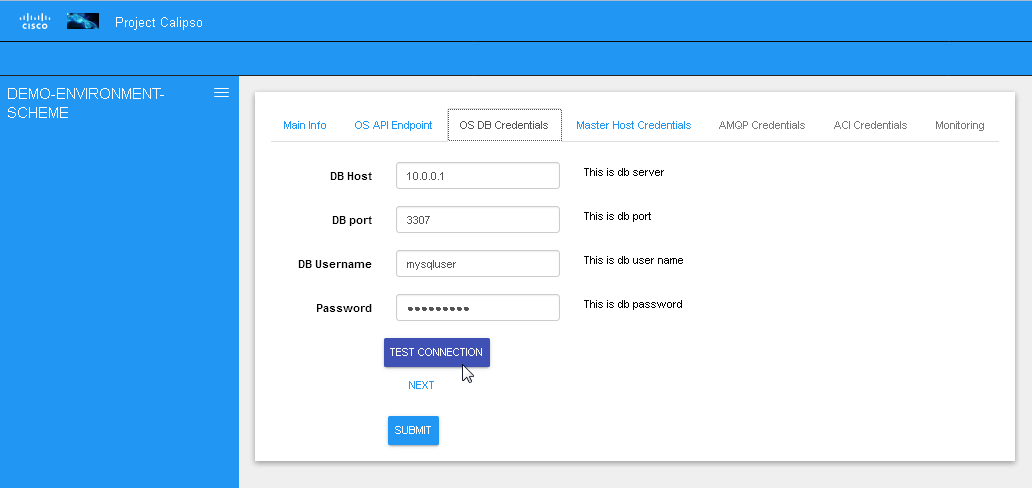
Testing the connections
Before submitting the environment_config document it is wise to
test the connections. Each section tab in the environment
configuration has an optional butting for testing the connection
tagged “test connection”. When this button is clicked, a check is
made to make sure all needed data is entered correctly, then a
request is sent down to mongoDB to the “connection_tests”
collection. Then the calispo scanning module will make the required
test and will push back a response message alerting whether or not
this connection is possible with the provided details and
credentials.
Test connection per configuration section:
With the above tool, the administrator can be assured that Calipso
scanning will be successful and the results will be an accurate
representation of the state of he’s live environment.
Links and Cliques
A very powerful capability in Calipso allows it to be very adaptive
and support many variances of VIM environments, this capability lies
in its objects, links and cliques models enabling the scanning of
data and analysis of inter-connections and creation of many types of
topology graphs..
Please refer to calipso-model document for more details.
The UI allows viewing and editing of Link types and Clique types
through the settings options:
Link types:
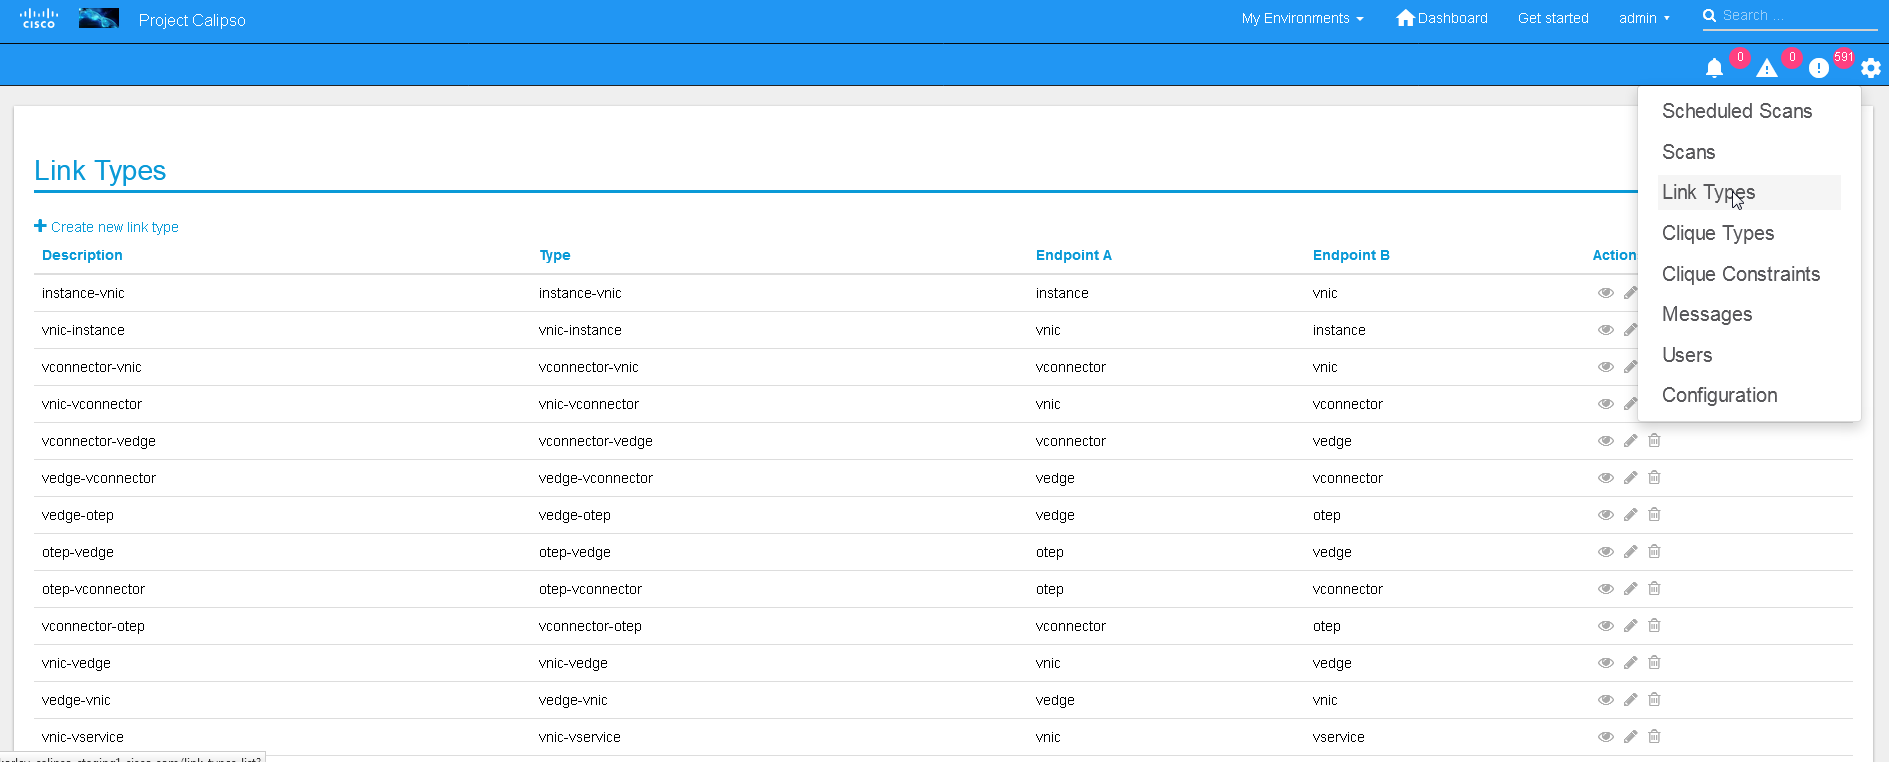
Note:
We currently recommend not to add nor edit the Link types pre-built
in Calipso’s latest release (allowed only for the ‘admin’ user), as
it is tested and proven to support more than 60 popular VIM
variances.
An administrator might choose to define several environment specific
Clique types for creating favorite graphs using the focal_point
objects and link_types lists already built-in:
Adding environment clique_types
Use either the API or the UI to define specific environment
clique_types.
For adding clique_types, use settings menu and choose “Create new
clique type” option, then provide a specific environment name (per
previous environment configurations), define a focal_point (like:
instance, or other object types) and a list of resulted link_types
to include in the final topology graph. Refer to calipso-model
document for more details.
Clique_types are needed for accurate graph buildup, before sending
a scan request.
Several defaults are provided with each new Calipso release.
Clique types:
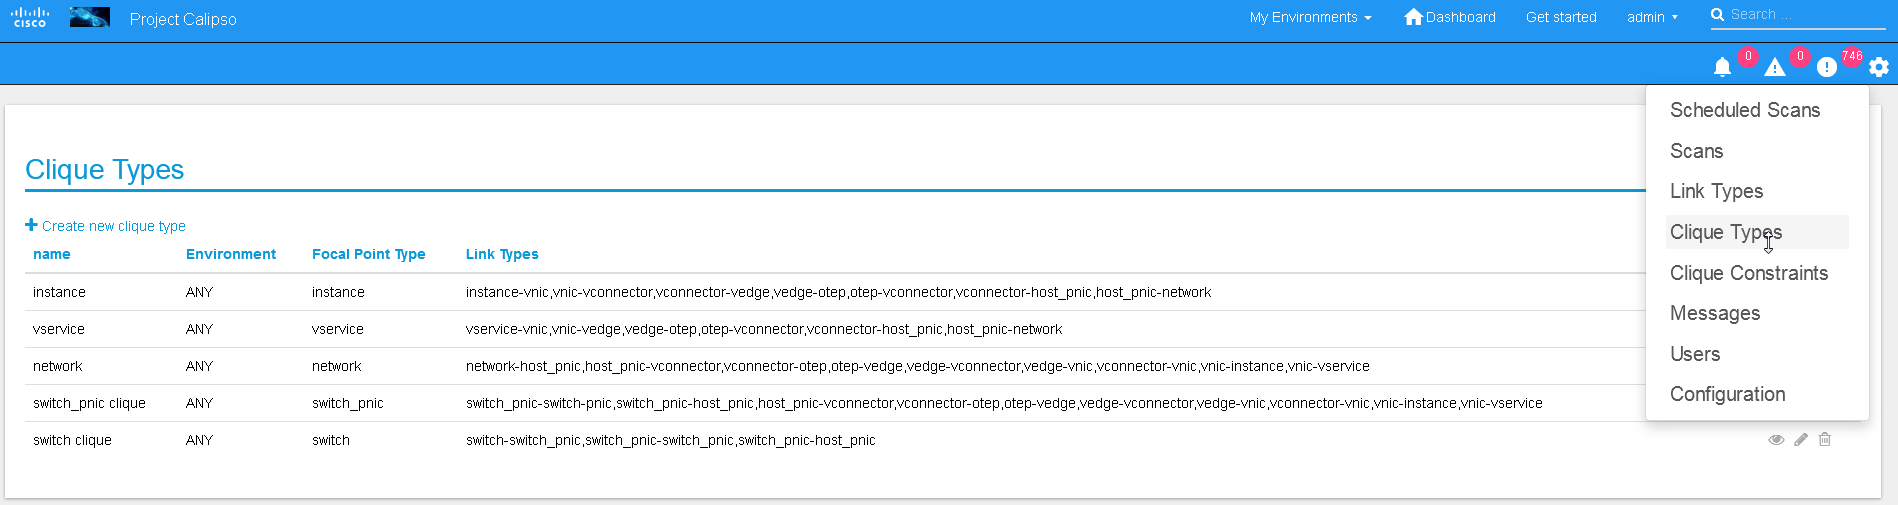
Note: ask calipso developers for recommended clique_types
(pre-built in several Calipso deployments), per distribution
variance, fully tested by Calipso developers:
Environment scanning
Once environment is setup correctly, environment_config data is
filled and tested, scanning can start. This is can be done with the
following four options:
UI scanning request
UI scan schedule request
API scanning or scheduling request.
CLI scanning in the calipso-scan container.
The following sections with describe those scanning options.
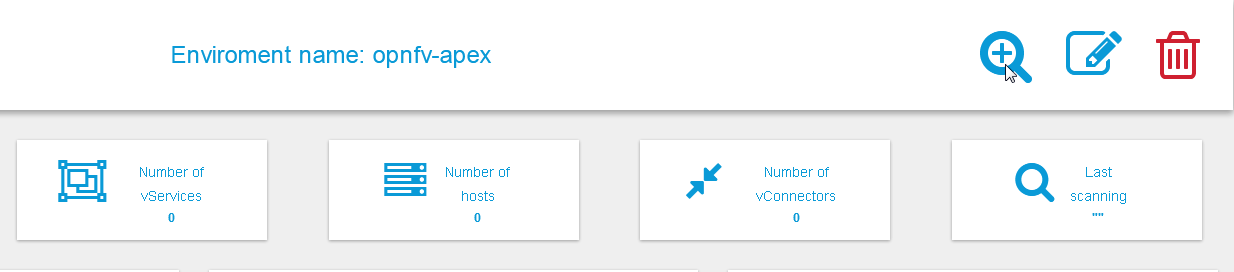
UI scanning request
This can be accomplished after environment configuration has been
submitted, the environment name will be listed under “My
environment” and the administrator can choose it from the list and
login to the specific environment dashboard:
Onces inside a specific environment dashboard the administrator can
click the scanning button the go into scanning request wizards:
In most cases, the only step needed to send a scanning request is to
use all default options and click the “Submit” button:
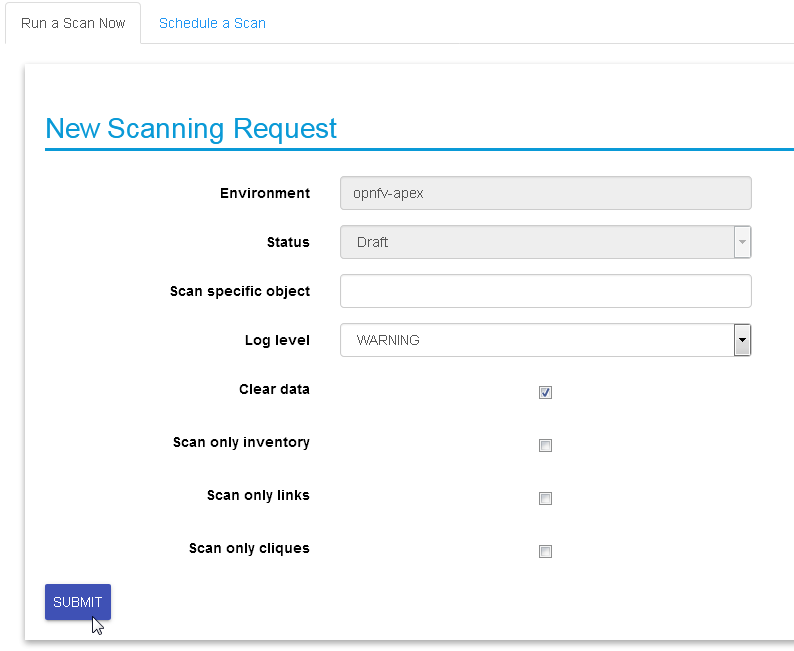
Scanning request will propagate into the “scans” collection and will
be handled by scan_manager in the calipso-scan container.
Scan options:
Log level: determines the level and details of the scanning
logs.
Clear data: empty historical inventories related to that
specific environment, before scanning.
Only inventory: creates inventory objects without analyzing for
links.
Only links: create links from pre-existing inventory, does not
build graph topologies.
Only Cliques: create graph topologies from pre-existing
inventory and links.
UI scan schedule request
Scanning can be used periodically to dynamically update the
inventories per changes in the underlying virtual environment
infrastructure. This can be defined using scan scheduling and can be
combined with the above one time scanning request.
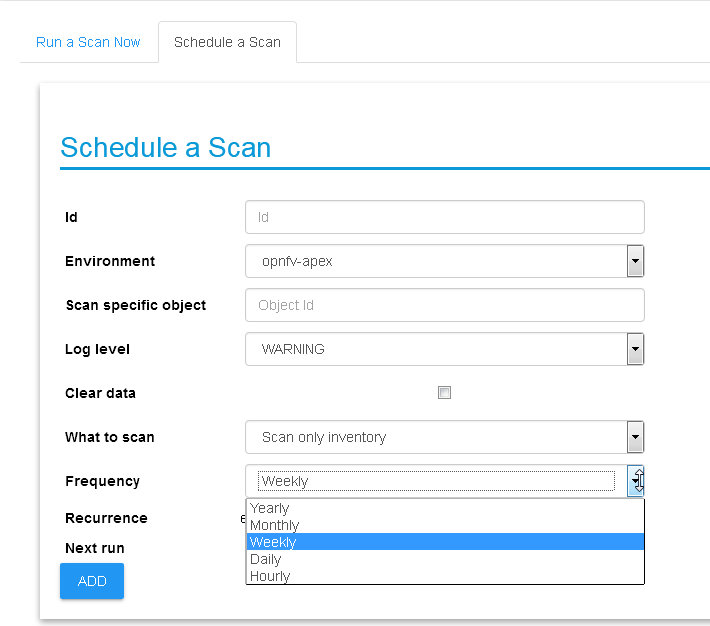
Scheduled scans has the same options as in single scan request,
while choosing a specific environment to schedule on and providing
frequency details, timer is counted from the submission time, scan
scheduling requests are propagated to the “scheduled_scans”
collection in the Calispo mongoDB and handled by scan_manager in
the calispo-scan container.
API scanning request
Follow api-guide for details on submitting scanning request through
Calipso API.
CLI scanning in the calipso-scan container
When using the UI for scanning messages are populated in the
“Messages” menu item and includes several details for successful
scanning and some alerts. When more detailed debugging of the
scanning process is needed, administrator can login directly to the
calispo-scan container and run the scanning manually using CLI:
Login to calispo-scan container running on the installed host:
ssh scan@localhost –p 3002 , using default-password: ‘scan’
Move to the calipso scan application location:
cd /home/scan/calipso_prod/app/discover
Run the scan.py application with the basic default options:
python3 ./scan.py -m /local_dir/calipso_mongo_access.conf -e
Mirantis-8
Default options: -m points to the default location of mongoDB access
details, -e points to the specific environment name, as submitted to
mongoDB through UI or API.
Other optional scanning parameters, can be used for detailed
debugging:
The scan.py script is located in directory app/discover in the
Calipso repository.
To show the help information, run scan.py with –help option, here
is the results
:
Usage: scan.py [-h] [-c [CGI]] [-m [MONGO_CONFIG]] [-e [ENV]] [-t
[TYPE]]
[-y [INVENTORY]] [-s] [-i [ID]] [-p [PARENT_ID]]
[-a [PARENT_TYPE]] [-f [ID_FIELD]] [-l [LOGLEVEL]]
[–inventory_only] [–links_only] [–cliques_only]
[–clear]
Optional arguments:
-h, –help show this help message and exit
-c [CGI], –cgi [CGI]
read argument from CGI (true/false)
(default: false)
-m [MONGO_CONFIG], –mongo_config [MONGO_CONFIG]
name of config file with MongoDB server
access details
-e [ENV], –env [ENV]
name of environment to scan (default: WebEX-
Mirantis@Cisco)
-t [TYPE], –type [TYPE]
type of object to scan (default:
environment)
-y [INVENTORY], –inventory [INVENTORY]
name of inventory collection (default:
‘inventory’)
-s, –scan_self scan changes to a specific object (default:
False)
-i [ID], –id [ID] ID of object to scan (when scan_self=true)
-p [PARENT_ID], –parent_id [PARENT_ID]
ID of parent object (when scan_self=true)
-a [PARENT_TYPE], –parent_type [PARENT_TYPE]
type of parent object (when scan_self=true)
-f [ID_FIELD], –id_field [ID_FIELD]
name of ID field (when scan_self=true)
(default: ‘id’,
use ‘name’ for projects)
-l [LOGLEVEL], –loglevel [LOGLEVEL]
logging level (default: ‘INFO’)
–inventory_only do only scan to inventory (default: False)
–links_only do only links creation (default: False)
–cliques_only do only cliques creation (default: False)
–clear clear all data prior to scanning (default:
False)
A simple scan.py run will look, by default, for a local MongoDB
server. Assuming running this from within the scan container
running, the administrator needs to point it to use the specific
MongoDB server. This is done using the Mongo access config file
created by the installer (see install-guide for details):
./scan.py -m your\_mongo\_access.conf
Environment needs to be specified explicitly, no default environment
is used by scanner.
By default, the inventory collection, named ‘inventory’, along with
the accompanying collections: “links”, “cliques”, “clique_types”
and “clique_constraints” are used to place initial scanning data
results.
As a more granular scan example, for debugging purposes, using
environment “RDO-packstack-Mitaka”, pointing scanning results to
an inventory collection named “RDO”:
The accompanying collections will be automatically created and
renamed accordingly:
“RDO_links”, “RDO_cliques”, “RDO_clique_types” and
“RDO_clique_constraints”.
Another parameter in use here is –clear, which is good for
development: it clears all the previous data from the data
collections (inventory, links & cliques).
scan.py -m your_mongo_access.conf -e RDO-packstack-Mitaka -y RDO
–clear
Log level will provide the necessary details for cases of scan
debugging.
Clique Scanning
For creating cliques based on the discovered objects and links,
clique_types must be defined for the given environment (or a
default “ANY” environment clique_types will be used)
A clique type specifies the link types used in building a clique
(graph topology) for a specific focal point object type.
For example, it can define that for instance objects we want to
have the following link types:
instance-vnic
vnic-vconnector
vconnector-vedge
vedge-host_pnic
host_pnic-network
See calipso-model guide for more details on cliques and links.
As in many cases the same clique types are used, we can simply copy
the clique_types documents from an existing clique_types
collection. For example, using MongoChef:
Click the existing clique types collection
Right click the results area
Choose export
Click ‘next’ all the time (JSON format, to clipboard)
Select JSON format and “Overwrite document with the same _id”
Right click the target collection
Choose import, then JSON and clipboard
- Note that the name of the target collection should have the prefix
name of your collection’s name. For example, you create a
collection named your_test, then your clique types collection’s
name must be your_test_clique_types.
Now run scan.py again to have it create cliques-only from that data.
Viewing results
Scan results are written into the collections in the ‘Calispo’ DB on
the MongoDB database.
In our example, we use the MongoDB database server on
“install-hostname”http://korlev-osdna-devtest.cisco.com/,
so we can connect to it by Mongo client, such as Mongochef and
investigate the specific collections for details.
Editing or deleting environments
Inside a specific environment dashboard optional buttons are
available for deleting and editing the environment configurations:
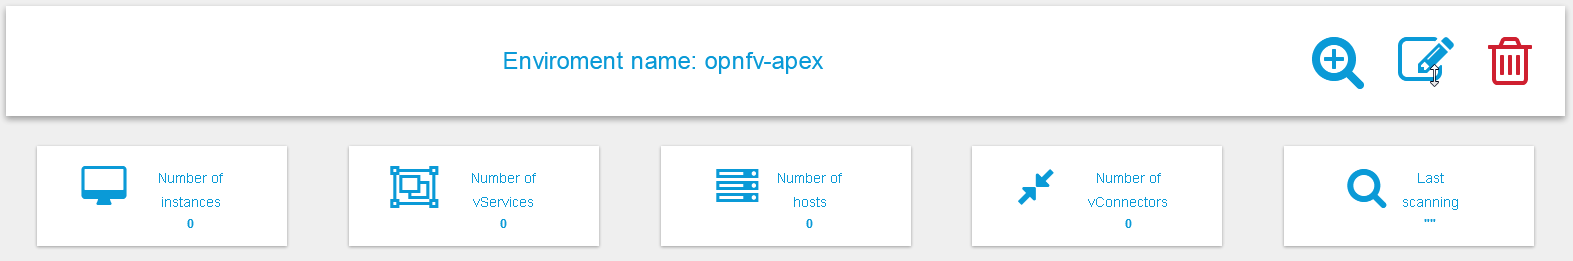
Note: Deleting an environment does not empty the inventories of previous
scan results, this can be accomplished in future scans when using the
–clear options.
Event-based scanning
For dynamic discovery and real-time updates of the inventories
Calipso also provides event-based scanning with event_manager
application in the calipso-listen container.
Event_manager listens to the VIM AMQP BUS and based on the events
updates the inventories and also kickoff automatic scanning of a
specific object and its dependencies.
Enabling event-based scanning
Per environment, administrator can define the option of event-based
scanning, using either UI or API to configure that parameter in the
specific environment configuration:
In cases where event-based scanning is not supported for a specific
distribution variance the checkbox for event based scan will be
grayed out. When checked, the AMQP section becomes mandatory.
This behavior is maintained through the “supported_environments”
collection and explained in more details in the calipso-model
document.
Event-based handling details
The event-based scanning module needs more work to adapt to the
changes in any specific distribution variance, this is where we
would like some community support to help us maintain data without
the need for full or partial scanning through scheduling.
The following diagram illustrates event-based scanning module
functions on top of the regular scanning module functions:
In the following tables, some of the current capabilities of
event-handling and event-based scanning in Calipso are explained: (NOTE: see pdf version of this guide for better tables view)
| # |
Event name |
AMQP event |
Handler |
Workflow |
Scans |
Notes |
|---|
| Instance |
| 1 |
Create Instance |
compute.instance.create.end |
EventInstanceAdd |
- Get instances_root from inventory
- If instance_root is None, log error, return None
- Create ScanInstancesRoot object.
- Scan instances root (and only new instance as a child)
- Scan from queue
- Get host from inventory
- Scan host (and only children of types ‘vconnectors_folder’ and ‘vedges_folder’
- Scan from queue
- Scan links
- Scan cliques
- Return True
|
Yes
{by object id: 2,
links: 1,
cliques: 1,
from queue: ?}
|
|
| 2 |
Update Instance |
compute.instance.rebuild.end
compute.instance.update
|
EventInstanceUpdate |
- If state == ‘building’, return None
- If state == ‘active’ and old_state == ‘building’, call EventInstanceAdd (see #1), return None
- If state == ‘deleted’ and old_state == ‘active’, call EventInstanceDelete (see #2), return None
- Get instance from inventory
- If instance is None, log error, return None
- Update several fields in instance.
- If name_path has changed, update relevant names and name_path for descendants
- Update instance in db
- Return None
|
Yes (if #1 is used)
No (otherwise)
|
The only fields that are updated: name, object_name and name_path |
| 3 |
Delete Instance |
compute.instance.delete.end |
EventInstanceDelete (EventDeleteBase) |
- Extract id from payload
- Execute self.delete_handler()
|
No |
delete_handler() is expanded later |
| Instance Lifecycle |
| 4 |
Instance Down |
compute.instance.shutdown.start
compute.instance.power_off.start
compute.instance.suspend.start
|
Not implemented |
|
|
|
| 5 |
Instance Up |
compute.instance.power_on.end
compute.instance.suspend.end
|
Not implemented |
|
|
|
| Region |
| 6 |
Add Region |
servergroup.create |
Not implemented |
|
|
|
| 7 |
Update Region |
servergroup.update
servergroup.addmember
|
Not implemented |
|
|
|
| 8 |
Delete Region |
servergroup.delete |
Not implemented |
|
|
|
| Network |
| 9 |
Add Network |
network.create.end |
EventNetworkAdd |
- If network with specified id already exists, log error and return None
- Parse incoming data and create a network dict
- Save network in db
- Return None
|
No |
|
| 10 |
Update Network |
network.update.end |
EventNetworkUpdate |
- Get network_document from db
- If network_document doesn’t exist, log error and return None
- If name has changed, update relevant names and name_path for descendants
- Update admin_state_up from payload
- Update network_document in db
|
No |
The only fields that are updated: name, object_name, name_path and admin_state_up |
| 11 |
Delete Network |
network.delete.end |
EventNetworkDelete (EventDeleteBase) |
- Extract network_id from payload
- Execute self.delete_handler()
|
No |
delete_handler() is expanded later |
| Subnet |
| 12 |
Add Subnet |
subnet.create.end |
EventSubnetAdd |
- Get network_document from db
- If network_document doesn’t exist, log error and return None
- Update network_document with new subnet
- If dhcp_enable is True, we update parent network (*note 1*) and add the following children docs: ports_folder, port_document, network_services_folder, dhcp_document, vnic_folder and vnic_document.
- Add links for pnics and vservice_vnics (*note 2*)
- Scan cliques
- Return None
|
Yes {cliques: 1} |
- I don’t fully understand what *these lines* do. We make sure ApiAccess.regions variable is not empty, but why? The widespread usage of static variables is not a good sign anyway.
- For some reason *the comment* before those lines states we “scan for links” but it looks like we just add them.
|
| 13 |
Update Subnet |
subnet.update.end |
EventSubnetUpdate |
- Get network_document from db
- If network_document doesn’t exist, log error and return None
- If we don’t have a matching subnet in network_document[‘subnets’], return None
- If subnet has enable_dhcp set to True and it wasn’t so before:
4.1. Add dhcp document
4.2. Make sure ApiAccess.regions is not empty
4.3. Add port document
4.4. If port has been added, add vnic document, add links and scan cliques.
- Is subnet has enable_dhcp set to False and it wasn’t so before:
5.1. Delete dhcp document
5.2. Delete port binding to dhcp server if exists
- If name hasn’t changed, update it by its key in subnets. Otherwise, set it by the new key in subnets. (*note 1*)
|
Yes {cliques: 1} (only if dhcp status has switched to True) |
- If subnet name has changed, we set it in subnets object inside network_document by new key, but don’t remove the old one. A bug?
|
| 14 |
Delete Subnet |
subnet.delete.end |
EventSubnetDelete |
- Get network_document from db
- If network_document doesn’t exist, log error and return None
- Delete subnet id from network_document[‘subnet_ids’]
- If subnet exists in network_document[‘subnets’], remove its cidr from network_document[‘cidrs’]
and remove itself from network_document[‘subnets’]
- Update network_document in db
- If no subnets are left in network_document, delete related vservice dhcp, port and vnic documents
|
No |
|
| Port |
| 15 |
Create Port |
port.create.end |
EventPortAdd |
- Check if ports folder exists, create if not.
- Add port document to db
- If ‘compute’ is not in port[‘device_owner’], return None
- Get old_instance_doc (updated instance document) from db
- Get instances_root from db
- If instances_root is None, log error and return None (*note 1*)
- Use an ApiFetchHostInstances fetcher to get data for instance with id equal to the device from payload.
- If such instance exists, update old_instance_doc’s fields network_info, network and possibly mac_address with their counterparts from fetched instance. Update old_instance_doc in db
- Use a CliFetchInstanceVnics/CliFetchInstanceVnicsVpp fetcher to get vnic with mac_address equal to the port’s mac address
- If such vnic exists, update its data and update in db
- Add new links using FindLinksForInstanceVnics and FindLinksForVedges classes
- Scan cliques
- Return True
|
Yes {cliques: 1}
(only if ‘compute’ is in port[‘device_owner’] and instance_root is not None (see steps 3 and 6))
|
- The port and (maybe) port folder will still persist in db even if we abort the execution on step 6. See idea 1 for details.
|
| 16 |
Update Port |
port.update.end |
EventPortUpdate |
- Get port from db
- If port doesn’t exist, log error and return None
- Update port data (name, admin_state_up, status, binding:vnic_type) in db
- Return None
|
No |
|
| 17 |
Delete Port |
port.delete.end |
EventPortDelete (EventDeleteBase) |
- Get port from db
- If port doesn’t exist, log error and return None
- If ‘compute’ is in port[‘device_owner’], do the following:
3.1. Get instance document for the port from db. If it doesn’t exist, to step 4.
3.2. Remove port from network_info of instance
3.3. If it was the last port for network in instance doc, remove network from the doc
3.4. If port’s mac_address is equal to instance_doc’s one, then fetch an instance with the same id as instance_doc using ApiFetchHostInstances fetcher. If instance exists and ‘mac_address’ not in instance, set instance_doc’s mac_address to None
3.5. Save instance_docs in db
- Delete port from db
- Delete related vnic from db
- Execute self.delete_handler(vnic) for vnic
|
No |
delete_handler() is expanded later |
| Router |
| 18 |
Add Router |
router.create.end |
EventRouterAdd |
- Get host by id from db
- Fetch router_doc using a CliFetchHostVservice
- If router_doc contains ‘external_gateway_info’:
3.1. Add router document (with network) to db
3.2. Add children documents:
3.3. If no ports folder exists for this router, create one
3.4. Add router port to db
3.5. Add vnics folder for router to db
3.6. If port was successfully added (3.4), try to add vnic document for router to db two times (??)
3.7. If port wasn’t successfully added, try adding vnics_folder again (???) (*note 1*)
3.8. If step 3.7 returned False (*Note 2*), try to add vnic_document again (??)
- Add router document (without network) to db (Note 3)
- Add relevant links for the new router
- Scan cliques
- Return None
|
Yes {cliques: 1} |
- Looks like code author confused a lot of stuff here. This class needs to be reviewed thoroughly.
- Step 3.7 never returns anything for some reason (a bug?)
- Why are we adding router document again? It shouldn’t be added again on step 4 if it was already added on step 3.1. Probably an ‘else’ clause is missing
|
| 19 |
Update Router |
router.update.end |
EventRouterUpdate |
- Get router_doc from db
- If router_doc doesn’t exist, log error and return None
- If payload router data doesn’t have external_gateway_info, do the following:
3.1. If router_doc has a ‘gw_port_id’ key, delete relevant port.
3.2. If router_doc has a ‘network’:
3.2.1. If a port was deleted on step 3.1, remove its ‘network_id’ from router_doc[‘network’]
3.2.2. Delete related links
- If payload router data has external_gateway_info, do the following:
4.1. Add new network id to router_doc networks
4.2. Use CliFetchHostVservice to fetch gateway port and update it in router_doc
4.3. Add children documents for router (see #18 steps 3.2-3.8)
4.4. Add relevant links
- Update router_doc in db
- Scan cliques
- Return None
|
Yes {cliques: 1} |
|
| 20 |
Delete Router |
router.delete.end |
EventRouterDelete (EventDeleteBase) |
- Extract router_id from payload
- Execute self.delete_handler()
|
No |
delete_handler() is expanded later |
| Router Interface |
| 21 |
Add Router Interface |
router.interface.create |
EventInterfaceAdd |
- Get network_doc from db based on subnet id from interface payload
- If network_doc doesn’t exist, return None
- Make sure ApiAccess.regions is not empty (?)
- Add router-interface port document in db
- Add vnic document for interface. If unsuccessful, try again after a small delay
- Update router:
6.1. If router_doc is an empty type, log an error and continue to step 7 (*Note 1*)
6.2. Add new network id to router_doc network list
6.3. If gateway port is in both router_doc and db, continue to step 6.7
6.4. Fetch router using CliFetchHostVservice, set gateway port in router_doc to the one from fetched router
6.5. Add gateway port to db
6.6. Add vnic document for router. If unsuccessful, try again after a small delay
6.7. Update router_id in db
- Add relevant links
- Scan cliques
- Return None
|
Yes {cliques: 1} |
- Log message states that we should abort interface adding, though the code does nothing to support that. Moreover, router_doc can’t be empty at that moment because it’s referenced before.
|
| 22 |
Delete Router Interface |
router.interface.delete |
EventInterfaceDelete |
- Get port_doc by payload port id from db
- If port_doc doesn’t exist, log an error and return None
- Update relevant router by removing network id of port_doc
- Delete port by executing EventPortDelete().delete_port()
|
No |
|
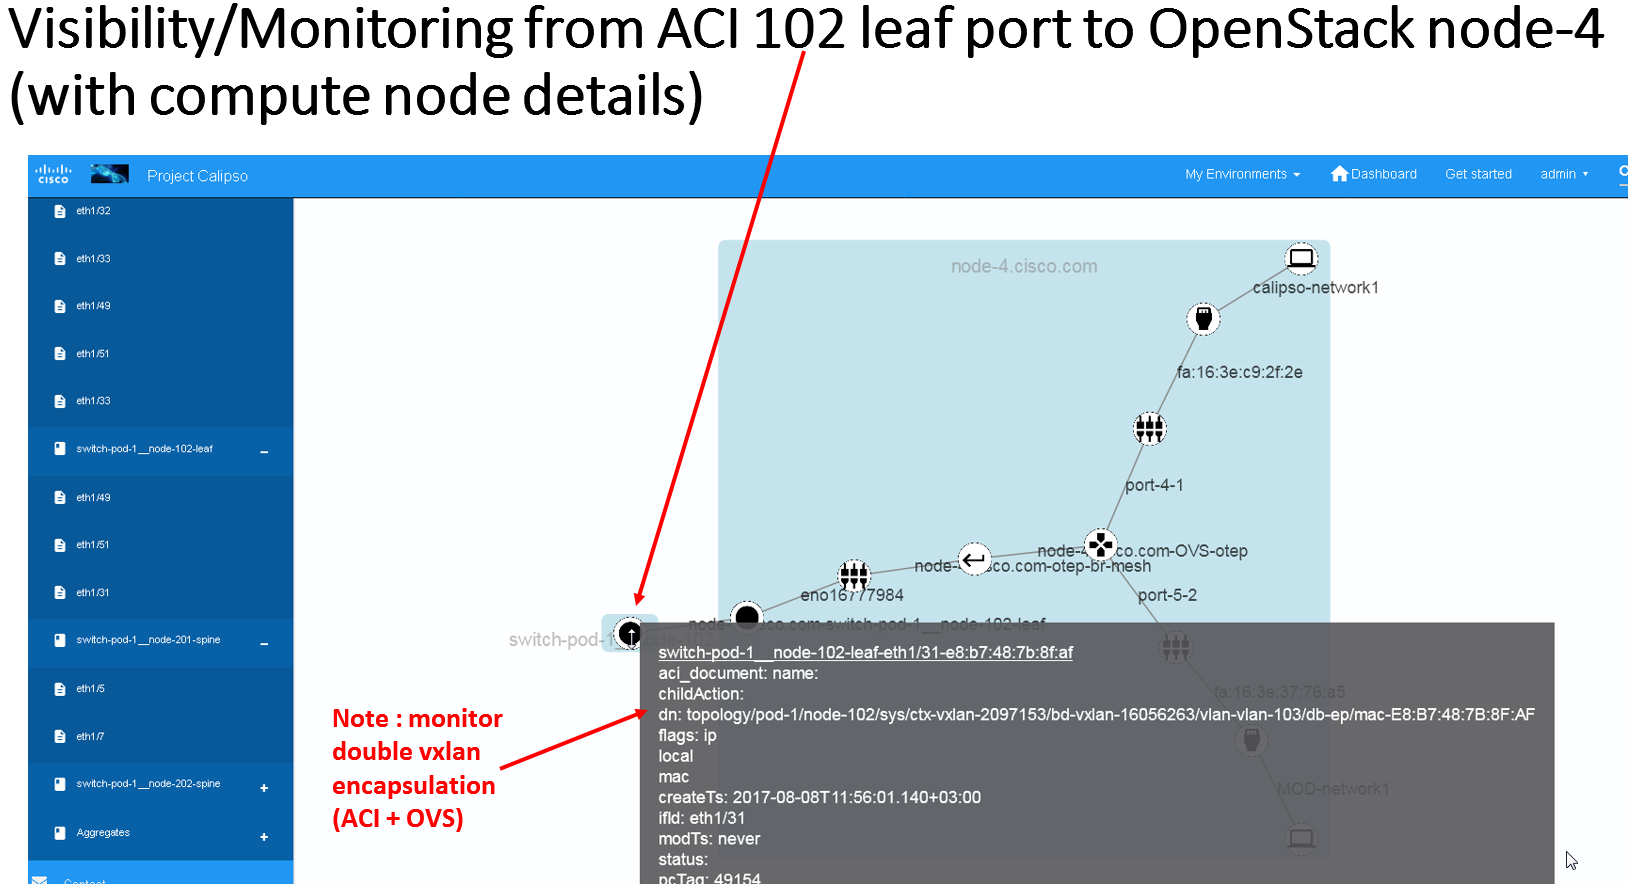
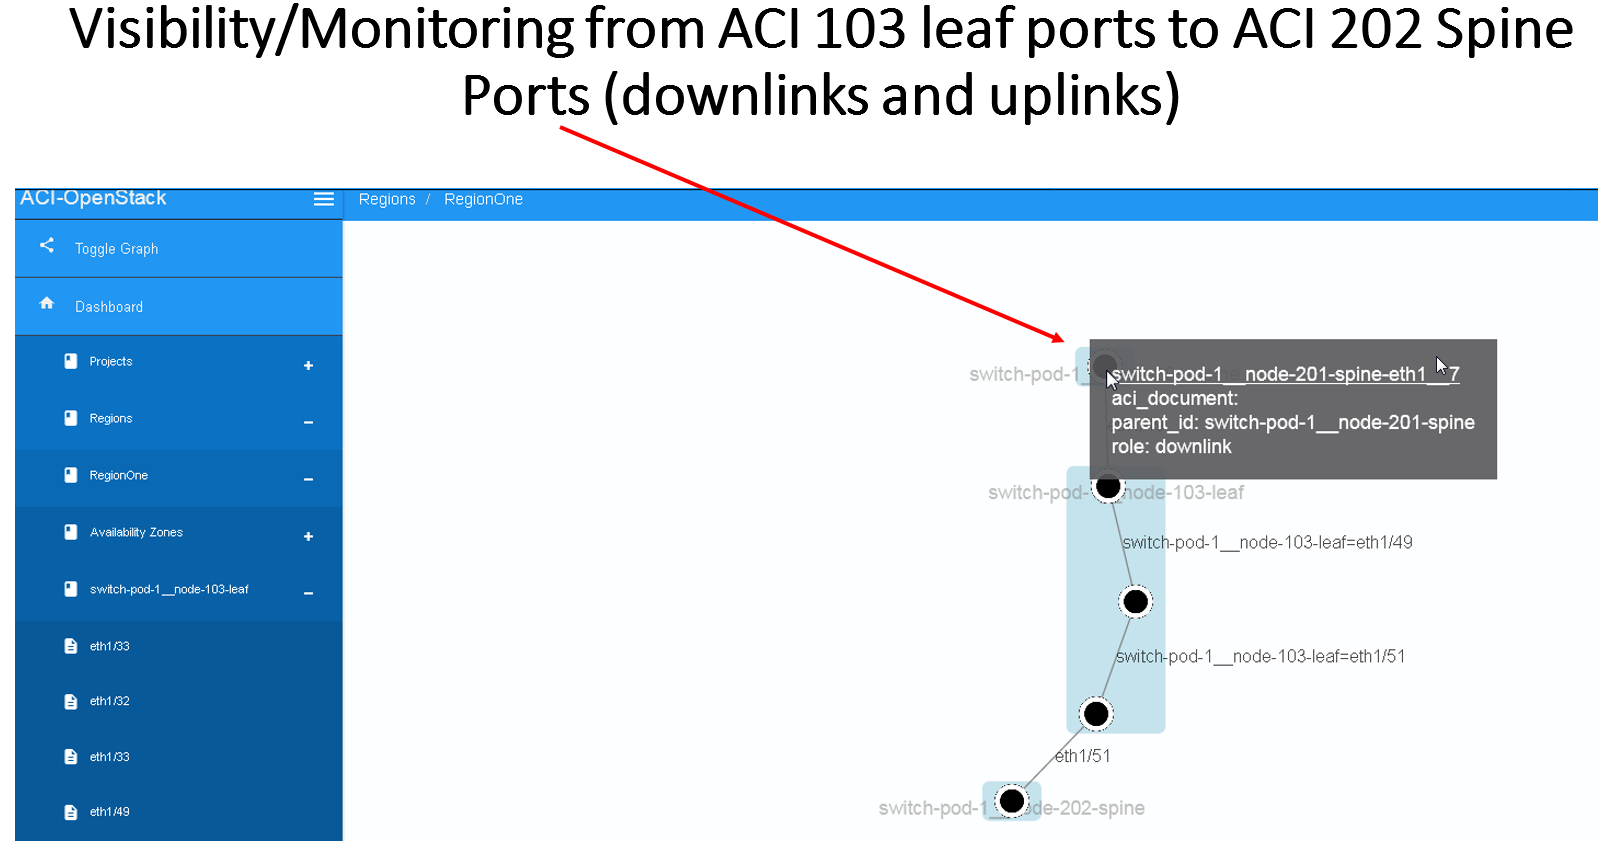
ACI scanning
For dynamic discovery and real-time updates of physical switches and
connections between physical switches ports and host ports (pNICs),
Calispo provides an option to integrate with the Cisco data center
switches controller called “ACI APIC”.
This is an optional parameter and once checked details on the ACI
server and API credentials needs to be provided:
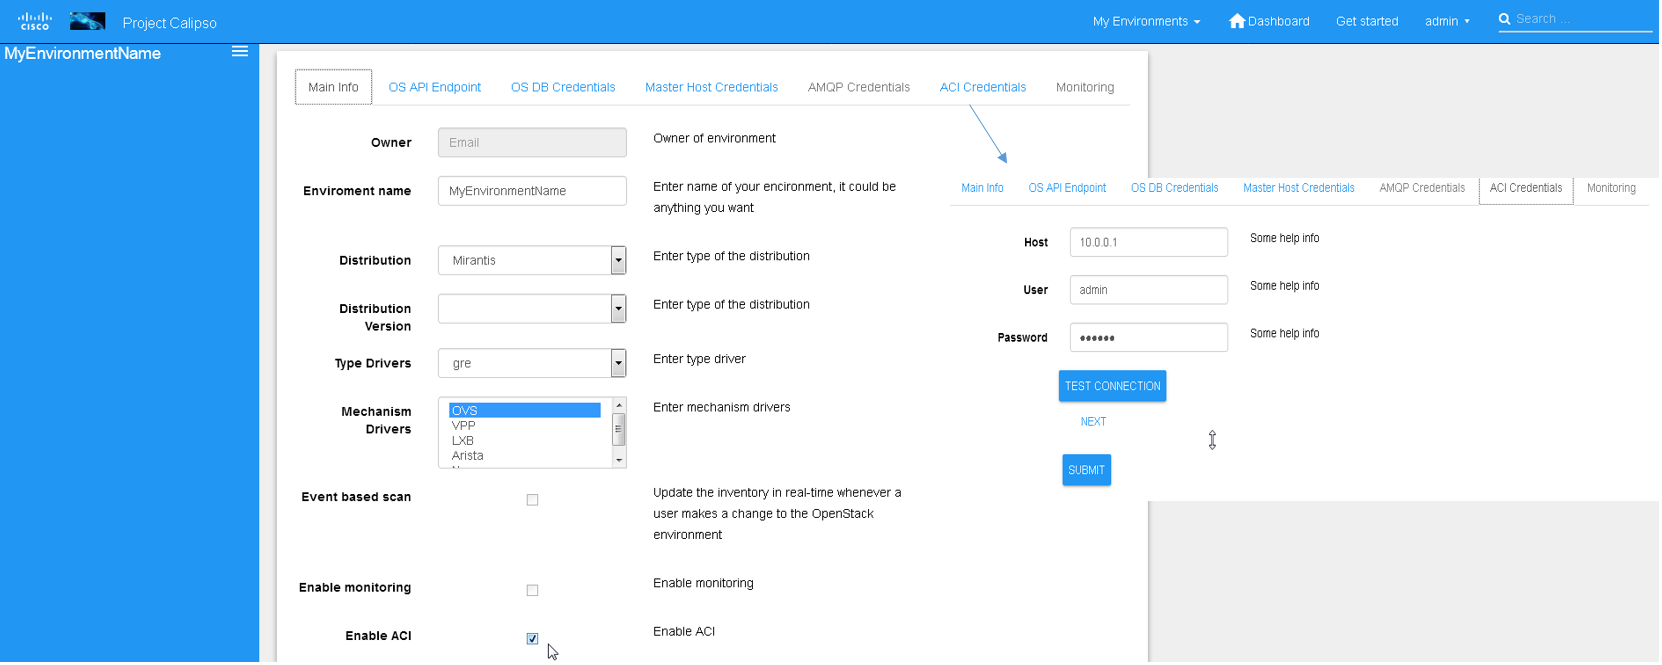
The results of this integration (when ACI switches are used in that
specific VIM environment) are extremely valuable as it maps out and
monitors virtual-to-physical connectivity across the entire data
center environment, both internal and external.
Example graph generated in such environments:
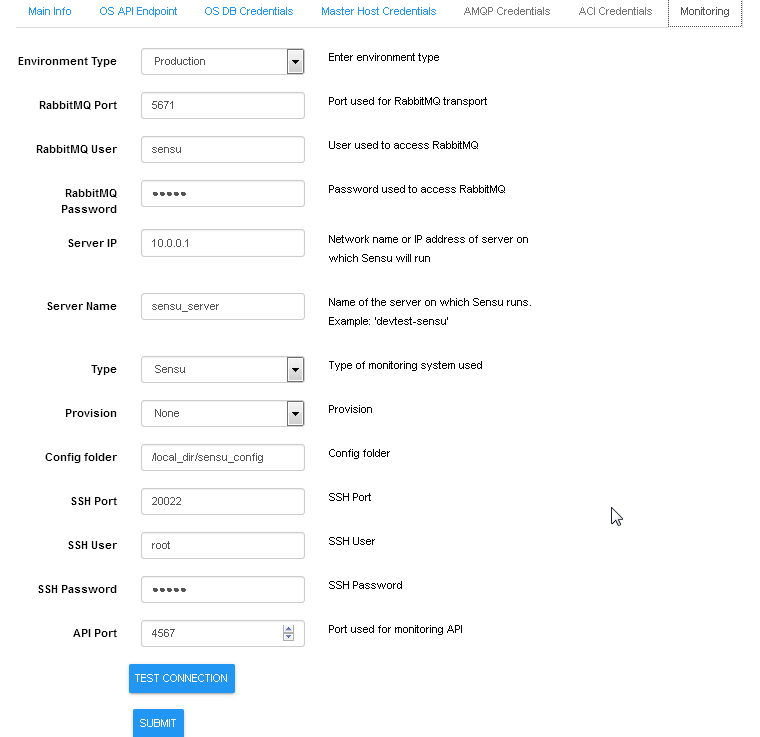
Monitoring enablement
For dynamic discovery of real-time statuses and states of physical
and virtual components and thier connections Calispo provides an
option to automatically integrate with the Sensu framework,
customized and adapted from the Calispo model and design concepts.
Follow the monitoring-guide for details on this optional module.
Enabling Monitoring through UI, using environment configuration
wizard:
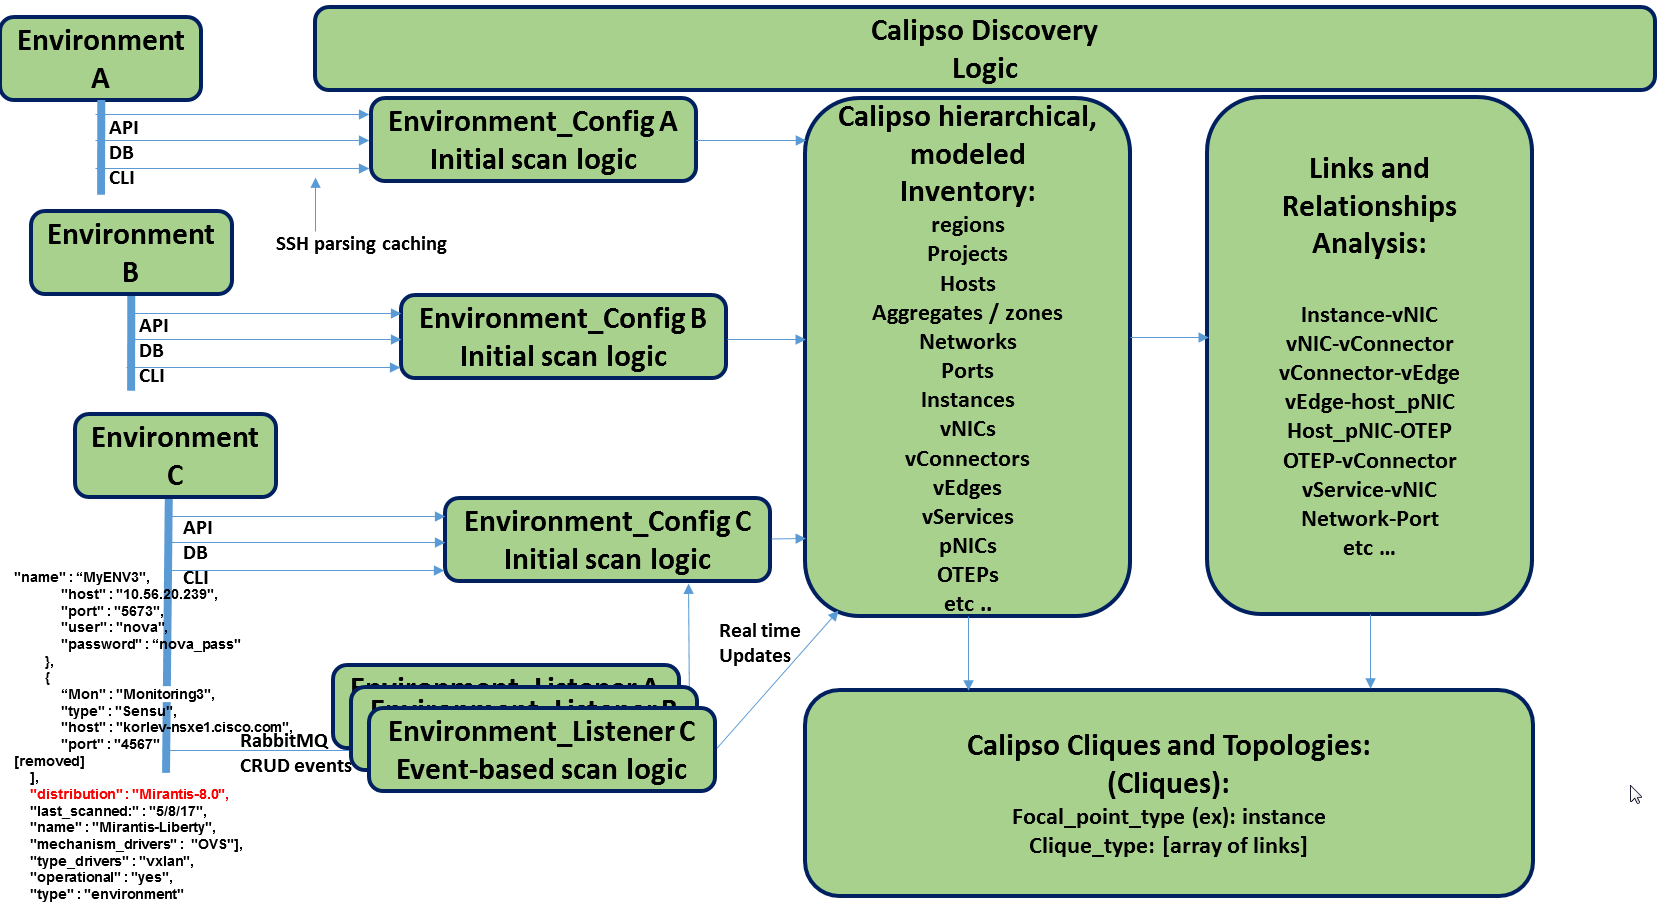
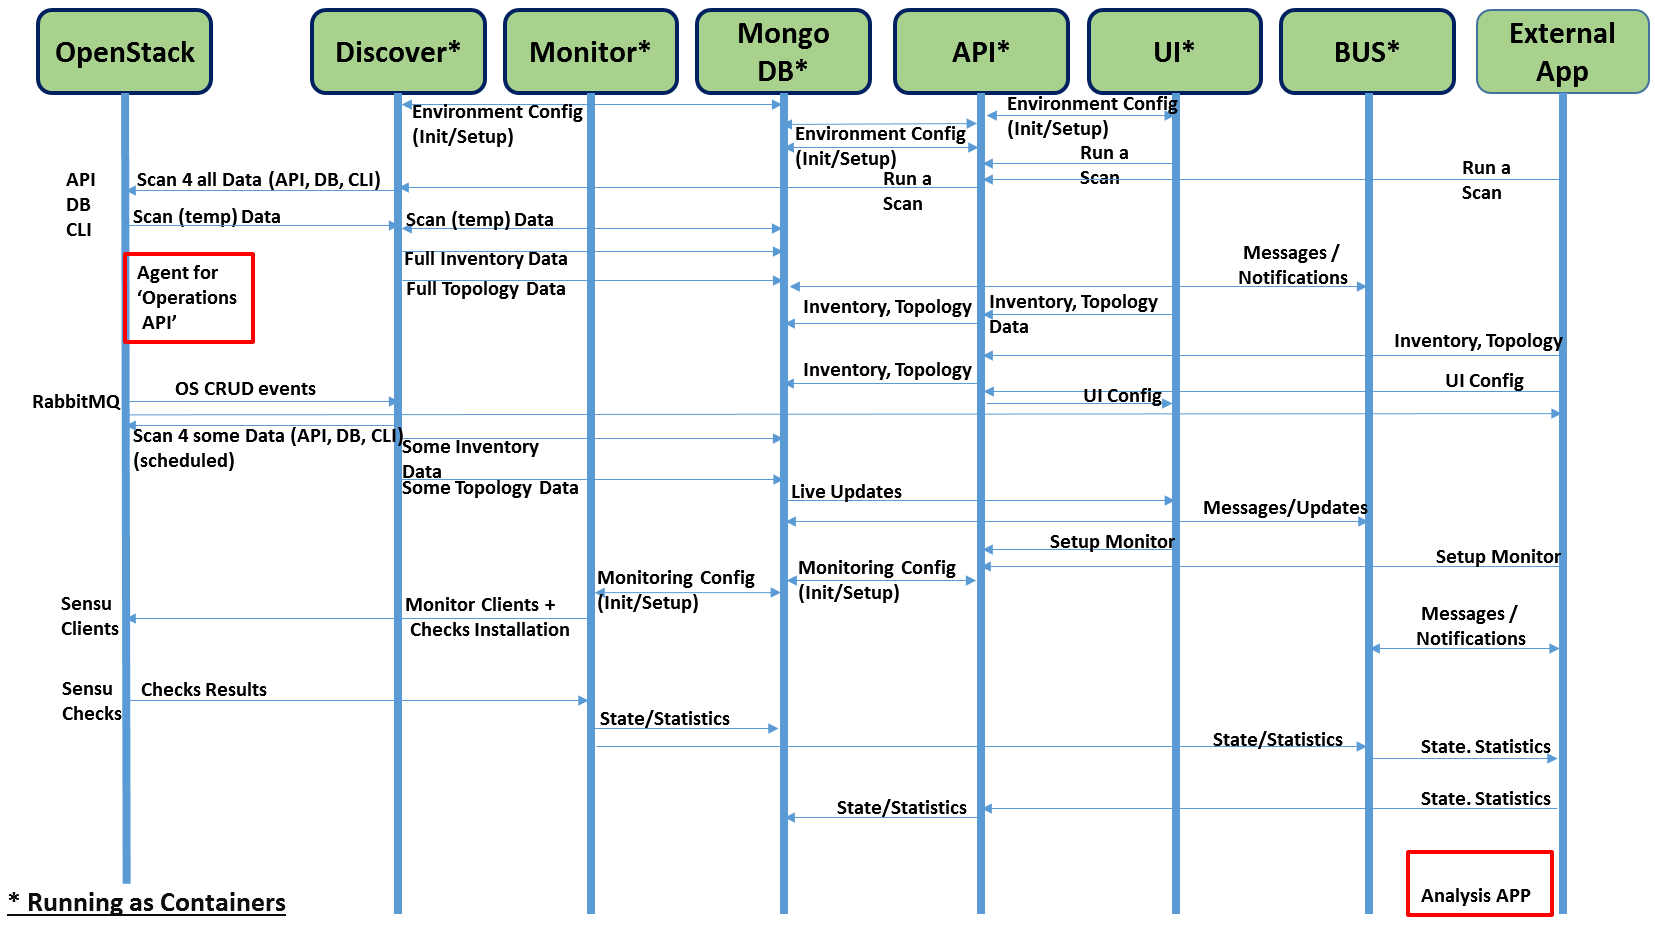
Modules data flows
Calipso modules/containers and the VIM layers have some
inter-dependencies, illustrated in the following diagram:
Copyright (c) 2017 Koren Lev (Cisco Systems), Yaron Yogev (Cisco Systems) and others
All rights reserved. This program and the accompanying materials
are made available under the terms of the Apache License, Version 2.0
which accompanies this distribution, and is available at
http://www.apache.org/licenses/LICENSE-2.0
Project “Calipso” tries to illuminate complex virtual networking with
real time operational state visibility for large and highly distributed
Virtual Infrastructure Management (VIM).
We believe that Stability is driven by accurate Visibility.
Calipso provides visible insights using smart discovery and virtual
topological representation in graphs, with monitoring per object in the
graph inventory to reduce error vectors and troubleshooting, maintenance
cycles for VIM operators and administrators.
Table of Contents
Calipso.io API Guide 1
1 Pre Requisites 3
1.1 Calipso API container 3
2 Overview 3
2.1 Introduction 3
2.2 HTTP Standards 4
2.3 Calipso API module Code 4
3 Starting the Calipso API server 4
3.1 Authentication 4
3.2 Database 5
3.3 Running the API Server 5
4 Using the Calipso API server 6
4.1 Authentication 6
4.2 Messages 9
4.3 Inventory 14
4.4 Links 17
4.5 Cliques 20
4.6 Clique_types 23
4.7 Clique_constraints 26
4.8 Scans 29
4.9 Scheduled_scans 32
4.10 Constants 35
4.11 Monitoring_Config_Templates 37
4.12 Aggregates 39
4.13 Environment_configs 42
Pre Requisites
Calipso API container
Calipso’s main application is written with Python3.5 for Linux
Servers, tested successfully on Centos 7.3 and Ubuntu 16.04. When
running using micro-services many of the required software packages
and libraries are delivered per micro service, including the API
module case. In a monolithic case dependencies are needed.
Here is a list of the required software packages for the API, and
the official supported steps required to install them:
Python3.5.x for Linux :
https://docs.python.org/3.5/using/unix.html#on-linux
Pip for Python3 : https://docs.python.org/3/installing/index.html
Python3 packages to install using pip3 :
falcon (1.1.0)
pymongo (3.4.0)
gunicorn (19.6.0)
ldap3 (2.1.1)
setuptools (34.3.2)
python3-dateutil (2.5.3-2)
bcrypt (3.1.1)
You should use pip3 python package manager to install the specific
version of the library. Calipso project uses Python 3, so
package installation should look like this:
pip3 install falcon==1.1.0
The versions of the Python packages specified above are the ones
that were used in the development of the API, other versions might
also be compatible.
This document describes how to setup Calipso API container for
development against the API.
Overview
Introduction
The Calipso API provides access to the Calipso data stored in the
MongoDB.
Calispo API uses
falcon (https://falconframework.org)
web framework and gunicorn
(http://gunicorn.org) WSGI server.
The authentication of the Calipso API is based on LDAP (Lightweight
Directory Access Protocol). It can therefore interface with any
directory servers which implements the LDAP protocol, e.g. OpenLDAP,
Active Directory etc. Calipso app offers and uses the LDAP built-in
container by default to make sure this integration is fully tested,
but it is possible to interface to other existing directories.
HTTP Standards
At present two types of operations are supported: GET (retrieve
data) and POST (create a new data object).
Calipso API module Code
Clipso API code is currently located in opnfv repository.
Run the following command to get the source code:
git
clone **https://git.opnfv.org/calipso/**
The source code of the API is located in the app/api directory
sub-tree.
Starting the Calipso API server
Authentication
Calipso API uses LDAP as the protocol to implement the
authentication, so you can use any LDAP directory server as the
authentication backend, like OpenLDAP and Microsoft
AD. You
can edit the ldap.conf file which is located in app/config directory
to configure LDAP server options (see details in quickstart-guide):
# url for connecting to the LDAP server (customize to your own as
needed):
url ldap_url
# LDAP attribute mapped to user id, must not be a multivalued
attributes:
user_id_attribute CN
# LDAP attribute mapped to user password:
user_pass_attribute userPassword
# LDAP objectclass for user
user_objectclass inetOrgPerson
# Search base for users
user_tree_dn OU=Employees,OU=Example Users,DC=exmaple,DC=com
query_scope one
# Valid options for tls_req_cert are demand, never, and allow
tls_req_cert demand
# CA certificate file path for communicating with LDAP servers.
tls_cacertfile ca_cert_file_path
group_member_attribute member
Calipso currently implements the basic authentication, the client
send the query request with its username and password in the auth
header, if the user can be bound to the LDAP server, authentication
succeeds otherwise fails. Other methods will be supported in future
releases.
Database
Calipso API query for and retrieves data from MongoDB container, the
data in the MongoDB comes from the results of Calipso scanning,
monitoring or the user inputs from the API. All modules of a single
Calipso instance of the application must point to the same MongoDB
used by the scanning and monitoring modules. Installation and
testing of mongoDB is covered in install-guide and quickstart-guide.
Running the API Server
The entry point (initial command) running the Calipso API
application is the server.py script in the app/api directory.
Options for running the API server can be listed using: python3
server.py –help. Here is the current options available:
-m [MONGO_CONFIG], –mongo_config [MONGO_CONFIG]
name of config file with mongo access details
–ldap_config [LDAP_CONFIG]
name of the config file with ldap server config
details
-l [LOGLEVEL], –loglevel [LOGLEVEL] logging level (default:
‘INFO’)
-b [BIND], –bind [BIND]
binding address of the API server (default:
127.0.0.1:8000)
-y [INVENTORY], –inventory [INVENTORY]
name of inventory collection (default:
‘inventory’)
For testing, you can simply run the API server by:
python3 app/api/server.py
This will start a HTTP server listening on http://localhost:8000,
if you want to change the binding address of the server, you can run
it using this command:
python3 server.py –bind ip_address/server_name:port_number
You can also use your own configuration files for LDAP server and
MongoDB, just add –mongo_config and –ldap_config options in your
command:
python3 server.py –mongo_config your_mongo_config_file_path
–ldap_config your_ldap_config_file_path
—inventory option is used to set the collection names the server
uses for the API, as per the quickstart-guide this will default to
/local_dir/calipso_mongo_access.conf and
/local_dir/ldap.conf mounted inside the API container.
Notes: the –inventory argument can only change the collection names
of the inventory, links, link_types, clique_types,
clique_constraints, cliques, constants and scans collections, names
of the monitoring_config_templates, environments_config and
messages collections will remain at the root level across releases.
Using the Calipso API server
The following covers the currently available requests and responses on
the Calipso API
Authentication
POST /auth/tokens
Description: get token with password and username or a valid token.
Normal response code: 201
Error response code: badRequest(400), unauthorized(401)
Request
| Name |
In |
Type |
Description |
|---|
| auth(Mandatory) |
body |
object |
An auth object that contains the authentication information |
| methods(Mandatory) |
body |
array |
The authentication methods. For password authentication, specify password, for token authentication, specify token. |
| credentials(Optional) |
body |
object |
Credentials object which contains the username and password, it must be provided when getting the token with user credentials. |
| token(Optional) |
body |
string |
The token of the user, it must be provided when getting the user with an existing valid token. |
Response
| Name |
In |
Type |
Description |
|---|
| token |
body |
string |
Token for the user. |
| issued-at |
body |
string |
The date and time when the token was issued. the date and time format follows *ISO 8610*:
YYYY-MM-DDThh:mm:ss.sss+hhmm
|
| expires_at |
body |
string |
The date and time when the token expires. the date and time format follows *ISO 8610*:
YYYY-MM-DDThh:mm:ss.sss+hhmm
|
| method |
body |
string |
The method which achieves the token. |
**
Examples**
Get token with credentials:
Post *http://korlev-osdna-staging1.cisco.com:8000/auth/tokens*
{
“auth”: {
“methods”: [“credentials”],
“credentials”: {
“username”: “username”,
“password”: “password”
}
}
}
Get token with token
post http://korlev-calipso-staging1.cisco.com:8000/auth/tokens
{
“auth”: {
“methods”: [“token”],
“token”: “17dfa88789aa47f6bb8501865d905f13”
}
}
DELETE /auth/tokens
Description: delete token with a valid token.
Normal response code: 200
Error response code: badRequest(400), unauthorized(401)
Request
| Name |
In |
Type |
Description |
|---|
| X-Auth-Token |
header |
string |
A valid authentication token that is doing to be deleted. |
Response
200 OK will be returned when the delete succeed
Messages
GET /messages
Description: get message details with environment name and message id,
or get a list of messages with filters except id.
Normal response code: 200
Error response code: badRequest(400), unauthorized(401), notFound(404)
Request
| Name |
In |
Type |
Description |
|---|
| env_name(Mandatory) |
query |
string |
Environment name of the messages. e.g. “Mirantis-Liberty-API”. |
| id (Optional) |
query |
string |
ID of the message. |
| source_system (Optional) |
query |
string |
Source system of the message, e.g. “OpenStack”. |
| start_time (Optional) |
query |
string |
Start time of the messages, when this parameter is specified, the messages after that time will be returned, the date and time format follows *ISO 8610: *
YYYY-MM-DDThh:mm:ss.sss+hhmm
The +hhmm value, if included, returns the time zone as an offset from UTC, For example, 2017-01-25T09:45:33.000-0500. If you omit the time zone, the UTC time is assumed.
|
| end_time (Optional) |
query |
string |
End time of the message, when this parameter is specified, the messages before that time will be returned, the date and time format follows *ISO 8610*:
YYYY-MM-DDThh:mm:ss.sss+hhmm
The +hhmm value, if included, returns the time zone as an offset from UTC, For example, 2017-01-25T09:45:33.000-0500. If you omit the time zone, the UTC time is assumed.
|
| level (Optional) |
query |
string |
The severity of the messages, we accept the severities strings described in *RFC 5424*, possible values are “panic”, “alert”, “crit”, “error”, “warn”, “notice”, “info” and “debug”. |
| related_object (Optional) |
query |
string |
ID of the object related to the message. |
| related_object_type (Optional) |
query |
string |
Type of the object related to the message, possible values are “vnic”, “vconnector”, “vedge”, “instance”, “vservice”, “host_pnic”, “network”, “port”, “otep” and “agent”. |
| page (Optional) |
query |
int |
Which page will to be returned, the default is first page, if the page is larger than the maximum page of the query, and it will return an empty result set (Page start from 0). |
| page_size (Optional) |
query |
int |
Size of each page, the default is 1000. |
Response
| Name |
In |
Type |
Description |
|---|
| environment |
body |
string |
Environment name of the message. |
| id |
body |
string |
ID of the message. |
| _id |
body |
string |
MongoDB ObjectId of the message. |
| timestamp |
body |
string |
Timestamp of message. |
| viewed |
body |
boolean |
Indicates whether the message has been viewed. |
| display_context |
body |
string |
The content which will be displayed. |
| message |
body |
object |
Message object. |
| source_system |
body |
string |
Source system of the message, e.g. “OpenStack”. |
| level |
body |
string |
The severity of the message. |
| related_object |
body |
string |
Related object of the message. |
| related_object_type |
body |
string |
Type of the related object. |
| messages |
body |
array |
List of message ids which match the filters. |
Examples
Example Get Messages
Request:
http://korlev-calipso-testing.cisco.com:8000/messages?env_name=Mirantis-Liberty-API&start_time=2017-01-25T14:28:32.400Z&end_time=2017-01-25T14:28:42.400Z
Response:
{
“level”: “info”,
“environment”: “Mirantis-Liberty”,
“id”: “3c64fe31-ca3b-49a3-b5d3-c485d7a452e7”,
“source_system”: “OpenStack”
},
{
“level”: “info”,
“environment”: “Mirantis-Liberty”,
“id”: “c7071ec0-04db-4820-92ff-3ed2b916738f”,
“source_system”: “OpenStack”
},
Example Get Message Details
Request
http://korlev-calipso-testing.cisco.com:8000/messages?env_name=Mirantis-Liberty-API&id=80b5e074-0f1a-4b67-810c-fa9c92d41a98
Response
{
“related_object_type”: “instance”,
“source_system”: “OpenStack”,
“level”: “info”,
“timestamp”: “2017-01-25T14:28:33.057000”,
“_id”: “588926916a283a8bee15cfc6”,
“viewed”: true,
“display_context”: “*”,
“related_object”: “97a1e179-6a42-4c7b-bced-4f64bd9e4b6b”,
“environment”: “Mirantis-Liberty-API”,
“message”: {
“_context_show_deleted”: false,
“_context_user_name”: “admin”,
“_context_project_id”: “a3efb05cd0484bf0b600e45dab09276d”,
“_context_service_catalog”: [
{
“type”: “volume”,
“endpoints”: [
{
“region”: “RegionOne”
}
],
“name”: “cinder”
},
{
“type”: “volumev2”,
“endpoints”: [
{
“region”: “RegionOne”
}
],
“name”: “cinderv2”
}
],
“_context_user_identity”: “a864d9560b3048e9864118555bb9614c
a3efb05cd0484bf0b600e45dab09276d - - -”,
“_context_project_domain”: null,
“_context_is_admin”: true,
“_context_instance_lock_checked”: false,
“_context_timestamp”: “2017-01-25T22:27:08.773313”,
“priority”: “INFO”,
“_context_project_name”: “project-osdna”,
“_context_read_only”: false,
“message_id”: “80b5e074-0f1a-4b67-810c-fa9c92d41a98”,
“_context_user_id”: “a864d9560b3048e9864118555bb9614c”,
“_context_quota_class”: null,
“_context_tenant”: “a3efb05cd0484bf0b600e45dab09276d”,
“_context_remote_address”: “192.168.0.2”,
“_context_request_id”: “req-2955726b-f227-4eac-9826-b675f5345ceb”,
“_context_auth_token”:
“gAAAAABYiSVcHmaq1TWwNc1_QLlKhdUeC1-M6zBebXyoXN4D0vMlxisny9Q61crBzqwSyY_Eqd_yjrL8GvxatWI1WI1uG4VeWU6axbLe_k5FaXS4RVOP83yR6eh5g_qXQtsNapQufZB1paypZm8YGERRvR-vV5Ee76aTSkytVjwOBeipr9D0dXd-wHcRnSNkTD76nFbGKTu_”,
“_context_user_domain”: null,
“payload”: {
“image_meta”: {
“container_format”: “bare”,
“disk_format”: “qcow2”,
“min_ram”: “64”,
“base_image_ref”: “5f048984-37d1-4952-8b8a-9acb0237bad7”,
“min_disk”: “0”
},
“display_name”: “test”,
“terminated_at”: “”,
“access_ip_v6”: null,
“architecture”: null,
“audit_period_beginning”: “2017-01-01T00:00:00.000000”,
“metadata”: {},
“audit_period_ending”: “2017-01-25T22:27:12.888042”,
“instance_type”: “m1.micro”,
“ramdisk_id”: “”,
“availability_zone”: “nova”,
“kernel_id”: “”,
“hostname”: “test”,
“vcpus”: 1,
“bandwidth”: {},
“user_id”: “a864d9560b3048e9864118555bb9614c”,
“state_description”: “block_device_mapping”,
“old_state”: “building”,
“root_gb”: 0,
“instance_flavor_id”: “8784e0b5-7d17-4281-a509-f49d6fd102f9”,
“cell_name”: “”,
“reservation_id”: “r-zt7sh7vy”,
“access_ip_v4”: null,
“deleted_at”: “”,
“tenant_id”: “a3efb05cd0484bf0b600e45dab09276d”,
“disk_gb”: 0,
“instance_id”: “97a1e179-6a42-4c7b-bced-4f64bd9e4b6b”,
“memory_mb”: 64,
“os_type”: null,
“old_task_state”: “block_device_mapping”,
“state”: “building”,
“instance_type_id”: 6,
“launched_at”: “”,
“ephemeral_gb”: 0,
“created_at”: “2017-01-25 22:27:09+00:00”,
“progress”: “”,
“new_task_state”: “block_device_mapping”
},
“_context_read_deleted”: “no”,
“event_type”: “compute.instance.update”,
“_context_roles”: [
“admin”,
“_member_”
],
“_context_user”: “a864d9560b3048e9864118555bb9614c”,
“timestamp”: “2017-01-25 22:27:12.912744”,
“_unique_id”: “d6dff97e6f71401bb8890057f872644f”,
“_context_resource_uuid”: null,
“_context_domain”: null
},
“id”: “80b5e074-0f1a-4b67-810c-fa9c92d41a98”
}
Inventory
GET /inventory** **
Description: get object details with environment name and id of the
object, or get a list of objects with filters except id.
Normal response code: 200
Error response code: badRequest(400), unauthorized(401), notFound(404)
Request
| Name |
In |
Type |
Description |
|---|
| env_name (Mandatory) |
query |
string |
Environment of the objects. e.g. “Mirantis-Liberty-API”. |
| id (Optional) |
query |
string |
ID of the object. e.g. “*node-2.cisco.com*”. |
| parent_id (Optional) |
query |
string |
ID of the parent object. e.g. “nova”. |
| id_path (Optional) |
query |
string |
ID path of the object. e.g. “/Mirantis-Liberty-API/Mirantis-Liberty-API-regions/RegionOne/RegionOne-availability_zones/nova/*node-2.cisco.com*”. |
| parent_path (Optional) |
query |
string |
ID path of the parent object. “/Mirantis-Liberty-API/Mirantis-Liberty-API-regions/RegionOne/RegionOne-availability_zones/nova”. |
| sub_tree (Optional) |
query |
boolean |
If it is true and the parent_path is specified, it will return the whole sub-tree of that parent object which includes the parent itself, If it is false and the parent_path is specified, it will only return the siblings of that parent (just the children of that parent node), the default value of sub_tree is false. |
| page (Optional) |
query |
int |
Which page is to be returned, the default is the first page, if the page is larger than the maximum page of the query, it will return an empty set, (page starts from 0). |
| page_size (Optional) |
query |
int |
Size of each page, the default is 1000. |
Response
| Name |
In |
Type |
Description |
|---|
| environment |
body |
string |
Environment name of the object. |
| id |
body |
string |
ID of the object. |
| _id |
body |
string |
MongoDB ObjectId of the object. |
| type |
body |
string |
Type of the object. |
| parent_type |
body |
string |
Type of the parent object. |
| parent_id |
body |
string |
ID of the parent object. |
| name_path |
body |
string |
Name path of the object. |
| last_scanned |
body |
string |
Time of last scanning. |
| name |
body |
string |
Name of the object. |
| id_path |
body |
string |
ID path of the object. |
| objects |
body |
array |
The list of object IDs that match the filters. |
Examples
Example Get Objects
Request
http://korlev-calipso-testing.cisco.com:8000/inventory?env_name=Mirantis-Liberty-API&parent_path=/Mirantis-Liberty-API/Mirantis-Liberty-API-regions/RegionOne&sub_tree=false
Response
{
“objects”: [
{
“id”: “Mirantis-Liberty-regions”,
“name”: “Regions”,
“name_path”: “/Mirantis-Liberty/Regions”
},
{
“id”: “Mirantis-Liberty-projects”,
“name”: “Projects”,
“name_path”: “/Mirantis-Liberty/Projects”
}
]
}
Examples Get Object Details
Request
http://korlev-calipso-testing.cisco.com:8000/inventory?env_name=Mirantis-Liberty-API&id=node-2.cisco.com
Response
{
‘ip_address’: ‘192.168.0.5’,
‘services’: {
‘nova-compute’: {
‘active’: True,
‘updated_at’: ‘2017-01-20T23:03:57.000000’,
‘available’: True
}
},
‘id_path’:
‘/Mirantis-Liberty-API/Mirantis-Liberty-API-regions/RegionOne/RegionOne-availability_zones/nova/
*node-2.cisco.com*‘,
‘show_in_tree’: True,
‘os_id’: ‘1’,
‘_id’: ‘588297ae6a283a8bee15cc0d’,
‘host_type’: [
‘Compute’
],
‘name_path’: ‘/Mirantis-Liberty-API/Regions/RegionOne/Availability
Zones/nova/
*node-2.cisco.com*‘,
‘parent_type’: ‘availability_zone’,
‘zone’: ‘nova’,
‘parent_id’: ‘nova’,
‘last_scanned’: ‘2017-01-20T15:05:18.501000’,
‘environment’: ‘Mirantis-Liberty-API’,
‘type’: ‘host’
}
Links
GET /links
Description: get link details with environment name and id of the link,
or get a list of links with filters except id
Normal response code: 200
Error response code: badRequest(400), unauthorized(401), notFound(404)
Request
| Name |
In |
Type |
Description |
|---|
| env_name (Mandatory) |
query |
string |
Environment of the links. e.g. “Mirantis-Liberty-API”. |
| id (Optional) |
query |
string |
ID of the link, it must be a string which can be converted to MongoDB ObjectId. |
| host (Optional) |
query |
string |
Host of the link. e.g. “*node-1.cisco.com*”. |
| link_type (Optional) |
query |
string |
Type of the link, some possible values for that are “instance-vnic”, “otep-vconnector”, “otep-host_pnic”, “host_pnic-network”, “vedge-otep”, “vnic-vconnector”, “vconnector-host_pnic”, “vnic-vedge”, “vedge-host_pnic” and “vservice-vnic” . |
| link_name (Optional) |
query |
string |
Name of the link. e.g. “Segment-2”. |
| source_id (Optional) |
query |
string |
ID of the source object of the link. e.g. “qdhcp-4f4bf8b5-ca42-411a-9f64-5b214d1f1c71”. |
| target_id (Optional) |
query |
string |
ID of the target object of the link. “tap708d399a-20”. |
| state (Optional) |
query |
string |
State of the link, “up” or “down”. |
| attributes |
query |
object |
The attributes of the link, e.g. the network attribute of the link is attributes:network=”4f4bf8b5-ca42-411a-9f64-5b214d1f1c71”. |
| page (Optional) |
query |
int |
Which page is to be returned, the default is first page, when the page is larger than the maximum page of the query,
it will return an empty set. (Page starts from 0).
|
| page_size (Optional) |
query |
int |
Size of each page, the default is 1000. |
Response
| Name |
In |
Type |
Description |
|---|
| id |
body |
string |
ID of the link. |
| _id |
body |
string |
MongoDB ObjectId of the link. |
| environment |
body |
string |
Environment of the link. |
| source_id |
body |
string |
ID of the source object of the link. |
| target_id |
body |
string |
ID of the target object of the link. |
| source |
body |
string |
MongoDB ObjectId of the source object. |
| target |
body |
string |
MongoDB ObjectId of the target object. |
| source_label |
body |
string |
Descriptive text for the source object. |
| target_label |
body |
string |
Descriptive text for the target object. |
| link_weight |
body |
string |
Weight of the link. |
| link_type |
body |
string |
Type of the link, some possible values for that are “instance-vnic”, “otep-vconnector”, “otep-host_pnic”, “host_pnic-network”, “vedge-otep”, “vnic-vconnector”, “vconnector-host_pnic”, “vnic-vedge”, “vedge-host_pnic” and “vservice-vnic”. |
| state |
body |
string |
State of the link, “up” or “down”. |
| attributes |
body |
object |
The attributes of the link. |
| links |
body |
array |
List of link IDs which match the filters. |
Examples
Example Get Link Ids
Request
*http://korlev-calipso-testing.cisco.com:8000/links?env_name=Mirantis-Liberty-API&host=node-2.cisco.com*
Response
{
“links”: [
{
“id”: “58ca73ae3a8a836d10ff3b45”,
“link_type”: “host_pnic-network”,
“link_name”: “Segment-103”,
“environment”: “Mirantis-Liberty”
}
]
}
Example Get Link Details
Request
http://korlev-calipso-testing.cisco.com:8000/links?env_name=Mirantis-Liberty-API&id=5882982c6a283a8bee15cc62
Response
{
“target_id”: “6d0250ae-e7df-4b30-aa89-d9fcc22e6371”,
“target”: “58a23ff16a283a8bee15d3e6”,
“link_type”: “vnic-vedge”,
“environment”: “Mirantis-Liberty-API”,
“_id”: “58a240646a283a8bee15d438”,
“source_label”: “fa:16:3e:38:11:c9”,
“state”: “up”,
“link_weight”: 0,
“id”: “58a240646a283a8bee15d438”,
“source”: “58a23fd46a283a8bee15d3c6”,
“target_label”: “10”,
“attributes”: {},
“source_id”: “qr-24364cd7-ab”
}
Cliques
GET /cliques
Description: get clique details with environment name and clique id, or
get a list of cliques with filters except id
Normal response code: 200
Error response code: badRequest(400), unauthorized(401), notFound(404)
Request
| Name |
In |
Type |
Description |
|---|
| env_name (Mandatory) |
query |
string |
Environment of the cliques. e.g. “Mirantis-Liberty-API”. |
| id (Optional) |
query |
string |
ID of the clique, it must be a string that can be converted to Mongo ObjectID. |
| focal_point (Optional) |
query |
string |
MongoDB ObjectId of the focal point object, it must be a string that can be converted to Mongo ObjectID. |
| focal_point_type (Optional) |
query |
string |
Type of the focal point object, some possible values are “vnic”, “vconnector”, “vedge”, “instance”, “vservice”, “host_pnic”, “network”, “port”, “otep” and “agent”. |
| link_type(Optional) |
query |
string |
Type of the link, when this filter is specified, it will return all the cliques which contain the specific type of the link, some possible values for link_type are “instance-vnic”, “otep-vconnector”, “otep-host_pnic”, “host_pnic-network”, “vedge-otep”, “vnic-vconnector”, “vconnector-host_pnic”, “vnic-vedge”, “vedge-host_pnic” and “vservice-vnic”. |
| link_id (Optional) |
query |
string |
MongoDB ObjectId of the link, it must be a string that can be converted to MongoDB ID, when this filter is specified, it will return all the cliques which contain that specific link. |
| page (Optional) |
query |
int |
The page is to be returned, the default is the first page, if the page is larger than the maximum page of the query, it will return an empty set. (Page starts from 0). |
| page_size (Optional) |
query |
int |
The size of each page, the default is 1000. |
Response
| Name |
In |
Type |
Description |
|---|
| id |
body |
string |
ID of the clique. |
| _id |
body |
string |
MongoDB ObjectId of the clique. |
| environment |
body |
string |
Environment of the clique. |
| focal_point |
body |
string |
Object ID of the focal point. |
| focal_point_type |
body |
string |
Type of the focal point object, e.g. “vservice”. |
| links |
body |
array |
List of MongoDB ObjectIds of the links in the clique. |
| links_detailed |
body |
array |
Details of the links in the clique. |
| constraints |
body |
object |
Constraints of the clique. |
| cliques |
body |
array |
The list of clique ids that match the filters. |
Examples
Example Get Cliques
Request
*http://10.56.20.32:8000/cliques?env_name=Mirantis-Liberty-API&link_id=58a2405a6a283a8bee15d42f*
Response
{
“cliques”: [
{
“link_types”: [
“instance-vnic”,
“vservice-vnic”,
“vnic-vconnector”
],
“environment”: “Mirantis-Liberty”,
“focal_point_type”: “vnic”,
“id”: “576c119a3f4173144c7a75c5”
},
{
“link_types”: [
“vnic-vconnector”,
“vconnector-vedge”
],
“environment”: “Mirantis-Liberty”,
“focal_point_type”: “vconnector”,
“id”: “576c119a3f4173144c7a75c6”
}
]
}
Example Get Clique Details
Request
http://korlev-calipso-testing.cisco.com:8000/cliques?env_name=Mirantis-Liberty-API&id=58a2406e6a283a8bee15d43f
Response
{
‘id’: ‘58867db16a283a8bee15cd2b’,
‘focal_point_type’: ‘host_pnic’,
‘environment’: ‘Mirantis-Liberty’,
‘_id’: ‘58867db16a283a8bee15cd2b’,
‘links_detailed’: [
{
‘state’: ‘up’,
‘attributes’: {
‘network’: ‘e180ce1c-eebc-4034-9e50-b3bab1c13979’
},
‘target’: ‘58867cc86a283a8bee15cc92’,
‘source’: ‘58867d166a283a8bee15ccd0’,
‘link_type’: ‘host_pnic-network’,
‘target_id’: ‘e180ce1c-eebc-4034-9e50-b3bab1c13979’,
‘link_weight’: 0,
‘environment’: ‘Mirantis-Liberty’,
‘_id’: ‘58867d646a283a8bee15ccf3’,
‘target_label’: ‘’,
‘link_name’: ‘Segment-None’,
‘source_label’: ‘’
}
],
‘links’: [
‘58867d646a283a8bee15ccf3’
],
‘focal_point’: ‘58867d166a283a8bee15ccd0’,
‘constraints’: {
}
}
Clique_types
GET /clique_types
Description: get clique_type details with environment name and
clique_type id, or get a list of clique_types with filters except id
Normal response code: 200
Error response code: badRequest(400), unauthorized(401), notFound(404)
Request
| Name |
In |
Type |
Description |
|---|
| env_name |
query |
string |
Environment of the clique_types. e.g. “Mirantis-Liberty-API” |
| id |
query |
string |
ID of the clique_type, it must be a string that can be converted to the MongoDB ObjectID. |
| focal_point_type (Optional) |
query |
string |
Type of the focal point object, some possible values for it are “vnic”, “vconnector”, “vedge”, “instance”, “vservice”, “host_pnic”, “network”, “port”, “otep” and “agent”. |
| link_type(Optional) |
query |
string |
Type of the link, when this filter is specified, it will return all the clique_types which contain the specific link_type in its link_types array. Some possible values of the link_type are “instance-vnic”, “otep-vconnector”, “otep-host_pnic”, “host_pnic-network”, “vedge-otep”, “vnic-vconnector”, “vconnector-host_pnic”, “vnic-vedge”, “vedge-host_pnic” and “vservice-vnic”. Repeat link_type several times to specify multiple link_types, e.g link_type=instance-vnic&link_type=host_pnic-network. |
| page_size(Optional) |
query |
int |
Size of each page, the default is 1000. |
| page (Optional) |
query |
int |
Which page is to be returned, the default is first page, if the page is larger than the maximum page of the query, it will return an empty result set. (Page starts from 0). |
Response
| Name |
In |
Type |
Description |
|---|
| id |
body |
string |
ID of the clique_type. |
| _id |
body |
string |
MongoDB ObjectId of the clique_type |
| environment |
body |
string |
Environment of the clique_type. |
| focal_point_type |
body |
string |
Type of the focal point, e.g. “vnic”. |
| link_types |
body |
array |
List of link_types of the clique_type. |
| name |
body |
string |
Name of the clique_type. |
| clique_types |
body |
array |
List of clique_type ids of clique types that match the filters. |
Examples
Example Get Clique_types
Request
*** ***http://korlev-calipso-testing.cisco.com:8000/clique_types?env_name=Mirantis-Liberty-API&link_type=instance-vnic&page_size=3&link_type=host_pnic-network
**Response**
{
“clique_types”: [
{
“environment”: “Mirantis-Liberty”,
“focal_point_type”: “host_pnic”,
“id”: “58ca73ae3a8a836d10ff3b80”
}
]
}
Example Get Clique_type Details
Request
http://korlev-calipso-testing.cisco.com:8000/clique_types?env_name=Mirantis-Liberty-API&id=585b183c761b05789ee3c659
Response
{
‘id’: ‘585b183c761b05789ee3c659’,
‘focal_point_type’: ‘vnic’,
‘environment’: ‘Mirantis-Liberty-API’,
‘_id’: ‘585b183c761b05789ee3c659’,
‘link_types’: [
‘instance-vnic’,
‘vservice-vnic’,
‘vnic-vconnector’
],
‘name’: ‘vnic_clique’
}
POST /clique_types
Description: Create a new clique_type
Normal response code: 201(Created)
Error response code: badRequest(400), unauthorized(401), conflict(409)
Request
| Name |
In |
Type |
Description |
|---|
| environment(Mandatory) |
body |
string |
Environment of the system, the environment must be the existing environment in the system. |
| focal_point_type(Mandatory) |
body |
string |
Type of the focal point, some possible values are “vnic”, “vconnector”, “vedge”, “instance”, “vservice”, “host_pnic”, “network”, “port”, “otep” and “agent”. |
| link_types(Mandatory) |
body |
array |
Link_types of the clique_type, some possible values of the link_type are “instance-vnic”, “otep-vconnector”, “otep-host_pnic”, “host_pnic-network”, “vedge-otep”, “vnic-vconnector”, “vconnector-host_pnic”, “vnic-vedge”, “vedge-host_pnic” and “vservice-vnic” |
| name(Mandatory) |
body |
string |
Name of the clique type, e.g. “instance_vconnector_clique” |
Request Example
post http://korlev-calipso-testing.cisco.com:8000/clique_types
{
“environment” : “RDO-packstack-Mitaka”,
“focal_point_type” : “instance”,
“link_types” : [
“instance-vnic”,
“vnic-vconnector”,
“vconnector-vedge”,
“vedge-otep”,
“otep-host_pnic”,
“host_pnic-network”
],
“name” : “instance_vconnector_clique”
}
Response
Successful Example
{
“message”: “created a new clique_type for environment
Mirantis-Liberty”
}
Clique_constraints
GET /clique_constraints
Description: get clique_constraint details with clique_constraint id,
or get a list of clique_constraints with filters except id.
Normal response code: 200
Error response code: badRequest(400), unauthorized(401), notFound(404)
Note: this is not environment specific so query starts with parameter,
not env_name (as with all others), example:
http://korlev-calipso-testing.cisco.com:8000/clique_constraints?focal_point_type=instance
Request
| Name |
In |
Type |
Description |
|---|
| id (Optional) |
query |
string |
ID of the clique_constraint, it must be a string that can be converted to MongoDB ObjectId. |
| focal_point_type (Optional) |
query |
string |
Type of the focal_point, some possible values for that are “vnic”, “vconnector”, “vedge”, “instance”, “vservice”, “host_pnic”, “network”, “port”, “otep” and “agent”. |
| constraint(Optional) |
query |
string |
Constraint of the cliques, repeat this filter several times to specify multiple constraints. e.g
constraint=network&constraint=host_pnic.
|
| page (Optional) |
query |
int |
Which page is to be returned, the default is the first page, if the page is larger than the maximum page of the query, the last page will be returned. (Page starts from 0.) |
| page_size (Optional) |
query |
int |
Size of each page, the default is 1000 |
Response
| Name |
In |
Type |
Description |
|---|
| id |
body |
string |
Object id of the clique constraint. |
| _id |
body |
string |
MongoDB ObjectId of the clique_constraint. |
| focal_point_type |
body |
string |
Type of the focal point object. |
| constraints |
body |
array |
Constraints of the clique. |
| clique_constraints |
body |
array |
List of clique constraints ids that match the filters. |
Examples
Example Get Clique_constraints
Request
http://korlev-calipso-testing.cisco.com:8000/clique_constraints?constraint=host_pnic&constraint=network
Response
{
“clique_constraints”: [
{
“id”: “576a4176a83d5313f21971f5”
},
{
“id”: “576ac7069f6ba3074882b2eb”
}
]
}
Example Get Clique_constraint Details
Request
http://korlev-calipso-testing.cisco.com:8000/clique_constraints?id=576a4176a83d5313f21971f5
**Response**
{
“_id”: “576a4176a83d5313f21971f5”,
“constraints”: [
“network”,
“host_pnic”
],
“id”: “576a4176a83d5313f21971f5”,
“focal_point_type”: “instance”
}
Scans
GET /scans
Description: get scan details with environment name and scan id, or get
a list of scans with filters except id
Normal response code: 200
Error response code: badRequest (400), unauthorized (401), notFound(404)
Request
| Name |
In |
Type |
Description |
|---|
| env_name (Mandatory) |
query |
string |
Environment of the scans. e.g. “Mirantis-Liberty”. |
| id (Optional) |
query |
string |
ID of the scan, it must be a string that can be converted MongoDB ObjectId. |
| base_object(Optional) |
query |
string |
ID of the scanned base object. e.g. “*node-2.cisco.com*”. |
| status (Optional) |
query |
string |
Status of the scans, the possible values for the status are “draft”, “pending”, “running”, “completed”, “failed” and “aborted”. |
| page (Optional) |
query |
int |
Which page is to be returned, the default is the first page, if the page is larger than the maximum page of the query, it will return an empty set. (Page starts from 0.) |
| page_size (Optional) |
query |
int |
Size of each page, the default is 1000. |
Response
| Name |
In |
Type |
Description |
|---|
| status |
body |
string |
The current status of the scan, possible values are “draft”, “pending”, “running”, “completed”, “failed” and “aborted”. |
| log_level |
body |
string |
Logging level of the scanning, the possible values are “CRITICAL”, “ERROR”, “WARNING”, “INFO”, “DEBUG” and “NOTSET”. |
| clear |
body |
boolean |
Indicates whether it needs to clear all the data before scanning. |
| scan_only_inventory |
body |
boolean |
Only scan and store data in the inventory. |
| scan_only_links |
body |
boolean |
Limit the scan to find only missing links. |
| scan_only_cliques |
body |
boolean |
Limit the scan to find only missing cliques. |
| scan_completed |
body |
boolean |
Indicates if the scan completed |
| submit_timestamp |
body |
string |
Submit timestamp of the scan |
| environment |
body |
string |
Environment name of the scan |
| inventory |
body |
string |
Name of the inventory collection. |
| object_id |
body |
string |
Base object of the scan |
Examples
Example Get Scans
Request
http://korlev-calipso-testing.cisco.com:8000/scans?status=completed&env_name=Mirantis-Liberty&base_object=ff
Response
{
“status”: “pending”,
“environment”: “Mirantis-Liberty”,
“id”: “58c96a075eb66a121cc4e75f”,
“scan_completed”: true
}
]
}
Example Get Scan Details
Request
http://korlev-calipso-testing.cisco.com:8000/scans?env_name=Mirantis-Liberty&id=589a49cf2e8f4d154386c725
Response
{
“scan_only_cliques”: true,
“object_id”: “ff”,
“start_timestamp”: “2017-01-28T01:02:47.352000”,
“submit_timestamp”: null,
“clear”: true,
“_id”: “589a49cf2e8f4d154386c725”,
“environment”: “Mirantis-Liberty”,
“scan_only_links”: true,
“id”: “589a49cf2e8f4d154386c725”,
“inventory”: “update-test”,
“scan_only_inventory”: true,
“log_level”: “warning”,
“status”: “completed”,
“end_timestamp”: “2017-01-28T01:07:54.011000”
}
POST /scans
Description: create a new scan (ask calipso to scan an environment for
detailed data gathering).
Normal response code: 201(Created)
Error response code: badRequest (400), unauthorized (401)
Request
| Name |
In |
Type |
Description |
|---|
| status (mandatory) |
body |
string |
The current status of the scan, possible values are “draft”, “pending”, “running”, “completed”, “failed” and “aborted”. |
| log_level (optional) |
body |
string |
Logging level of the scanning, the possible values are “critical”, “error”, “warning”, “info”, “debug” and “notset”. |
| clear (optional) |
body |
boolean |
Indicates whether it needs to clear all the data before scanning. |
| scan_only_inventory (optional) |
body |
boolean |
Only scan and store data in the inventory. |
| scan_only_links (optional) |
body |
boolean |
Limit the scan to find only missing links. |
| scan_only_cliques (optional) |
body |
boolean |
Limit the scan to find only missing cliques. |
| environment (mandatory) |
body |
string |
Environment name of the scan |
| inventory (optional) |
body |
string |
Name of the inventory collection. |
| object_id (optional) |
body |
string |
Base object of the scan |
Request Example
post
http://korlev-calipso-testing.cisco.com:8000/*scans*
{
“status” : “pending”,
“log_level” : “warning”,
“clear” : true,
“scan_only_inventory” : true,
“environment” : “Mirantis-Liberty”,
“inventory” : “koren”,
“object_id” : “ff”
}
Response
Successful Example
{
“message”: “created a new scan for environment
Mirantis-Liberty”
}
Scheduled_scans
GET /scheduled_scans
Description: get scheduled_scan details with environment name and
scheduled_scan id, or get a list of scheduled_scans with filters
except id
Normal response code: 200
Error response code: badRequest (400), unauthorized (401), notFound(404)
Request
| Name |
In |
Type |
Description |
|---|
| environment(Mandatory) |
query |
string |
Environment of the scheduled_scans. e.g. “Mirantis-Liberty”. |
| id (Optional) |
query |
string |
ID of the scheduled_scan, it must be a string that can be converted to MongoDB ObjectId. |
| freq (Optional) |
query |
string |
Frequency of the scheduled_scans, the possible values for the freq are “HOURLY”, “DAILY”, “WEEKLY”, “MONTHLY”, and “YEARLY”. |
| page (Optional) |
query |
int |
Which page is to be returned, the default is the first page, if the page is larger than the maximum page of the query, it will return an empty set. (Page starts from 0.) |
| page_size (Optional) |
query |
int |
Size of each page, the default is 1000. |
Response
| Name |
In |
Type |
Description |
|---|
| freq |
body |
string |
The frequency of the scheduled_scan, possible values are “HOURLY”, “DAILY”, “WEEKLY”, “MONTHLY”, and “YEARLY”. |
| log_level |
body |
string |
Logging level of the scheduled_scan, the possible values are “critical”, “error”, “warning”, “info”, “debug” and “notset”. |
| clear |
body |
boolean |
Indicates whether it needs to clear all the data before scanning. |
| scan_only_inventory |
body |
boolean |
Only scan and store data in the inventory. |
| scan_only_links |
body |
boolean |
Limit the scan to find only missing links. |
| scan_only_cliques |
body |
boolean |
Limit the scan to find only missing cliques. |
| submit_timestamp |
body |
string |
Submitted timestamp of the scheduled_scan |
| environment |
body |
string |
Environment name of the scheduled_scan |
| scheduled_timestamp |
body |
string |
Scheduled time for the scanning, it should follows *ISO 8610: *YYYY-MM-DDThh:mm:ss.sss+hhmm |
Examples
Example Get Scheduled_scans
Request
http://korlev-calipso-testing.cisco.com:8000/scheduled_scans?environment=Mirantis-Liberty
Response
{
“freq”:”WEEKLY”,
“environment”: “Mirantis-Liberty”,
“id”: “58c96a075eb66a121cc4e75f”,
“scheduled_timestamp”: “2017-01-28T01:07:54.011000”
}
]
}
Example Get Scheduled_Scan Details
Request
http://korlev-calipso-testing.cisco.com:8000/scheduled_scans?environment=Mirantis-Liberty&id=589a49cf2e8f4d154386c725
Response
{
“scan_only_cliques”: true,
“scheduled_timestamp”: “2017-01-28T01:02:47.352000”,
“submit_timestamp”: 2017-01-27T01:07:54.011000””,
“clear”: true,
“_id”: “589a49cf2e8f4d154386c725”,
“environment”: “Mirantis-Liberty”,
“scan_only_links”:false,
“id”: “589a49cf2e8f4d154386c725”,
“scan_only_inventory”:false,
“log_level”: “warning”,
“freq”: “WEEKLY”
}
POST /scheduled_scans
Description: create a new scheduled_scan (request calipso to scan in a
future date).
Normal response code: 201(Created)
Error response code: badRequest (400), unauthorized (401)
Request
| Name |
In |
Type |
Description |
|---|
| log_level (optional) |
body |
string |
Logging level of the scheduled_scan, the possible values are “critical”, “error”, “warning”, “info”, “debug” and “notset”. |
| clear (optional) |
body |
boolean |
Indicates whether it needs to clear all the data before scanning. |
| scan_only_inventory (optional) |
body |
boolean |
Only scan and store data in the inventory. |
| scan_only_links (optional) |
body |
boolean |
Limit the scan to find only missing links. |
| scan_only_cliques (optional) |
body |
boolean |
Limit the scan to find only missing cliques. |
| environment (mandatory) |
body |
string |
Environment name of the scan |
| freq(mandatory) |
body |
string |
The frequency of the scheduled_scan, possible values are “HOURLY”, “DAILY”, “WEEKLY”, “MONTHLY”, and “YEARLY”. |
| submit_timestamp(mandatory) |
body |
string |
Submitted time for the scheduled_scan, it should follows *ISO 8610: *YYYY-MM-DDThh:mm:ss.sss+hhmm |
**
Post** http://korlev-calipso-testing.cisco.com:8000/scheduled_scans
{
“freq” : “WEEKLY”,
“log_level” : “warning”,
“clear” : true,
“scan_only_inventory” : true,
“environment” : “Mirantis-Liberty”,
“submit_timestamp” : “2017-01-28T01:07:54.011000”
}
Response
Successful Example
{
“message”: “created a new scheduled_scan for environment
Mirantis-Liberty”
}
Constants
GET /constants
Description: get constant details with name (constants are used by ui
and event/scan managers)
Normal response code: 200
Error response code: badRequest(400), unauthorized(401), notFound(404)
Request
| Name |
In |
Type |
Description |
|---|
| name (Mandatory) |
query |
string |
Name of the constant. e.g. “distributions”. |
Response
| Name |
In |
Type |
Description |
|---|
| id |
body |
string |
ID of the constant. |
| _id |
body |
string |
MongoDB ObjectId of the constant. |
| name |
body |
string |
Name of the constant. |
| data |
body |
array |
Data of the constant. |
Examples
Example Get Constant Details
Request
*http://korlev-osdna-testing.cisco.com:8000/constants?name=link_states*
Response
{
“_id”: “588796ac2e8f4d02b8e7aa2a”,
“data”: [
{
“value”: “up”,
“label”: “up”
},
{
“value”: “down”,
“label”: “down”
}
],
“id”: “588796ac2e8f4d02b8e7aa2a”,
“name”: “link_states”
}
Monitoring_Config_Templates
GET /monitoring_config_templates
Description: get monitoring_config_template details with template id,
or get a list of templates with filters except id (see
monitoring-guide).
Normal response code: 200
Error response code: badRequest(400), unauthorized(401), notFound(404)
Request
| Name |
In |
Type |
Description |
|---|
| id (Optional) |
query |
string |
ID of the monitoring config template, it must be a string that can be converted MongoDB ObjectId |
| order (Optional) |
query |
int |
Order by which templates are applied, 1 is the OSDNA default template. Templates that the user added later we use higher order and will override matching attributes in the default templates or add new attributes. |
| side (Optional) |
query |
string |
The side which runs the monitoring, the possible values are “client” and “server”. |
| type (Optional) |
query |
string |
The name of the config file, e.g. “client.json”. |
| page (Optional) |
query |
int |
Which page is to be returned, the default is the first page, if the page is larger than the maximum page of the query, it will return an empty result set. (Page starts from 0). |
| page_size(Optional) |
query |
int |
Size of each page, the default is 1000. |
Response
| Name |
In |
Type |
Description |
|---|
| id |
body |
string |
ID of the monitoring_config_template. |
| _id |
body |
srting |
MongoDB ObjectId of the monitoring_config_template. |
| monitoring_system |
body |
string |
System that we use to do the monitoring, e.g, “Sensu”. |
| order |
body |
string |
Order by which templates are applied, 1 is the OSDNA default templates. Templates that the user added later we use higher order and will override matching attributes in the default templates or add new attributes. |
| config |
body |
object |
Configuration of the monitoring. |
| side |
body |
string |
The side which runs the monitoring. |
| type |
body |
string |
The name of the config file, e.g. “client.json”. |
Examples
Example Get Monitoring_config_templates
Request
http://korlev-calipso-testing.cisco.com:8000/monitoring_config_templates?side=client&order=1&type=rabbitmq.json&page=0&page_size=1
Response
{
“monitoring_config_templates”: [
{
“type”: “rabbitmq.json”,
“side”: “client”,
“id”: “583711893e149c14785d6daa”
}
Example Get Monitoring_config_template Details
Request
http://korlev-calipso-testing.cisco.com:8000/monitoring_config_templates?id=583711893e149c14785d6daa
Response
{
“order”: “1”,
“monitoring_system”: “sensu”,
“_id”: “583711893e149c14785d6daa”,
“side”: “client”,
“type”: “rabbitmq.json”,
“config”: {
“rabbitmq”: {
“host”: “{server_ip}”,
“vhost”: “/sensu”,
“password”: “{rabbitmq_pass}”,
“user”: “{rabbitmq_user}”,
“port”: 5672
}
},
“id”: “583711893e149c14785d6daa”
}
Aggregates
GET /aggregates
Description: List some aggregated information about environment, message
or constant.
Normal response code: 200
Error response code: badRequest(400), unauthorized(401), notFound(404)
Request
| Name |
In |
Type |
Description |
|---|
| env_name (Optional) |
query |
string |
Environment name, if the aggregate type is “environment”, this value must be specified. |
| type (Optional) |
query |
string |
Type of aggregate, currently we support three types of aggregate, “environment”, “message” and “constant”. |
Response
| Name |
In |
Type |
Description |
|---|
| type |
body |
string |
Type of aggregate, we support three types of aggregates now, “environment”, “message” and “constant”. |
| env_name (Optional) |
body |
string |
Environment name of the aggregate, when the aggregate type is “environment”, this attribute will appear. |
| aggregates |
body |
object |
The aggregates information. |
Examples
Example Get Environment Aggregate
Request
http://korlev-calipso-testing.cisco.com:8000/aggregates?env_name=Mirantis-Liberty-API&type=environment
Response
{
“env_name”: “Mirantis-Liberty-API”,
“type”: “environment”,
“aggregates”: {
“object_types”: {
“projects_folder”: 1,
“instances_folder”: 3,
“otep”: 3,
“region”: 1,
“vedge”: 3,
“networks_folder”: 2,
“project”: 2,
“vconnectors_folder”: 3,
“availability_zone”: 2,
“vedges_folder”: 3,
“regions_folder”: 1,
“network”: 3,
“vnics_folder”: 6,
“instance”: 2,
“vservice”: 4,
“availability_zones_folder”: 1,
“vnic”: 8,
“vservices_folder”: 3,
“port”: 9,
“pnics_folder”: 3,
“network_services_folder”: 3,
“ports_folder”: 3,
“host”: 3,
“vconnector”: 6,
“network_agent”: 6,
“aggregates_folder”: 1,
“pnic”: 15,
“network_agents_folder”: 3,
“vservice_miscellenaous_folder”: 1
}
}
}
Example Get Messages Aggregate
Request
http://korlev-calipso-testing.cisco.com:8000/aggregates?type=message
Response
{
“type”: “message”,
“aggregates”: {
“levels”: {
“warn”: 5,
“info”: 10,
“error”: 10
},
“environments”: {
“Mirantis-Liberty-API”: 5,
“Mirantis-Liberty”: 10
}
}
}
Example Get Constants Aggregate
Request
http://korlev-calipso-testing.cisco.com:8000/aggregates?type=constant
Response
{
“type”: “constant”,
“aggregates”: {
“names”: {
“link_states”: 2,
“scan_statuses”: 6,
“type_drivers”: 5,
“log_levels”: 6,
“monitoring_sides”: 2,
“mechanism_drivers”: 5,
“messages_severity”: 8,
“distributions”: 16,
“link_types”: 11,
“object_types”: 10
}
}
}
Environment_configs
GET /environment_configs
Description: get environment_config details with name, or get a list of
environments_config with filters except name
Normal response code: 200
Error response code: badRequest(400), unauthorized(401), notFound(404)
Request
| Name |
In |
Type |
Description |
|---|
| name(Optional) |
query |
string |
Name of the environment. |
| distribution(Optional) |
query |
string |
The distribution of the OpenStack environment, it must be one of the distributions we support, e.g “Mirantis-8.0”.(you can get all the supported distributions by querying the distributions constants) |
| mechanism_drivers(Optional) |
query |
string |
The mechanism drivers of the environment, it should be one of the drivers in mechanism_drivers constants, e.g “ovs”. |
| type_drivers(Optional) |
query |
string |
‘flat’, ‘gre’, ‘vlan’, ‘vxlan’. |
| user(Optional) |
query |
string |
name of the environment user |
| listen(Optional) |
query |
boolean |
Indicates whether the environment is being listened. |
| scanned(Optional) |
query |
boolean |
Indicates whether the environment has been scanned. |
| monitoring_setup_done(Optional) |
query |
boolean |
Indicates whether the monitoring setup has been done. |
| operational(Optional) |
query |
string |
operational status of the environment, the possible statuses are “stopped”, “running” and “error”. |
| page(Optional) |
query |
int |
Which page is to be returned, the default is the first page, if the page is larger than the maximum page of the query, it will return an empty result set. (Page starts from 0). |
| page_size(Optional) |
query |
int |
Size of each page, the default is 1000. |
Response
| Name |
In |
Type |
Description |
|---|
| configuration |
body |
array |
List of configurations of the environment, including configurations of mysql, OpenStack, CLI, AMQP and Monitoring. |
| distribution |
body |
string |
The distribution of the OpenStack environment, it must be one of the distributions we support, e.g “Mirantis-8.0”. |
| last_scanned |
body |
string |
The date of last time scanning the environment, the format of the date is MM/DD/YY. |
| mechanism_dirvers |
body |
array |
The mechanism drivers of the environment, it should be one of the drivers in mechanism_drivers constants. |
| monitoring_setup_done |
body |
boolean |
Indicates whether the monitoring setup has been done. |
| name |
body |
string |
Name of the environment. |
| operational |
body |
boolean |
Indicates if the environment is operational. |
| scanned |
body |
boolean |
Indicates whether the environment has been scanned. |
| type |
body |
string |
Production, testing, development, etc. |
| type_drivers |
body |
string |
‘flat’, ‘gre’, ‘vlan’, ‘vxlan’. |
| user |
body |
string |
The user of the environment. |
| listen |
body |
boolean |
Indicates whether the environment is being listened. |
Examples
Example Get Environments config
Request
http://korlev-calipso-testing.cisco.com:8000/environment_configs?mechanism_drivers=ovs
**Response**
{
“distribution”: “Canonical-icehouse”,
“name”: “thundercloud”
}
Example Environment config Details
Request
http://korlev-calipso-testing.cisco.com:8000/environment_configs?name=Mirantis-Mitaka-2
Response
{
“type_drivers”: “vxlan”,
“name”: “Mirantis-Mitaka-2”,
“app_path”: “/home/yarony/osdna_prod/app”,
“scanned”: true,
“type”: “environment”,
“user”: “test”,
“distribution”: “Mirantis-9.1”,
“monitoring_setup_done”: true,
“listen”: true,
“mechanism_drivers”: [
“ovs”
],
“configuration”: [
{
“name”: “mysql”,
“user”: “root”,
“host”: “10.56.31.244”,
“port”: “3307”,
“password”: “TsbQPwP2VPIUlcFShkCFwBjX”
},
{
“name”: “CLI”,
“user”: “root”,
“host”: “10.56.31.244”,
“key”: “/home/ilia/Mirantis_Mitaka_id_rsa”
},
{
“password”: “G1VfxeJmtK5vIyNNMP4qZmXB”,
“user”: “nova”,
“name”: “AMQP”,
“port”: “5673”,
“host”: “10.56.31.244”
},
{
“name”: “Monitoring”,
“port”: “4567”,
“env_type”: “development”,
“rabbitmq_pass”: “sensuaccess”,
“rabbitmq_user”: “sensu”,
“provision”: “DB”,
“server_name”: “devtest-sensu”,
“type”: “Sensu”,
“config_folder”: “/tmp/sensu_test”
},
{
“user”: “admin”,
“name”: “OpenStack”,
“port”: “5000”,
“admin_token”: “qoeROniLLwFmoGixgun5AXaV”,
“host”: “10.56.31.244”,
“pwd”: “admin”
}
],
“_id”: “582d77ee3e149c1318b3aa54”,
“operational”: “yes”
}
POST /environment_configs
Description: create a new environment configuration.
Normal response code: 201(Created)
Error response code:
badRequest(400), unauthorized(401), notFound(404), conflict(409)
Request
| Name |
In |
Type |
Description |
|---|
| configuration(Mandatory) |
body |
array |
List of configurations of the environment, including configurations of mysql(mandatory), OpenStack(mandatory), CLI(mandatory), AMQP(mandatory) and Monitoring(Optional). |
| distribution(Mandatory) |
body |
string |
The distribution of the OpenStack environment, it must be one of the distributions we support, e.g “Mirantis-8.0”.(you can get all the supported distributions by querying the distributions constants) |
| last_scanned(Optional) |
body |
string |
The date and time of last scanning, it should follows *ISO 8610: *
YYYY-MM-DDThh:mm:ss.sss+hhmm
|
| mechanism_dirvers(Mandatory) |
body |
array |
The mechanism drivers of the environment, it should be one of the drivers in mechanism_drivers constants, e.g “OVS”. |
| name(Mandatory) |
body |
string |
Name of the environment. |
| operational(Mandatory) |
body |
boolean |
Indicates if the environment is operational. e.g. true. |
| scanned(Optional) |
body |
boolean |
Indicates whether the environment has been scanned. |
| listen(Mandatory) |
body |
boolean |
Indicates if the environment need to been listened. |
| user(Optional) |
body |
string |
The user of the environment. |
| app_path(Mandatory) |
body |
string |
The path that the app is located in. |
| type(Mandatory) |
body |
string |
Production, testing, development, etc. |
| type_drivers(Mandatory) |
body |
string |
‘flat’, ‘gre’, ‘vlan’, ‘vxlan’. |
Request Example
Post http://korlev-calipso-testing:8000/environment_configs
{
“app_path” : “/home/korenlev/OSDNA/app/”,
“configuration” : [
{
“host” : “172.23.165.21”,
“name” : “mysql”,
“password” : “password”,
“port” : NumberInt(3306),
“user” : “root”,
“schema” : “nova”
},
{
“name” : “OpenStack”,
“host” : “172.23.165.21”,
“admin_token” : “TL4T0I7qYNiUifH”,
“admin_project” : “admin”,
“port” : “5000”,
“user” : “admin”,
“pwd” : “admin”
},
{
“host” : “172.23.165.21”,
“key” : “/home/yarony/.ssh/juju_id_rsa”,
“name” : “CLI”,
“user” : “ubuntu”
},
{
“name” : “AMQP”,
“host” : “10.0.0.1”,
“port” : “5673”,
“user” : “User”,
“password” : “abcd1234”
},
{
“config_folder” : “/tmp/sensu_test_liberty”,
“provision” : “None”,
“env_type” : “development”,
“name” : “Monitoring”,
“port” : “4567”,
“rabbitmq_pass” : “sensuaccess”,
“rabbitmq_user” : “sensu”,
“server_name” : “devtest-sensu”,
“type” : “Sensu”
}
],
“distribution” : “Canonical-icehouse”,
“last_scanned” : “2017-02-13T16:07:15Z”,
“listen” : true,
“mechanism_drivers” : [
“OVS”
],
“name” : “thundercloud”,
“operational” : “yes”,
“scanned” : false,
“type” : “environment”,
“type_drivers” : “gre”,
“user” : “WS7j8oTbWPf3LbNne”
}
Response
Successful Example
{
“message”: “created environment_config for Mirantis-Liberty”
}
Copyright (c) 2017 Koren Lev (Cisco Systems), Yaron Yogev (Cisco Systems) and others
All rights reserved. This program and the accompanying materials
are made available under the terms of the Apache License, Version 2.0
which accompanies this distribution, and is available at
http://www.apache.org/licenses/LICENSE-2.0
Project “Calipso” tries to illuminate complex virtual networking with
real time operational state visibility for large and highly distributed
Virtual Infrastructure Management (VIM).
Calipso provides visible insights using smart discovery and virtual
topological representation in graphs, with monitoring per object in the
graph inventory to reduce error vectors and troubleshooting, maintenance
cycles for VIM operators and administrators.
Calipso model, described in this document, was built for
multi-environment and many VIM variances, the model was tested
successfully (as of Aug 27th) against 60 different VIM
variances (Distributions, Versions, Networking Drivers and Types).
Table of Contents
Calipso.io Objects Model 1
1 Environments config 4
2 Inventory objects 6
2.1 Host 6
2.2 physical NIC (pNIC) 7
2.3 Bond 7
2.4 Instance 7
2.5 virtual Service (vService) 7
2.6 Network 7
2.7 virtual NIC (vNIC) 7
2.8 Port 8
2.9 virtual Connector (vConnector) 8
2.10 virtual Edge (vEdge) 8
2.11 Overlay-Tunnel-Endpoint (OTEP) 8
2.12 Network_segment 8
2.13 Network_Agent 8
2.14 Looking up Calipso objects details 9
3 Link Objects 10
3.1 Link types 11
4 Clique objects 11
4.1 Clique types 11
5 Supported Environments 12
6 System collections 14
6.1 Attributes_for_hover_on_data 14
6.2 Clique_constraints 14
6.3 Connection_tests 14
6.4 Messages 14
6.5 Network_agent_types 14
6.6 Roles, Users 15
6.7 Statistics 15
6.8 Constants 15
6.9 Constants-env_types 15
6.10 Constants-log_levels 15
6.11 Constants-mechanism_drivers 15
6.12 Constants-type_drivers 15
6.13 Constants-environment_monitoring_types 15
6.14 Constants-link_states 15
6.15 Constants-environment_provision_types 15
6.16 Constants-environment_operational_status 16
6.17 Constants-link_types 16
6.18 Constants-monitoring_sides 16
6.19 Constants-object_types 16
6.20 Constants-scans_statuses 16
6.21 Constants-distributions 16
6.22 Constants-distribution_versions 16
6.23 Constants-message_source_systems 16
6.24 Constants-object_types_for_links 16
6.25 Constants-scan_object_types 17
Environments config
Environment is defined as a certain type of Virtual Infrastructure
facility the runs under a single unified Management (like an
OpenStack facility).
Everything in Calipso application rely on environments config, this
is maintained in the “environments_config” collection in the
mongo Calipso DB.
Environment configs are pushed down to Calipso DB either through UI
or API (and only in OPNFV case Calipso provides an automated program
to build all needed environments_config parameters for an ‘Apex’
distribution automatically).
When scanning and discovering items Calipso uses this configuration
document for successful scanning results, here is an example of an
environment config document:
**{ **
**“name”: “DEMO-ENVIRONMENT-SCHEME”, **
**“enable_monitoring”: true, **
**“last_scanned”: “filled-by-scanning”, **
**“app_path”: “/home/scan/calipso_prod/app”, **
**“type”: “environment”, **
**“distribution”: “Mirantis”, **
**“distribution_version”: “8.0”, **
**“mechanism_drivers”: [“OVS”], **
“type_drivers”: “vxlan”
**“operational”: “stopped”, **
**“listen”: true, **
**“scanned”: false, **
“configuration”: [
{
**“name”: “OpenStack”, **
**“port”:”5000”, **
**“user”: “adminuser”, **
**“pwd”: “dummy_pwd”, **
**“host”: “10.0.0.1”, **
“admin_token”: “dummy_token”
**}, **
{
**“name”: “mysql”, **
**“pwd”: “dummy_pwd”, **
**“host”: “10.0.0.1”, **
**“port”: “3307”, **
“user”: “mysqluser”
**}, **
{
**“name”: “CLI”, **
**“user”: “sshuser”, **
**“host”: “10.0.0.1”, **
“pwd”: “dummy_pwd”
**}, **
{
**“name”: “AMQP”, **
**“pwd”: “dummy_pwd”, **
**“host”: “10.0.0.1”, **
**“port”: “5673”, **
“user”: “rabbitmquser”
**}, **
{
**“name”: “Monitoring”, **
**“ssh_user”: “root”, **
**“server_ip”: “10.0.0.1”, **
**“ssh_password”: “dummy_pwd”, **
**“rabbitmq_pass”: “dummy_pwd”, **
**“rabbitmq_user”: “sensu”, **
**“rabbitmq_port”: “5671”, **
**“provision”: “None”, **
**“env_type”: “production”, **
**“ssh_port”: “20022”, **
**“config_folder”: “/local_dir/sensu_config”, **
**“server_name”: “sensu_server”, **
**“type”: “Sensu”, **
“api_port”: NumberInt(4567)
**}, **
{
**“name”: “ACI”, **
**“user”: “admin”, **
**“host”: “10.1.1.104”, **
“pwd”: “dummy_pwd”
}
**], **
**“user”: “wNLeBJxNDyw8G7Ssg”, **
“auth”: {
“view-env”: [
“wNLeBJxNDyw8G7Ssg”
**], **
“edit-env”: [
“wNLeBJxNDyw8G7Ssg”
]
**}, **
}
Here is a brief explanation of the purpose of major keys in this
environment configuration doc:
Distribution: captures type of VIM, used for scanning of
objects, links and cliques.
Distribution_version: captures version of VIM distribution,
used for scanning of objects, links and cliques.
Mechanism_driver: captures virtual switch type used by the VIM,
used for scanning of objects, links and cliques.
Type_driver: captures virtual switch tunneling type used by the
switch, used for scanning of objects, links and cliques.
Listen: defines whether or not to use Calipso listener against
the VIM BUS for updating inventory in real-time from VIM events.
Scanned: defines whether or not Calipso ran a full and a
successful scan against this environment.
Last_scanned: end time of last scan.
Operational: defines whether or not VIM environment endpoints
are up and running.
Enable_monitoring: defines whether or not Calipso should deploy
monitoring of the inventory objects running inside all environment
hosts.
Configuration-OpenStack: defines credentials for OpenStack API
endpoints access.
Configuration-mysql: defines credentials for OpenStack DB
access.
Configuration-CLI: defines credentials for servers CLI access.
Configuration-AMQP: defines credentials for OpenStack BUS
access.
Configuration-Monitoring: defines credentials and setup for
Calipso sensu server (see monitoring-guide for details).
Configuration-ACI: defines credentials for ACI switched
management API, if exists.
User and auth: used for UI authorizations to view and edit this
environment.
App-path: defines the root directory of the scanning
application.
Inventory objects
Calipso’s success in scanning, discovering and analyzing many (60 as
of 27th Aug 2017) variances of virtual infrastructures lies
with its objects model and relationship definitions (model was
tested even against a vSphere VMware environment).
Those objects are the real-time processes and systems that are built
by workers and agents on the virtual infrastructure servers.
All Calipso objects are maintained in the “inventory”
collection.
Here are the major objects defined in Calipso inventory in order to
capture the real-time state of networking:
Host
It’s the physical server that runs all virtual objects, typically a
hypervisor or a containers hosting machine.
It’s typically a bare-metal server, in some cases it might be
virtual (running “nesting” VMs as second virtualization layer inside
it).
physical NIC (pNIC)
It’s the physical Ethernet Network Interface Card attached to the
Host, typically several of those are available on a host, in some
cases few of those are grouped (bundled) together into etherchannel
bond interfaces.
For capturing data from real infrastructure devices Calipso created
2 types of pNICs: host_pnic (pNICs on the servers) and switch_pnic
(pNICs on the physical switches). Calipso currently discovers host
to switch physical connections only in some types of switches (Cisco
ACI as of Aug 27th 2017).
Bond
It’s a logical Network Interface using etherchannel standard
protocols to form a group of pNICs providing enhanced throughput
for communications to/from the host.
Calipso currently maintains bond details inside a host_pnic object.
Instance
It’s the virtual server created for running a certain application or
function. Typically it’s a Virtual Machine, sometimes it’s a
Container.
virtual Service (vService)
It’s a process/system that provides some type of networking service
to instances running on networks, some might be deployed as
namespaces and some might deploy as VM or Container, for example:
DHCP server, Router, Firewall, Load-Balancer, VPN service and
others. Calipso categorized vServices accordingly.
Network
It’s an abstracted object, illustrating and representing all the
components (see below) that builds and provides communication
services for several instances and vServices.
virtual NIC (vNIC)
There are 2 types - instance vNIC and vService vNIC:
- Instance vNIC: It’s the virtual Network Interface Card attached to
the Instance and used by it for communications from/to that instance.
- vService vNIC: It’s the virtual Network Interface Card attached to
the vService used by it for communications from/to that vService.
Port
It’s an abstracted object representing the attachment point for an
instance or a vService into the network, in reality it’s fulfilled
by deployment of vNICs on hosts.
virtual Connector (vConnector)
It’s a process/system that provides layer 2 isolation for a specific
network inside the host (isolating traffic from other networks).
Examples: Linux Bridge, Bridge-group, port-group etc.
virtual Edge (vEdge)
It’s a process/system that provides switching and routing services
for instances and/or vServices running on a specific host. It
function as an edge device between virtual components running on
that host and the pNICs on that host, making sure traffic is
maintained and still isolated across different networks.
Examples: Open Virtual Switch, Midonet, VPP.
Overlay-Tunnel-Endpoint (OTEP)
It’s an abstracted object representing the end-point on the host
that runs a certain tunneling technology to provide isolation across
networks and hosts for packets leaving and entering the pNICs of a
specific host. Examples: VXLAN tunnels endpoints, GRE tunnels
endpoints etc.
Network_segment
It’s the specific segment used inside the “overlay tunnel” to
represent traffic from a specific network, this depends on the
specific type (encapsulation) of the OTEP.
Calipso currently maintains segments details inside a network
object.
Network_Agent
It’s a controlling software running on the hosts for orchestrating
the lifecycle of the above virtual components. Examples: DHCP agent,
L3 agent, OVS agent, Metadata agent etc.
Looking up Calipso objects details
As explained in more details in Calipso admin-guide, the underlying
database used is mongoDB. All major objects discovered by Calipso
scanning module are maintained in the “inventory” collection and
those document includes detailed attributes captured from the
infrastructure about those objects, here are the main objects
quarries to use for grabbing each of the above object types from
Calipso’s inventory:
{type:”vnic”}
{type:”vservice”}
{type:”instance”}
{type:”host_pnic”}
{type:”switch_pnic”}
{type:”vconnector”}
{type:”vedge”}
{type:”network”}
{type:”network_agent”}
{type:”otep”}
{type:”host”}
{type:”port”}
All Calipso modules (visualization, monitoring and analysis) rely on
those objects as baseline inventory items for any further
computation.
Here is an example of a query made using mongo Chef Client
application:
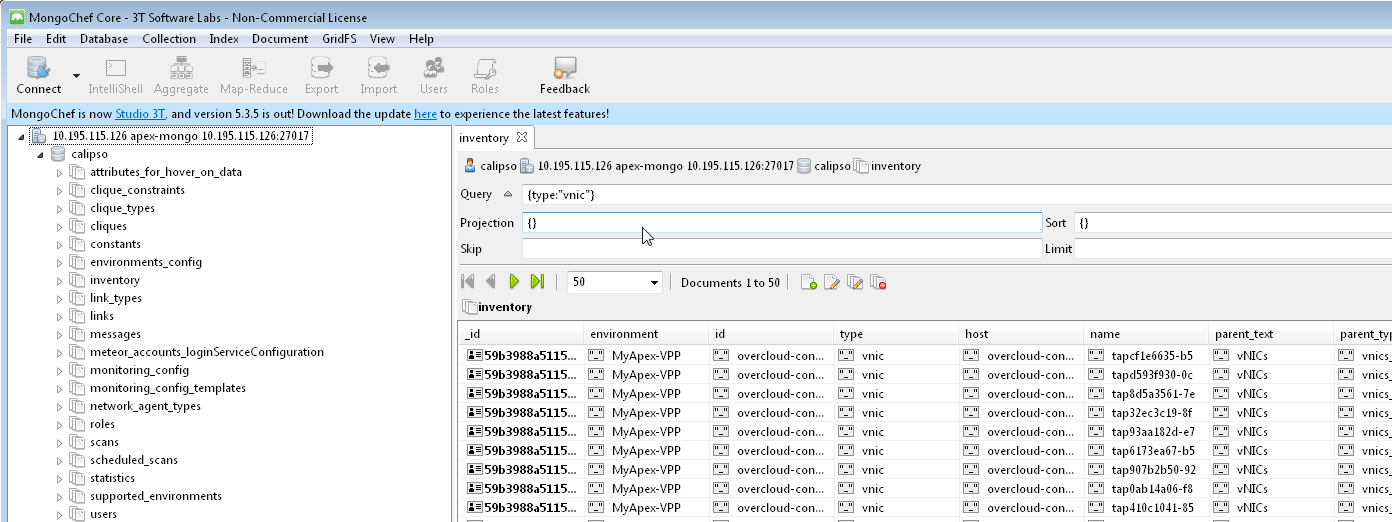
* See Calipso API-guide for details on looking up those objects
through the Calipso API.
The following simplified UML illustrates the way Calipso objects
relationships are maintained in a VIM of type OpenStack:
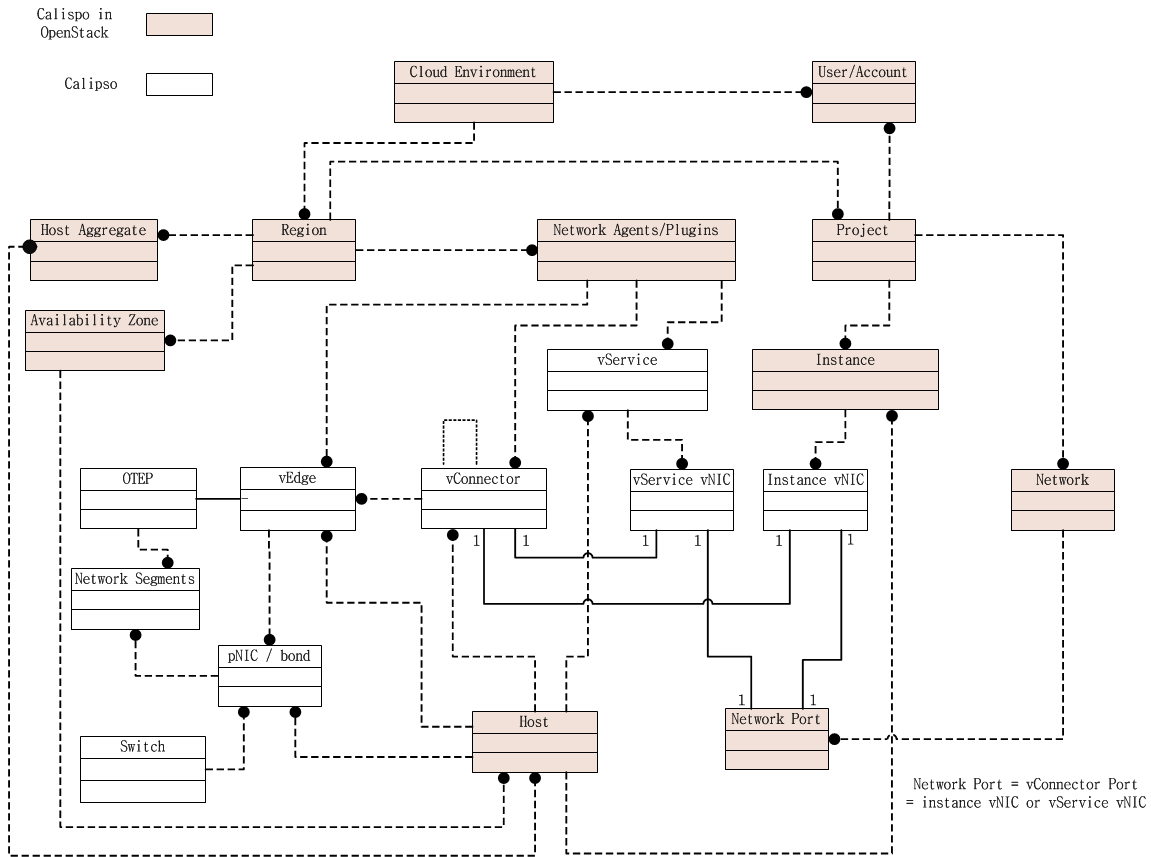
Link Objects
Calipso analyzes all objects in its inventory for relationships,
finding in real-time, which object is attached to which object and
then creates a link object representing this relationship. This
analysis finds a link that is “single hop away” - a connection from
certain object to certain object that is attached to it directly.
Derived relationships (A to B and B to C = A to C) is maintained as
‘cliques’.
Links objects are maintained in the “links” collection.
Link types
Based on the specific VIM distribution, distribution version,
mechanism driver and type driver a set of links are discovered
automatically by Calipso scanning module. Each link type is
bi-directional, it means that if a connection is discovered from A
to B, a connection also exists from B to A.
Here is the list of link types that might be discovered from a
certain environment in the current release:
{“link_type”: “instance-vnic”}
{“link_type”: “vnic-vconnector”}
{“link_type”: “vconnector-vedge”}
{“link_type”: “vedge-host_pnic”}
{“link_type: “host_pnic-network”}
{“link_type”: “vedge-otep”}
{“link_type”: “otep-vconnector”}
{“link_type”: “otep-host_pnic”}
{“link_type”: “vconnector-host_pnic”}
{“link_type”: “vnic-vedge”}
{“link_type”: “vservice-vnic”}
{“link_type”: “switch_pnic-host_pnic”}
{“link_type”: “switch_pnic-switch_pnic”}
{“link_type”: “switch_pnic-switch”}
A successful completion of scanning and discovery means that all
inventory objects, link objects and clique objects (see below) are
found and accurately representing real-time state of the virtual
networking on the specific environment.
Clique objects
Cliques are lists of links. Clique represent a certain path in the
virtual networking infrastructure that an administrator is
interested in, this is made to allow easier searching and finding of
certain points of interest (“focal point”).
Clique types
Based on the specific VIM distribution, distribution version,
mechanism driver and type driver variance, Calipso scanning module
search for specific cliques using a model that is pre-populated in
its “clique_types” collection, and it depends on the
environment variance, here is an example of a clique_type:
**{ **
**“environment” : “Apex-Euphrates”, **
“link_types” : [
**“instance-vnic”, **
**“vnic-vconnector”, **
**“vconnector-vedge”, **
**“vedge-otep”, **
**“otep-host_pnic”, **
“host_pnic-network”
**], **
**“name”: “instance_clique_for_opnfv”, **
“focal_point_type”: “instance”
}
The above model instruct the Calipso scanner to create cliques with
the above list of link types for a “focal_point” that is an
“instance” type of object. We believe this is a highly customized
model for analysis of dependencies for many use cases. We have
included several clique types, common across variances supported in
this release.
The cliques themselves are then maintained in the “cliques”
collection.
To clarify this concept, here is an example for an implementation
use case in the Calipso UI module:
When the user of the UI clicks on a certain object of type=instance,
he expresses he’s wish to see a graph representing the path taken by
traffic from that specific instance (as the root source of traffic,
on that specific network) all the way down to the host pNIC and the
(abstracted) network itself.
A successful completion of scanning and discovery means that all
inventory objects, link objects and clique objects (based on the
environment clique types) are found and accurately representing
real-time state of the virtual networking on the specific
environment.
Supported Environments
As of Aug 27th 2017, Calipso application supports 60
different VIM environment variances and with each release the
purpose of the application is to maintain support and add more
variances per the VIM development cycles. The latest supported
variance and the specific functions of Calipso available for that
specific variance is captured in the “supported_environments”
collection, here are two examples of that ‘supported’ model:
1.
**{ **
“environment” : {
**“distribution” : “Apex”, **
**“distribution_version” : [“Euphrates”], **
**“mechanism_drivers” : “OVS”, **
“type_drivers” : “vxlan”
**}, **
“features” : {
**“listening” : true, **
**“scanning” : true, **
“monitoring” : false
}
}
2.
**{ **
“environment” : {
**“distribution” : “Mirantis”, **
**“distribution_version”: [“6.0”, “7.0”, “8.0”, “9.0”, “9.1”,
“10.0”], **
**“mechanism_drivers” : “OVS”, **
“type_drivers” : “vxlan”
**}, **
“features” : {
**“listening” : true, **
**“scanning” : true, **
“monitoring” : true
}
}
The examples above defines for Calipso application that:
- For an ‘Apex’ environment of version ‘Euphrates’ using OVS and vxlan,
Calipso can scan/discover all details (objects, links, cliques) but
is not yet monitoring those discovered objects.
- For a “Mirantis” environment of versions 6.0 to 10.0 using OVS and
vxlan, Calipso can scan/discover all details (objects, links,
cliques) and also monitor those discovered objects.
With each calipso release more “supported_environments” should be
added.
System collections
Calipso uses other system collections to maintain its data for scanning,
event handling, monitoring and for helping to operate the API and UI
modules, here is the recent list of collections not covered yet in other
written guides:
Attributes_for_hover_on_data
This collection maintains a list of documents describing what will be
presented on the UI popup screen when the use hover-on a specific object
type, it details which parameters or attributed from the object’s data
will be shown on the screen, making this popup fully customized.
Clique_constraints
Defines the logic on which cliques are built, currently network is the
main focus of the UI (central point of connection for all cliques in the
system), but this is customizable.
When building a clique graph, Calipso defaults to traversing all nodes
edges (links) in the graph.
In some cases we want to limit the graph so it will not expand too much
(nor forever).
For example: when we build the graph for a specific instance, we limit
the graph to only take objects from the network on which this instance
resides - otherwise the graph will show objects related to other
instances.
The constraint validation is done by checking value V from the focal
point F on the links.
For example, if an n instance has network X, we check that each link we
use either has network X (attribute “network” has value X), or does not
have the “network” attribute.
Connection_tests
This collection keeps requests from the UI or API to test the different adapters (API, DB, and CLI etc)
and their connections to the underlying VIM, making sure dynamic and real-time data will be maintained during discovery.
Messages
Aggregates all loggings from the different systems, source_system of
logs currently defined as “OpenStack” (the VIM), “Sensu” (the Monitoring
module) and “Calipso” (logs of the application itself. Messages have 6
levels of severity and can be browsed in the UI and through Calipso API.
Network_agent_types
Lists the types of networking agents supported on the VIM (per
distribution and version).
Roles, Users
Basic RBAC facility to authorize calispo UI users for certain calipso
functionalities on the UI.
Statistics
Built for detailed analysis and future functionalities, used today for
traffic analysis (capturing samples of throughputs per session on VPP
based environments).
Constants
This is an aggregated collection for many types of documents that are
required mostly by the UI and basic functionality on some scanning
classes (‘fetchers’).
Constants-env_types
Type of environments to allow for configuration on sensu monitoring
framework.
Constants-log_levels
Severity levels for messages generated.
Constants-mechanism_drivers
Mechanism-drivers allowed for UI users.
Constants-type_drivers
Type-drivers allowed for UI users.
Constants-environment_monitoring_types
Currently only “Sensu” is available, might be used for other monitoring
systems integrations.
Constants-link_states
Provides statuses for link objects, based on monitoring results.
Constants-environment_provision_types
The types of deployment options available for monitoring (see
monitoring-guide for details).
Constants-environment_operational_status
Captures the overall (aggregated) status of a curtained environment.
Constants-link_types
Lists the connections and relationships options for objects in the
inventory.
Constants-monitoring_sides
Used for monitoring auto configurations of clients and servers.
Constants-object_types
Lists the type of objects supported through scanning (inventory
objects).
Constants-scans_statuses
During scans, several statuses are shown on the UI, based on the
specific stage and results.
Constants-distributions
Lists the VIM distributions.
Constants-distribution_versions
Lists the VIM different versions of different distributions.
Constants-message_source_systems
The list of systems that can generate logs and messages.
Constants-object_types_for_links
Object_types used only for link popups on UI.
Constants-scan_object_types
Object_types used during scanning, see development-guide for details.
Constants-configuration_targets
Names of the configuration targets used in the configuration section of environment configs.
Calipso.io
Quick Start Guide
Copyright (c) 2017 Koren Lev (Cisco Systems), Yaron Yogev (Cisco Systems) and others
All rights reserved. This program and the accompanying materials
are made available under the terms of the Apache License, Version 2.0
which accompanies this distribution, and is available at
http://www.apache.org/licenses/LICENSE-2.0
Project “Calipso” tries to illuminate complex virtual networking with
real time operational state visibility for large and highly distributed
Virtual Infrastructure Management (VIM).
We believe that Stability is driven by accurate Visibility.
Calipso provides visible insights using smart discovery and virtual
topological representation in graphs, with monitoring per object in the
graph inventory to reduce error vectors and troubleshooting, maintenance
cycles for VIM operators and administrators.
Table of Contents
Calipso.io Quick Start Guide 1
1 Getting started 3
1.1 Post installation tools 3
1.2 Calipso containers details 3
1.3 Calipso containers access 5
2 Validating Calipso app 5
2.1 Validating calipso-mongo module 5
2.2 Validating calipso-scan module 7
2.3 Validating calipso-listen module 8
2.4 Validating calipso-api module 9
2.5 Validating calipso-sensu module 9
2.6 Validating calipso-ui module 10
2.7 Validating calipso-ldap module 10
Getting started
Post installation tools
Calipso administrator should first complete installation as per
install-guide document.
After all calipso containers are running she can start examining the
application using the following suggested tools:
- MongoChef : https://studio3t.com/download/ as a useful GUI client to
interact with calipso mongoDB module.
- Web Browser to access calipso-UI at the default localtion:
http://server-IP
- SSH client to access other calipso containers as needed.
- Python3 toolsets for debugging and development as needed.
Calipso containers details
Calipso is currently made of the following 7 containers:
Mongo: holds and maintains calipso’s data inventories.
LDAP: holds and maintains calipso’s user directories.
Scan: deals with automatic discovery of virtual networking from VIMs.
Listen: deals with automatic updating of virtual networking into
inventories.
API: runs calipso’s RESTful API server.
UI: runs calipso’s GUI/web server.
Sensu: runs calipso’s monitoring server.
After successful installation Calipso containers should have been
downloaded, registered and started, here are the images used:
sudo docker images
Expected results (as of Aug 2017):
REPOSITORY TAG IMAGE ID CREATED SIZE
korenlev/calipso listen 12086aaedbc3 6 hours ago 1.05GB
korenlev/calipso api 34c4c6c1b03e 6 hours ago 992MB
korenlev/calipso scan 1ee60c4e61d5 6 hours ago 1.1GB
korenlev/calipso sensu a8a17168197a 6 hours ago 1.65GB
korenlev/calipso mongo 17f2d62f4445 22 hours ago 1.31GB
korenlev/calipso ui ab37b366e812 11 days ago 270MB
korenlev/calipso ldap 316bc94b25ad 2 months ago 269MB
Typically Calipso application is fully operational at this stage and
you can jump to ‘Using Calipso’ section to learn how to use it, the
following explains how the containers are deployed by
calipso-installer.py for general reference.
Checking the running containers status and ports in use:
sudo docker ps
Expected results and details (as of Aug 2017):
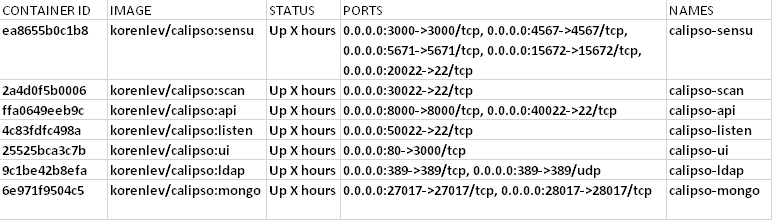
The above listed TCP ports are used by default on the hosts to map
to each calipso container, you should be familiar with these
mappings of ports per container.
Checking running containers entry-points (The commands used inside
the container):
sudo docker inspect [container-ID]
Expected results (as of Aug 2017):
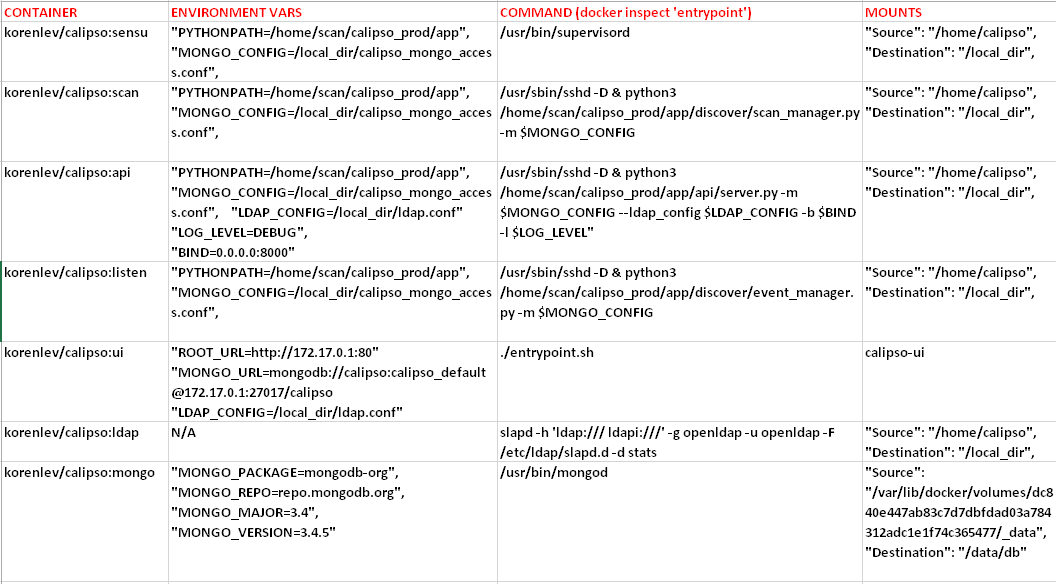
Calipso containers configuration can be listed with docker
inspect, summarized in the table above. In a none-containerized
deployment (see ‘Monolithic app install option in the install-guide)
these are the individual commands that are needed to run calipso
manually for special development needs.
The ‘calipso-sensu’ is built using sensu framework customized for
calipso monitoring design, ‘calipso-ui’ is built using meteor
framework, ‘calipso-ldap’ is built using pre-defined open-ldap
container, and as such those three are only supported as pre-built
containers.
Administrator should be aware of the following details deployed in
the containers:
calipso-api, calipso-sensu, calipso-scan and calipso-listen maps host
directory /home/calipso as volume /local_dir inside the
container.
They use calipso_mongo_access.conf and ldap.conf files for
configuration.
They use /home/scan/calipso_prod/app as the main PYTHONPATH
needed to run the different python modules per container.
Calipso-sensu is using the ‘supervisord’ process to control all sensu
server processes needed for calipso and the calipso event handler on
this container.
Calipso-ldap can be used as standalone, but is a pre-requisite for
calipso-api.
Calipso-ui needs calipso-mongo with latest scheme, to run and offer
UI services.
Calipso containers access
The different Calipso containers are also accessible using SSH and
pre-defined default credentials, here is the access details:
Calipso-listen: ssh scan@localhost –p 50022 , password = scan
Calipso-scan: ssh scan@localhost –p 30022 , password = scan
Calipso-api: ssh scan@localhost –p 40022 , password = scan
Calipso-sensu: ssh scan@localhost –p 20022 , password = scan
Calipso-ui: only accessible through web browser
Calipso-ldap: only accessible through ldap tools.
Calipso-mongo: only accessible through mongo clients like MongoChef.
Validating Calipso app
Validating calipso-mongo module
Using MongoChef client, create a new connection pointing to the
server where calipso-mongo container is running, using port 27017
and the following default credentials:
Host IP=server_IP and TCP port=27017
Username : calipso
Password : calipso_default
Auto-DB: calipso
Defaults are also configured into
/home/calipso/calipso_mongo_access.conf.
The following is a screenshot of a correct connection setup in
MongoChef:
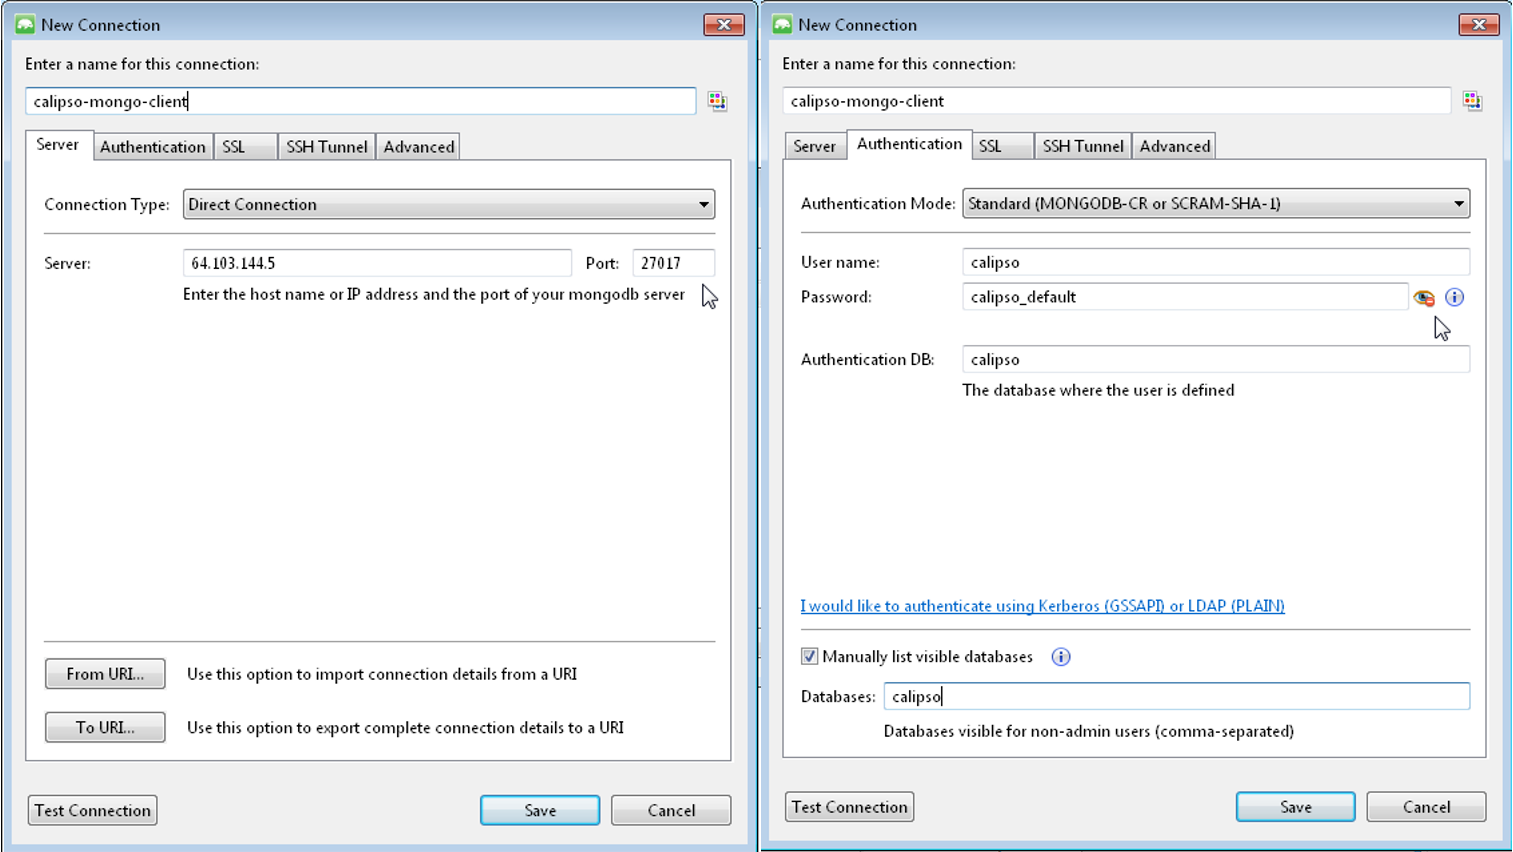
When clicking on the new defined connection the calipso DB should be
listed:
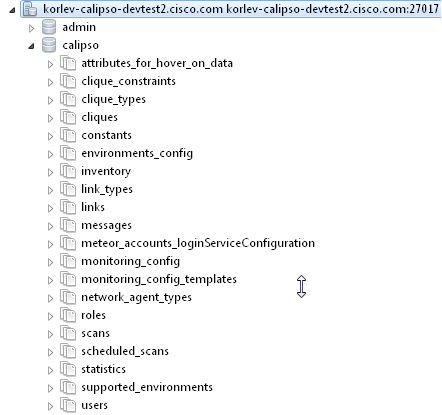
At this stage you can checkout calipso-mongo collections data and
validate as needed.
Validating calipso-scan module
Scan container is running the main calipso scanning engine that
receives requests to scan a specific VIM environment, this command
will validate that the main scan_manager.py process is running and
waiting for scan requests:
sudo docker ps # grab the containerID of calipso-scan
sudo docker logs bf5f2020028a #containerID for example
Expected results:
2017-08-28 06:11:39,231 INFO: Using inventory collection:
inventory
2017-08-28 06:11:39,231 INFO: Using links collection: links
2017-08-28 06:11:39,231 INFO: Using link_types collection:
link_types
2017-08-28 06:11:39,231 INFO: Using clique_types collection:
clique_types
2017-08-28 06:11:39,231 INFO: Using clique_constraints
collection: clique_constraints
2017-08-28 06:11:39,231 INFO: Using cliques collection: cliques
2017-08-28 06:11:39,232 INFO: Using monitoring_config collection:
monitoring_config
2017-08-28 06:11:39,232 INFO: Using constants collection:
constants
2017-08-28 06:11:39,232 INFO: Using scans collection: scans
2017-08-28 06:11:39,232 INFO: Using messages collection:
messages
2017-08-28 06:11:39,232 INFO: Using monitoring_config_templates
collection: monitoring_config_templates
2017-08-28 06:11:39,232 INFO: Using environments_config
collection: environments_config
2017-08-28 06:11:39,232 INFO: Using supported_environments
collection: supported_environments
2017-08-28 06:11:39,233 INFO: Started ScanManager with following
configuration:
Mongo config file path: /local_dir/calipso_mongo_access.conf
Scans collection: scans
Environments collection: environments_config
Polling interval: 1 second(s)
The above logs basically shows that scan_manager.py is running and
listening to scan requests (should they come in through into ‘scans’
collection for specific environment listed in ‘environments_config’
collection, refer to use-guide for details).
Validating calipso-listen module
Listen container is running the main calipso event_manager engine
that listens for events on a specific VIM BUS environment, this
command will validate that the main event_manager.py process is
running and waiting for events from the BUS:
2017-08-28 06:11:35,572 INFO: Using inventory collection:
inventory
2017-08-28 06:11:35,572 INFO: Using links collection: links
2017-08-28 06:11:35,572 INFO: Using link_types collection:
link_types
2017-08-28 06:11:35,572 INFO: Using clique_types collection:
clique_types
2017-08-28 06:11:35,572 INFO: Using clique_constraints
collection: clique_constraints
2017-08-28 06:11:35,573 INFO: Using cliques collection: cliques
2017-08-28 06:11:35,573 INFO: Using monitoring_config collection:
monitoring_config
2017-08-28 06:11:35,573 INFO: Using constants collection:
constants
2017-08-28 06:11:35,573 INFO: Using scans collection: scans
2017-08-28 06:11:35,573 INFO: Using messages collection:
messages
2017-08-28 06:11:35,573 INFO: Using monitoring_config_templates
collection: monitoring_config_templates
2017-08-28 06:11:35,573 INFO: Using environments_config
collection: environments_config
2017-08-28 06:11:35,574 INFO: Using supported_environments
collection: supported_environments
2017-08-28 06:11:35,574 INFO: Started EventManager with following
configuration:
Mongo config file path: /local_dir/calipso_mongo_access.conf
Collection: environments_config
Polling interval: 5 second(s)
The above logs basically shows that event_manager.py is running and
listening to event (should they come in through from VIM BUS) and
listed in ‘environments_config’ collection, refer to use-guide for
details).
Validating calipso-api module
Scan container is running the main calipso API that allows
applications to integrate with calipso inventory and functions, this
command will validate it is operational:
sudo docker ps # grab the containerID of calipso-scan
sudo docker logs bf5f2020028c #containerID for example
Expected results:
2017-08-28 06:11:38,118 INFO: Using inventory collection:
inventory
2017-08-28 06:11:38,119 INFO: Using links collection: links
2017-08-28 06:11:38,119 INFO: Using link_types collection:
link_types
2017-08-28 06:11:38,119 INFO: Using clique_types collection:
clique_types
2017-08-28 06:11:38,120 INFO: Using clique_constraints
collection: clique_constraints
2017-08-28 06:11:38,120 INFO: Using cliques collection: cliques
2017-08-28 06:11:38,121 INFO: Using monitoring_config collection:
monitoring_config
2017-08-28 06:11:38,121 INFO: Using constants collection:
constants
2017-08-28 06:11:38,121 INFO: Using scans collection: scans
2017-08-28 06:11:38,121 INFO: Using messages collection:
messages
2017-08-28 06:11:38,121 INFO: Using monitoring_config_templates
collection: monitoring_config_templates
2017-08-28 06:11:38,122 INFO: Using environments_config
collection: environments_config
2017-08-28 06:11:38,122 INFO: Using supported_environments
collection: supported_environments
[2017-08-28 06:11:38 +0000] [6] [INFO] Starting gunicorn 19.4.5
[2017-08-28 06:11:38 +0000] [6] [INFO] Listening at:
http://0.0.0.0:8000 (6)
[2017-08-28 06:11:38 +0000] [6] [INFO] Using worker: sync
[2017-08-28 06:11:38 +0000] [12] [INFO] Booting worker with pid:
12
The above logs basically shows that the calipso api is running and
listening on port 8000 for requests.
Validating calipso-sensu module
Sensu container is running several servers (currently unified into
one for simplicity) and the calipso event handler (refer to
use-guide for details), here is how to validate it is operational:
ssh scan@localhost -p 20022 # default password = scan
sudo /etc/init.d/sensu-client status
sudo /etc/init.d/sensu-server status
sudo /etc/init.d/sensu-api status
sudo /etc/init.d/uchiwa status
sudo /etc/init.d/rabbitmq-server status
Expected results:
Each of the above should return a pid and a ‘running’ state +
ls /home/scan/calipso_prod/app/monitoring/handlers # should list
monitor.py module.
The above logs basically shows that calipso-sensu is running and
listening to monitoring events from sensu-clients on VIM hosts,
refer to use-guide for details).
Validating calipso-ui module
UI container is running several JS process with the back-end
mongoDB, it needs data to run and it will not run if any connection
with DB is lost, this is per design. To validate operational state
of the UI simply point a Web Browser to : http://server-IP:80 and
expect a login page. Use admin/123456 as default credentials to
login:
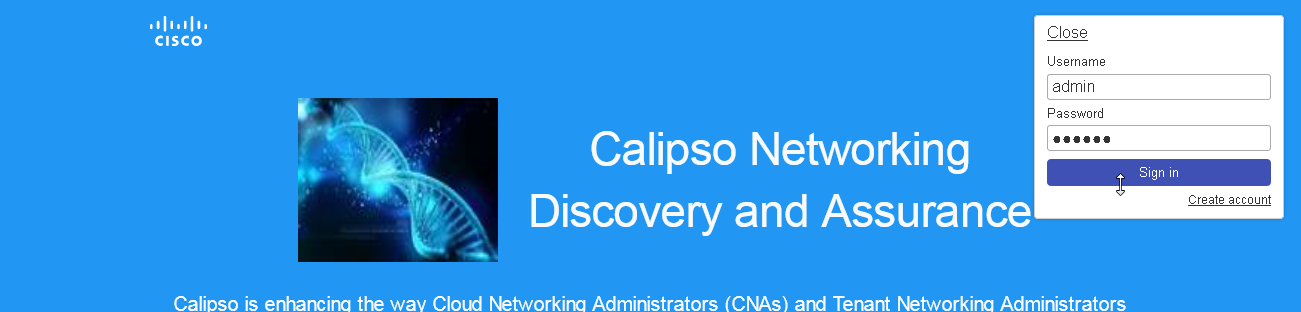
Validating calipso-ldap module
LDAP container is running a common user directory for integration
with UI and API modules, it is placed with calipso to validate
interaction with LDAP. The main configuration needed for
communication with it is stored by calipso installer in
/home/calipso/ldap.conf and accessed by the API module. We assume in
production use-cases a corporate LDAP server might be used instead,
in that case ldap.conf needs to be changed and point to the
corporate server.
To validate LDAP container, you will need to install
openldap-clients, using:
yum -y install openldap-clients / apt-get install
openldap-clients
Search all LDAP users inside that ldap server:
ldapsearch -H ldap://localhost -LL -b ou=Users,dc=openstack,dc=org
x
Admin user details on this container (user=admin, pass=password):
LDAP username : cn=admin,dc=openstack,dc=org
cn=admin,dc=openstack,dc=org’s password : password
Account BaseDN [DC=168,DC=56,DC=153:49154]:
ou=Users,dc=openstack,dc=org
Group BaseDN [ou=Users,dc=openstack,dc=org]:
Add a new user (admin credentials needed to bind to ldap and add
users):
Create a /tmp/adduser.ldif file, use this example:
dn: cn=Myname,ou=Users,dc=openstack,dc=org // which org, which ou
etc ...
objectclass: inetOrgPerson
cn: Myname // match the dn details !
sn: Koren
uid: korlev
userpassword: mypassword // the password
carlicense: MYCAR123
homephone: 555-111-2222
mail: korlev@cisco.com
description: koren guy
ou: calipso Department
Run this command to add the above user attributes into the ldap
server:
ldapadd -x -D cn=admin,dc=openstack,dc=org -w password -c -f
/tmp/adduser.ldif // for example, the above file is used and the
admin bind credentials who is, by default, authorized to add users.
You should see “user added” message if successful
Validate users against this LDAP container:
Wrong credentials:
ldapwhoami -x -D cn=Koren,ou=Users,dc=openstack,dc=org -w
korlevwrong
Response: ldap_bind: Invalid credentials (49)
Correct credentials:
ldapwhoami -x -D cn=Koren,ou=Users,dc=openstack,dc=org -w korlev
Response: dn:cn=Koren,ou=Users,dc=openstack,dc=org
The reply ou/dc details can be used by any application (UI and API
etc) for mapping users to some application specific group…
- If all the above validations passed, Calipso is now fully functional,
refer to admin-guide for more details.
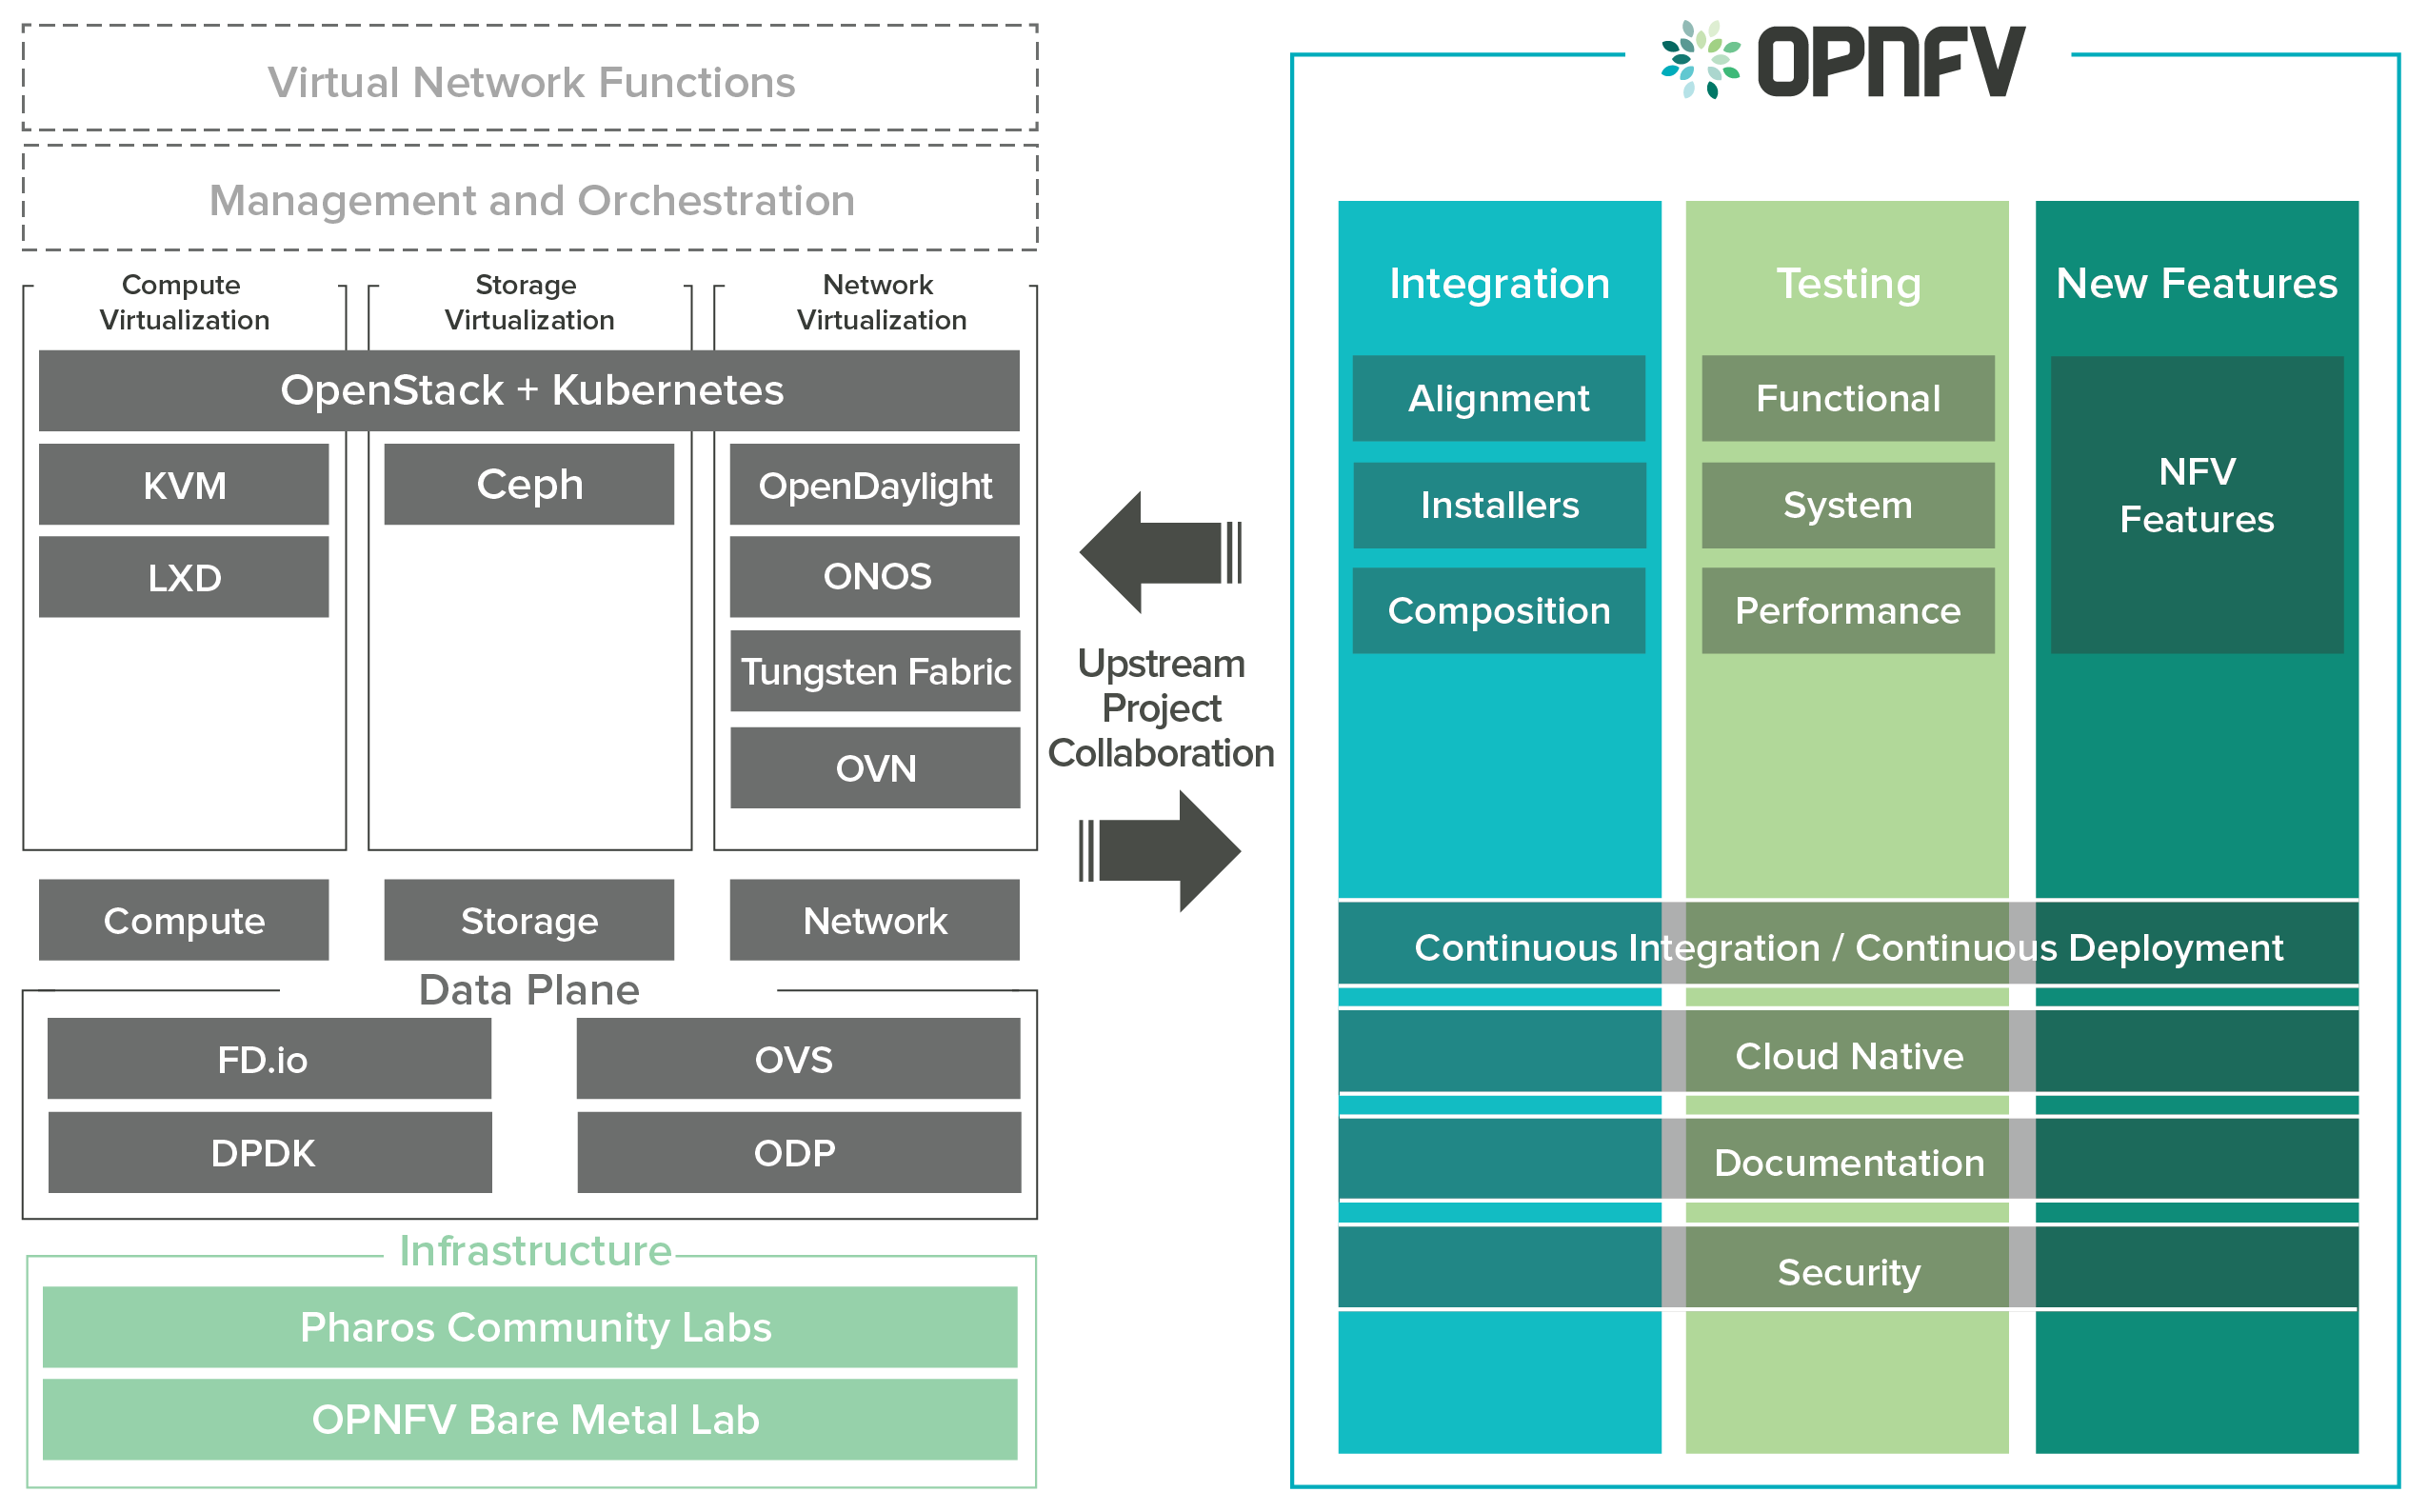

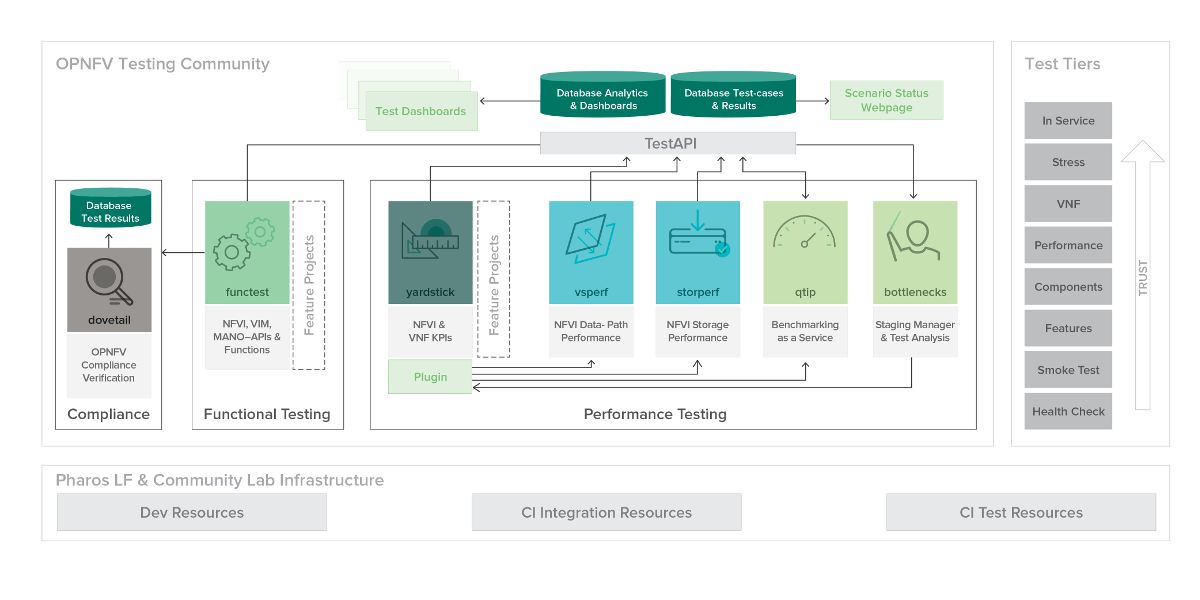
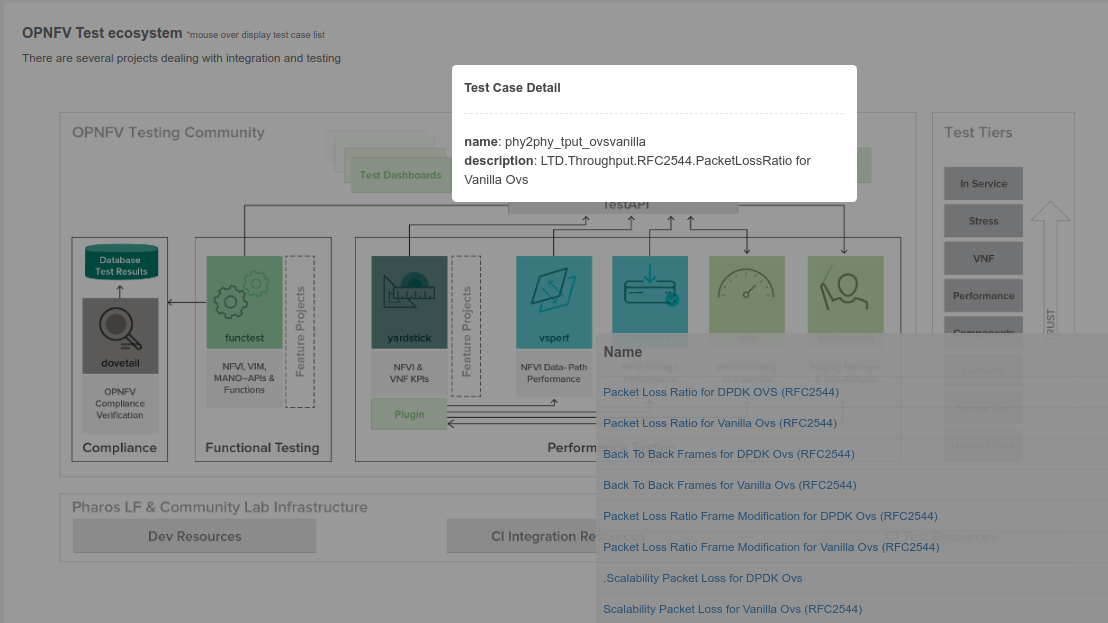
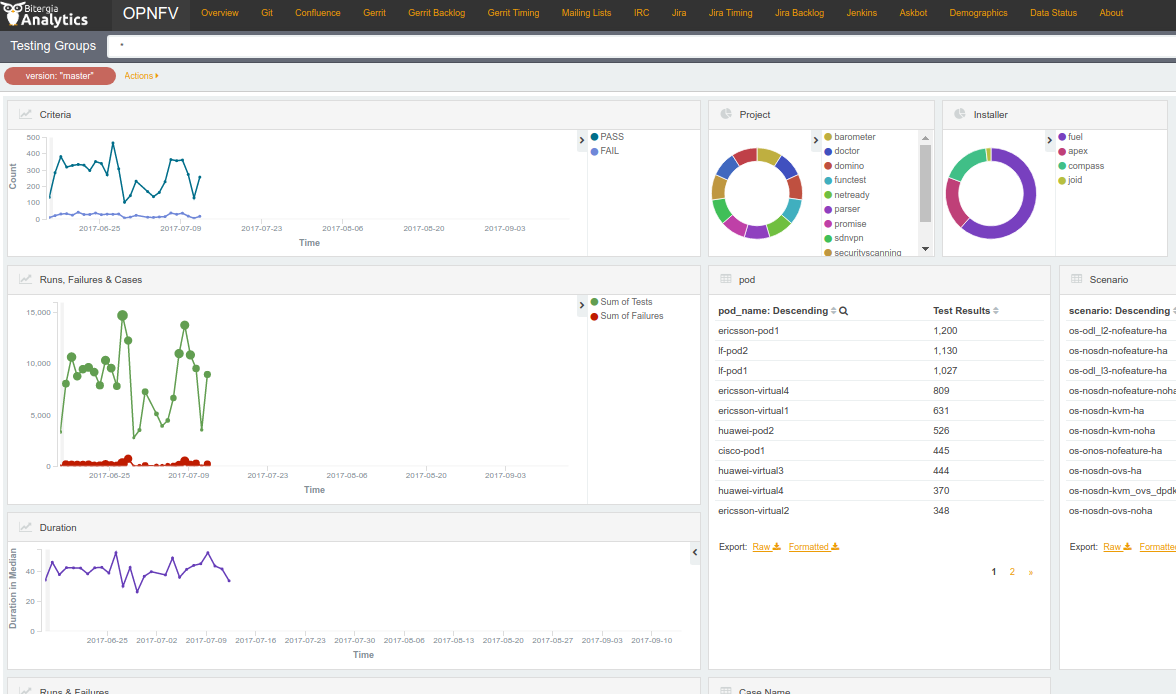
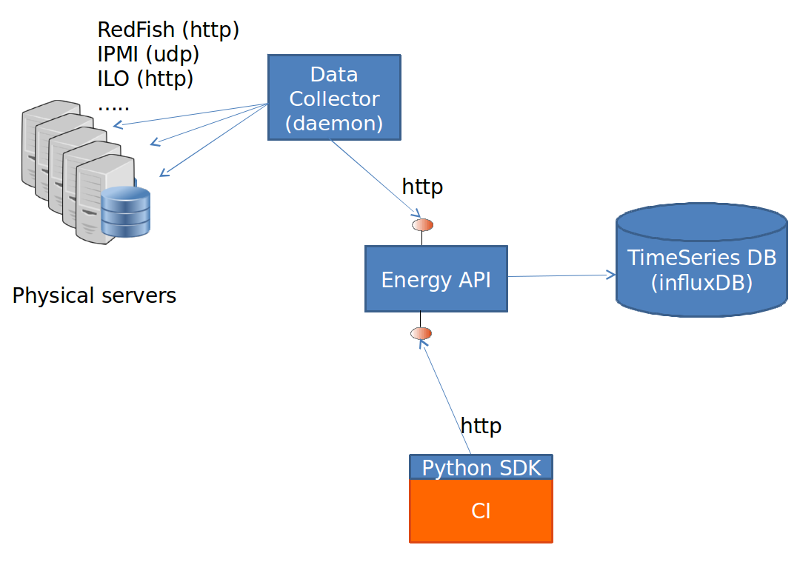
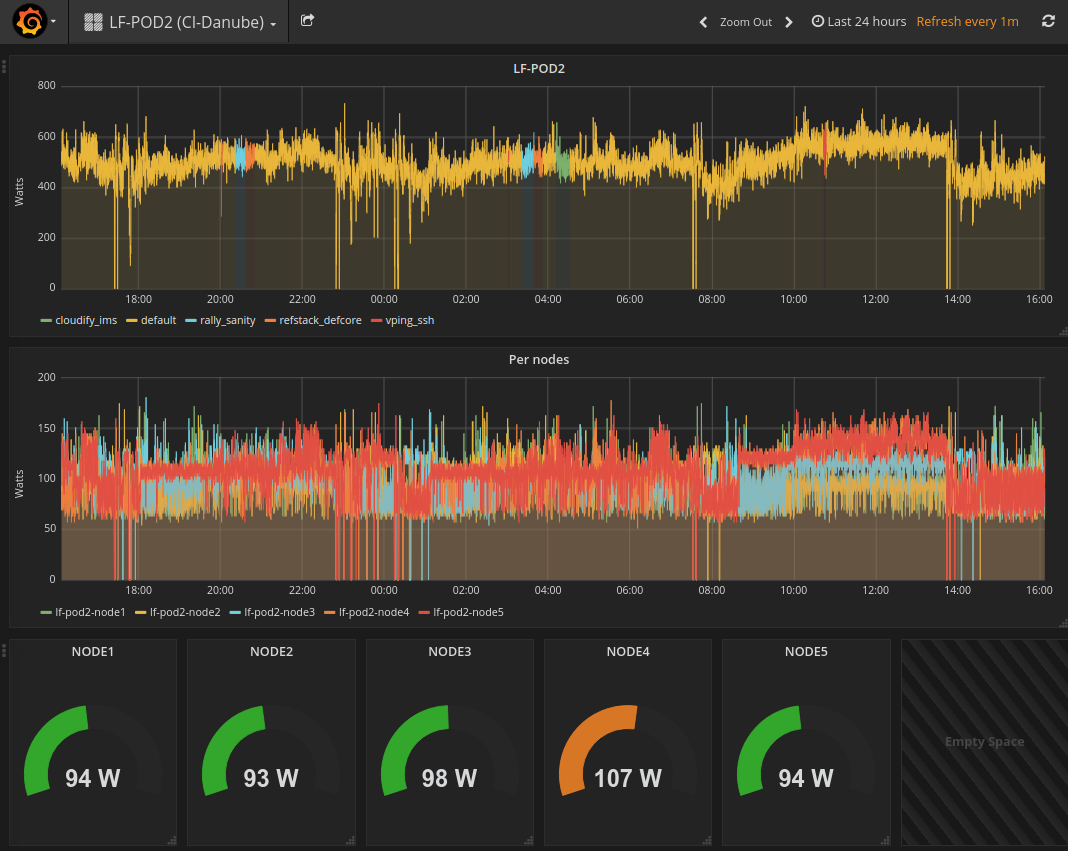


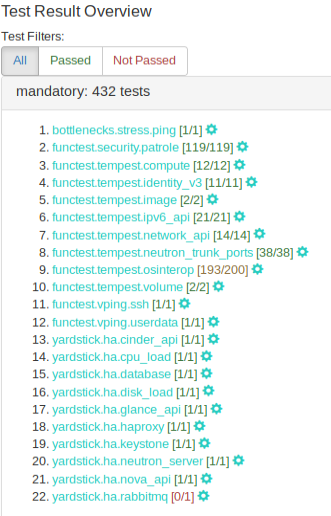
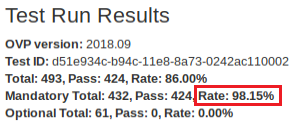
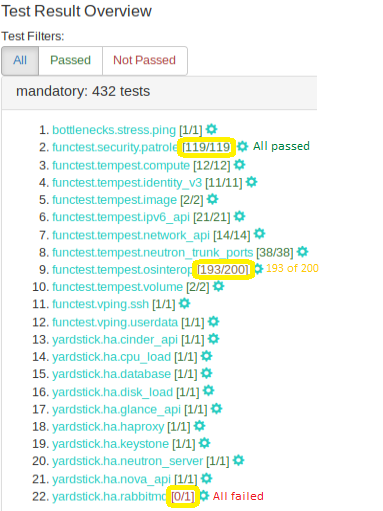
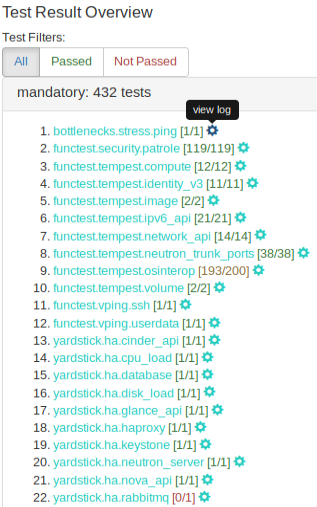
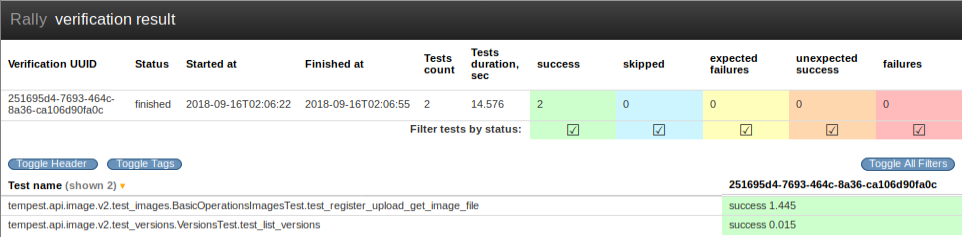
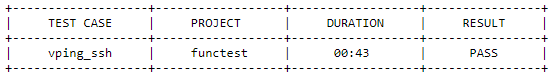
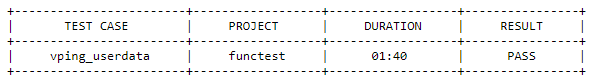

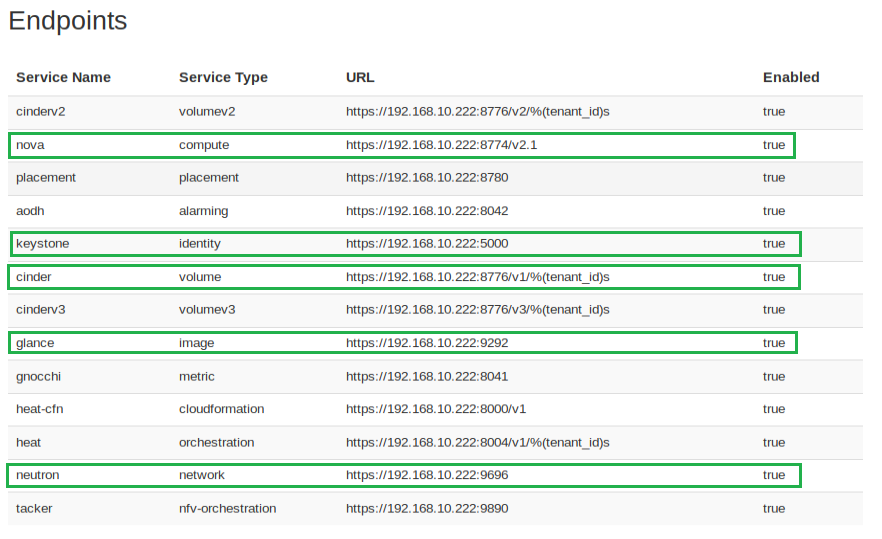
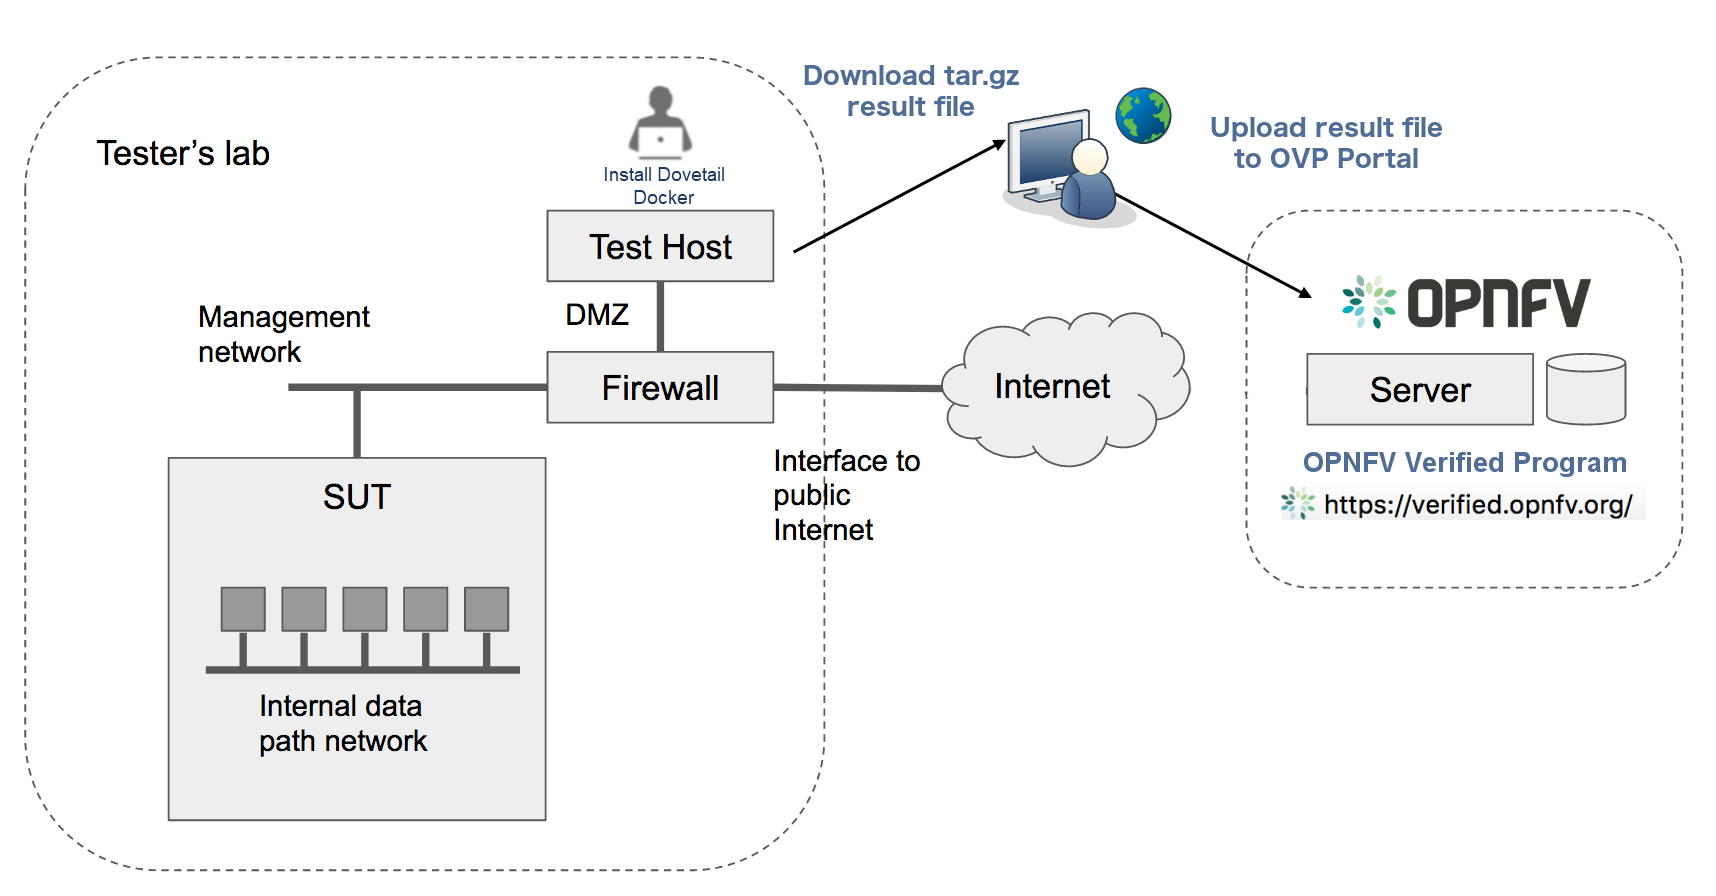
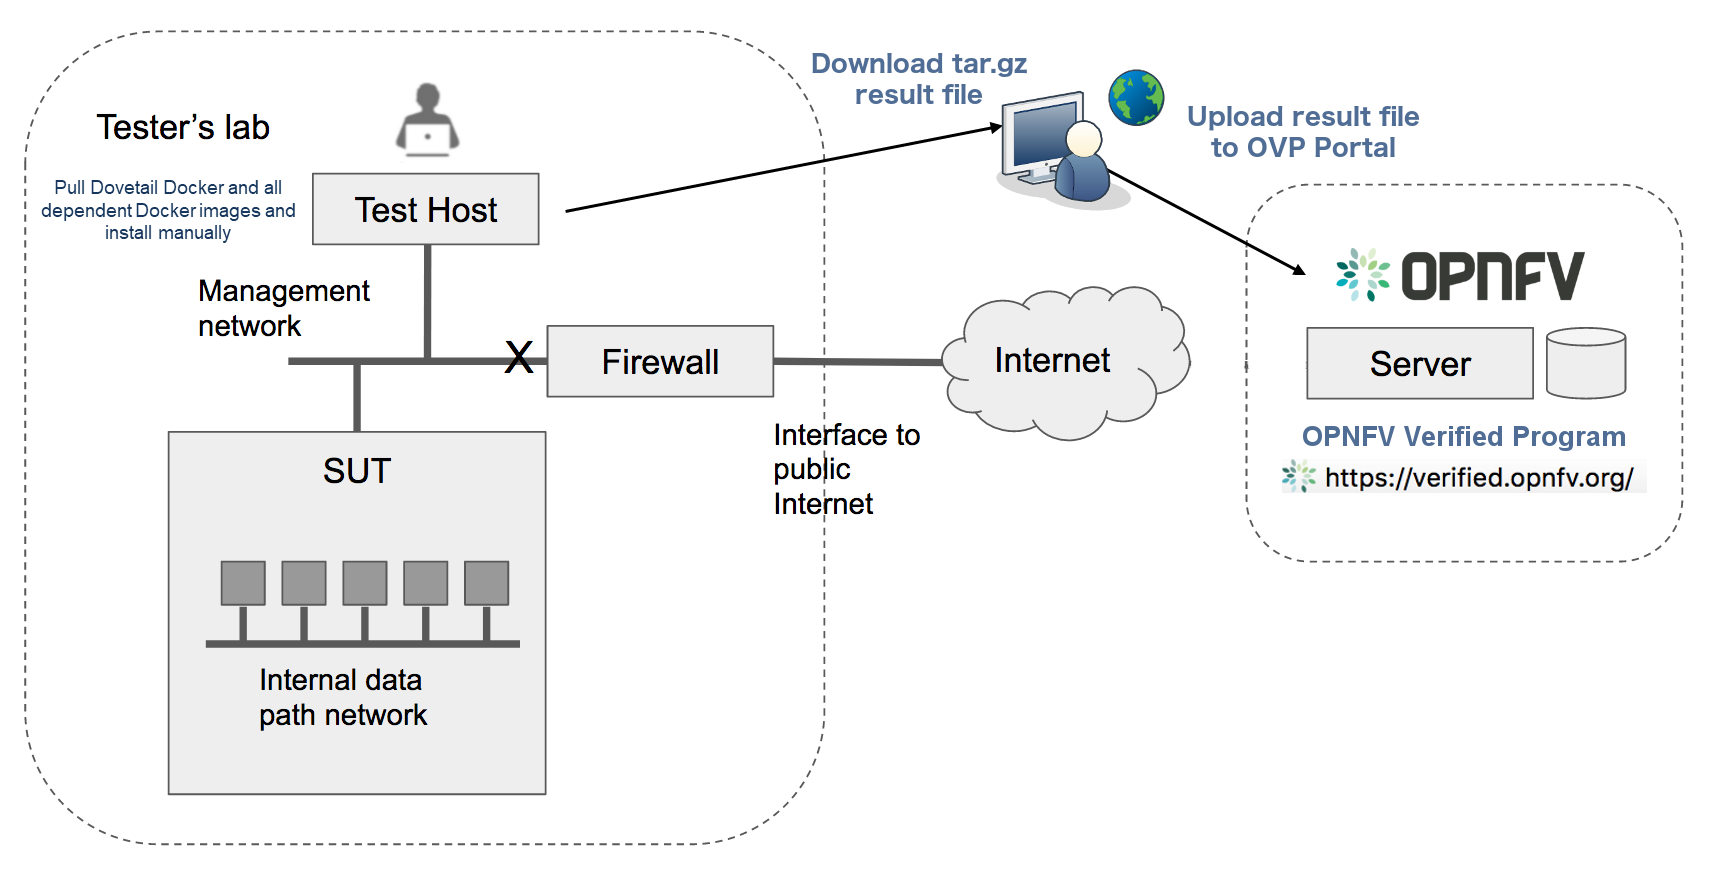
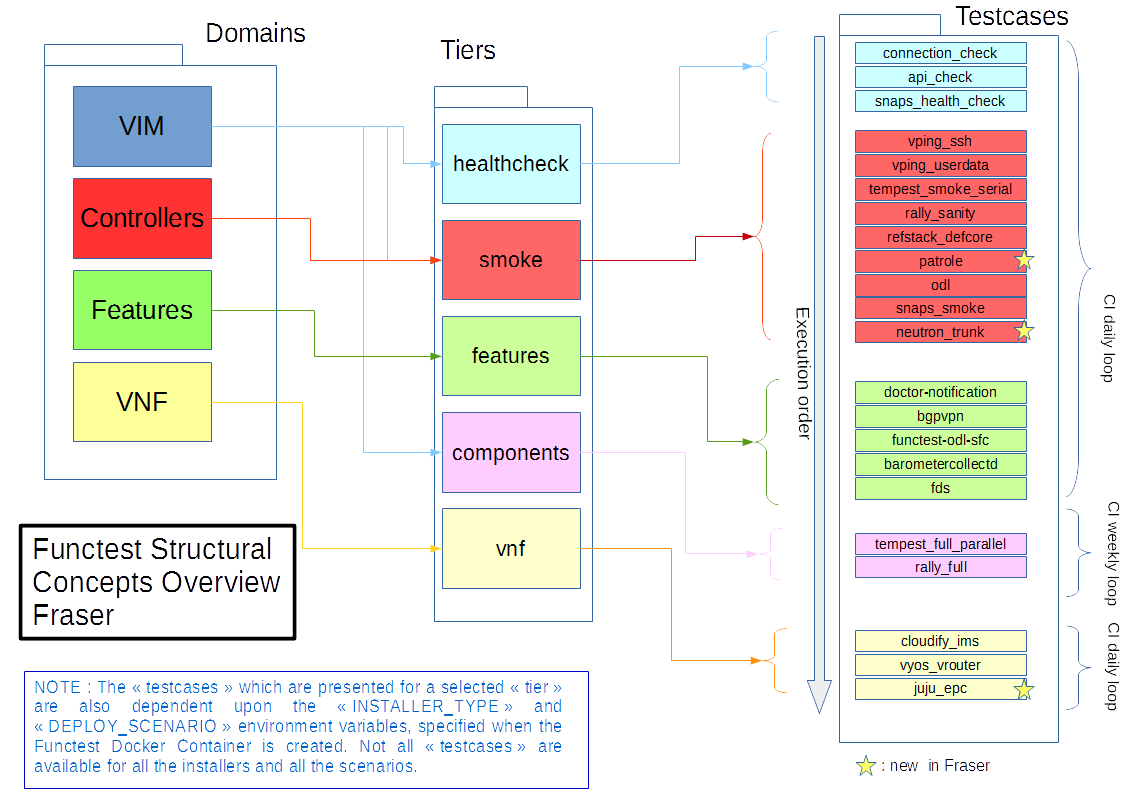
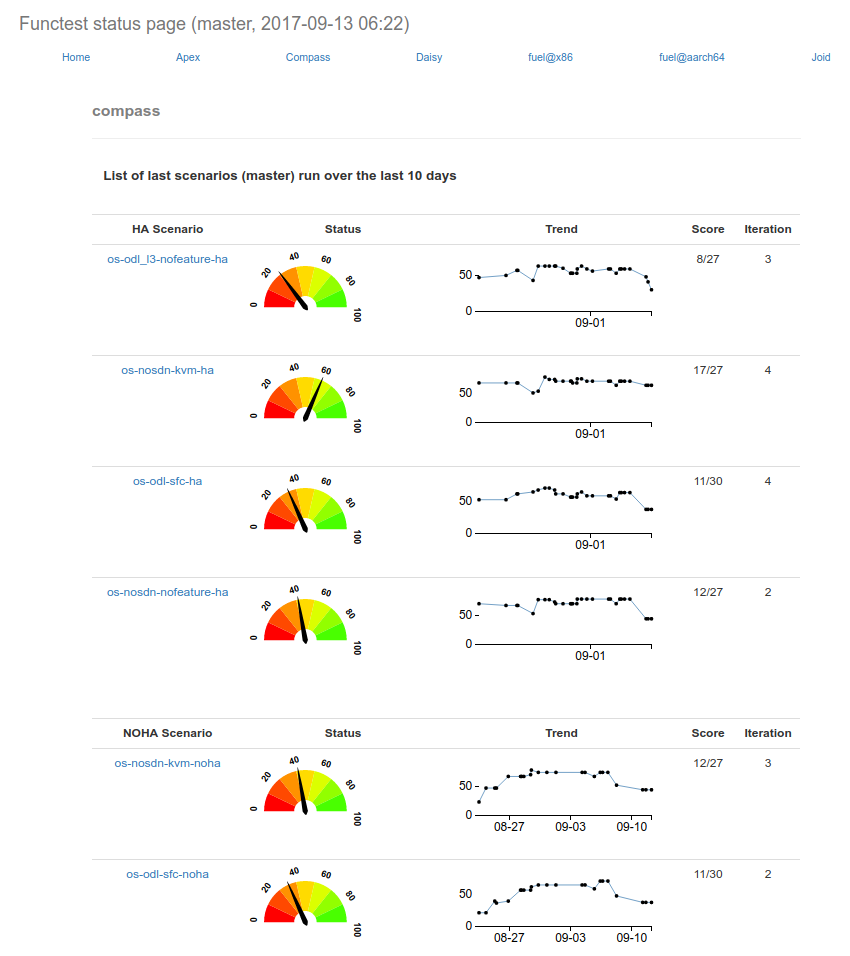
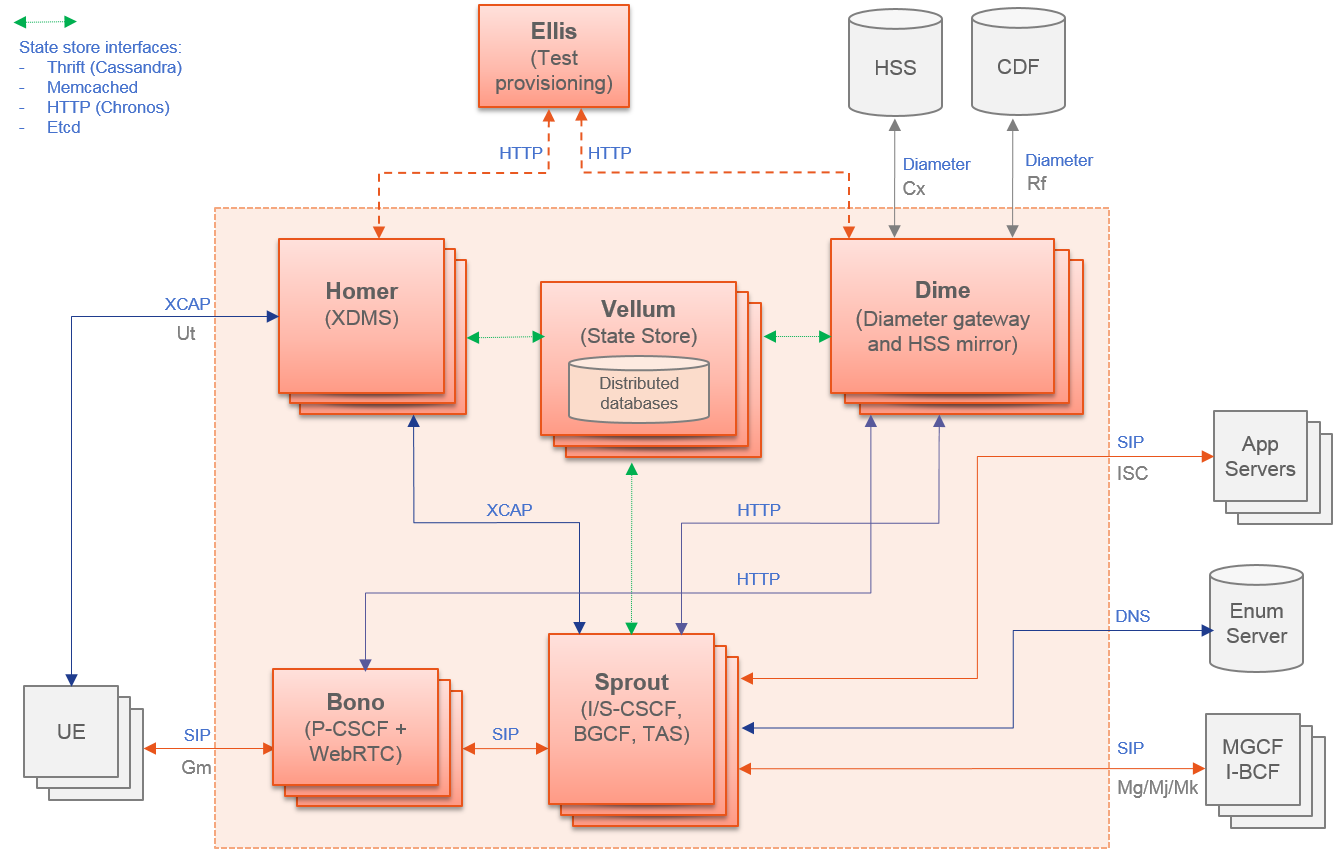
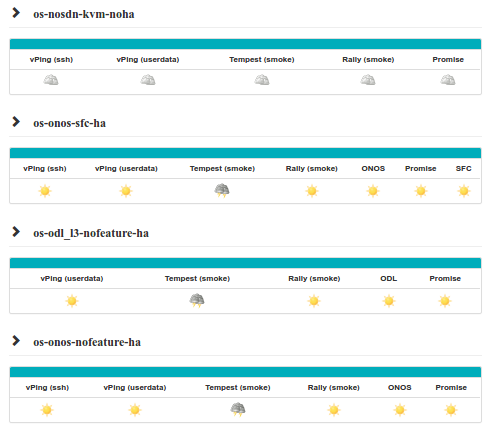
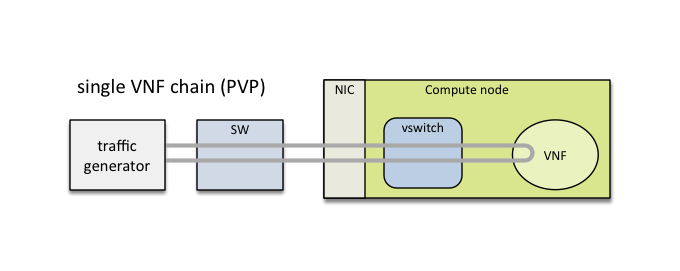
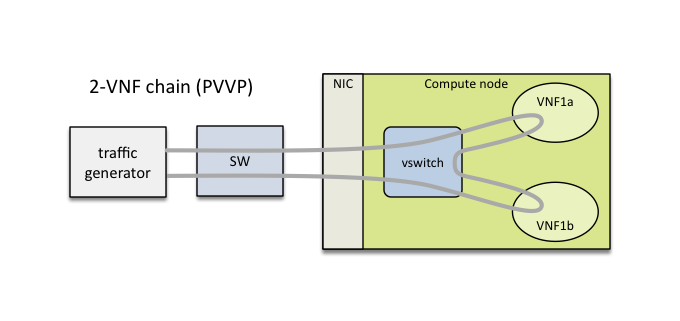
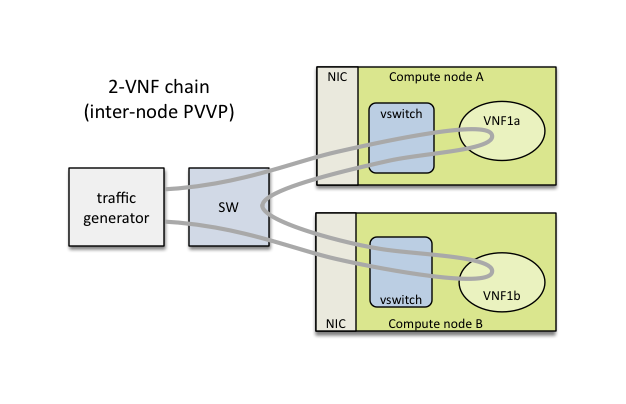
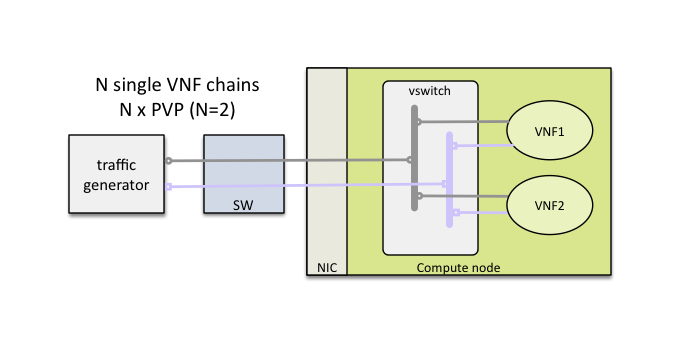
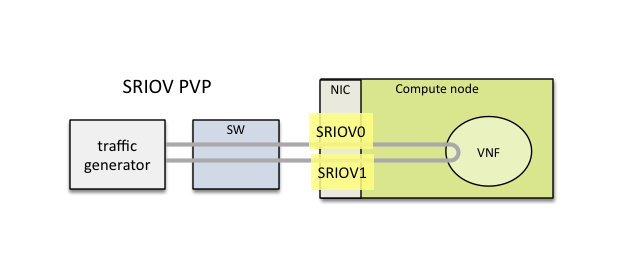
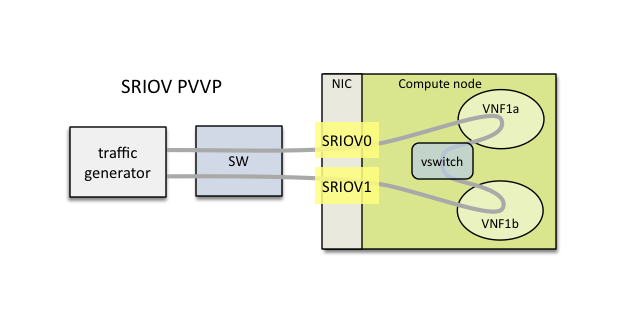
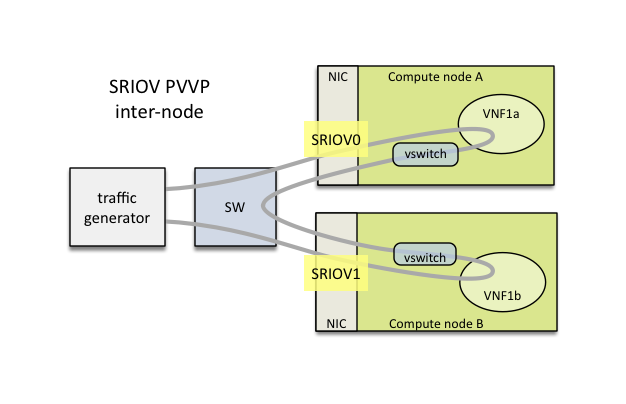
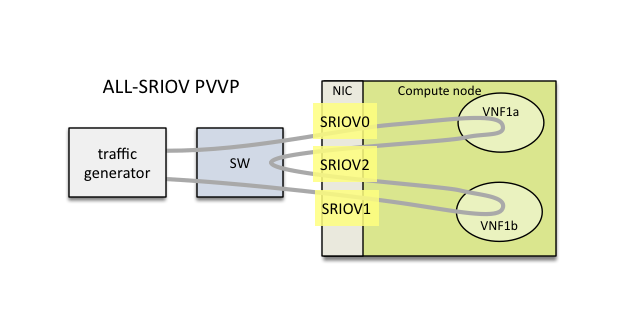
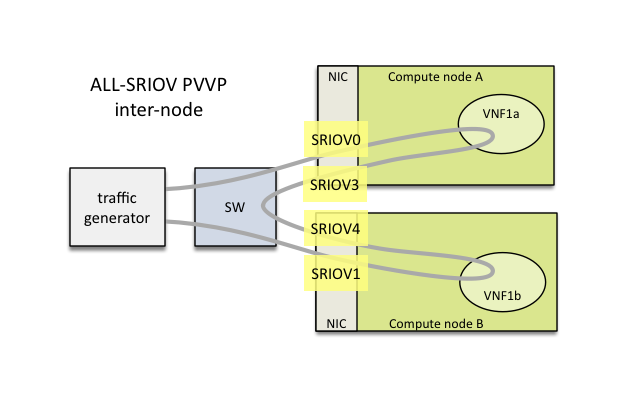
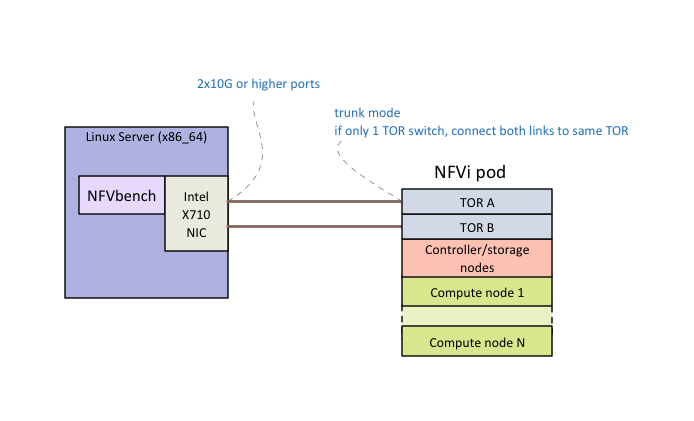
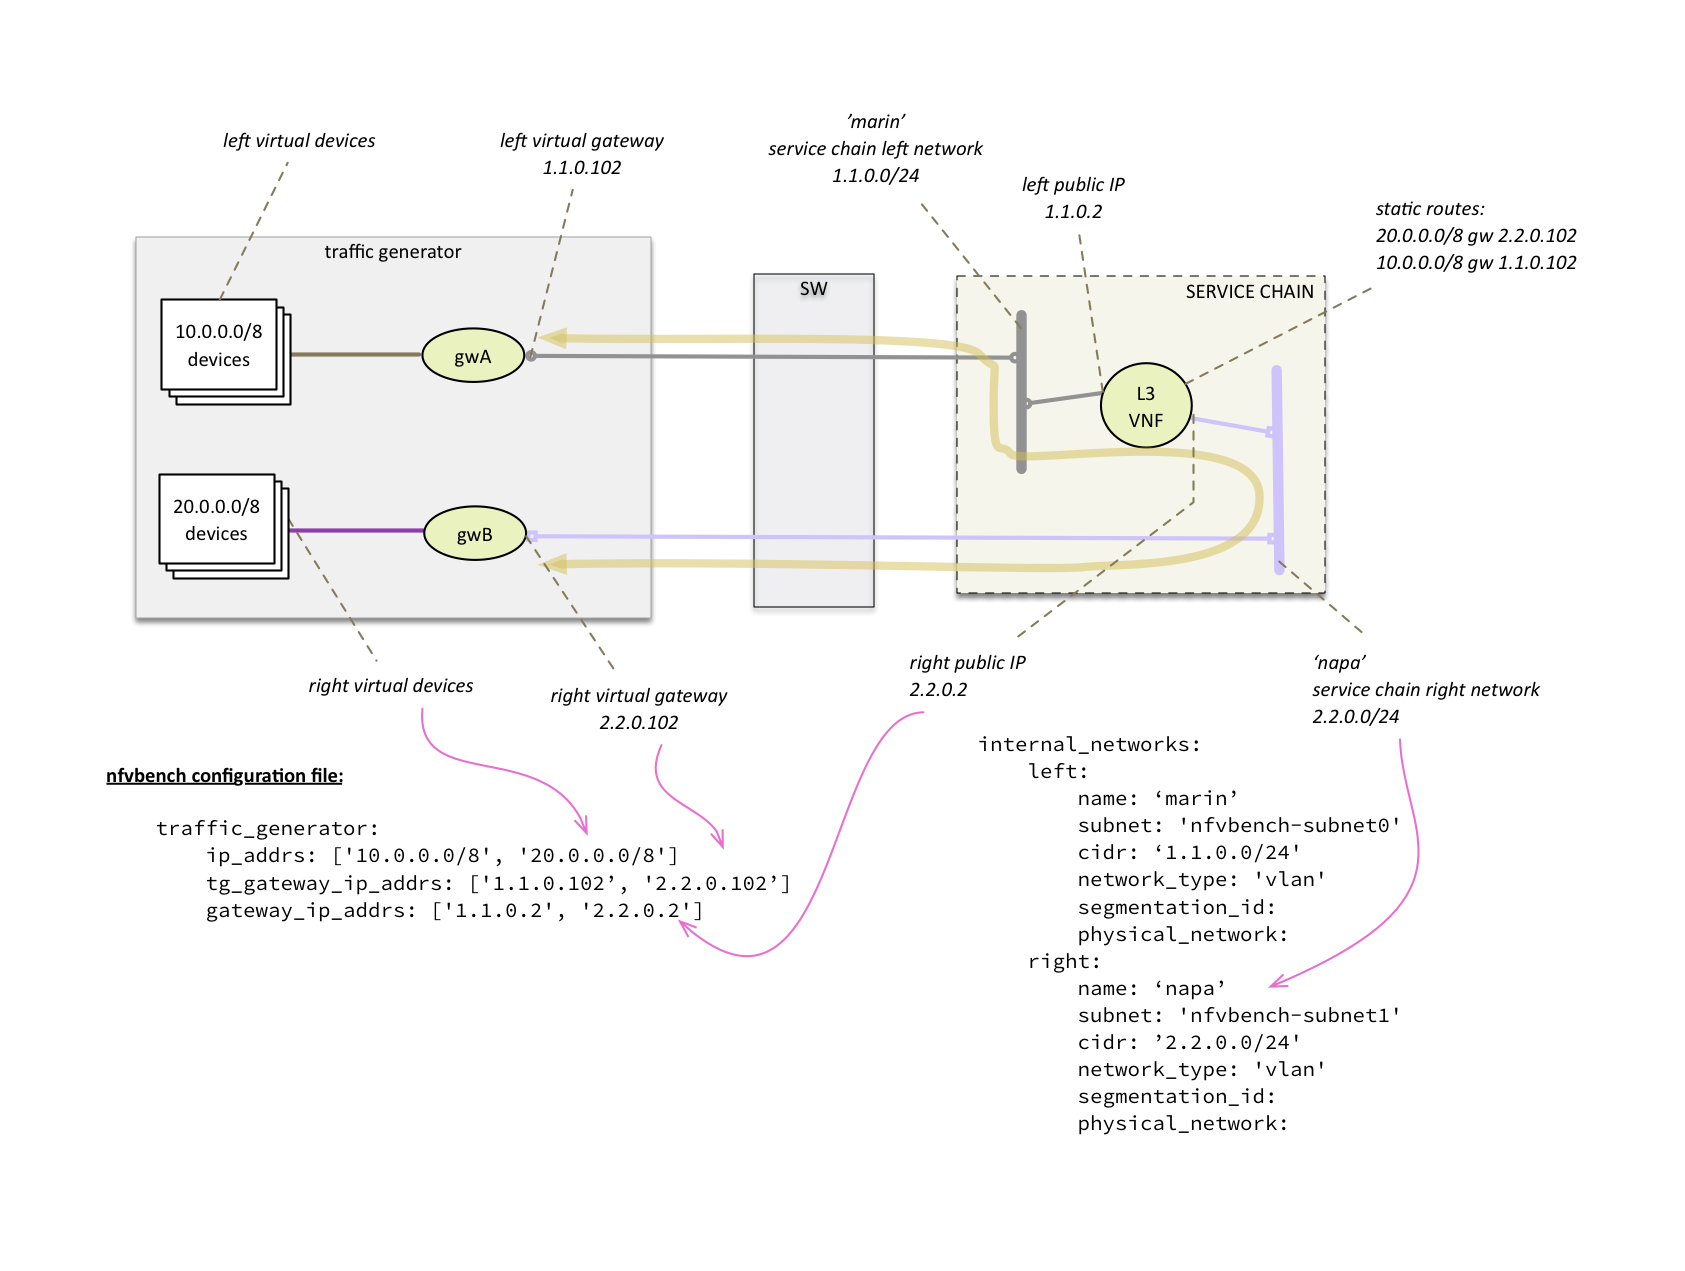
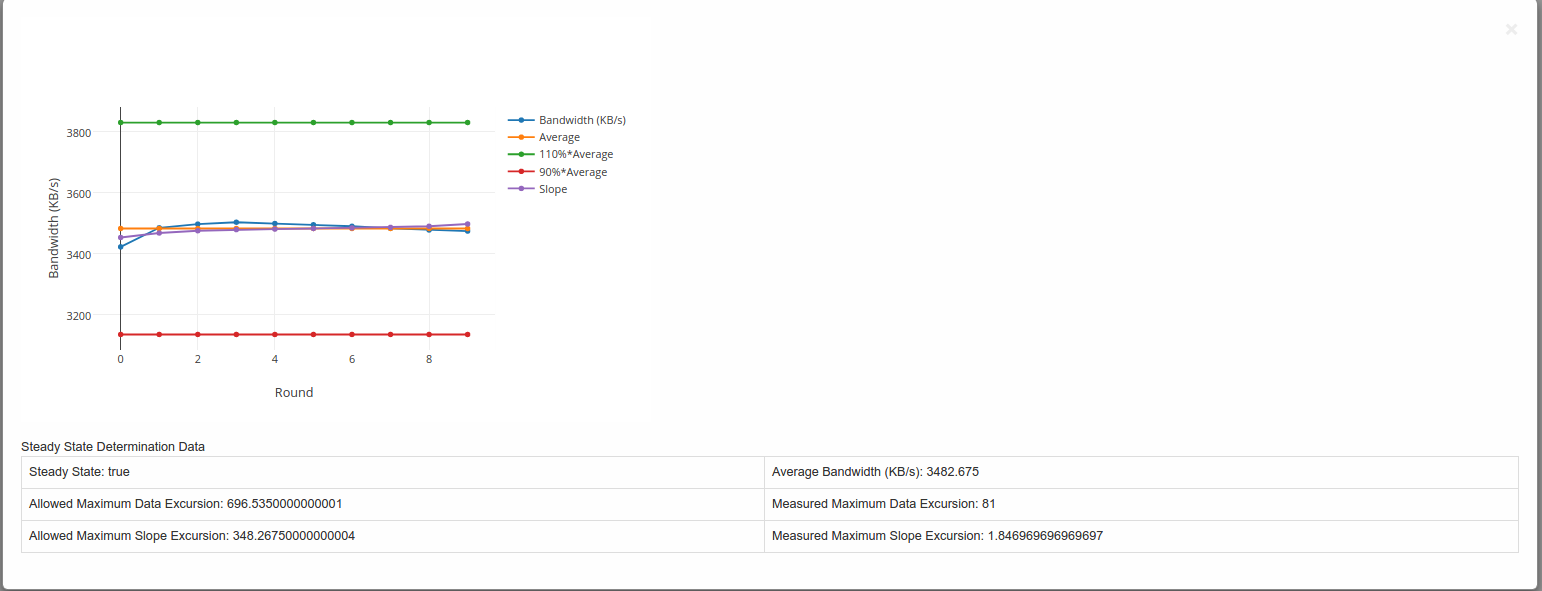
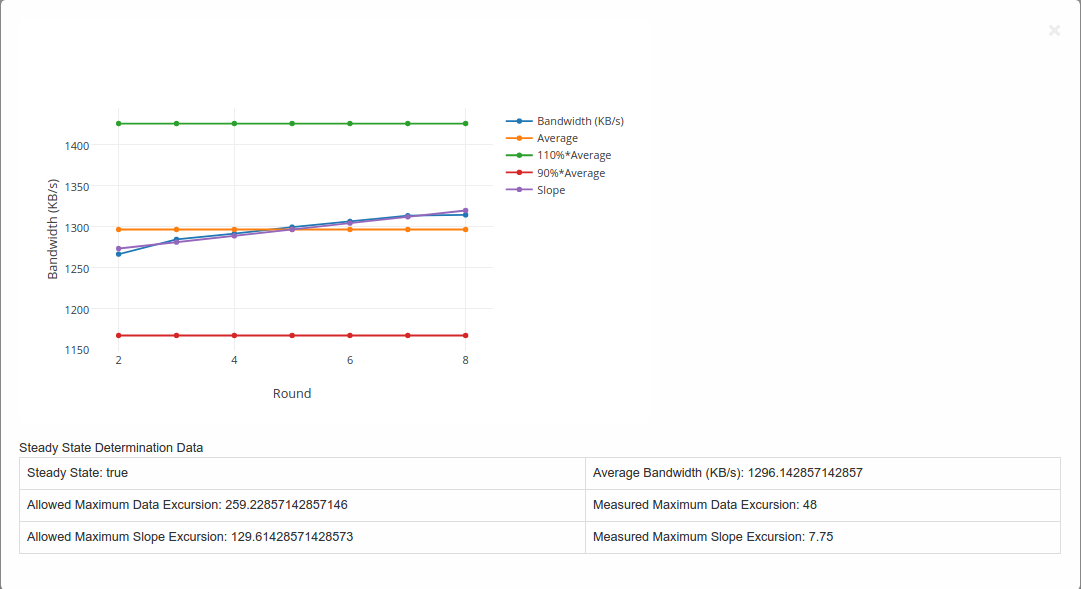
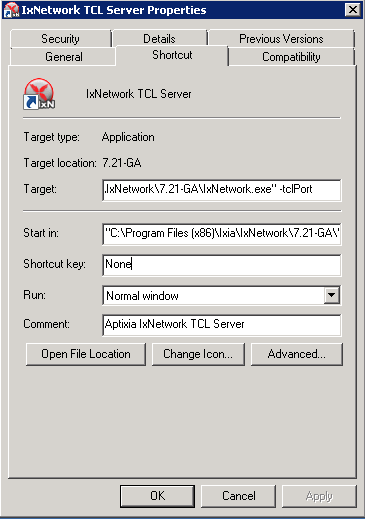
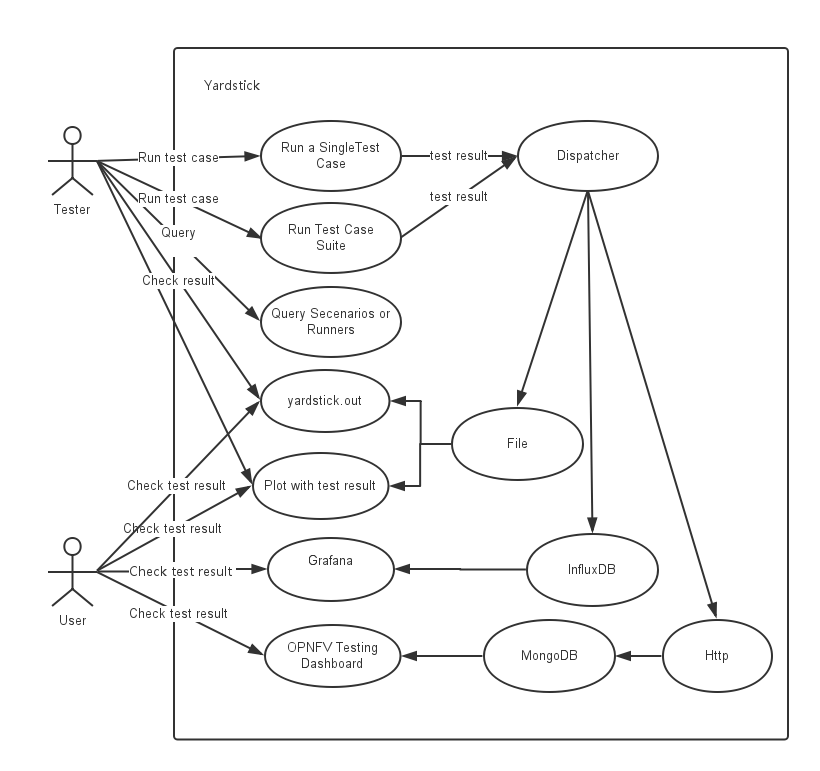
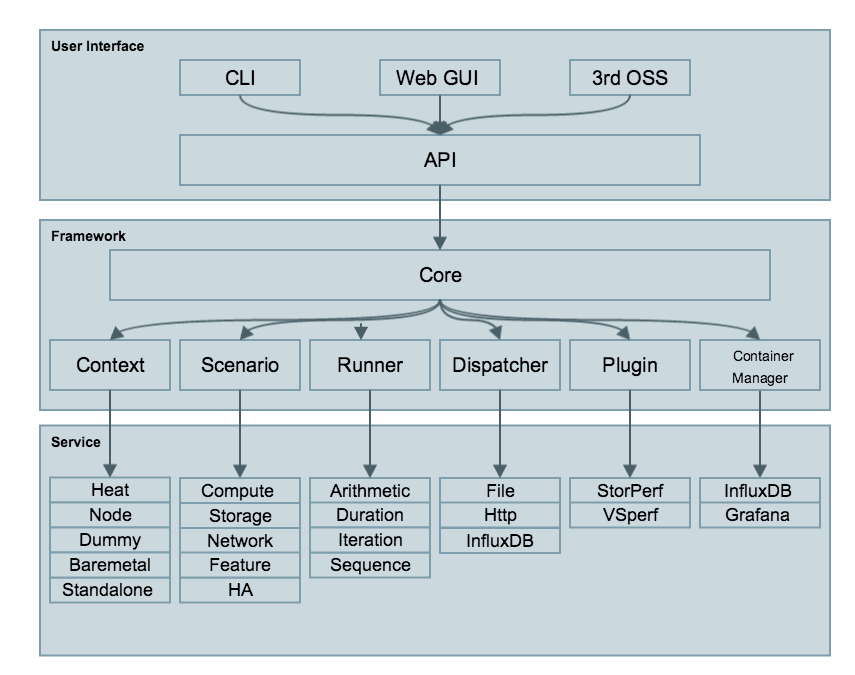
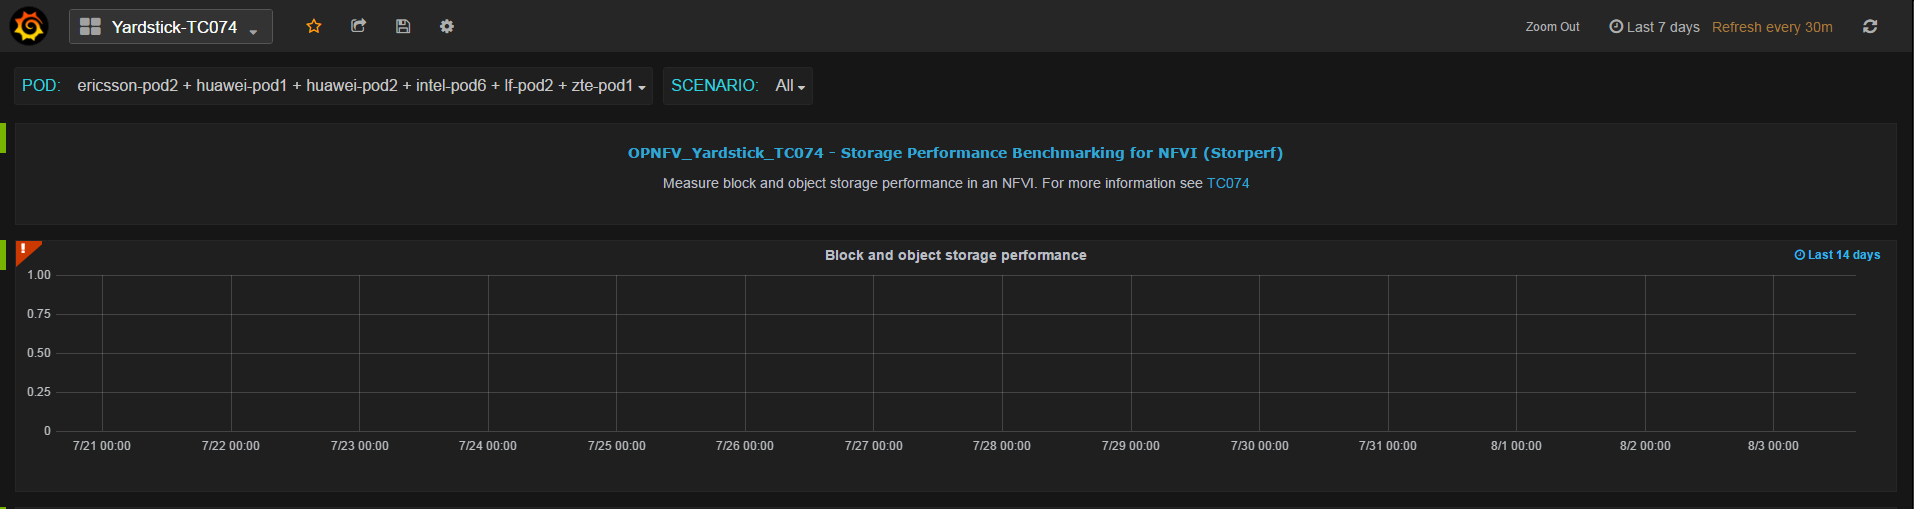
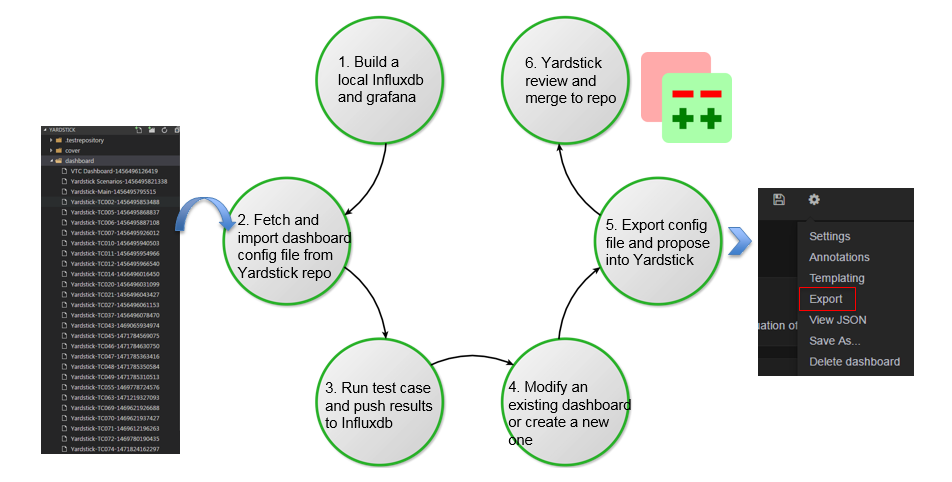
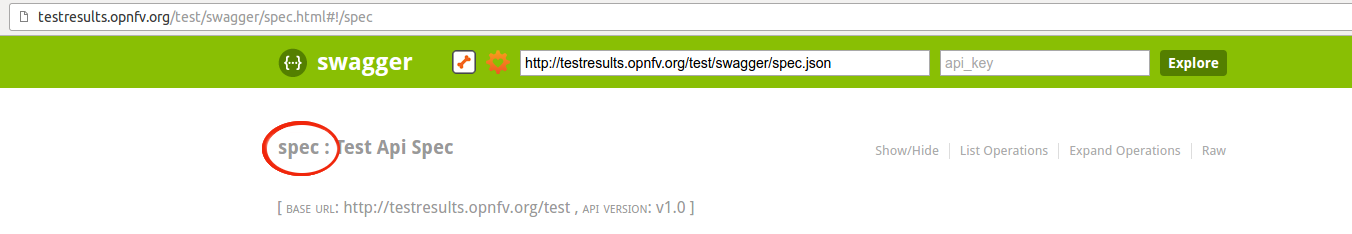
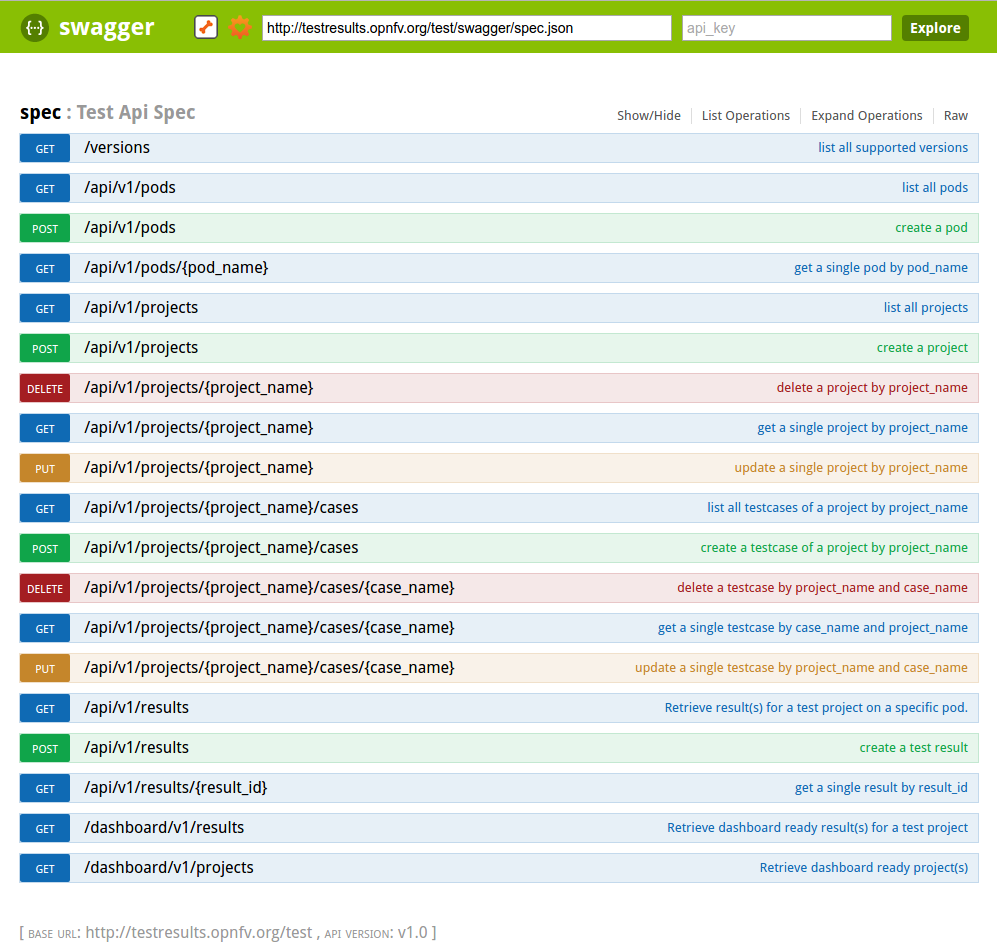
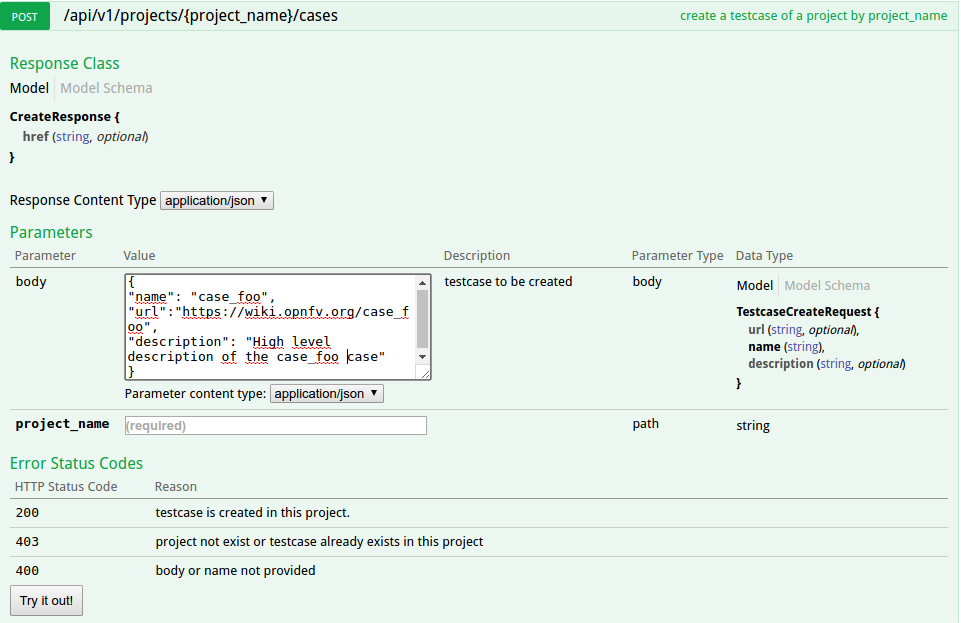


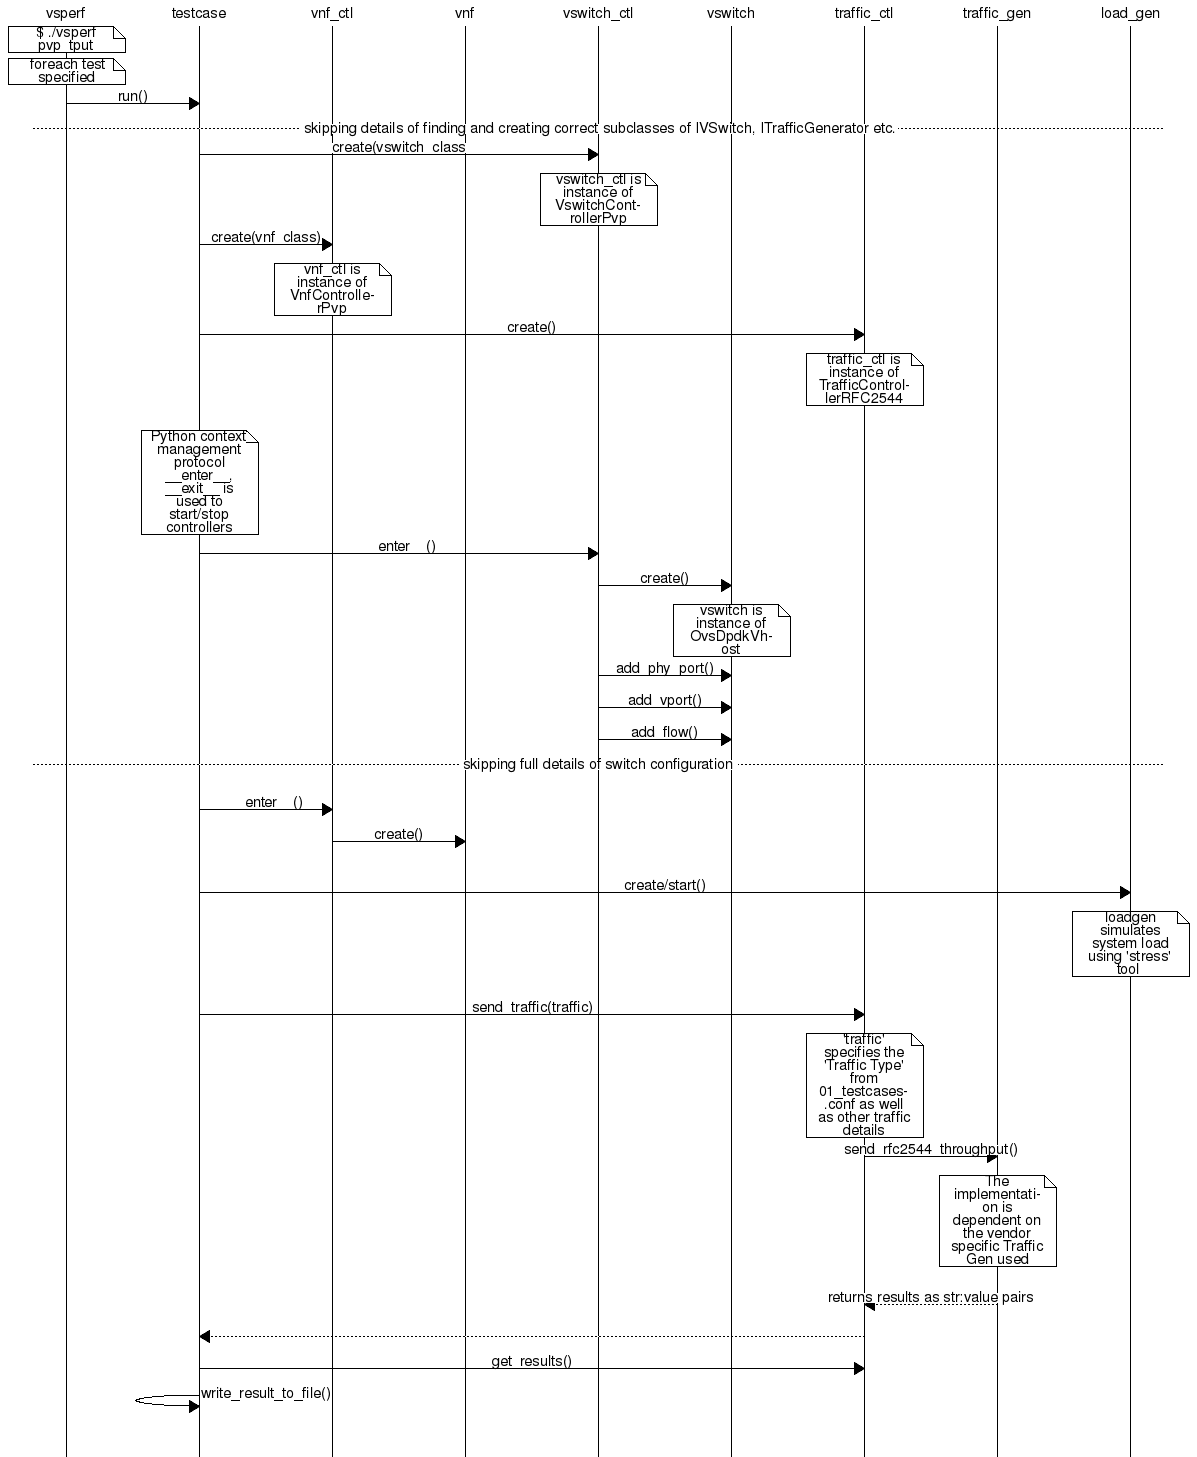
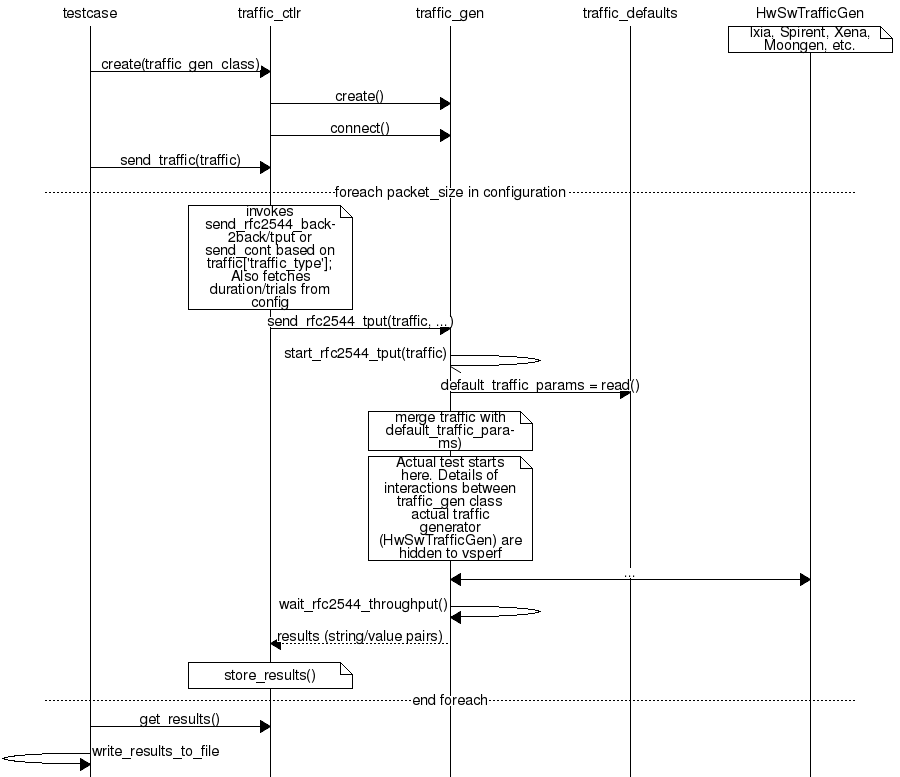
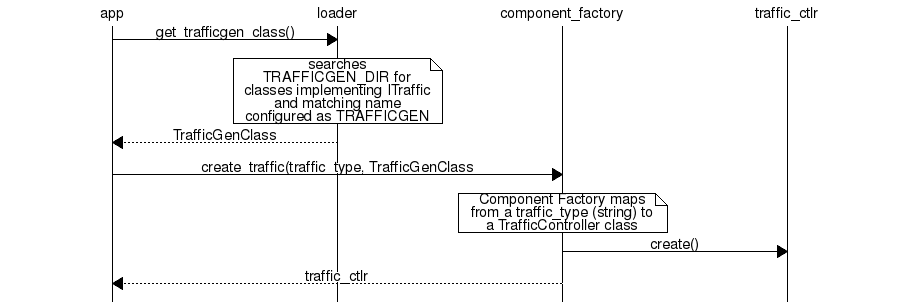
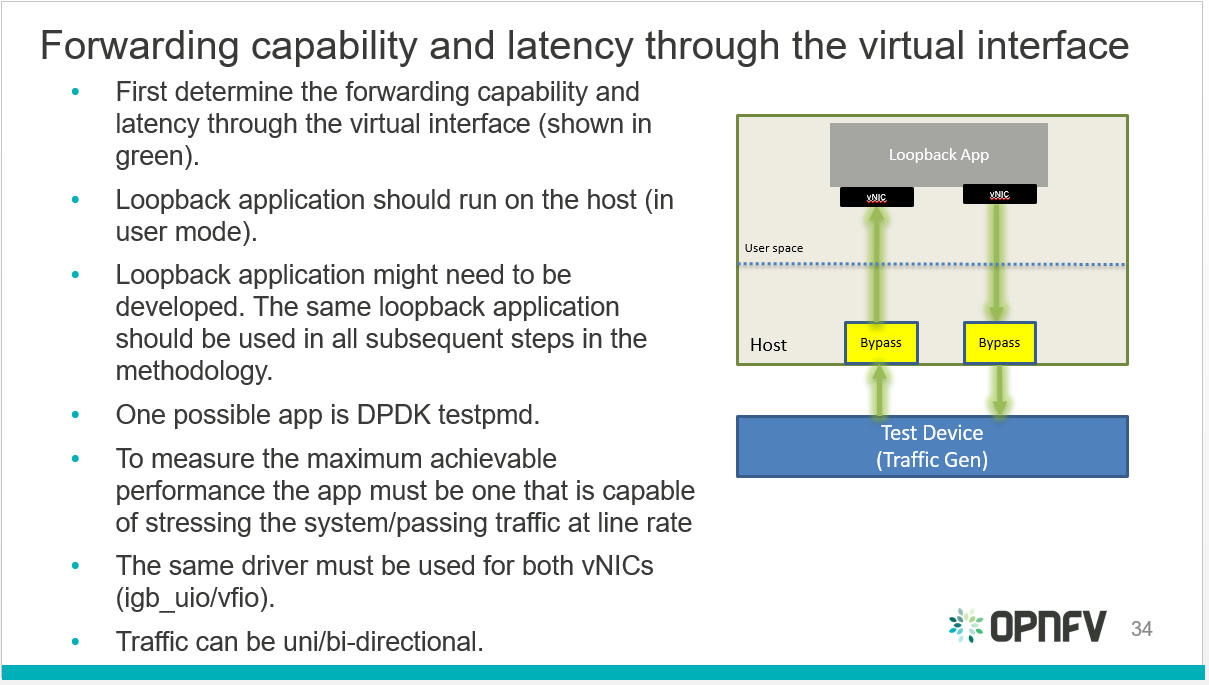
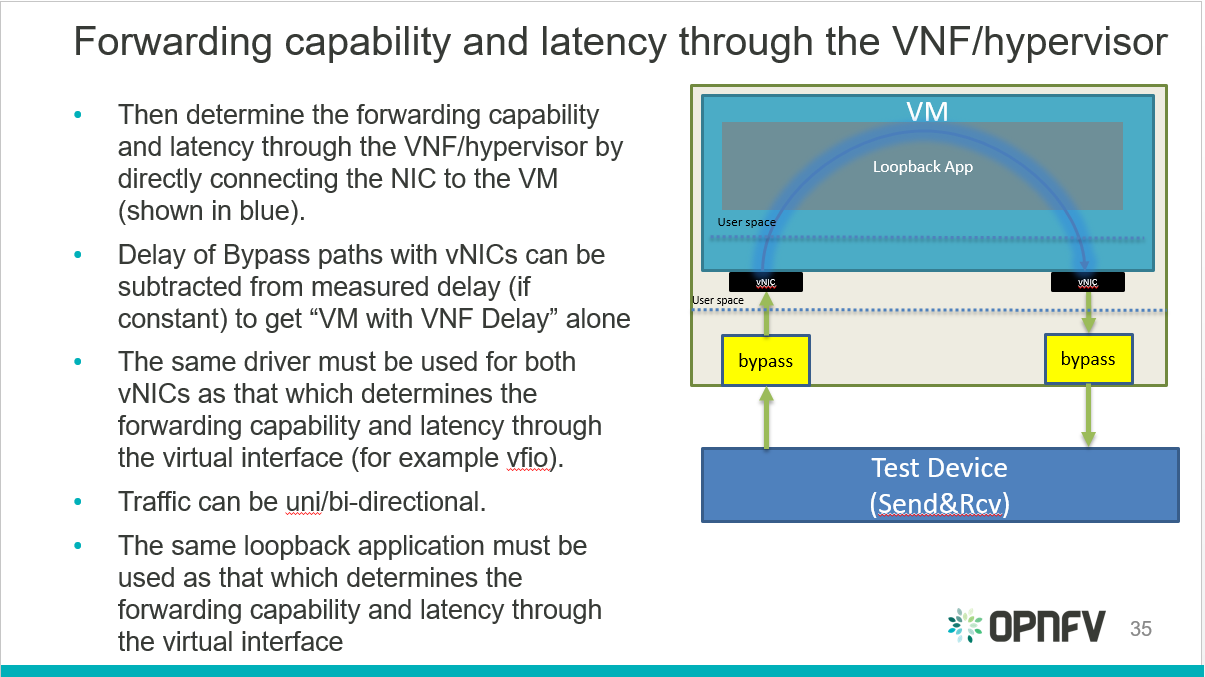
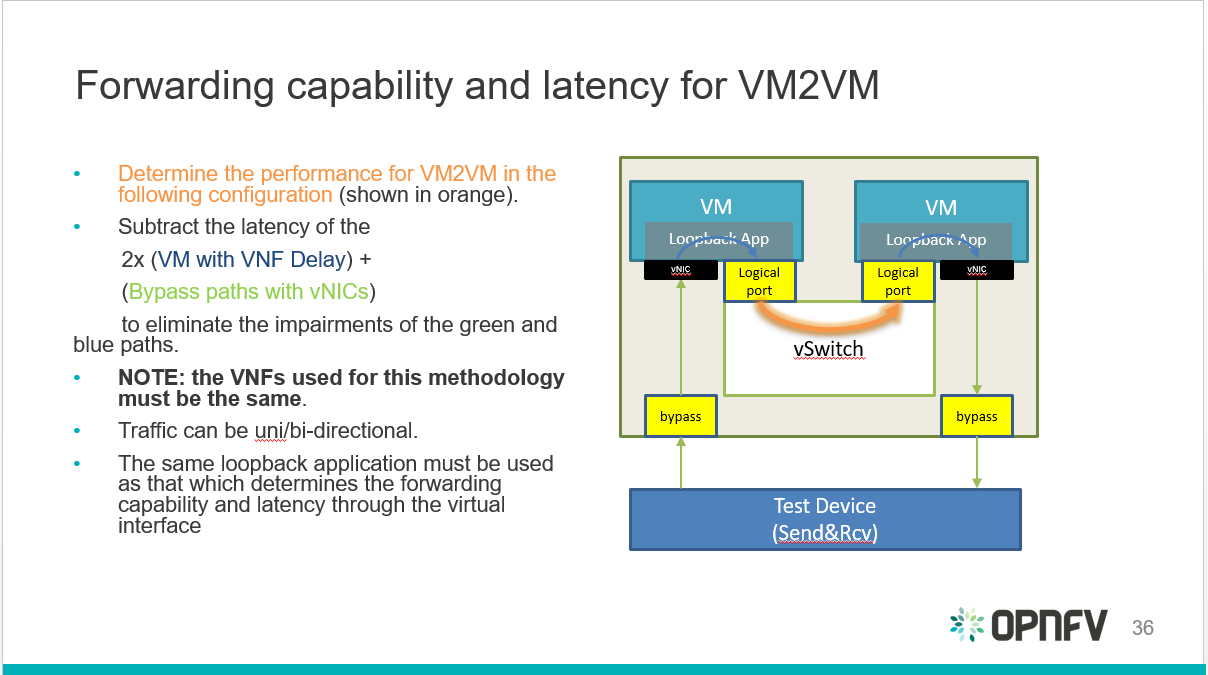
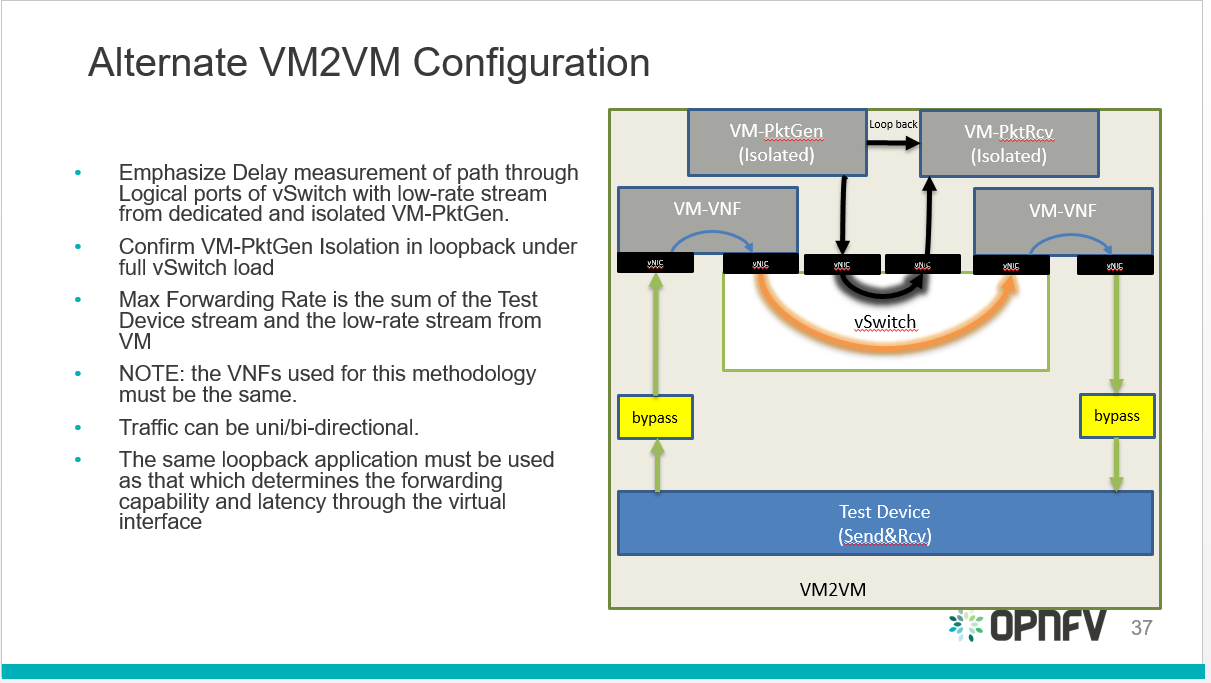
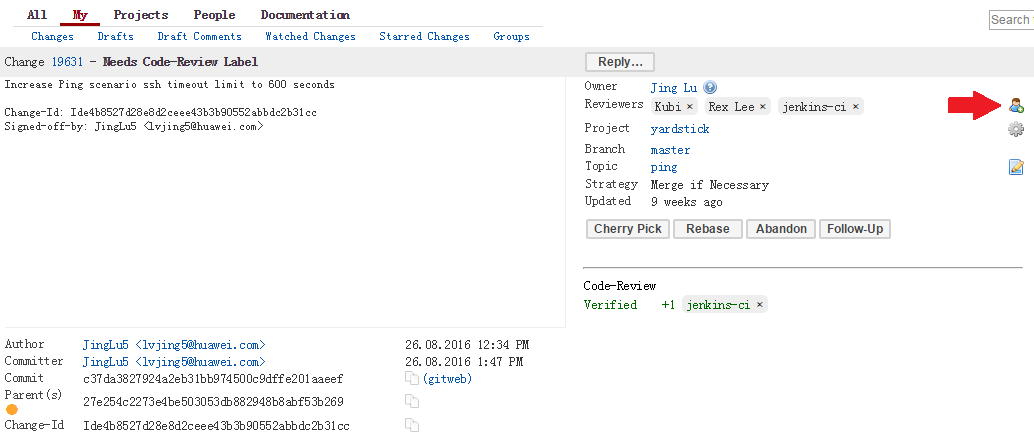
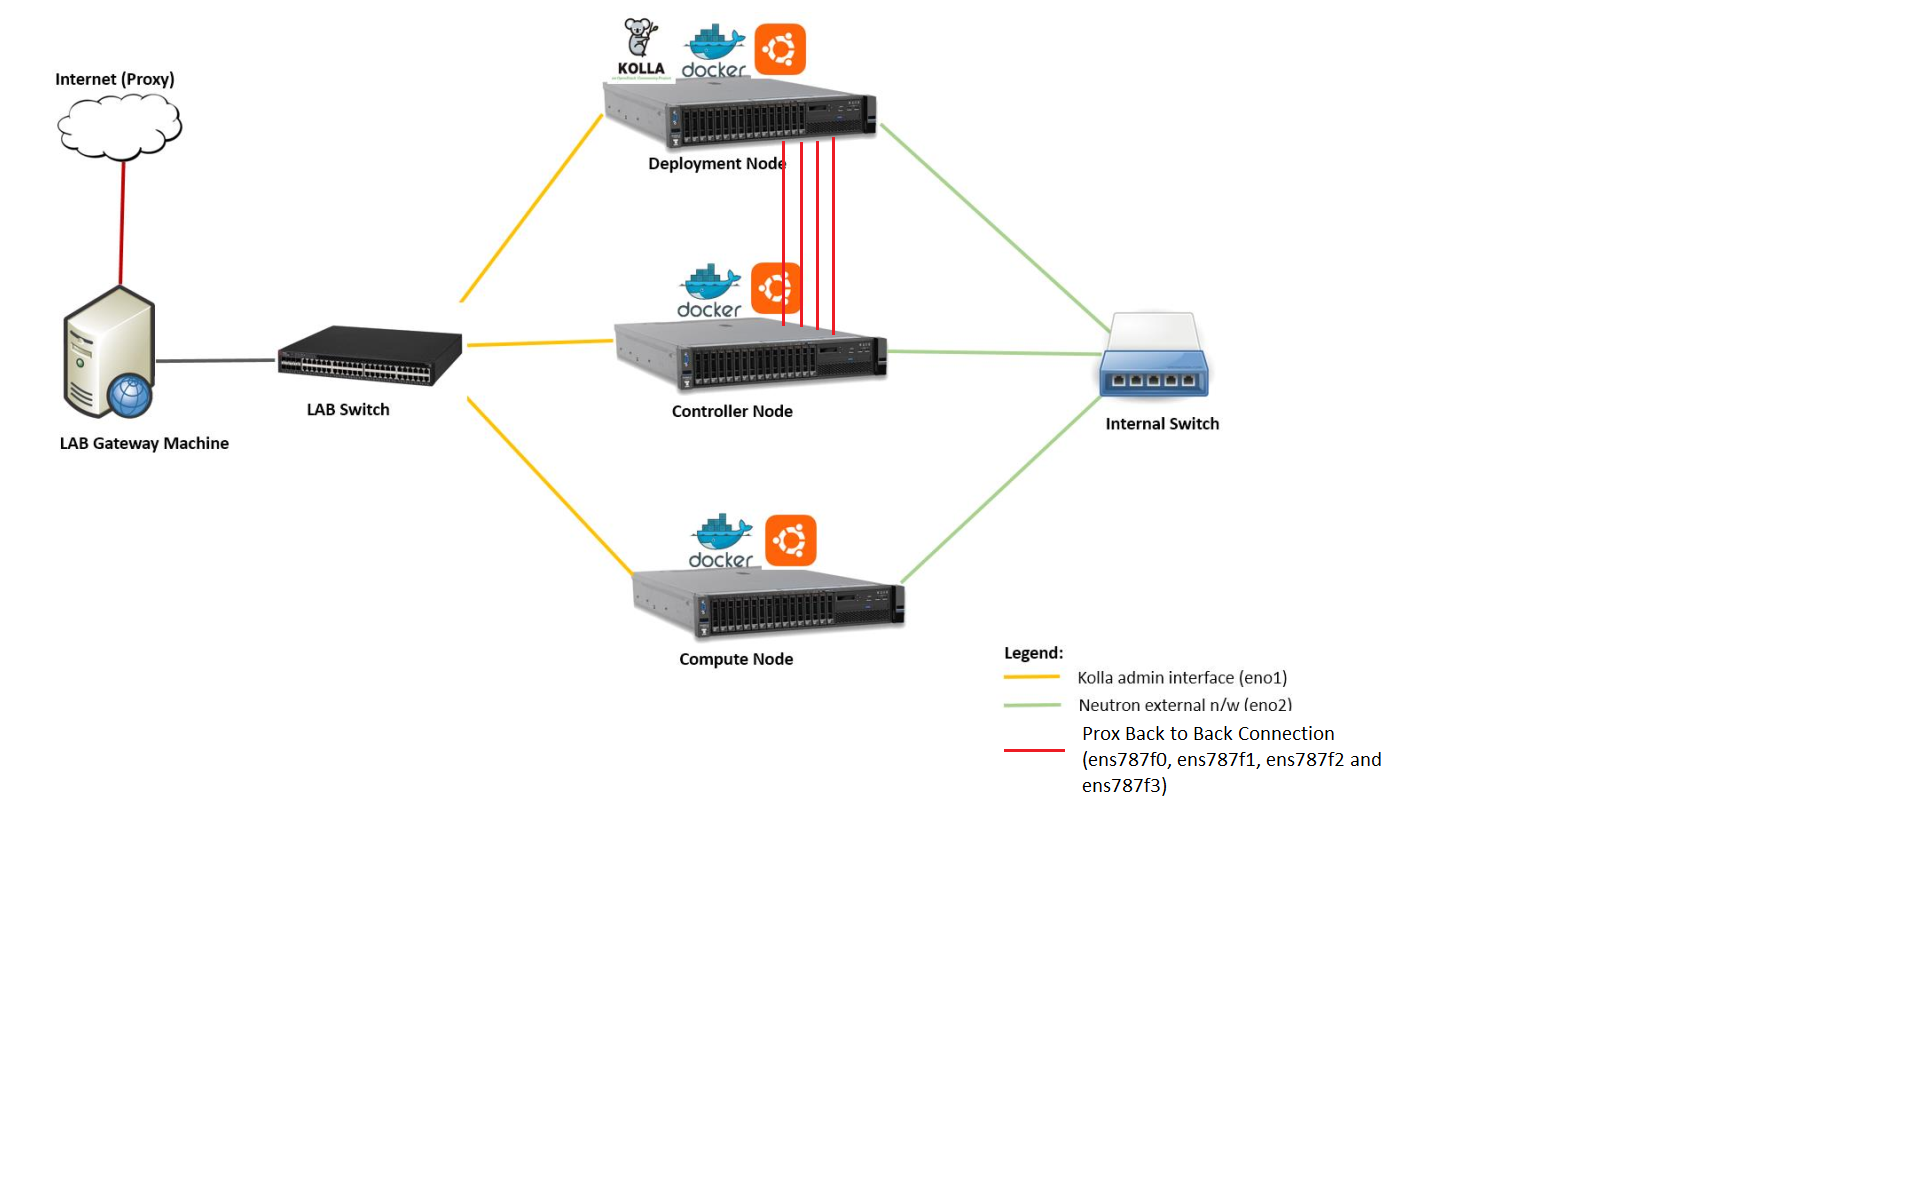
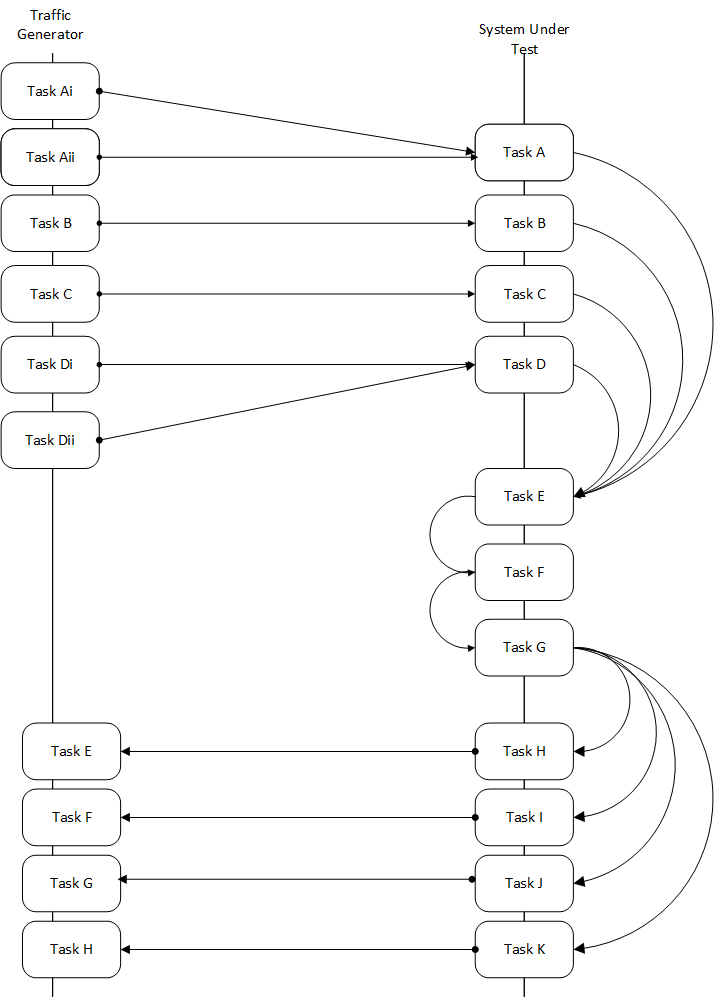
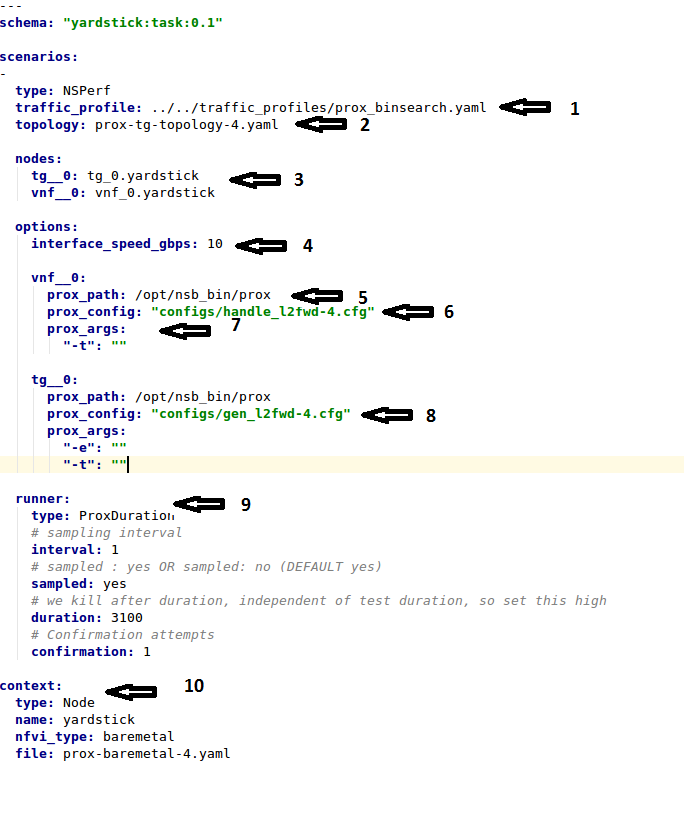
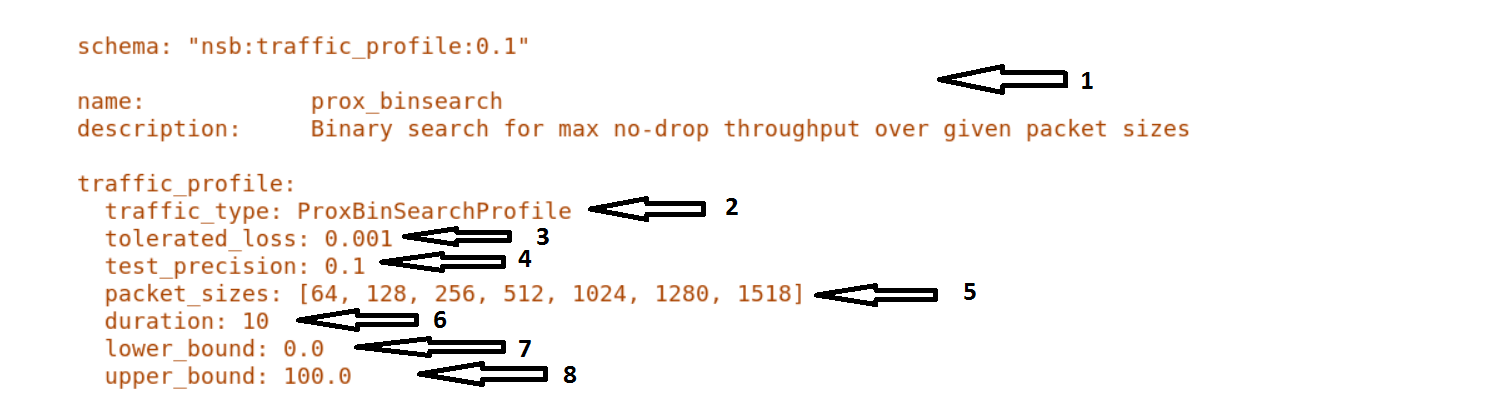
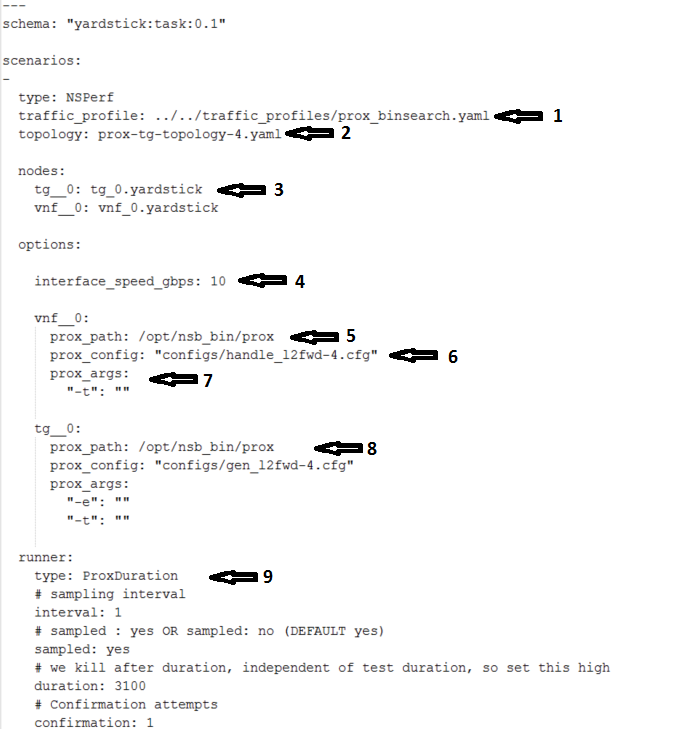
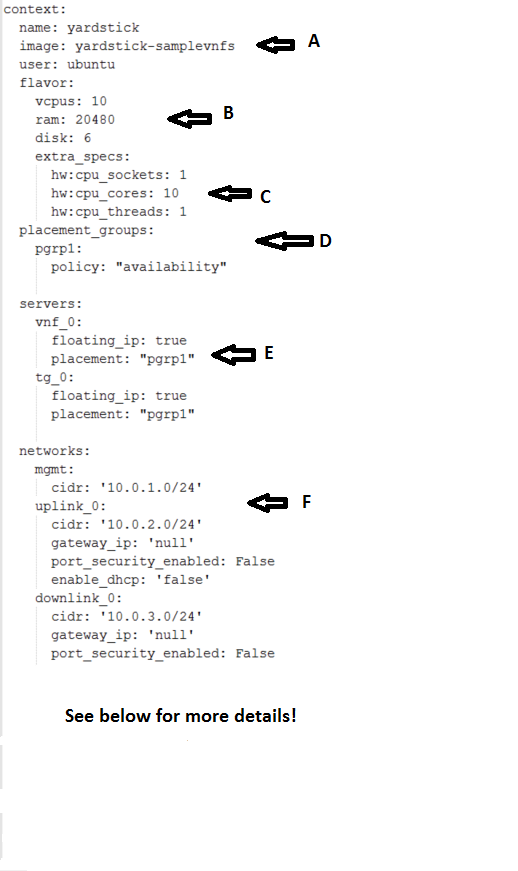
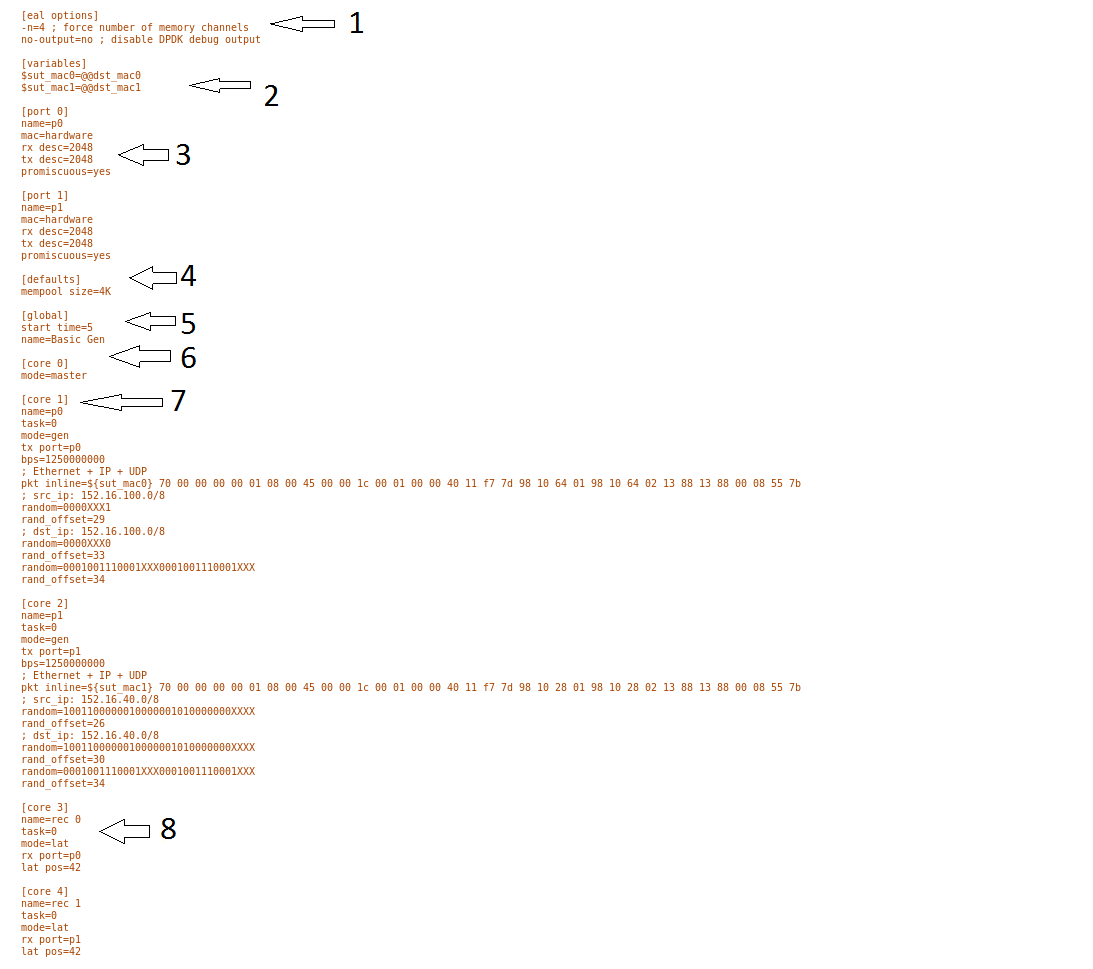
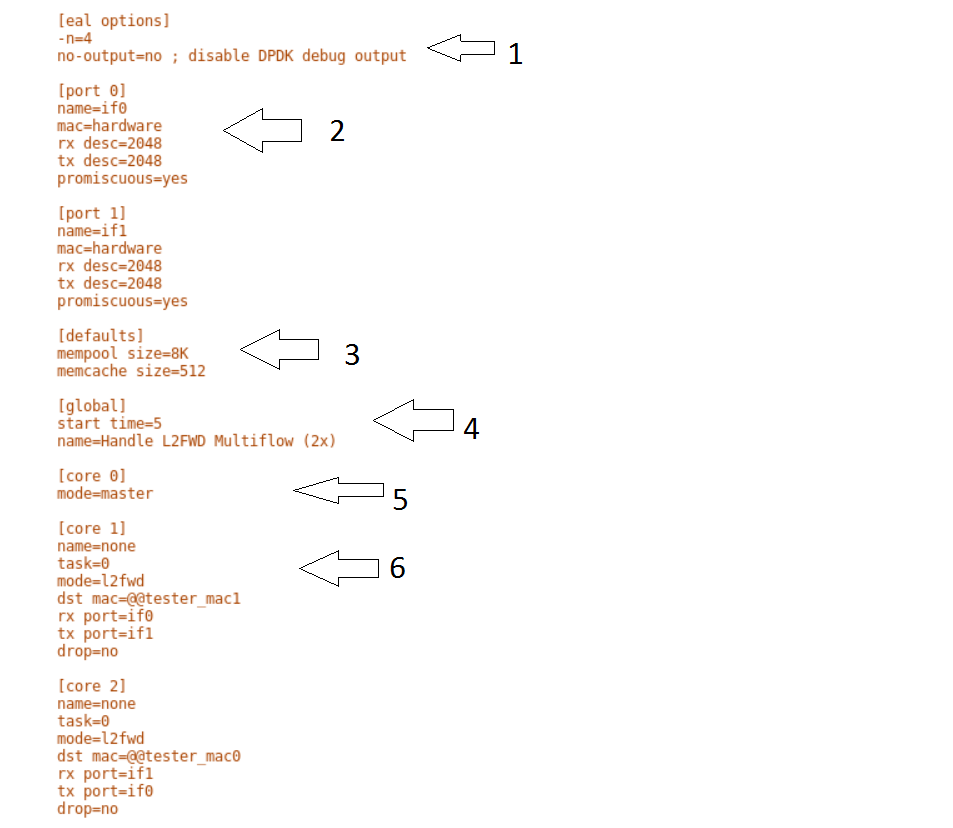
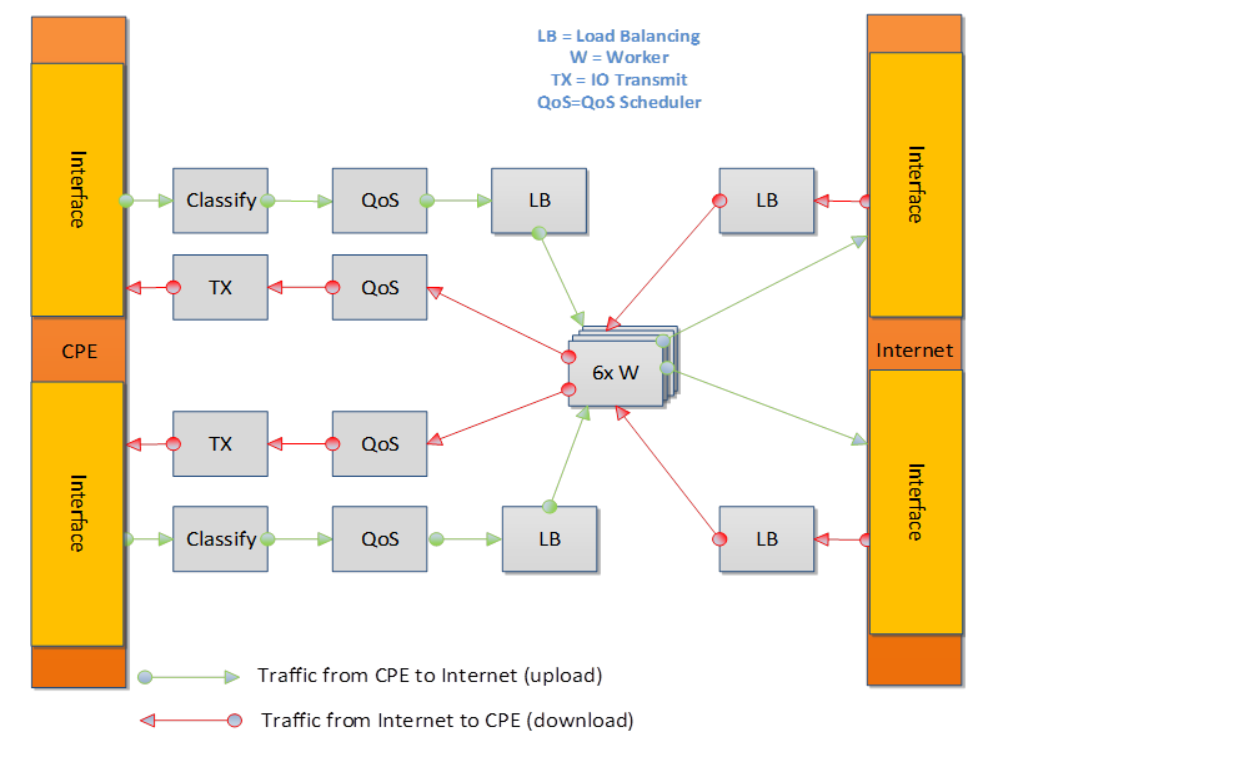
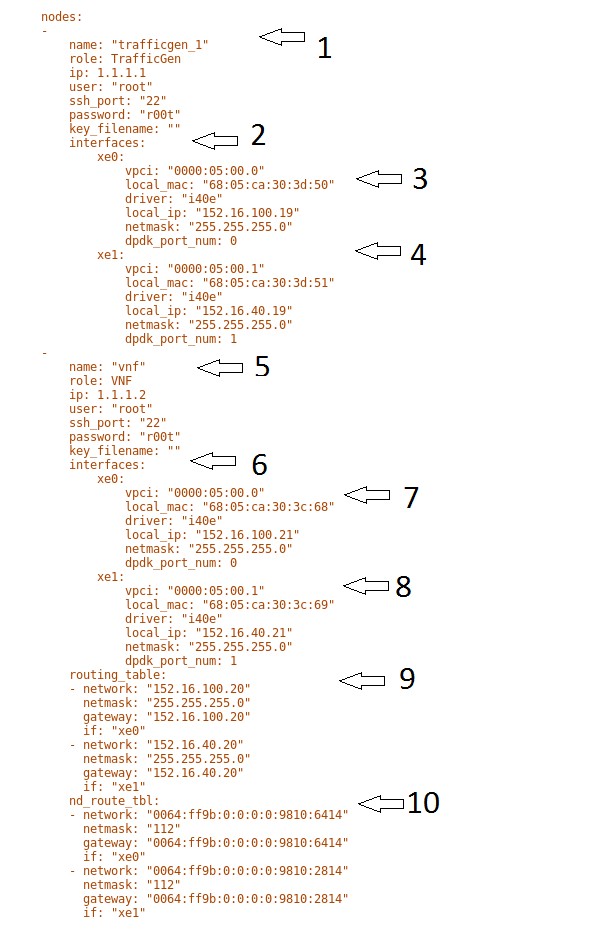
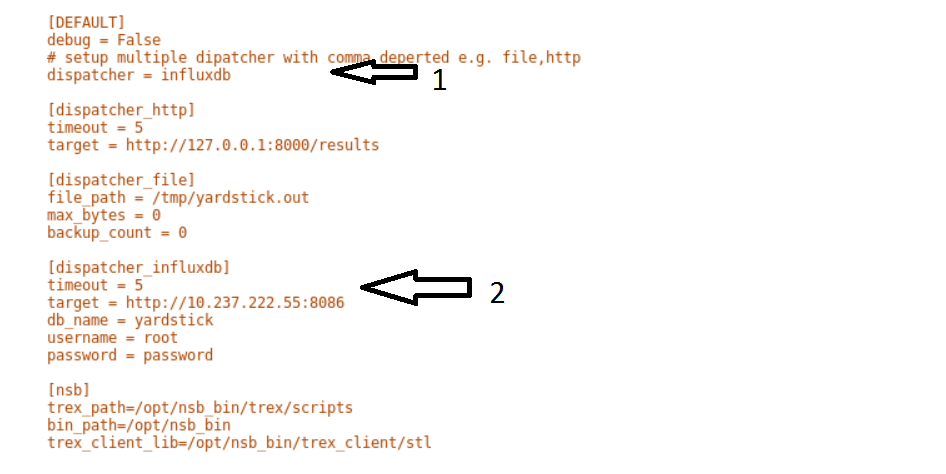
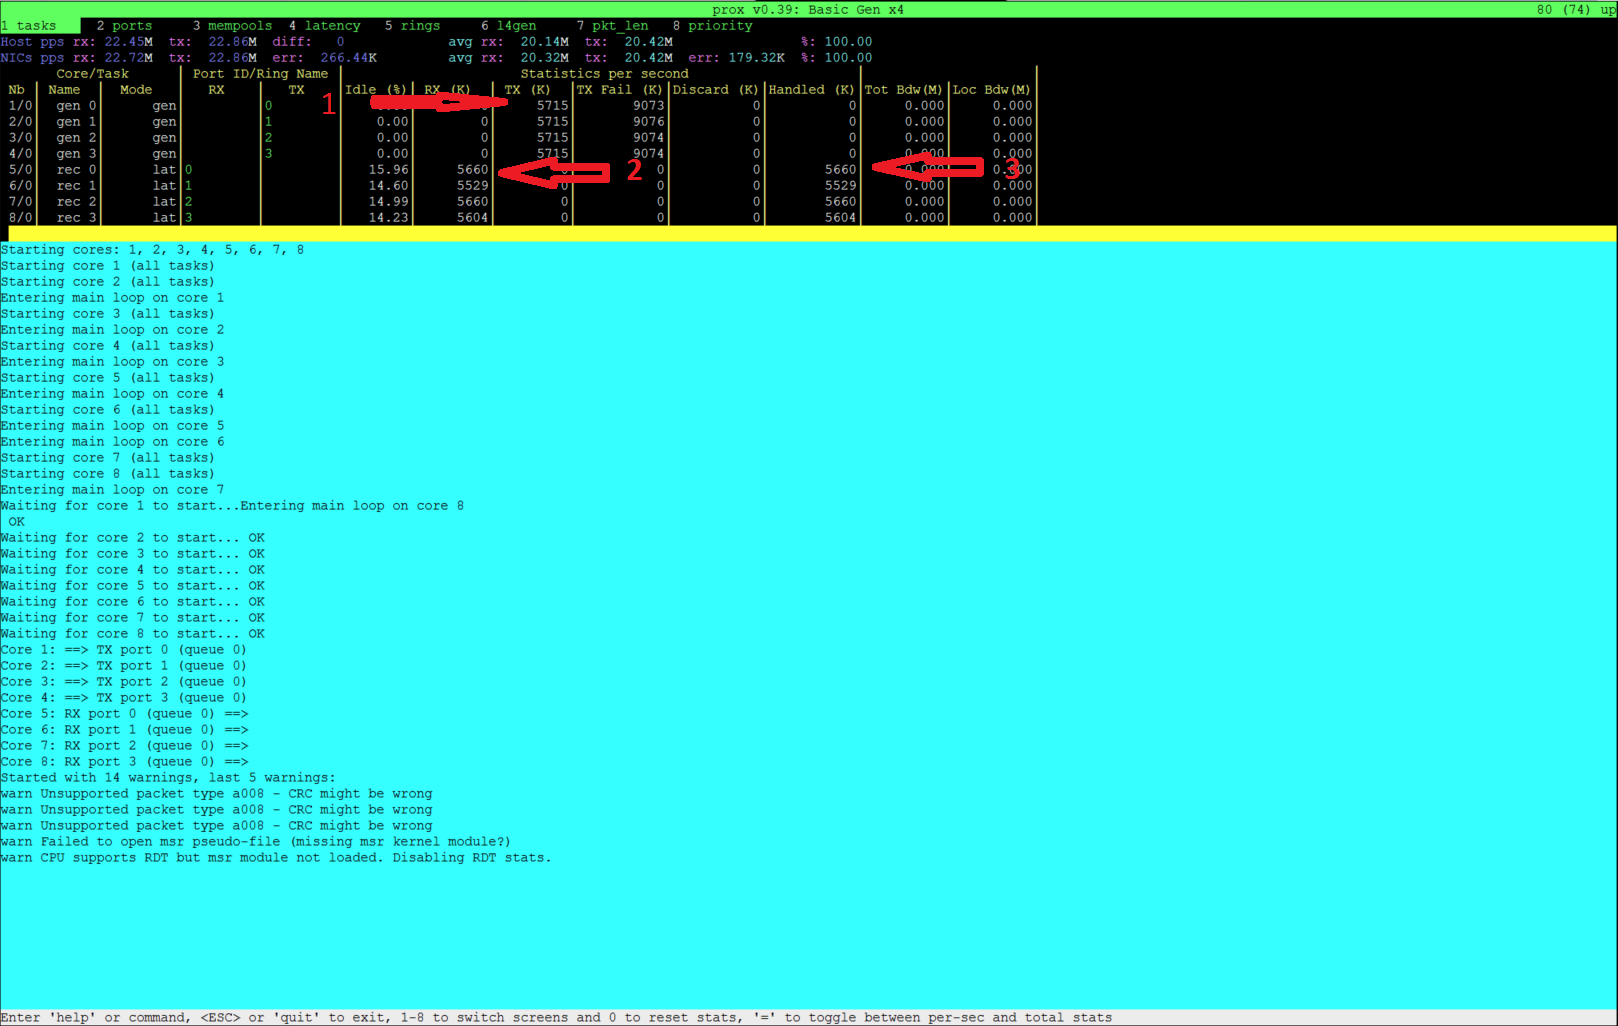
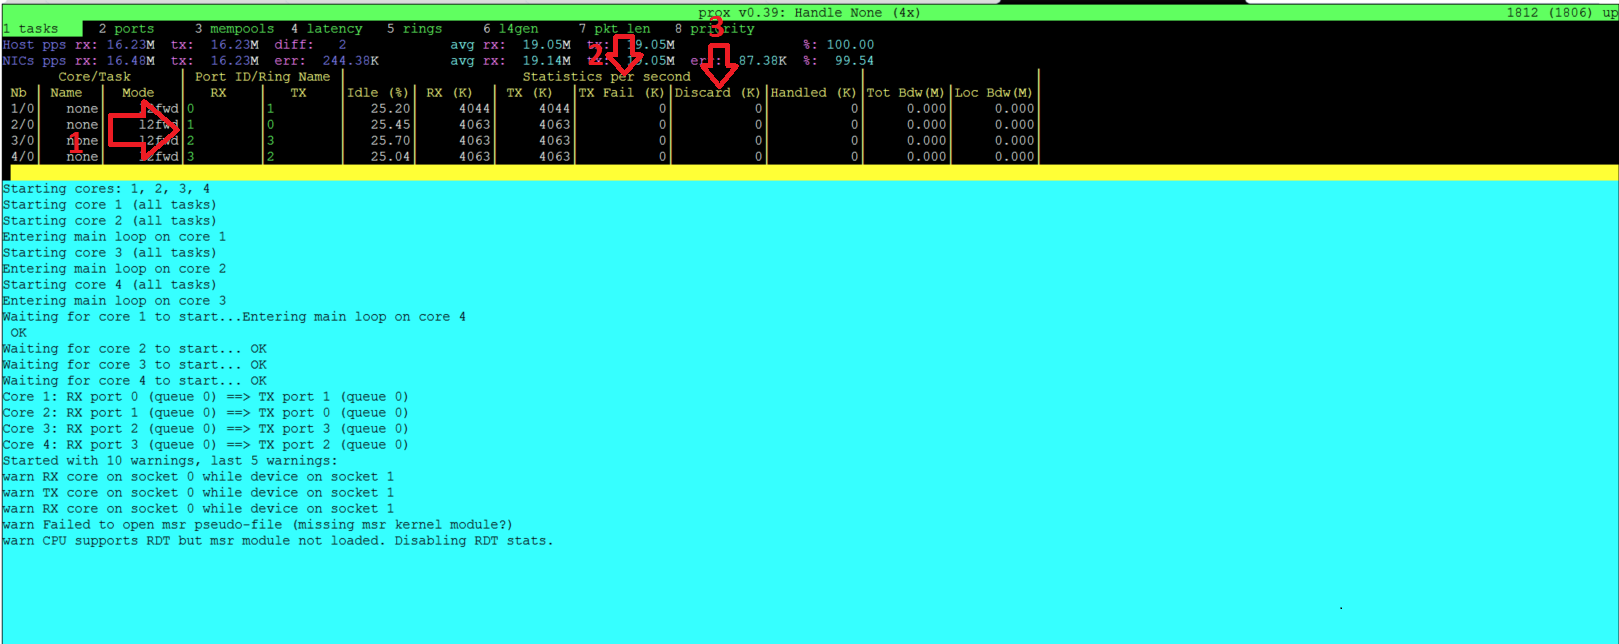
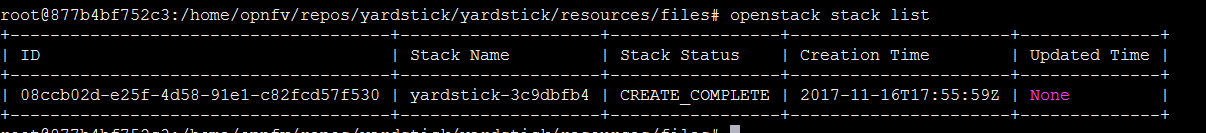
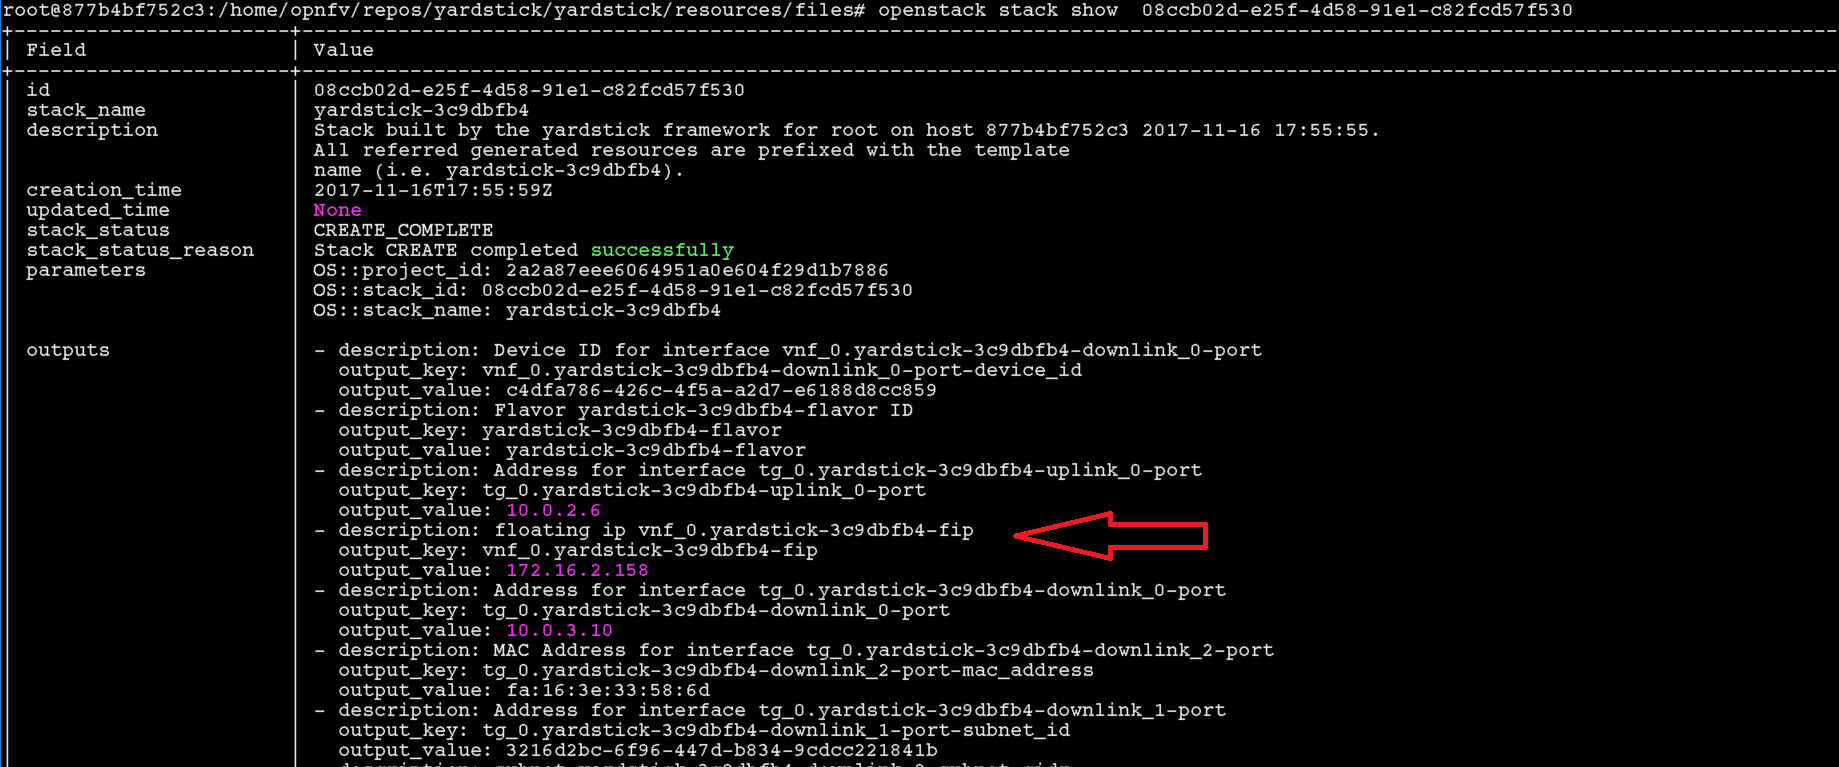

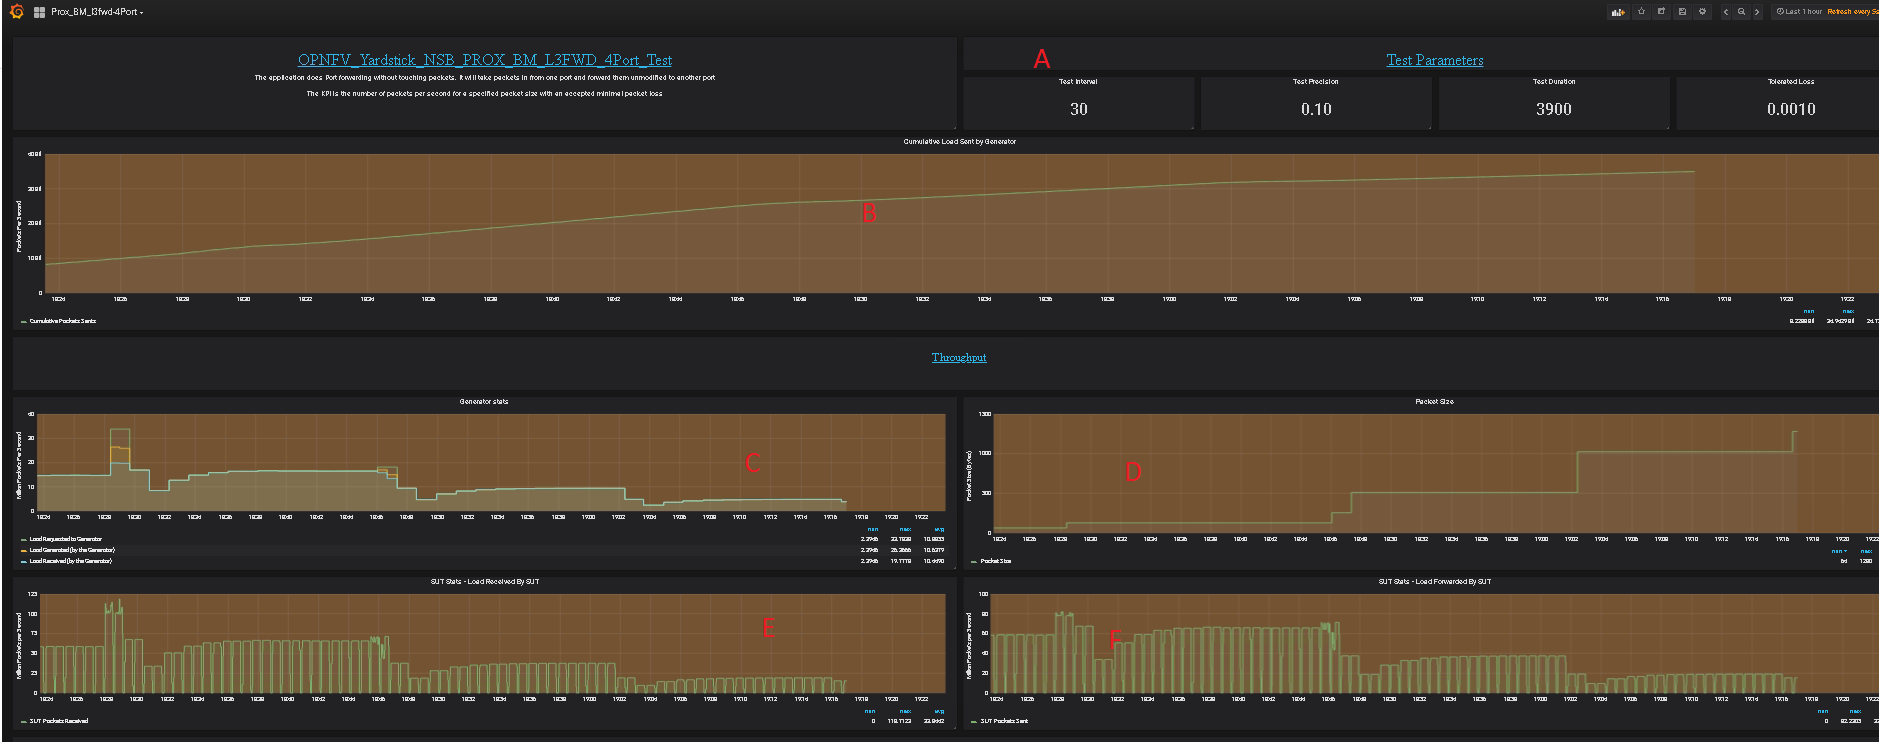
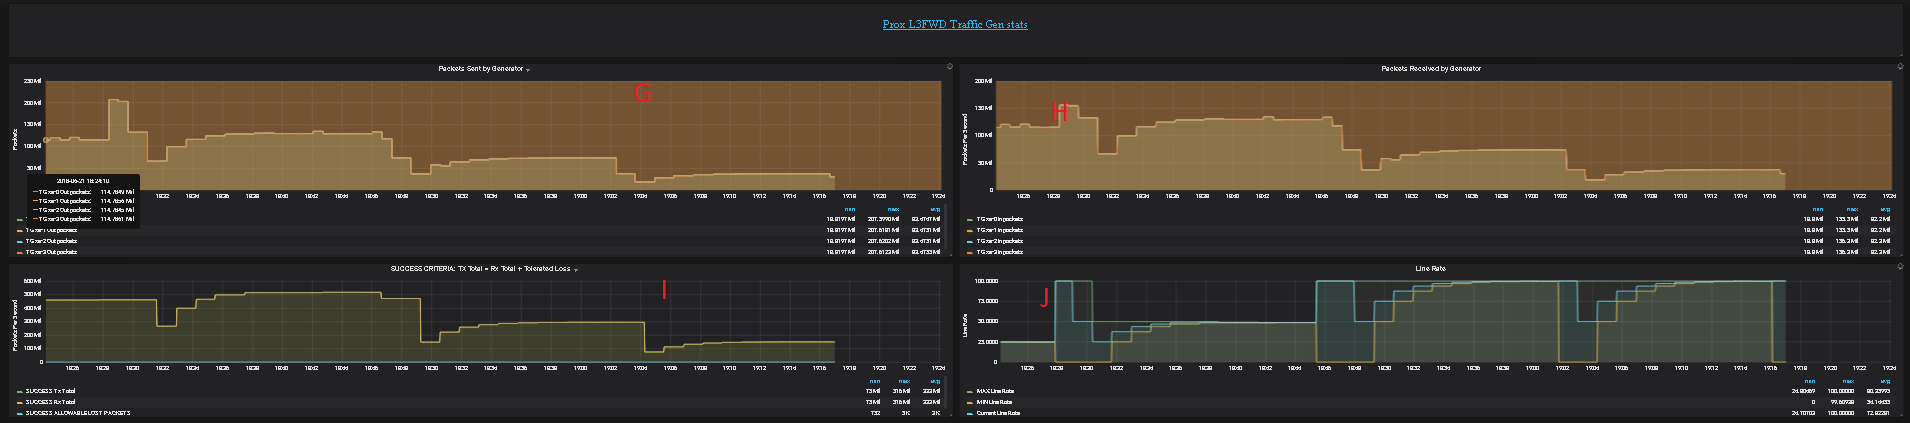
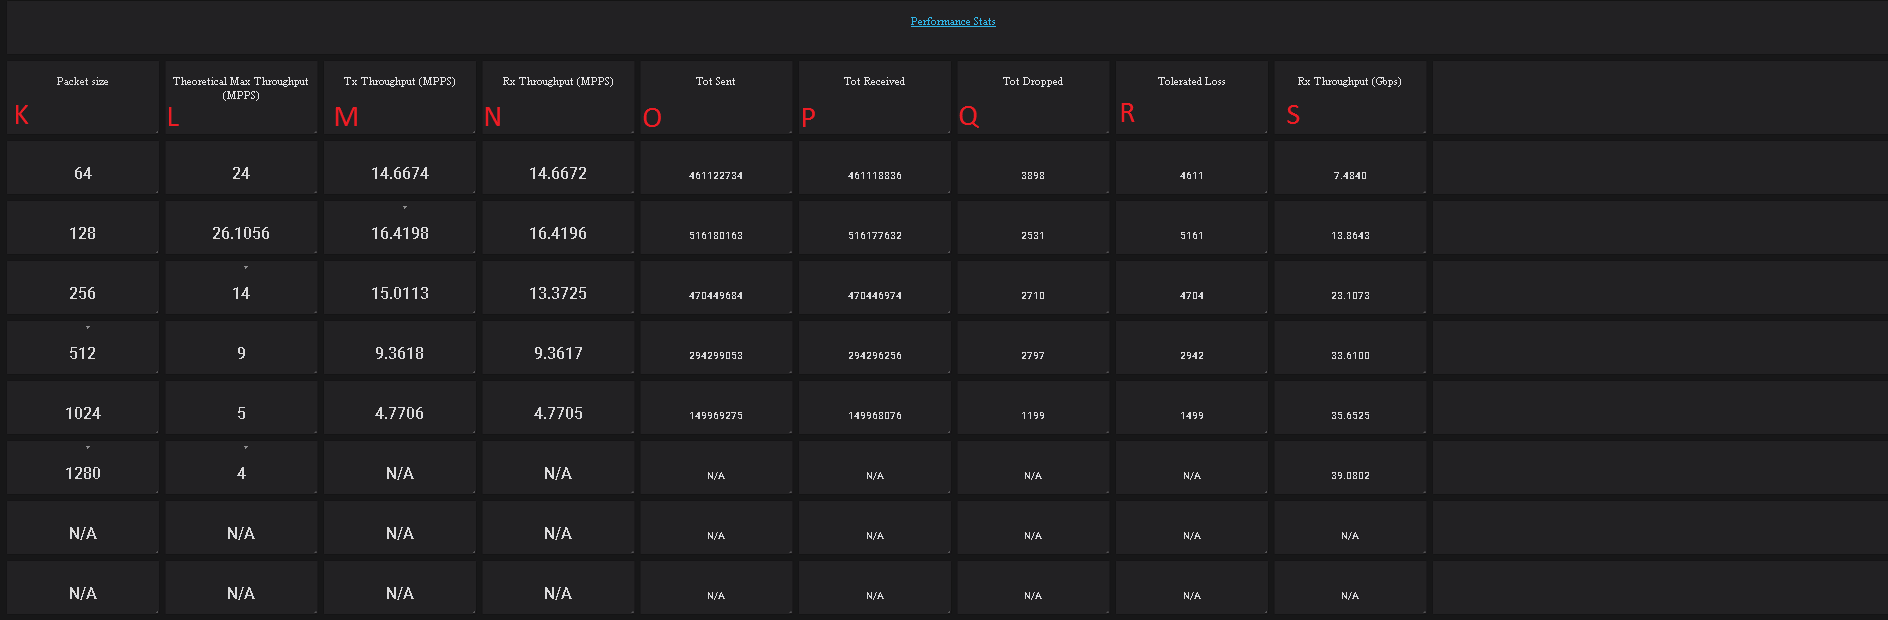
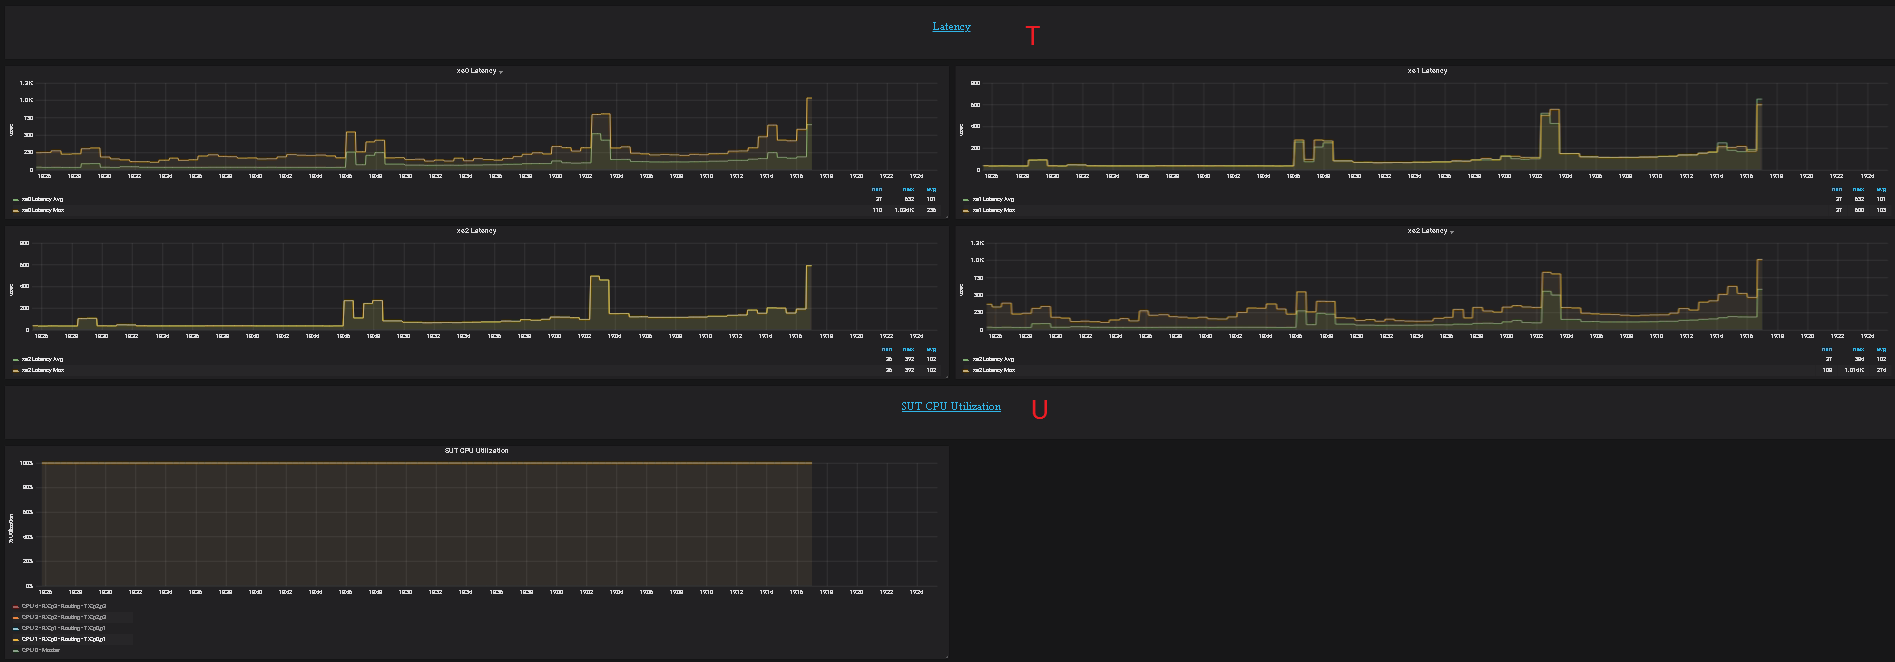
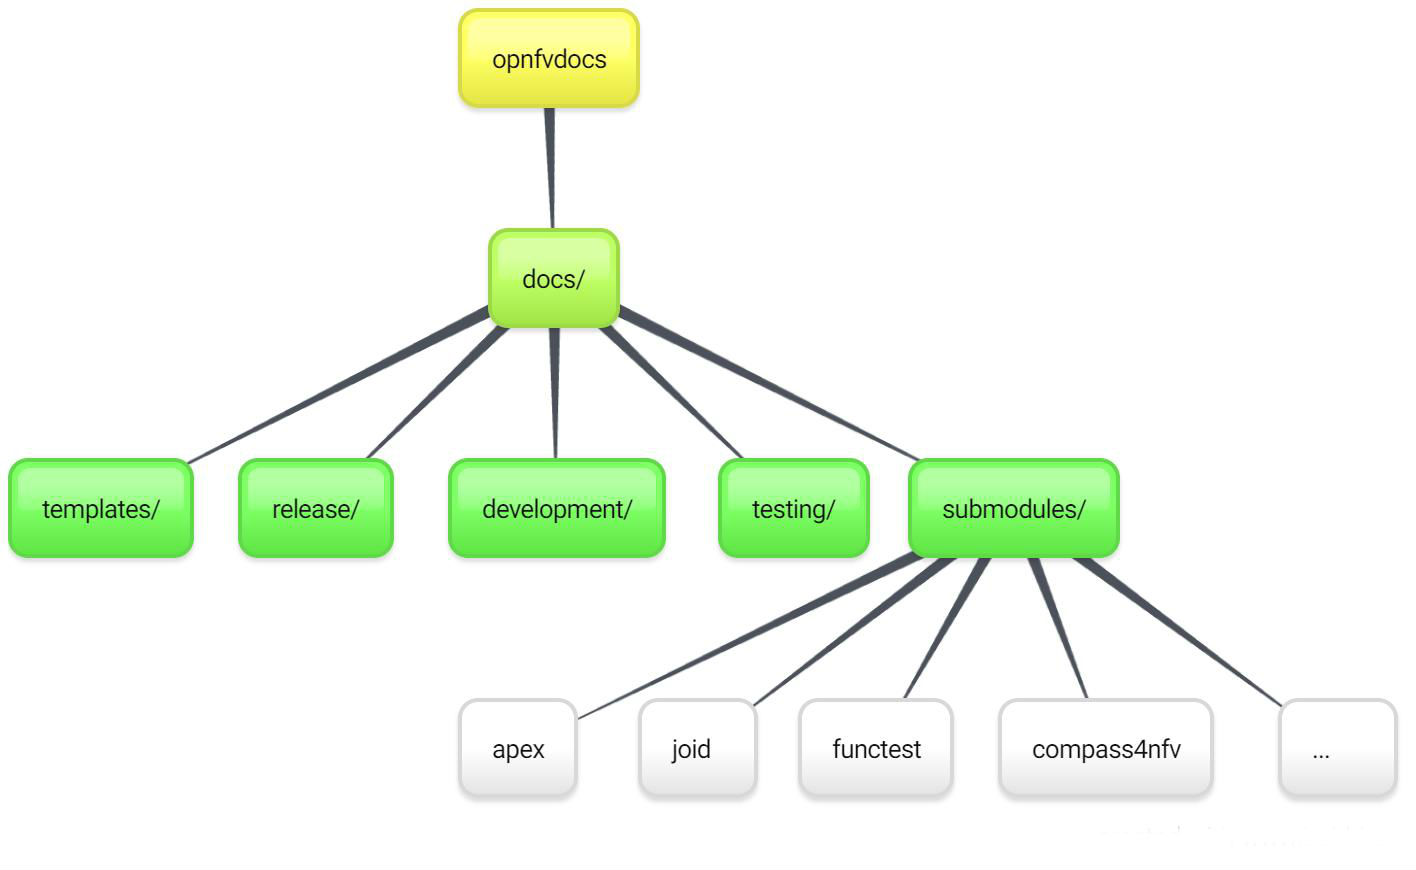
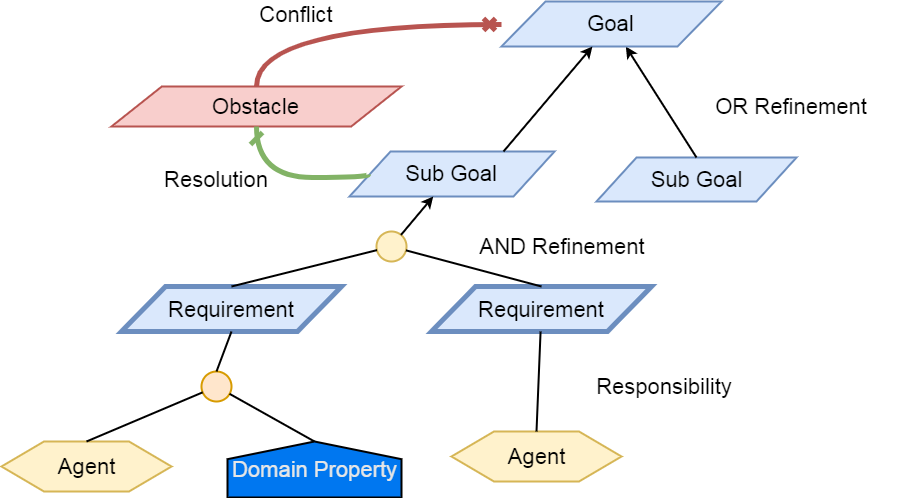
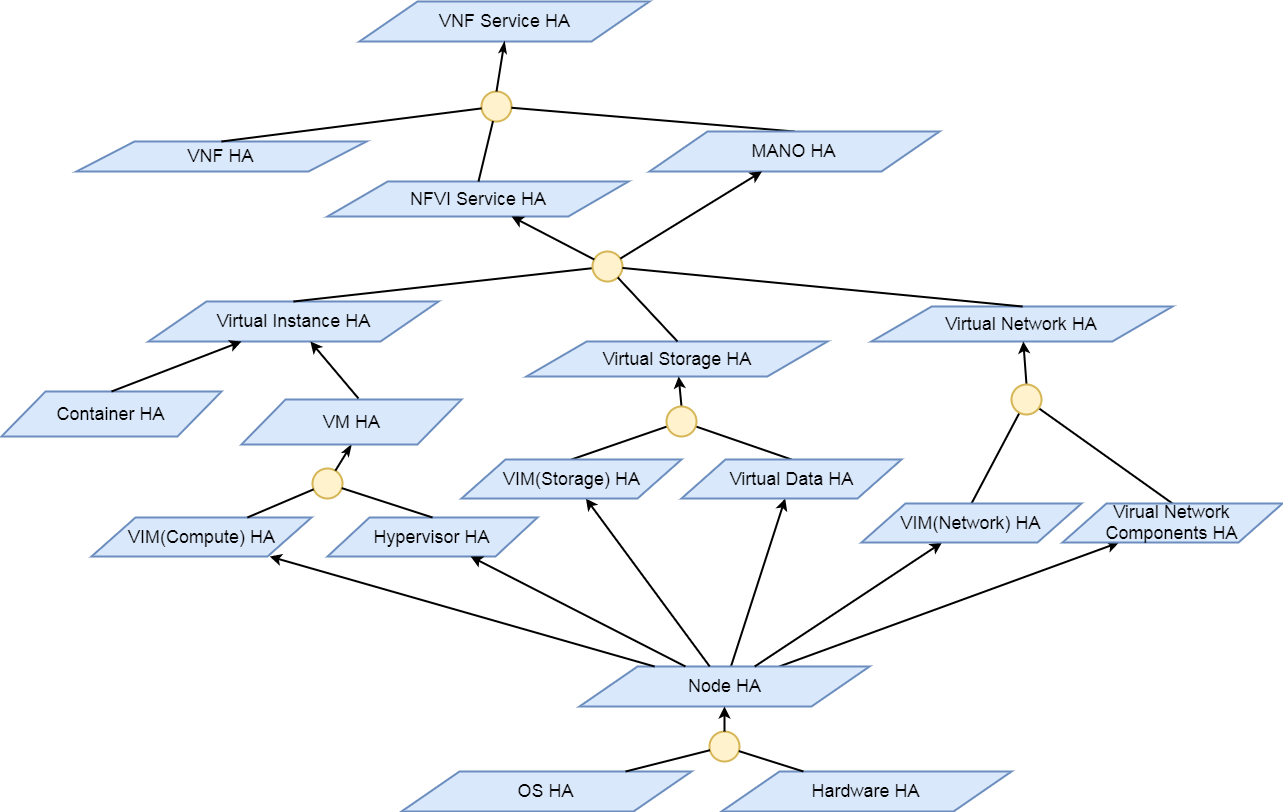
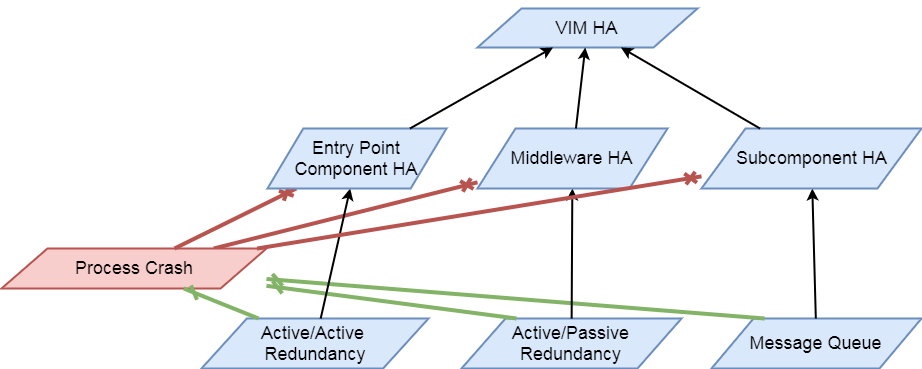
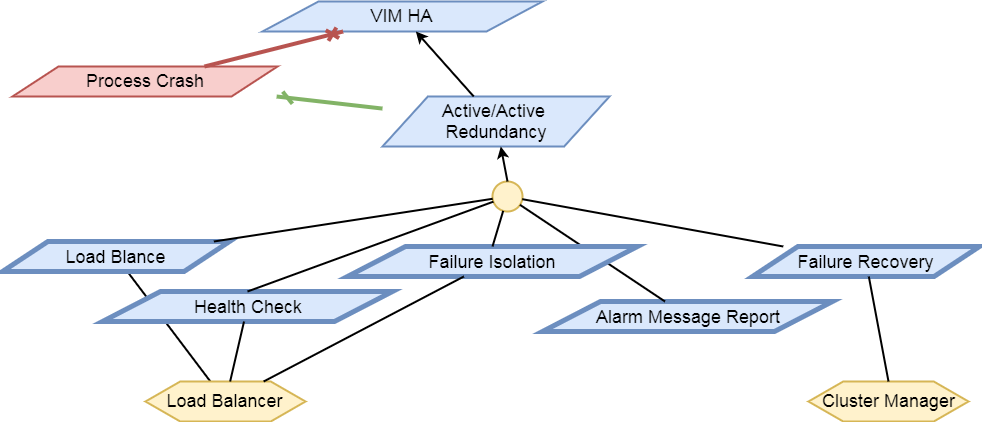
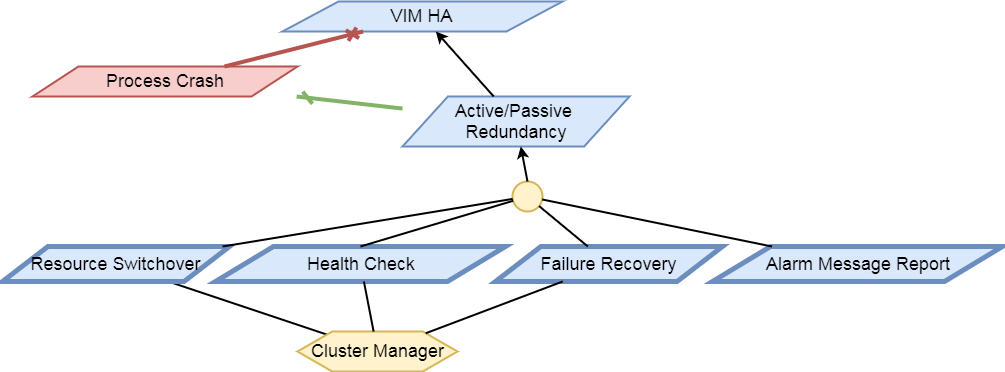
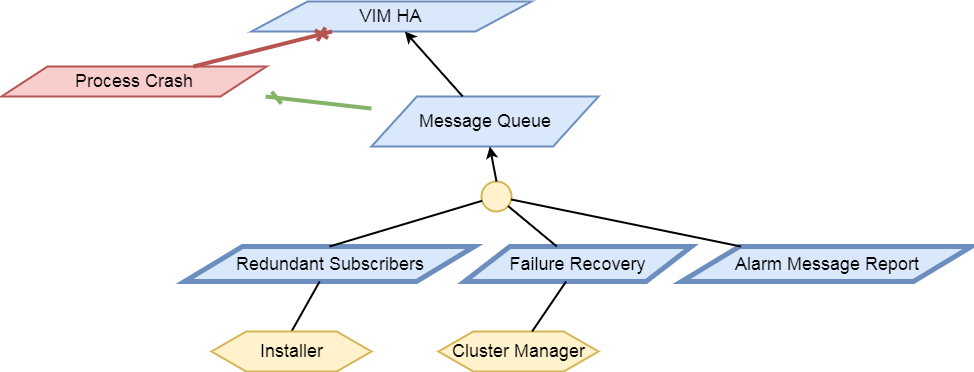
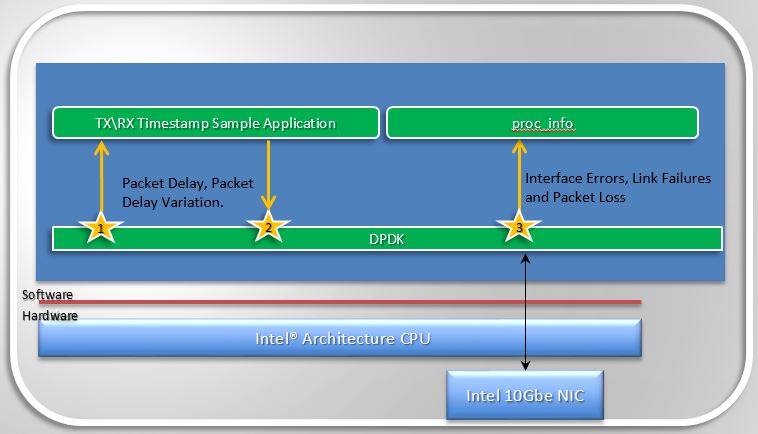
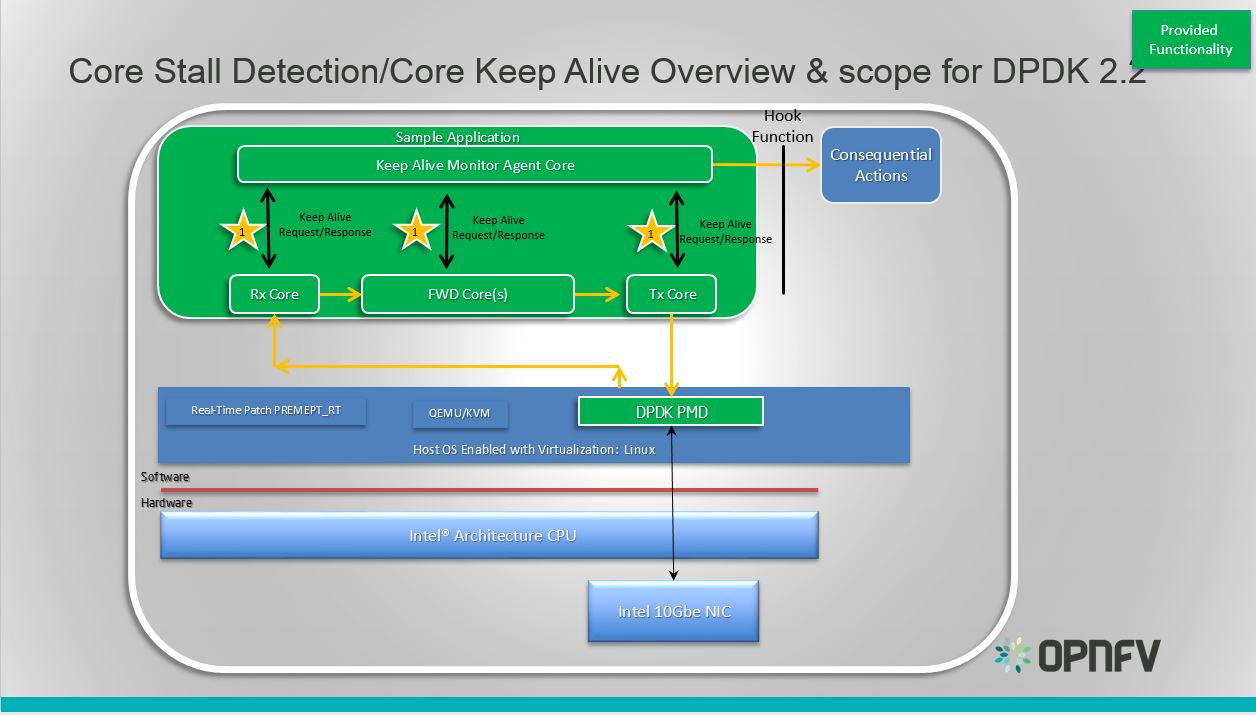
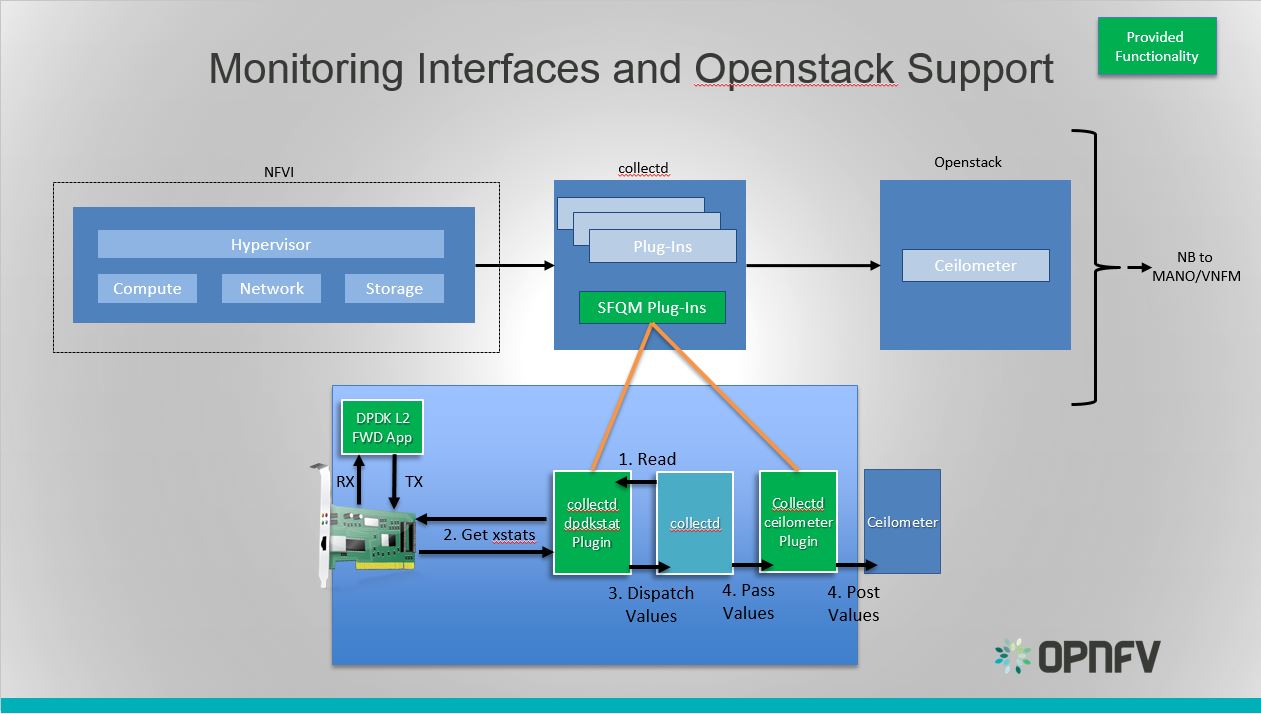
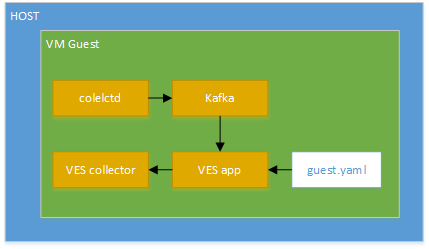
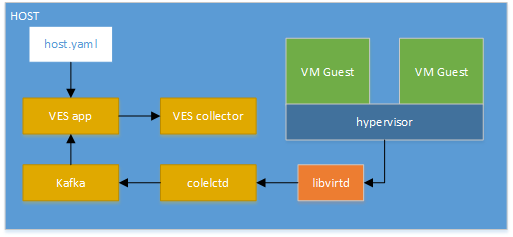
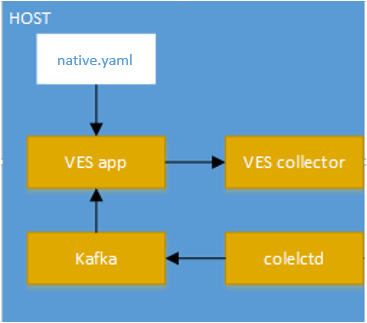
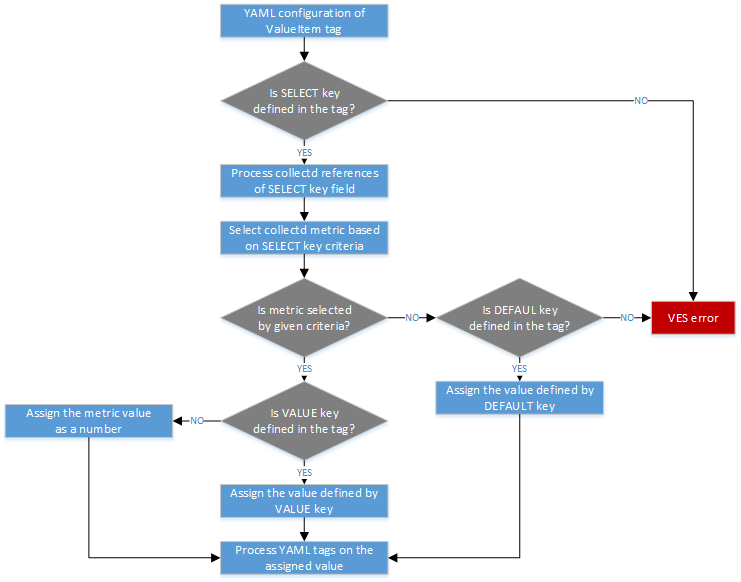
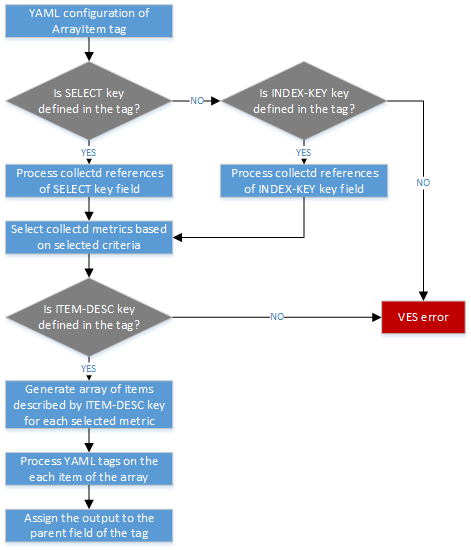
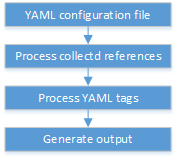
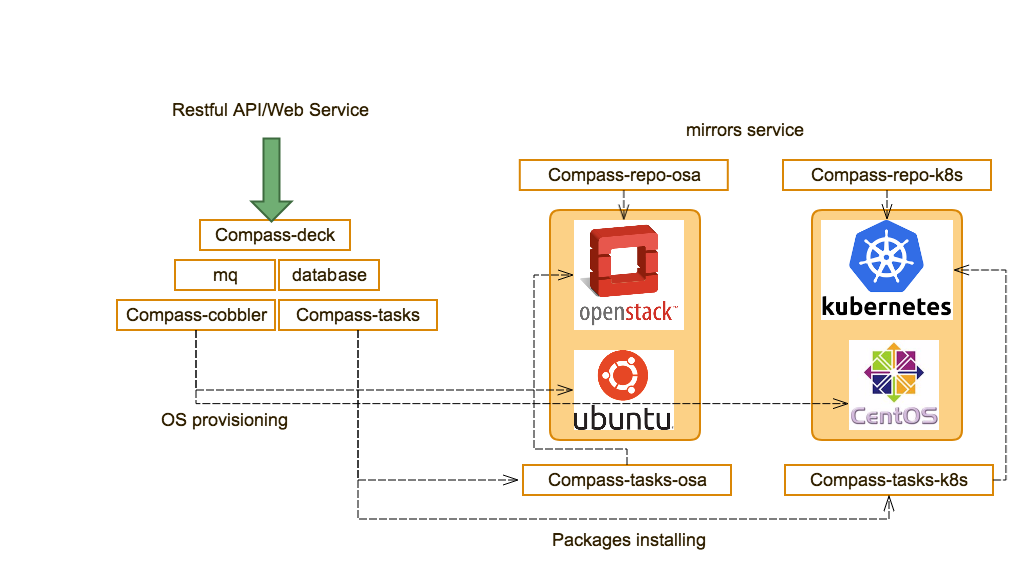
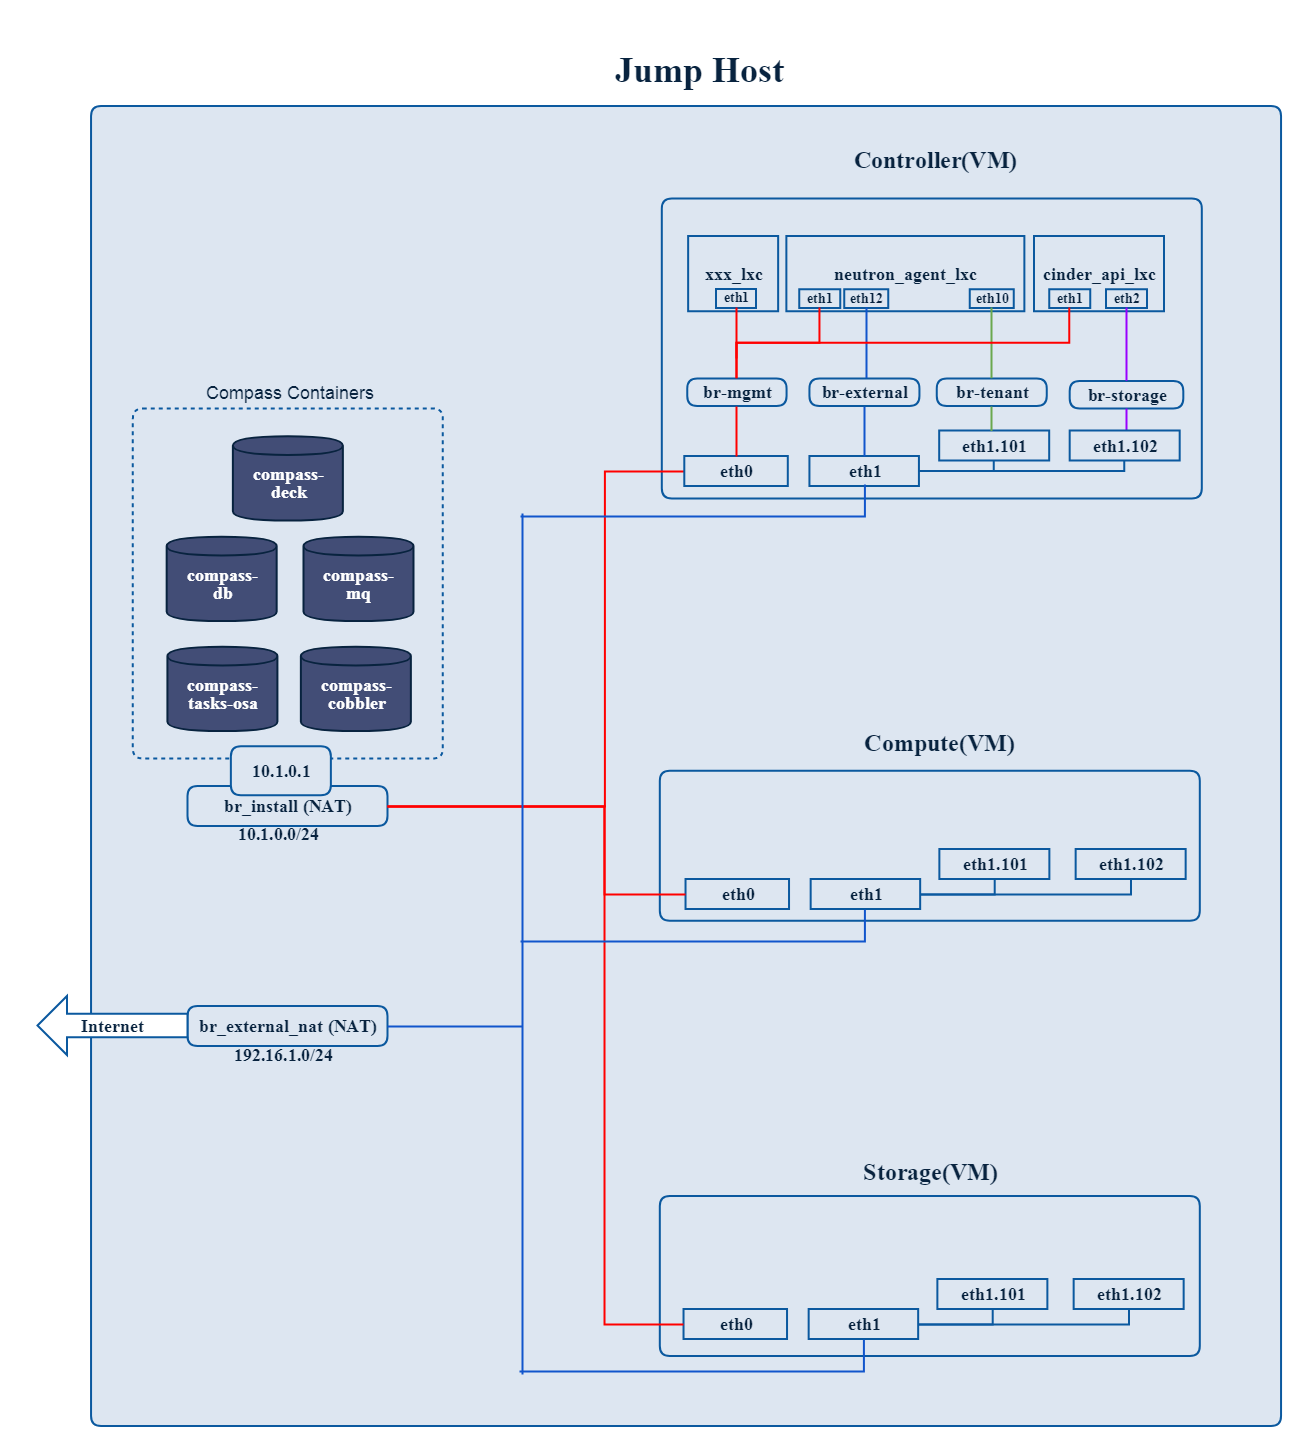
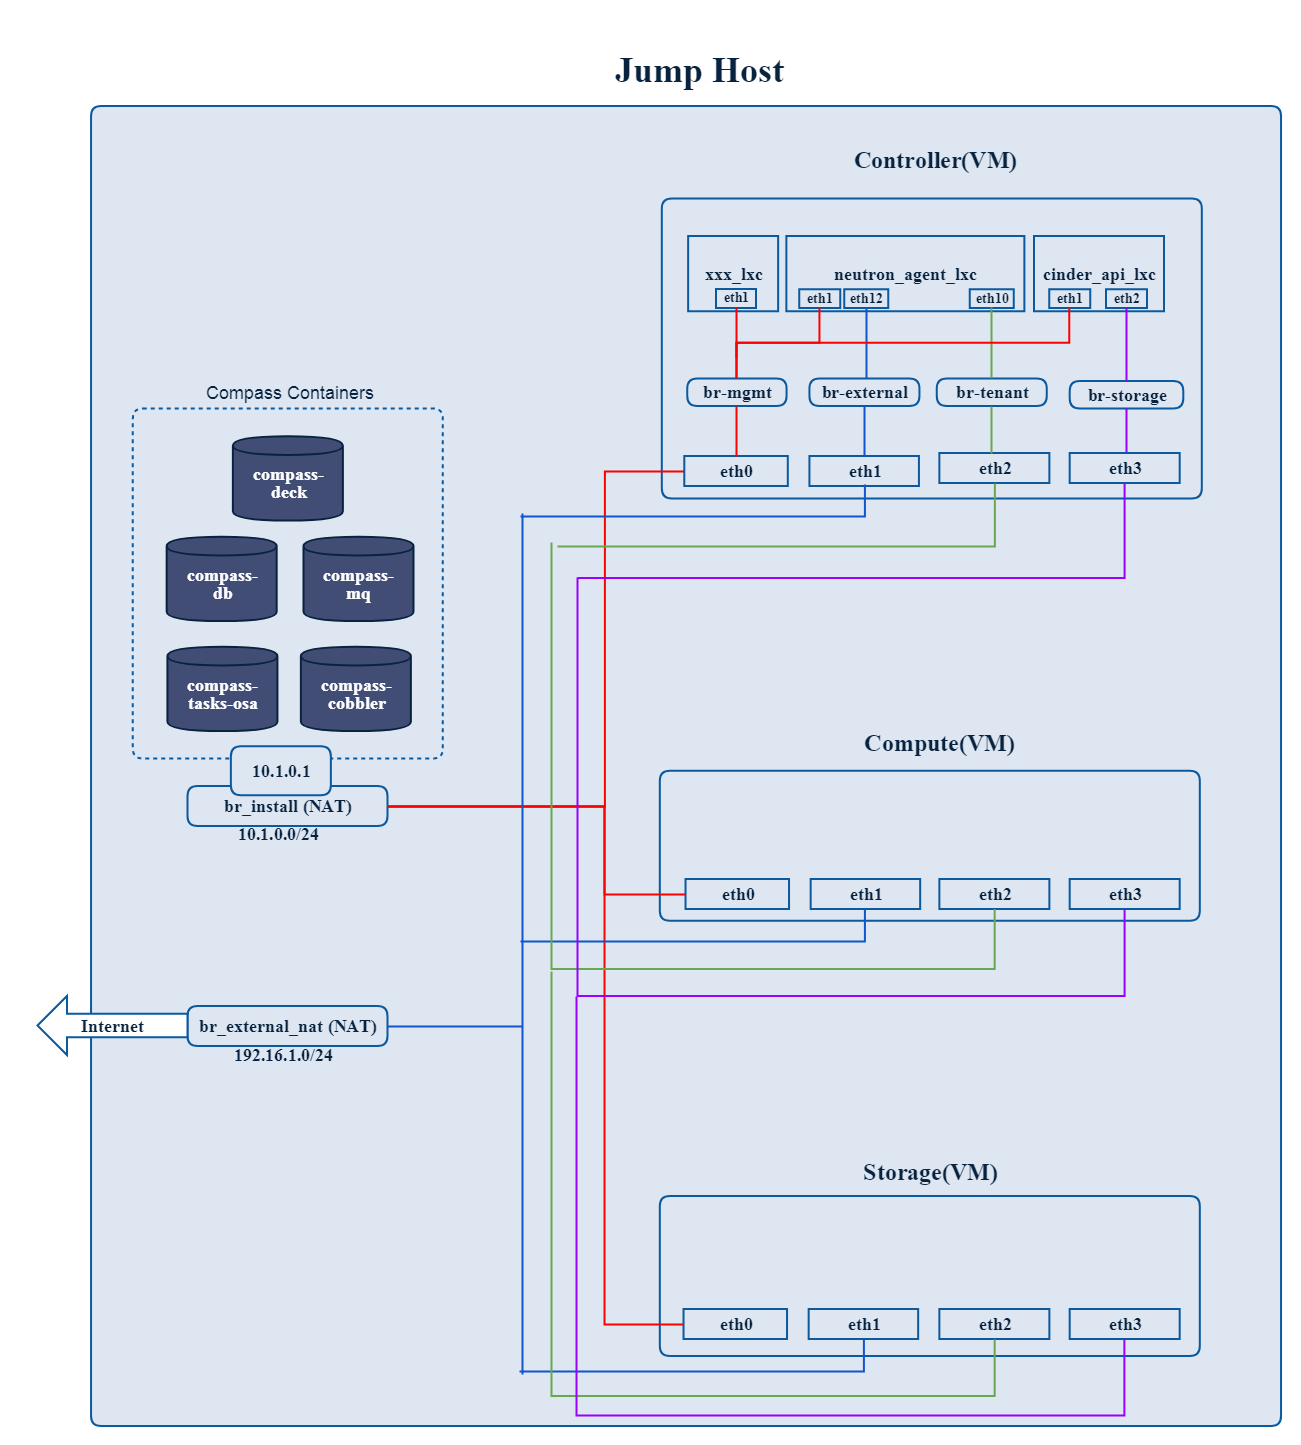
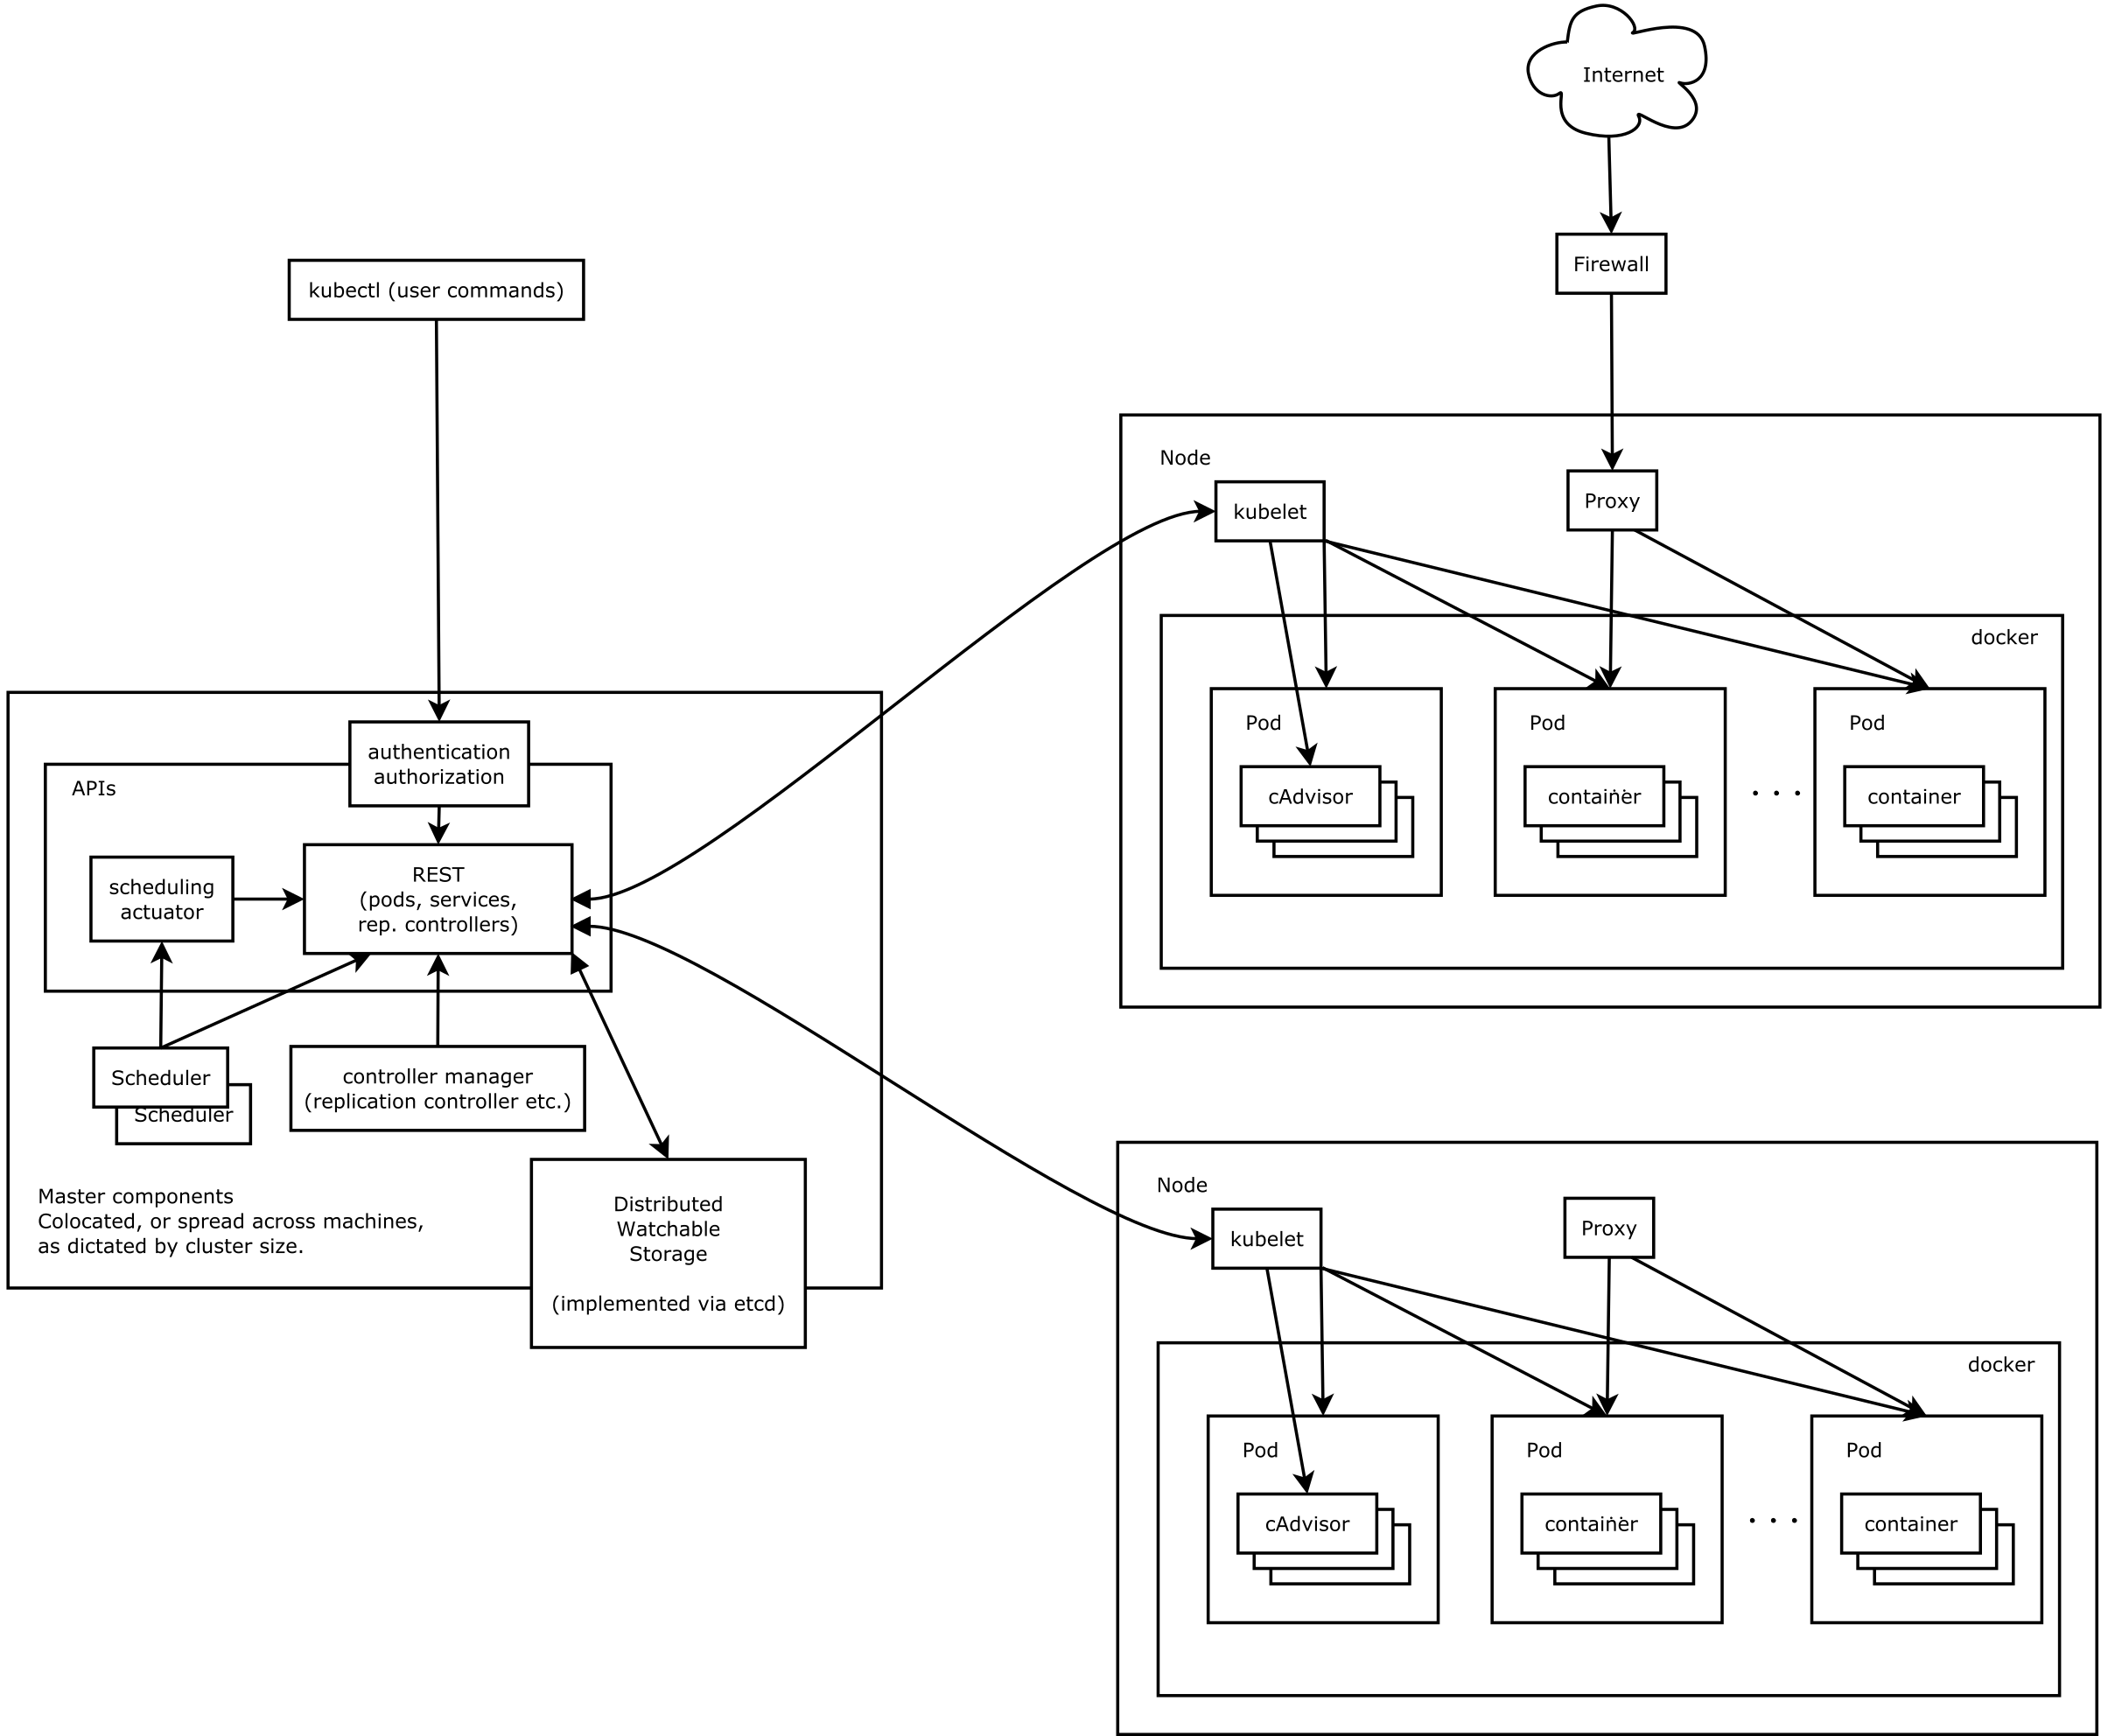
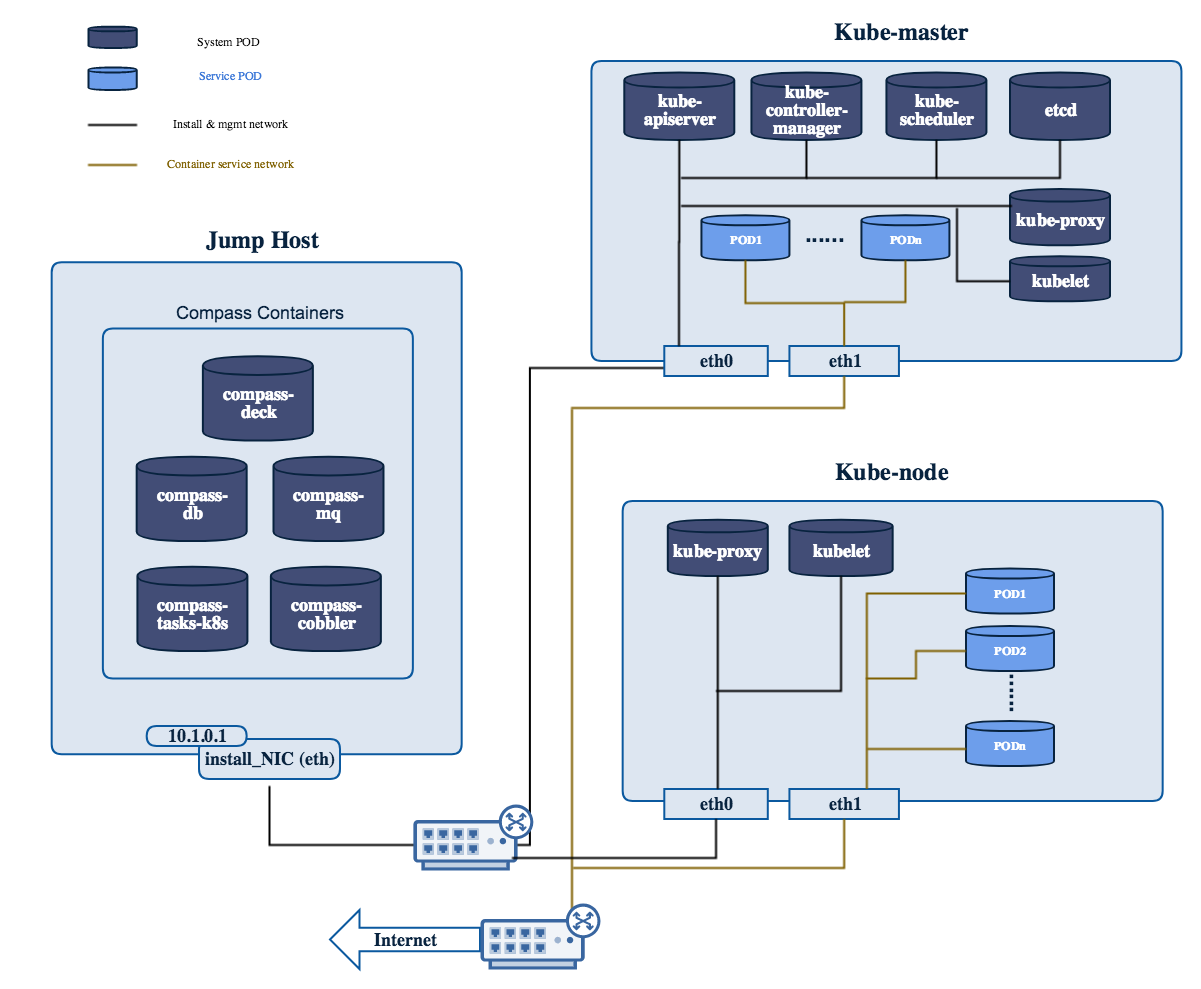
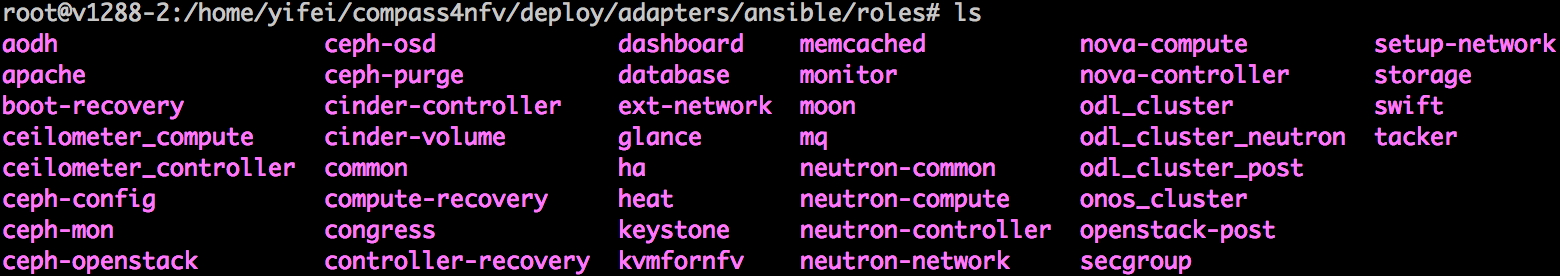
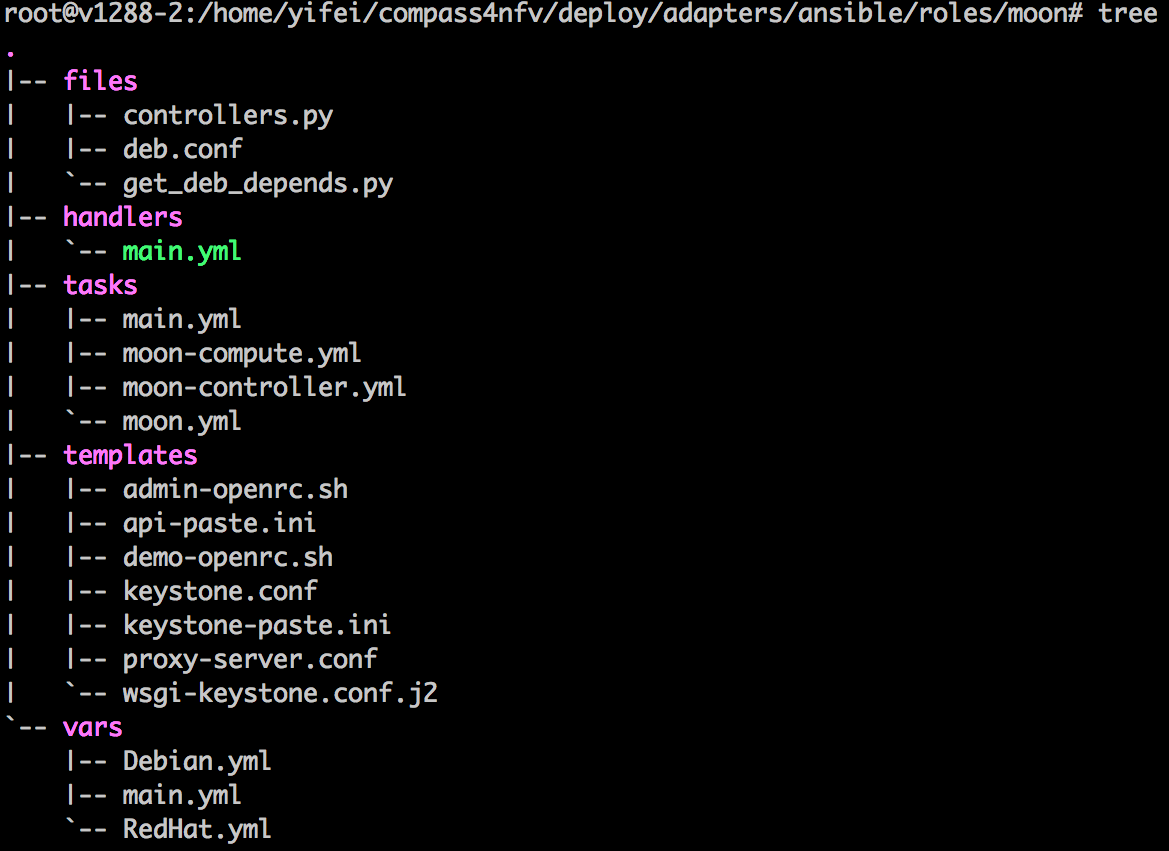
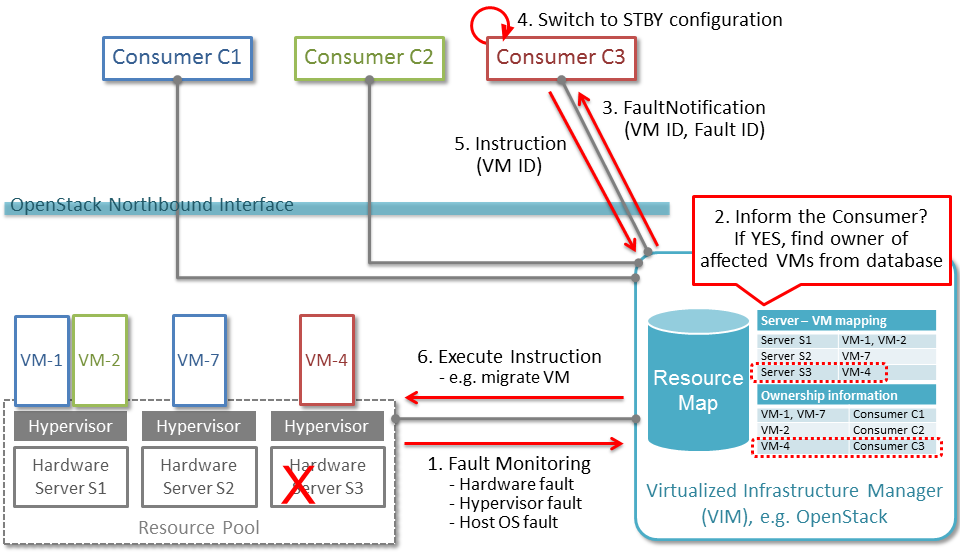
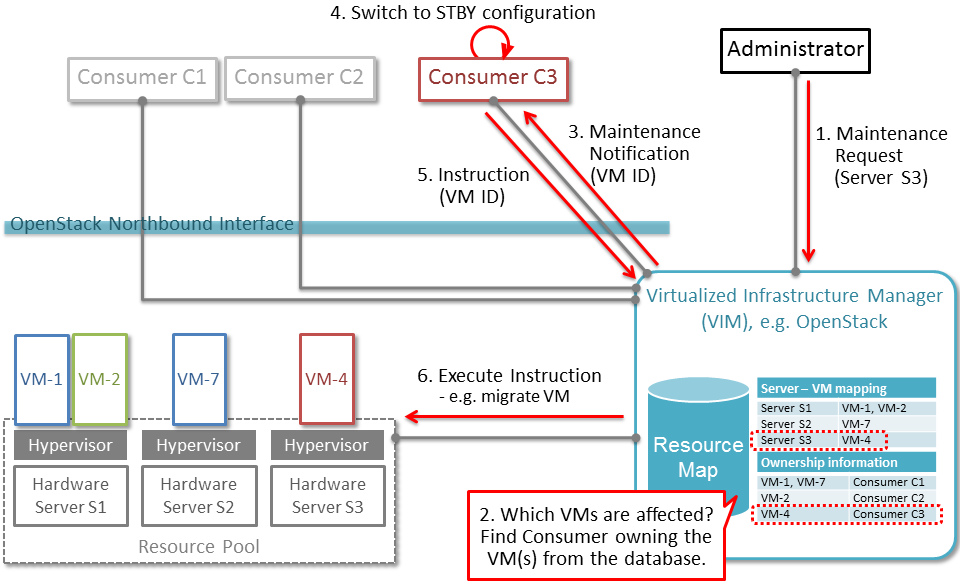
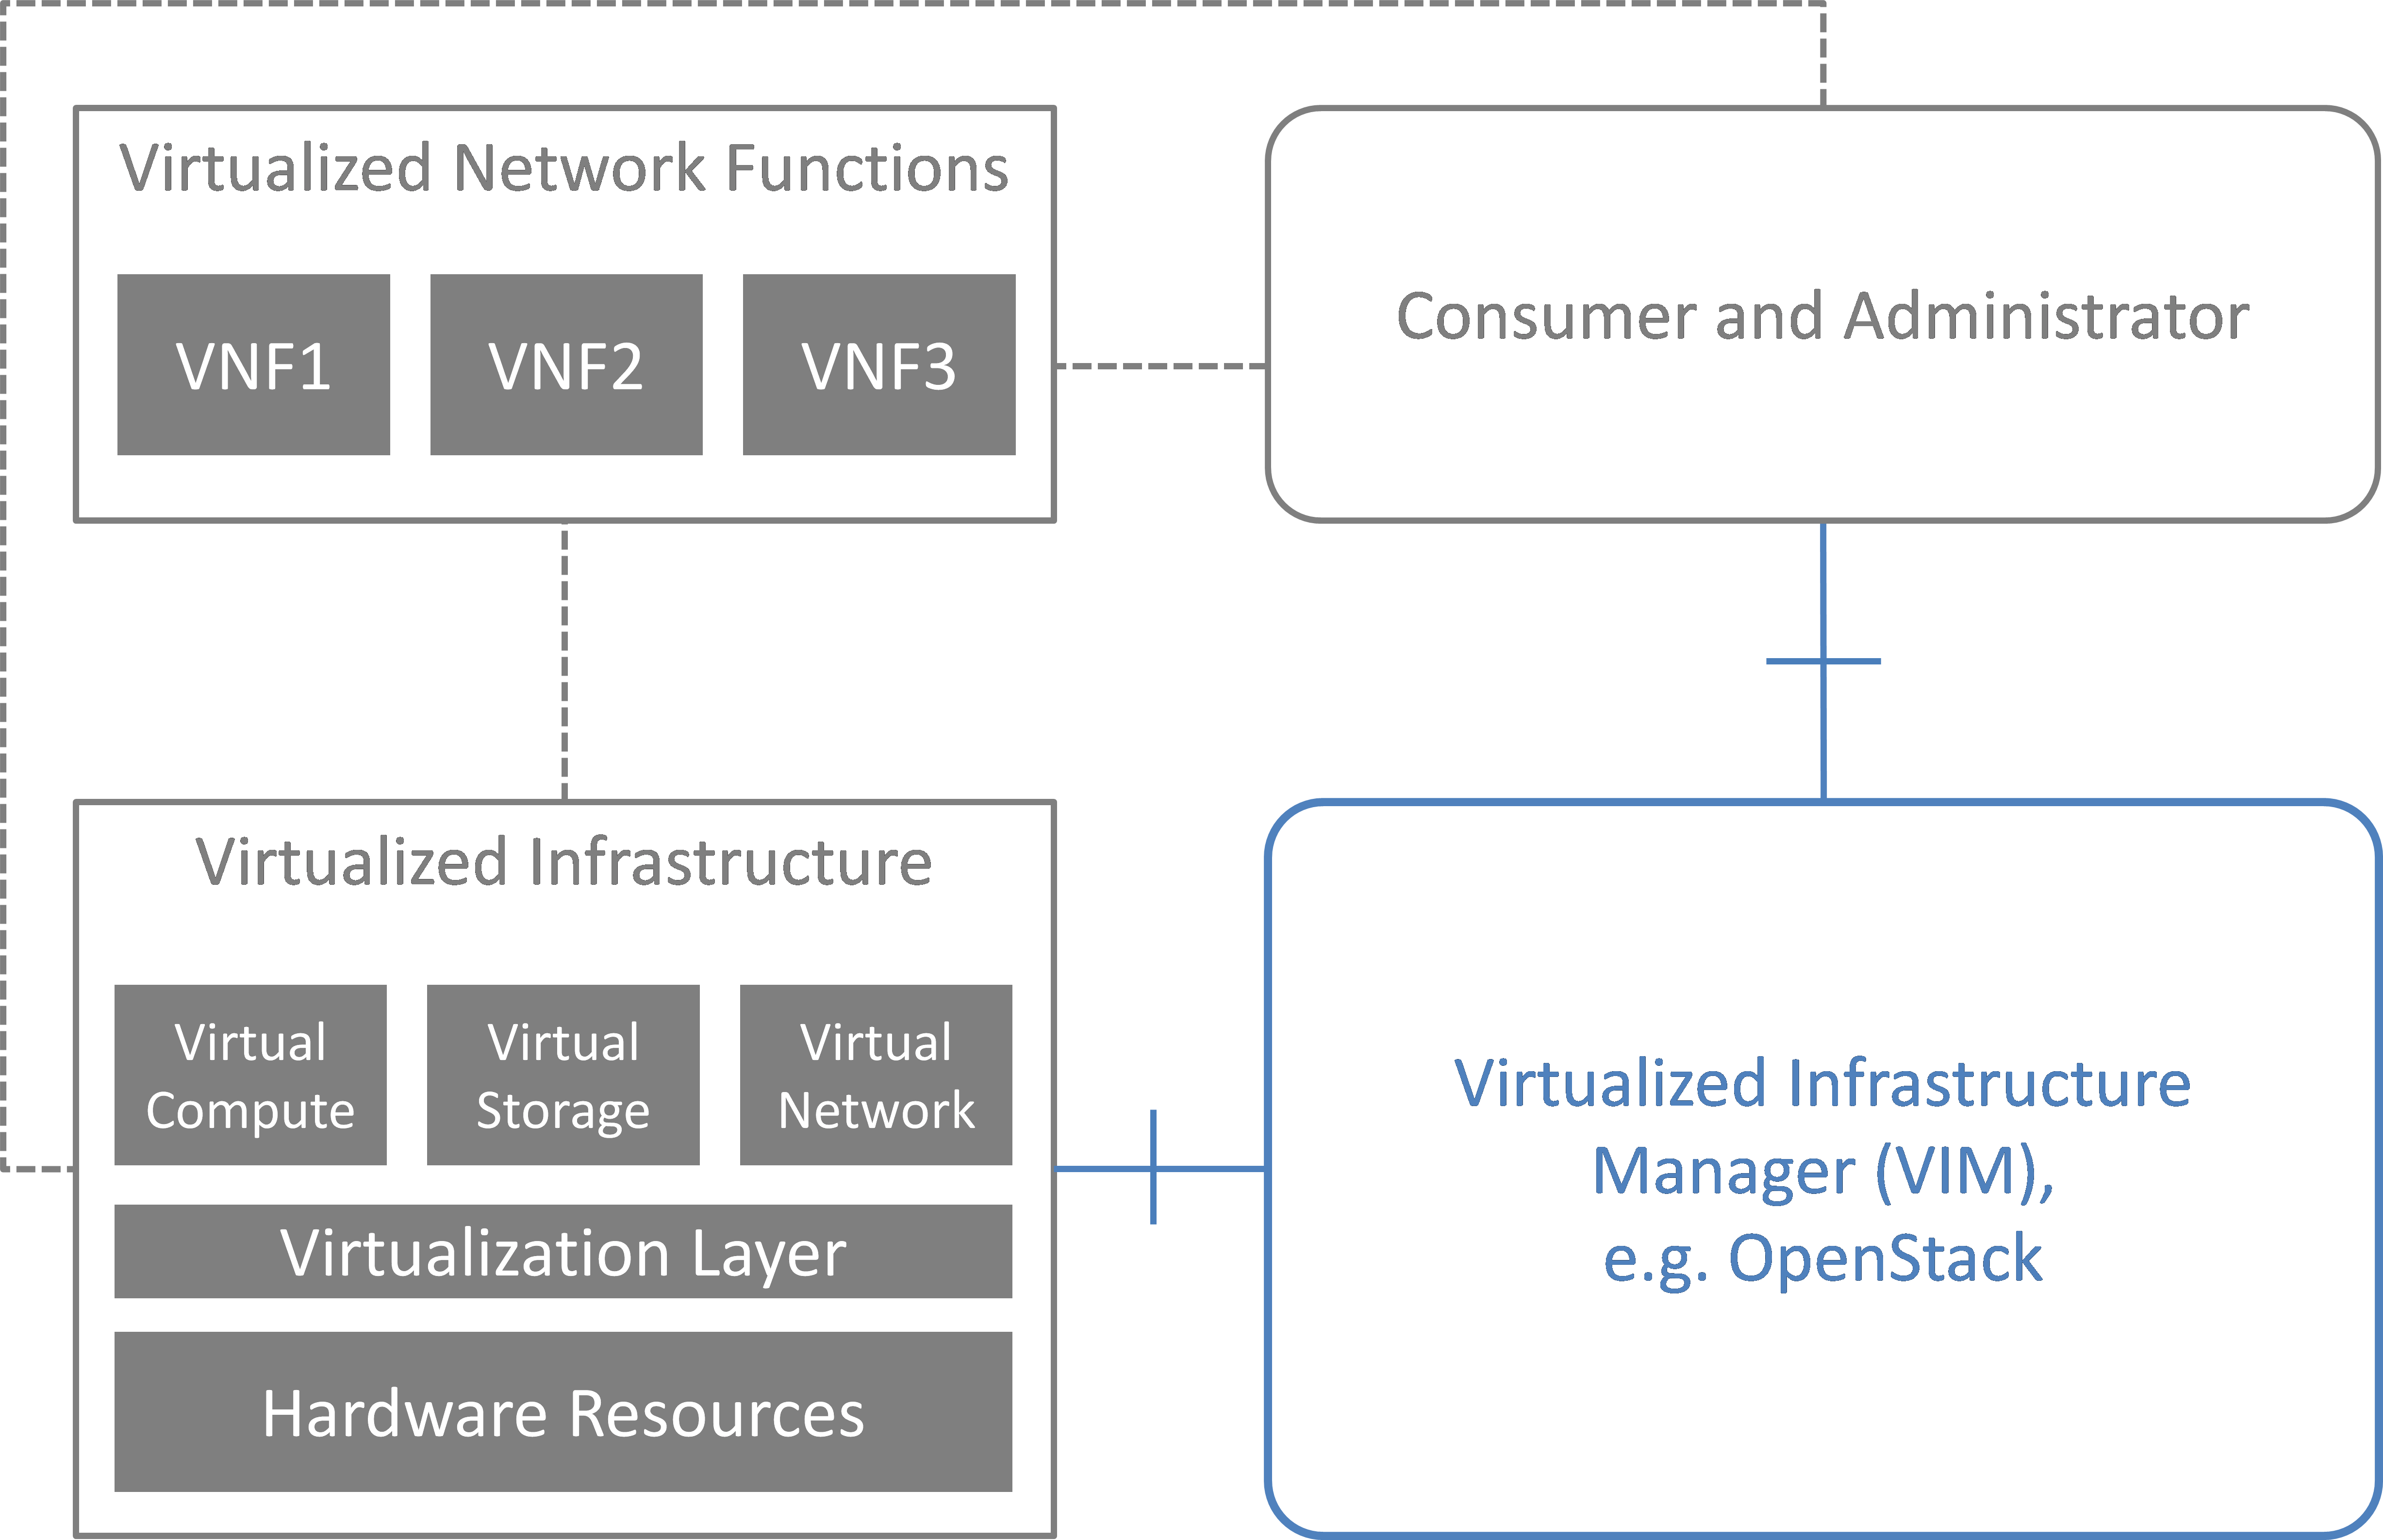
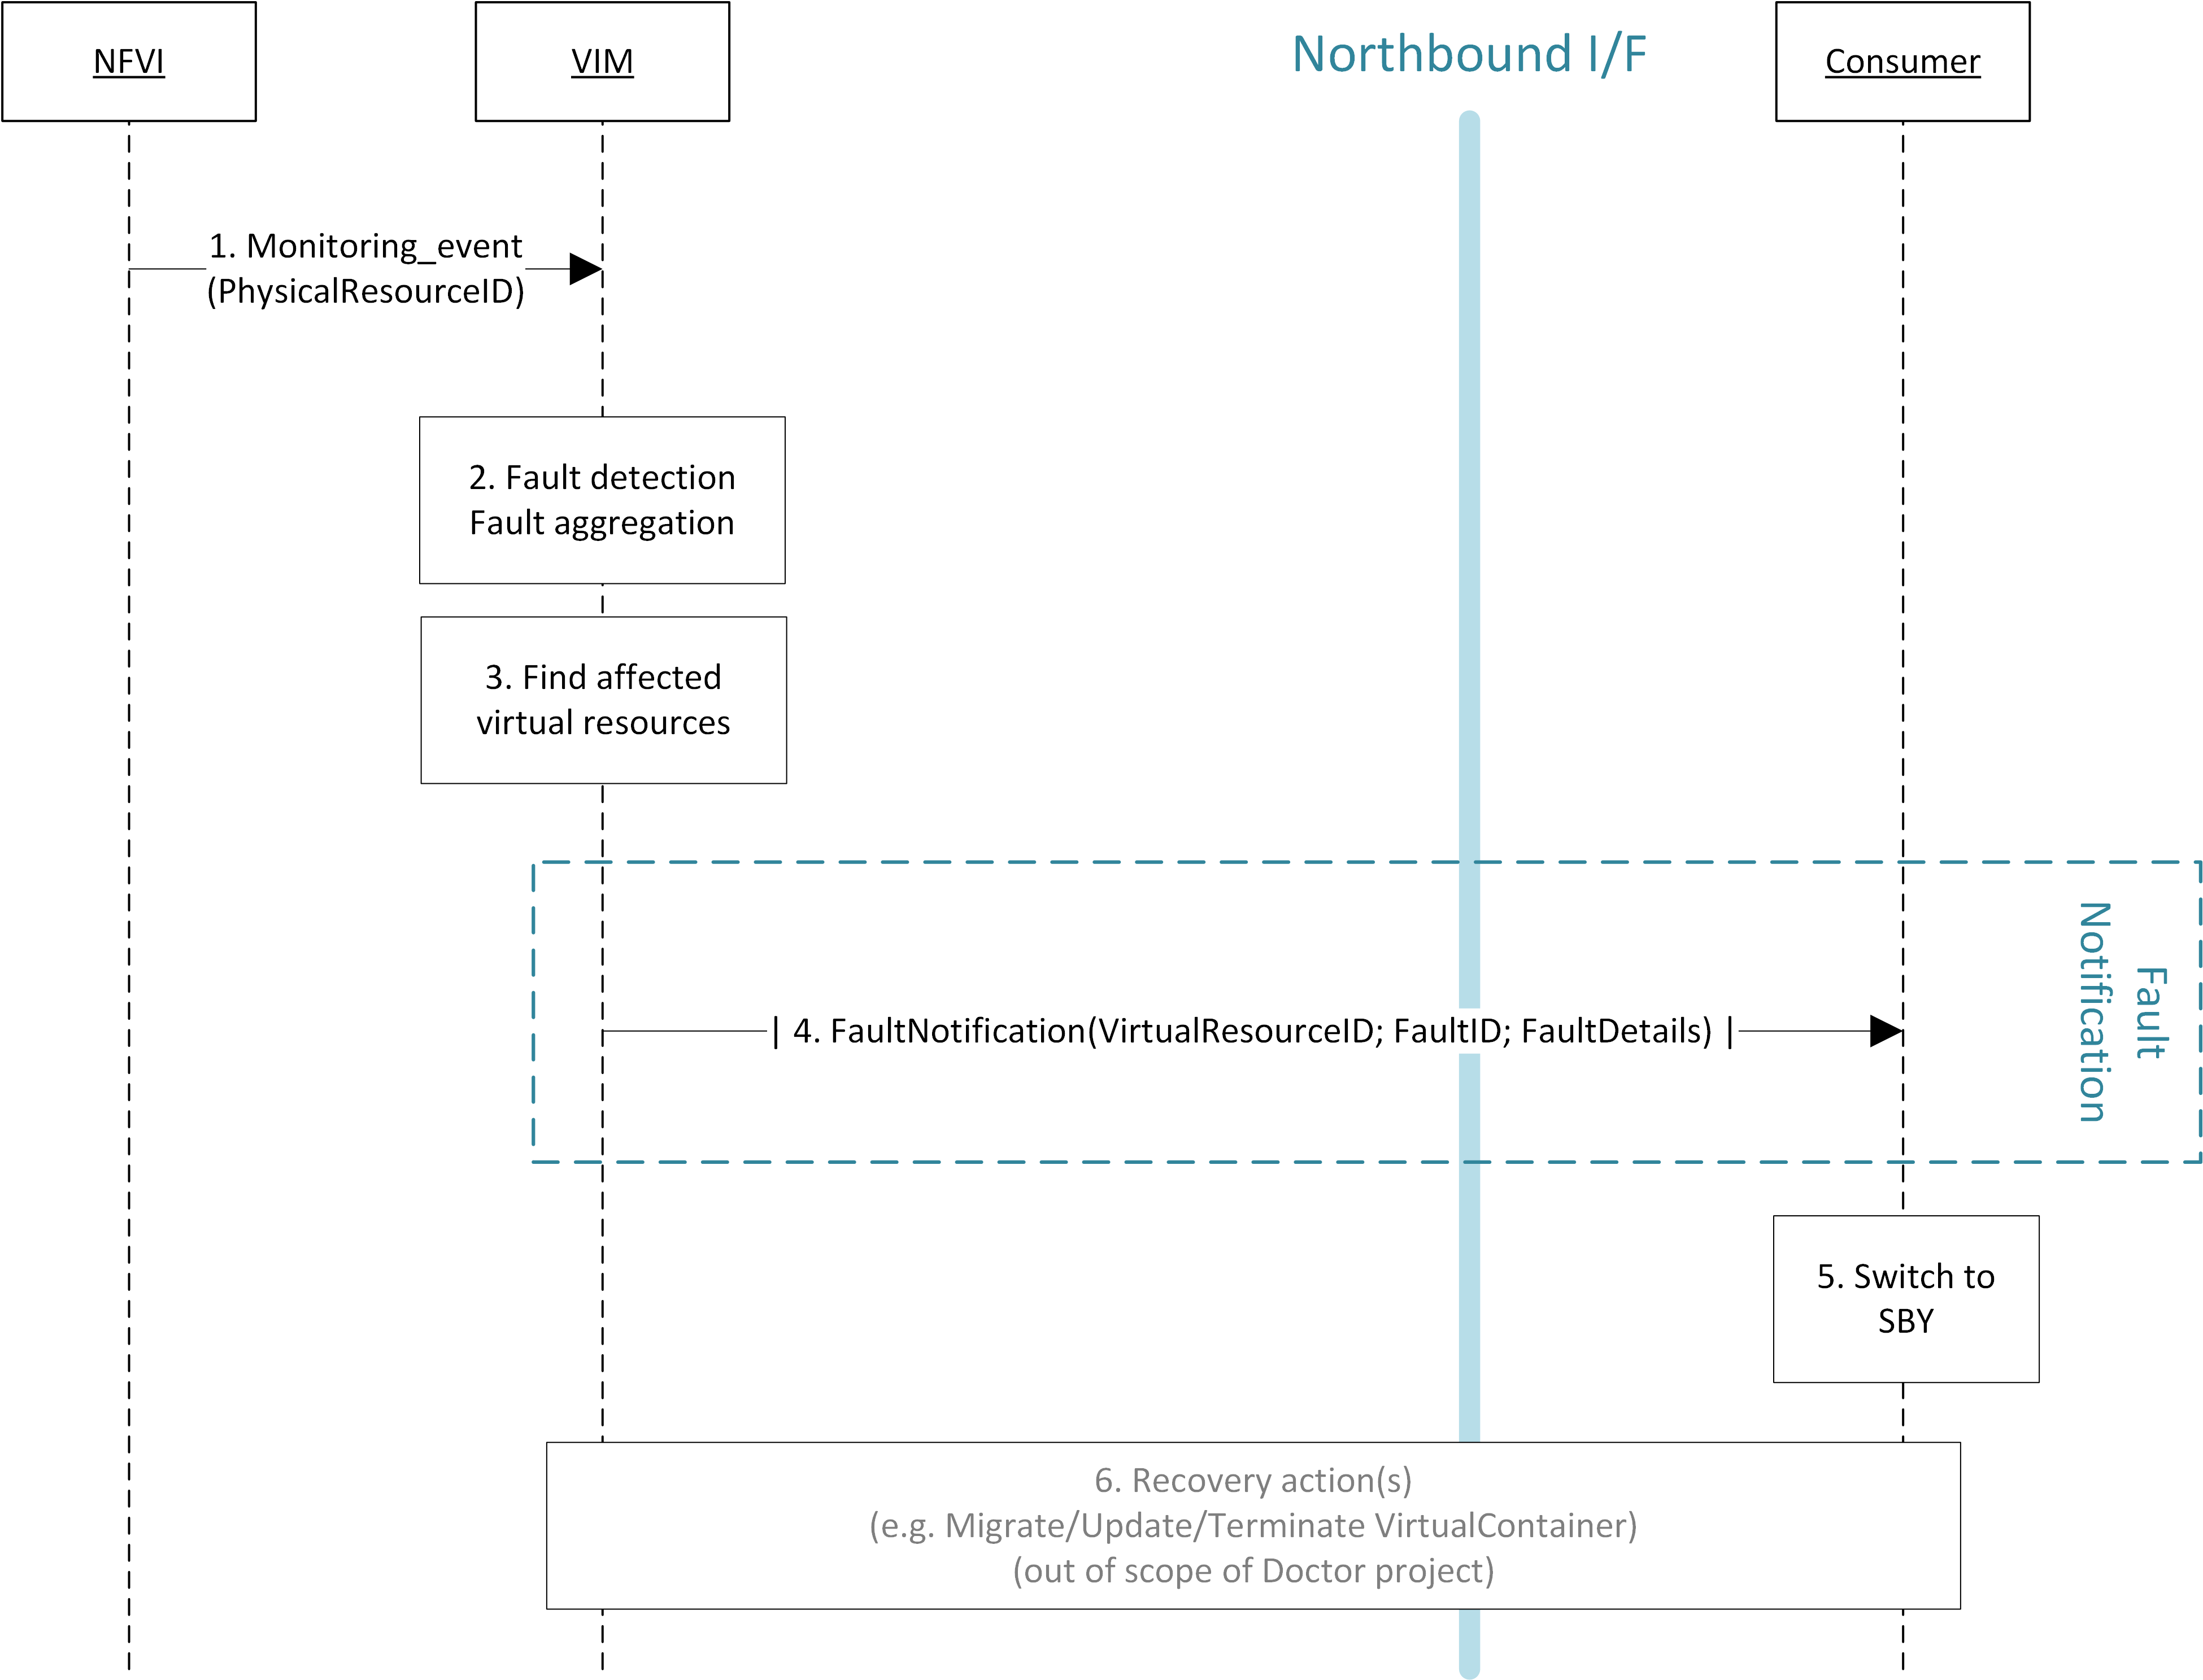
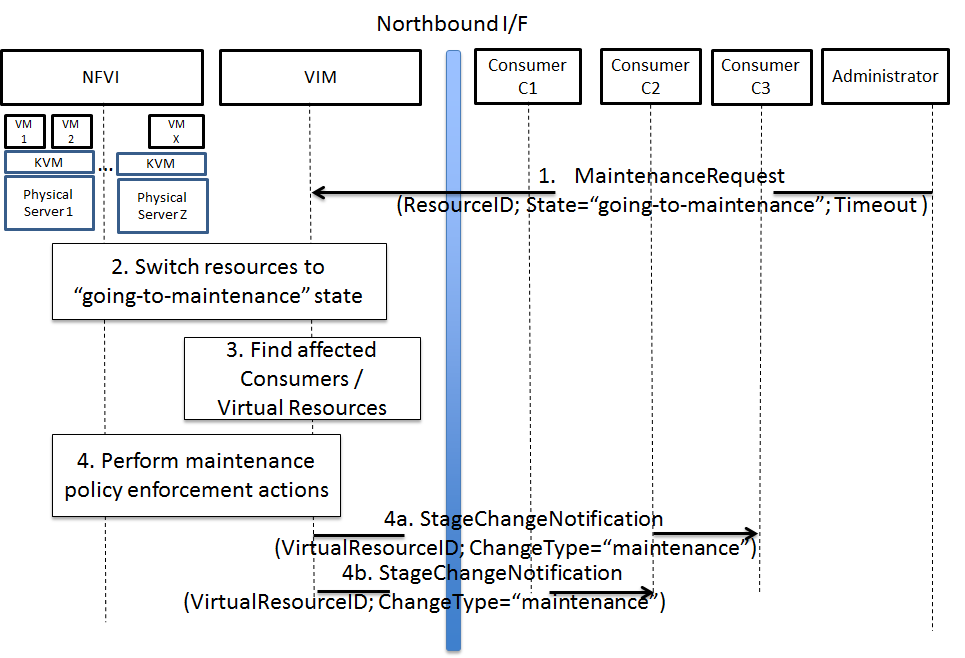
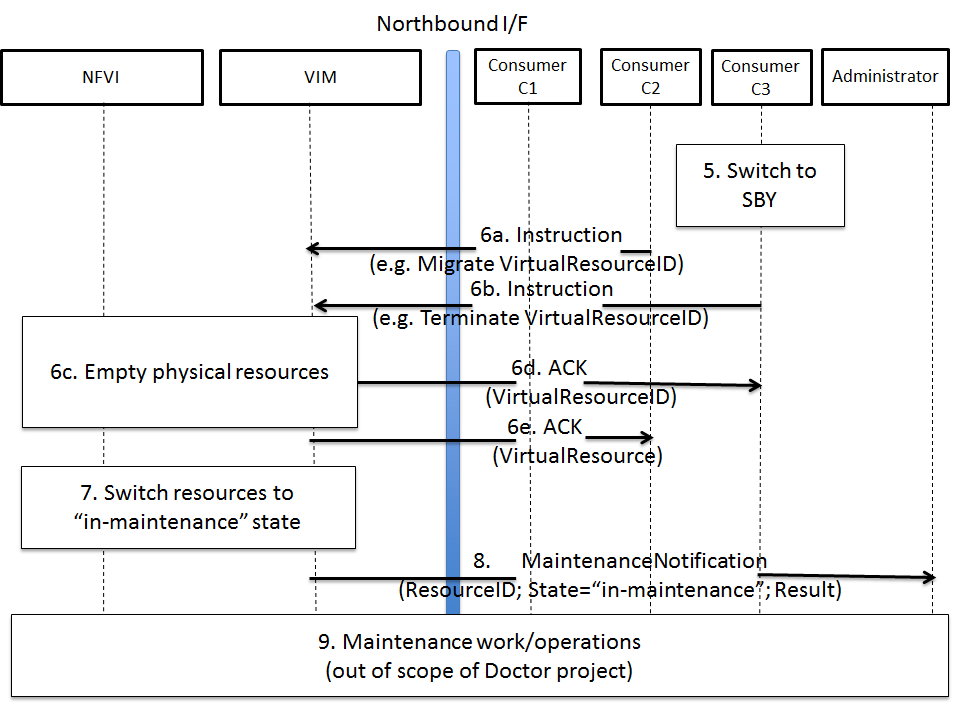
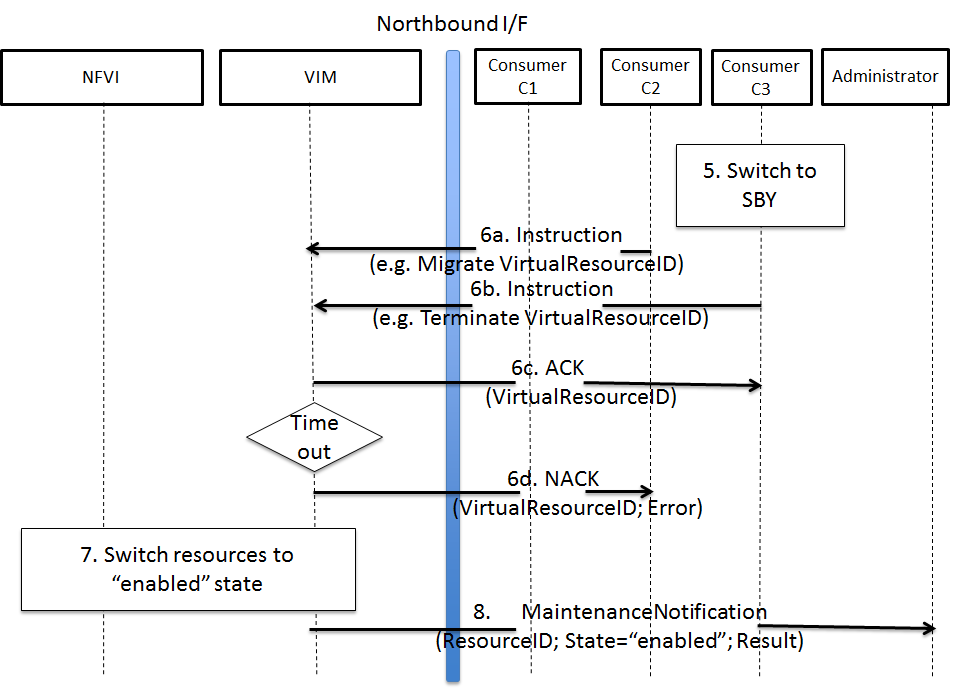
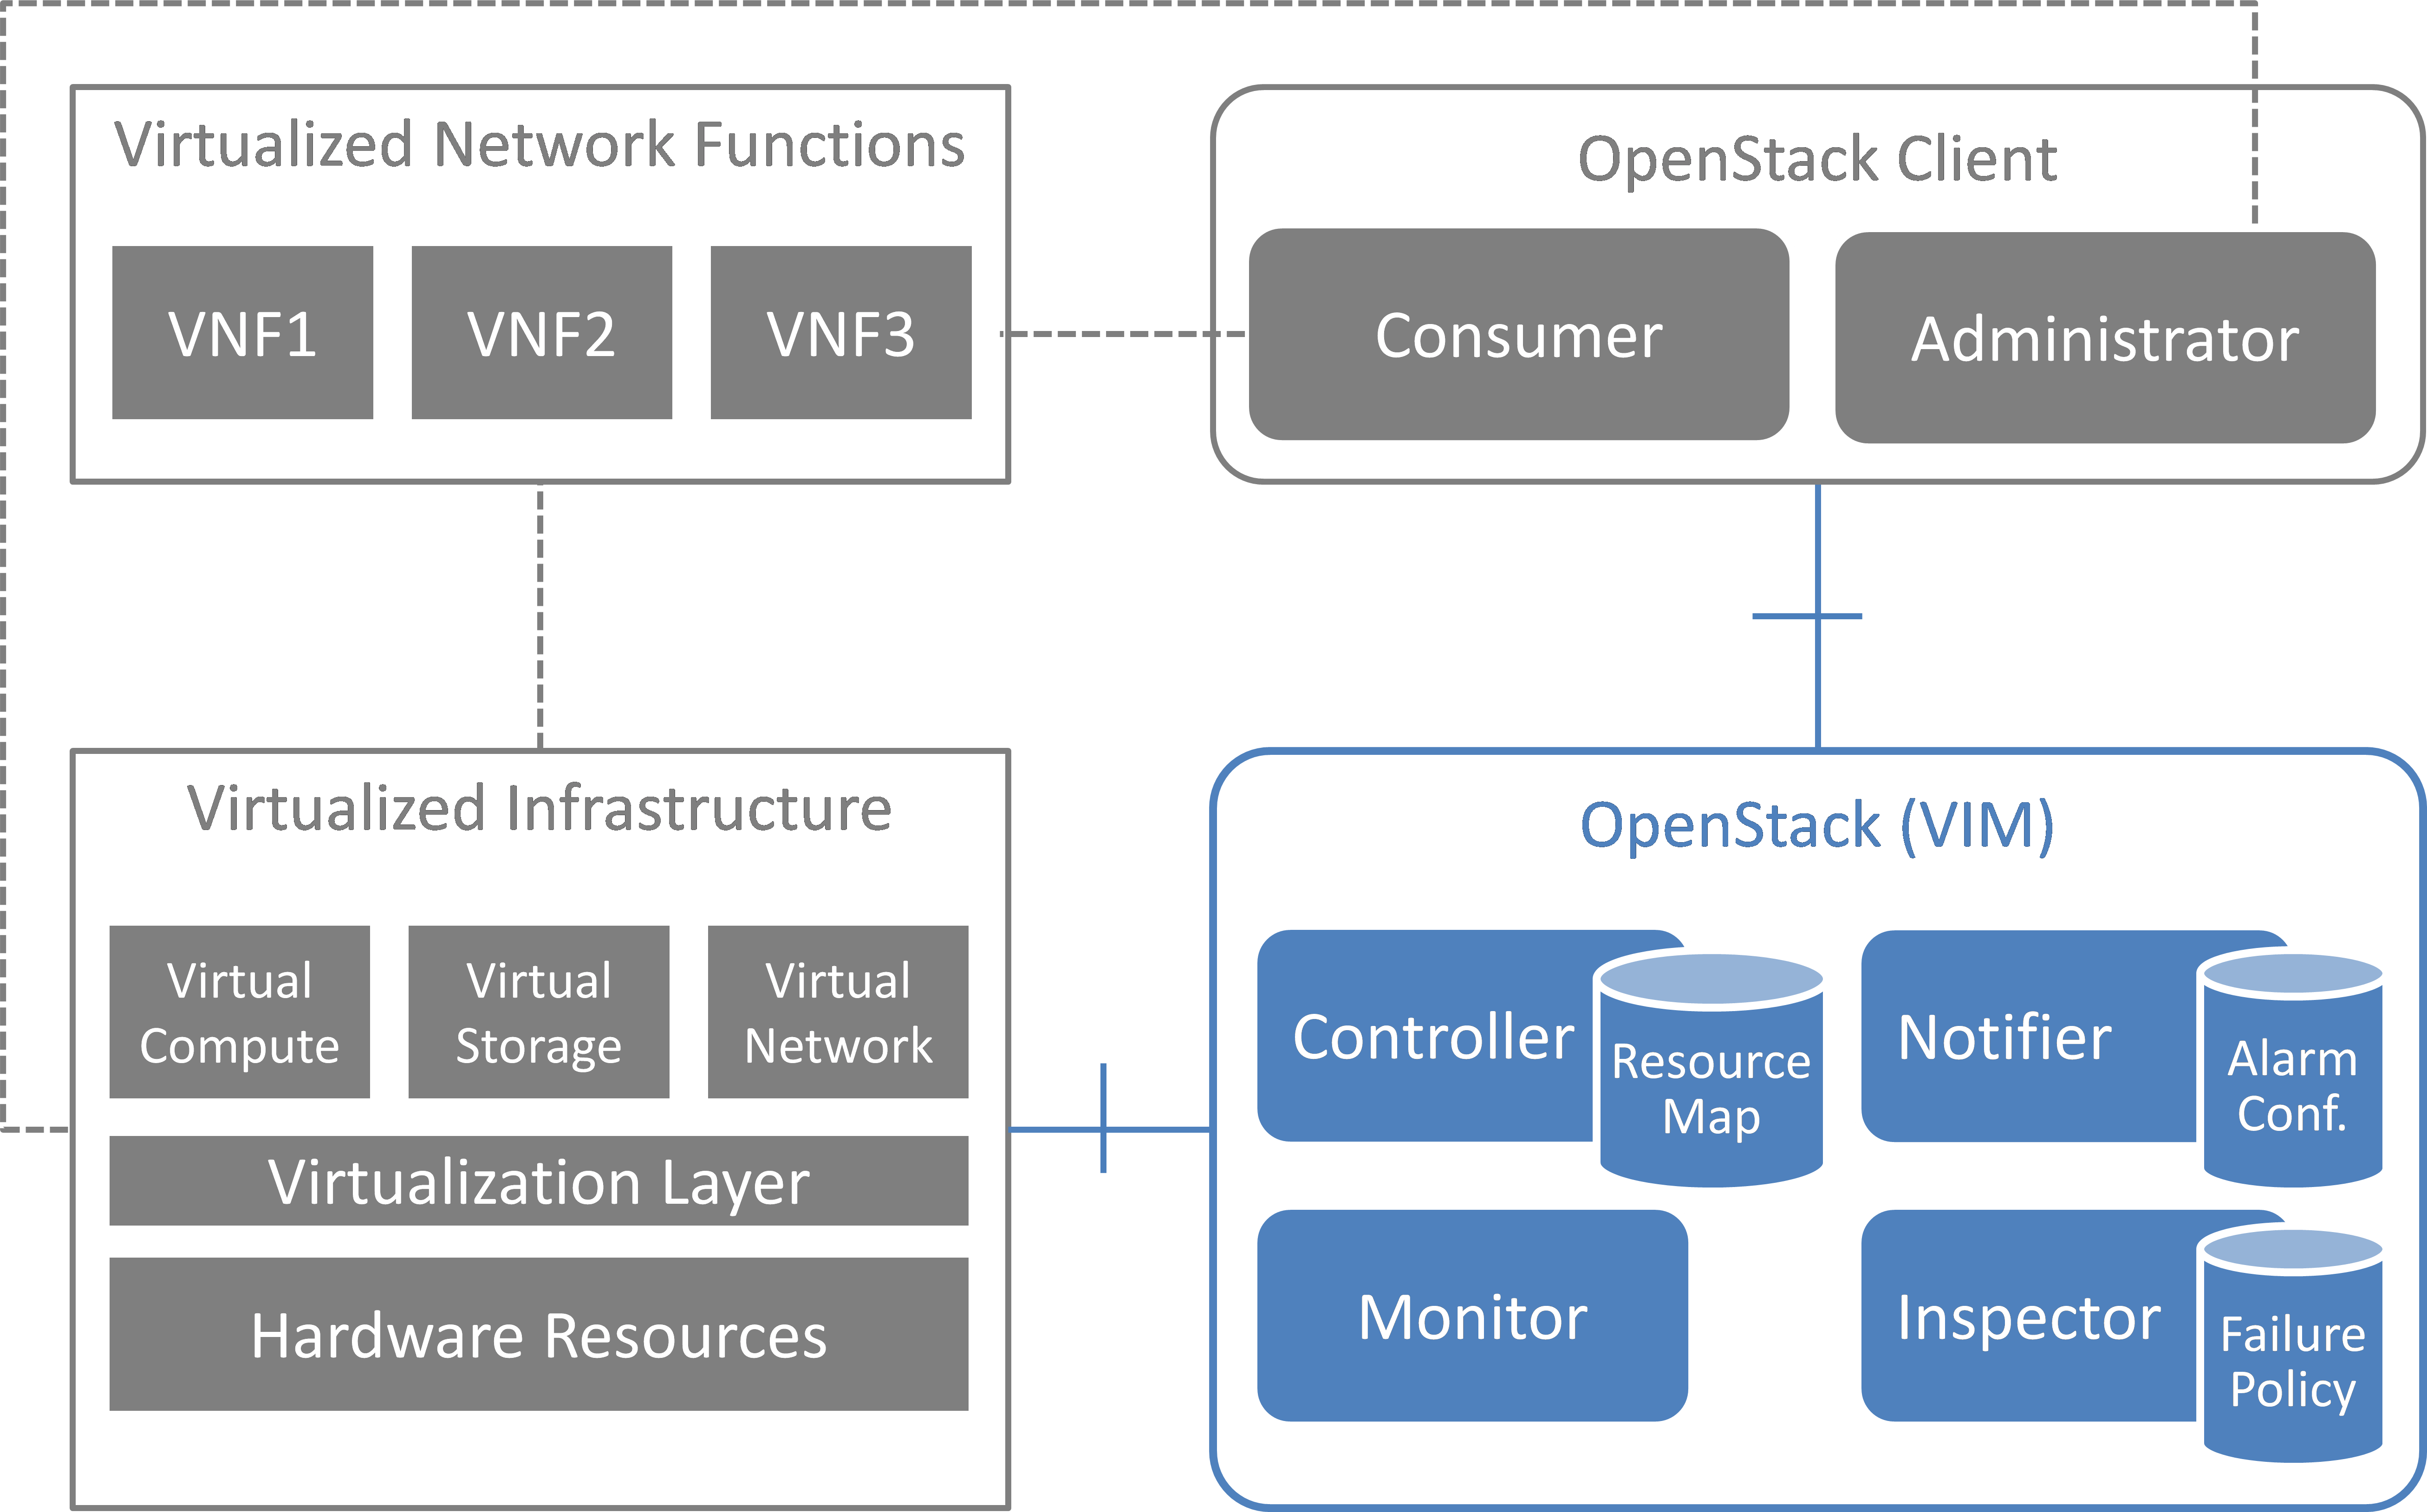
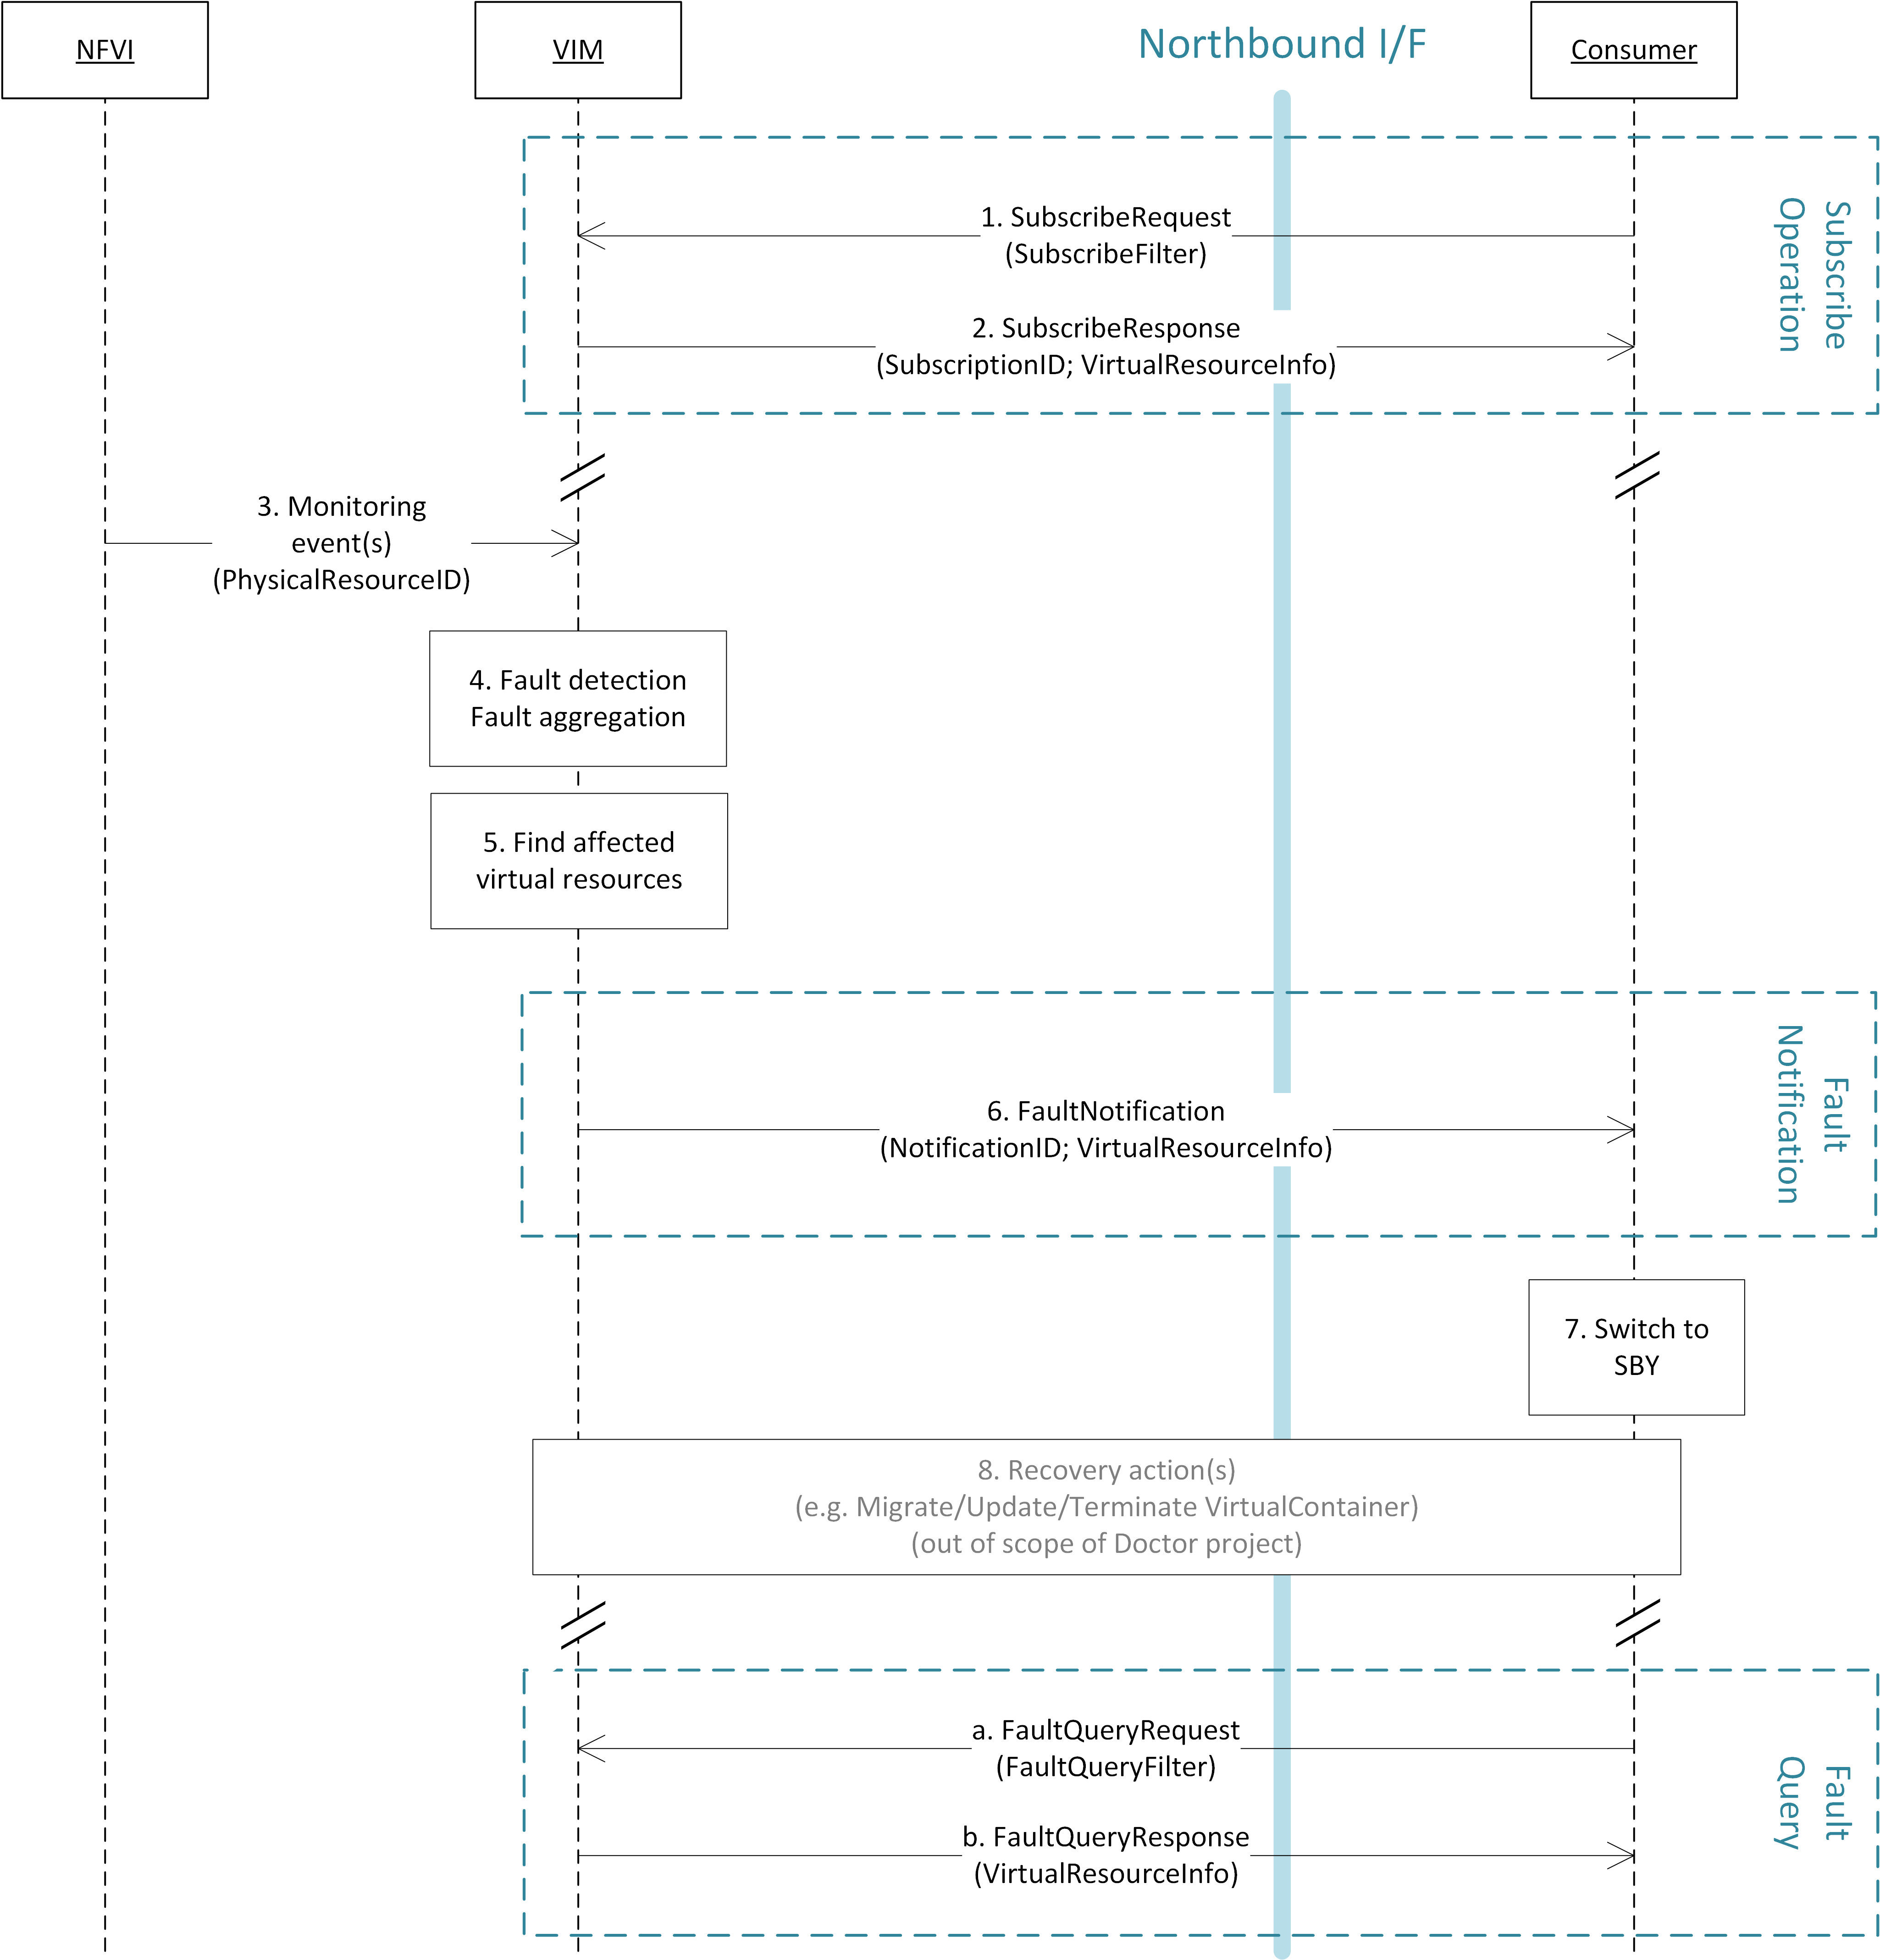
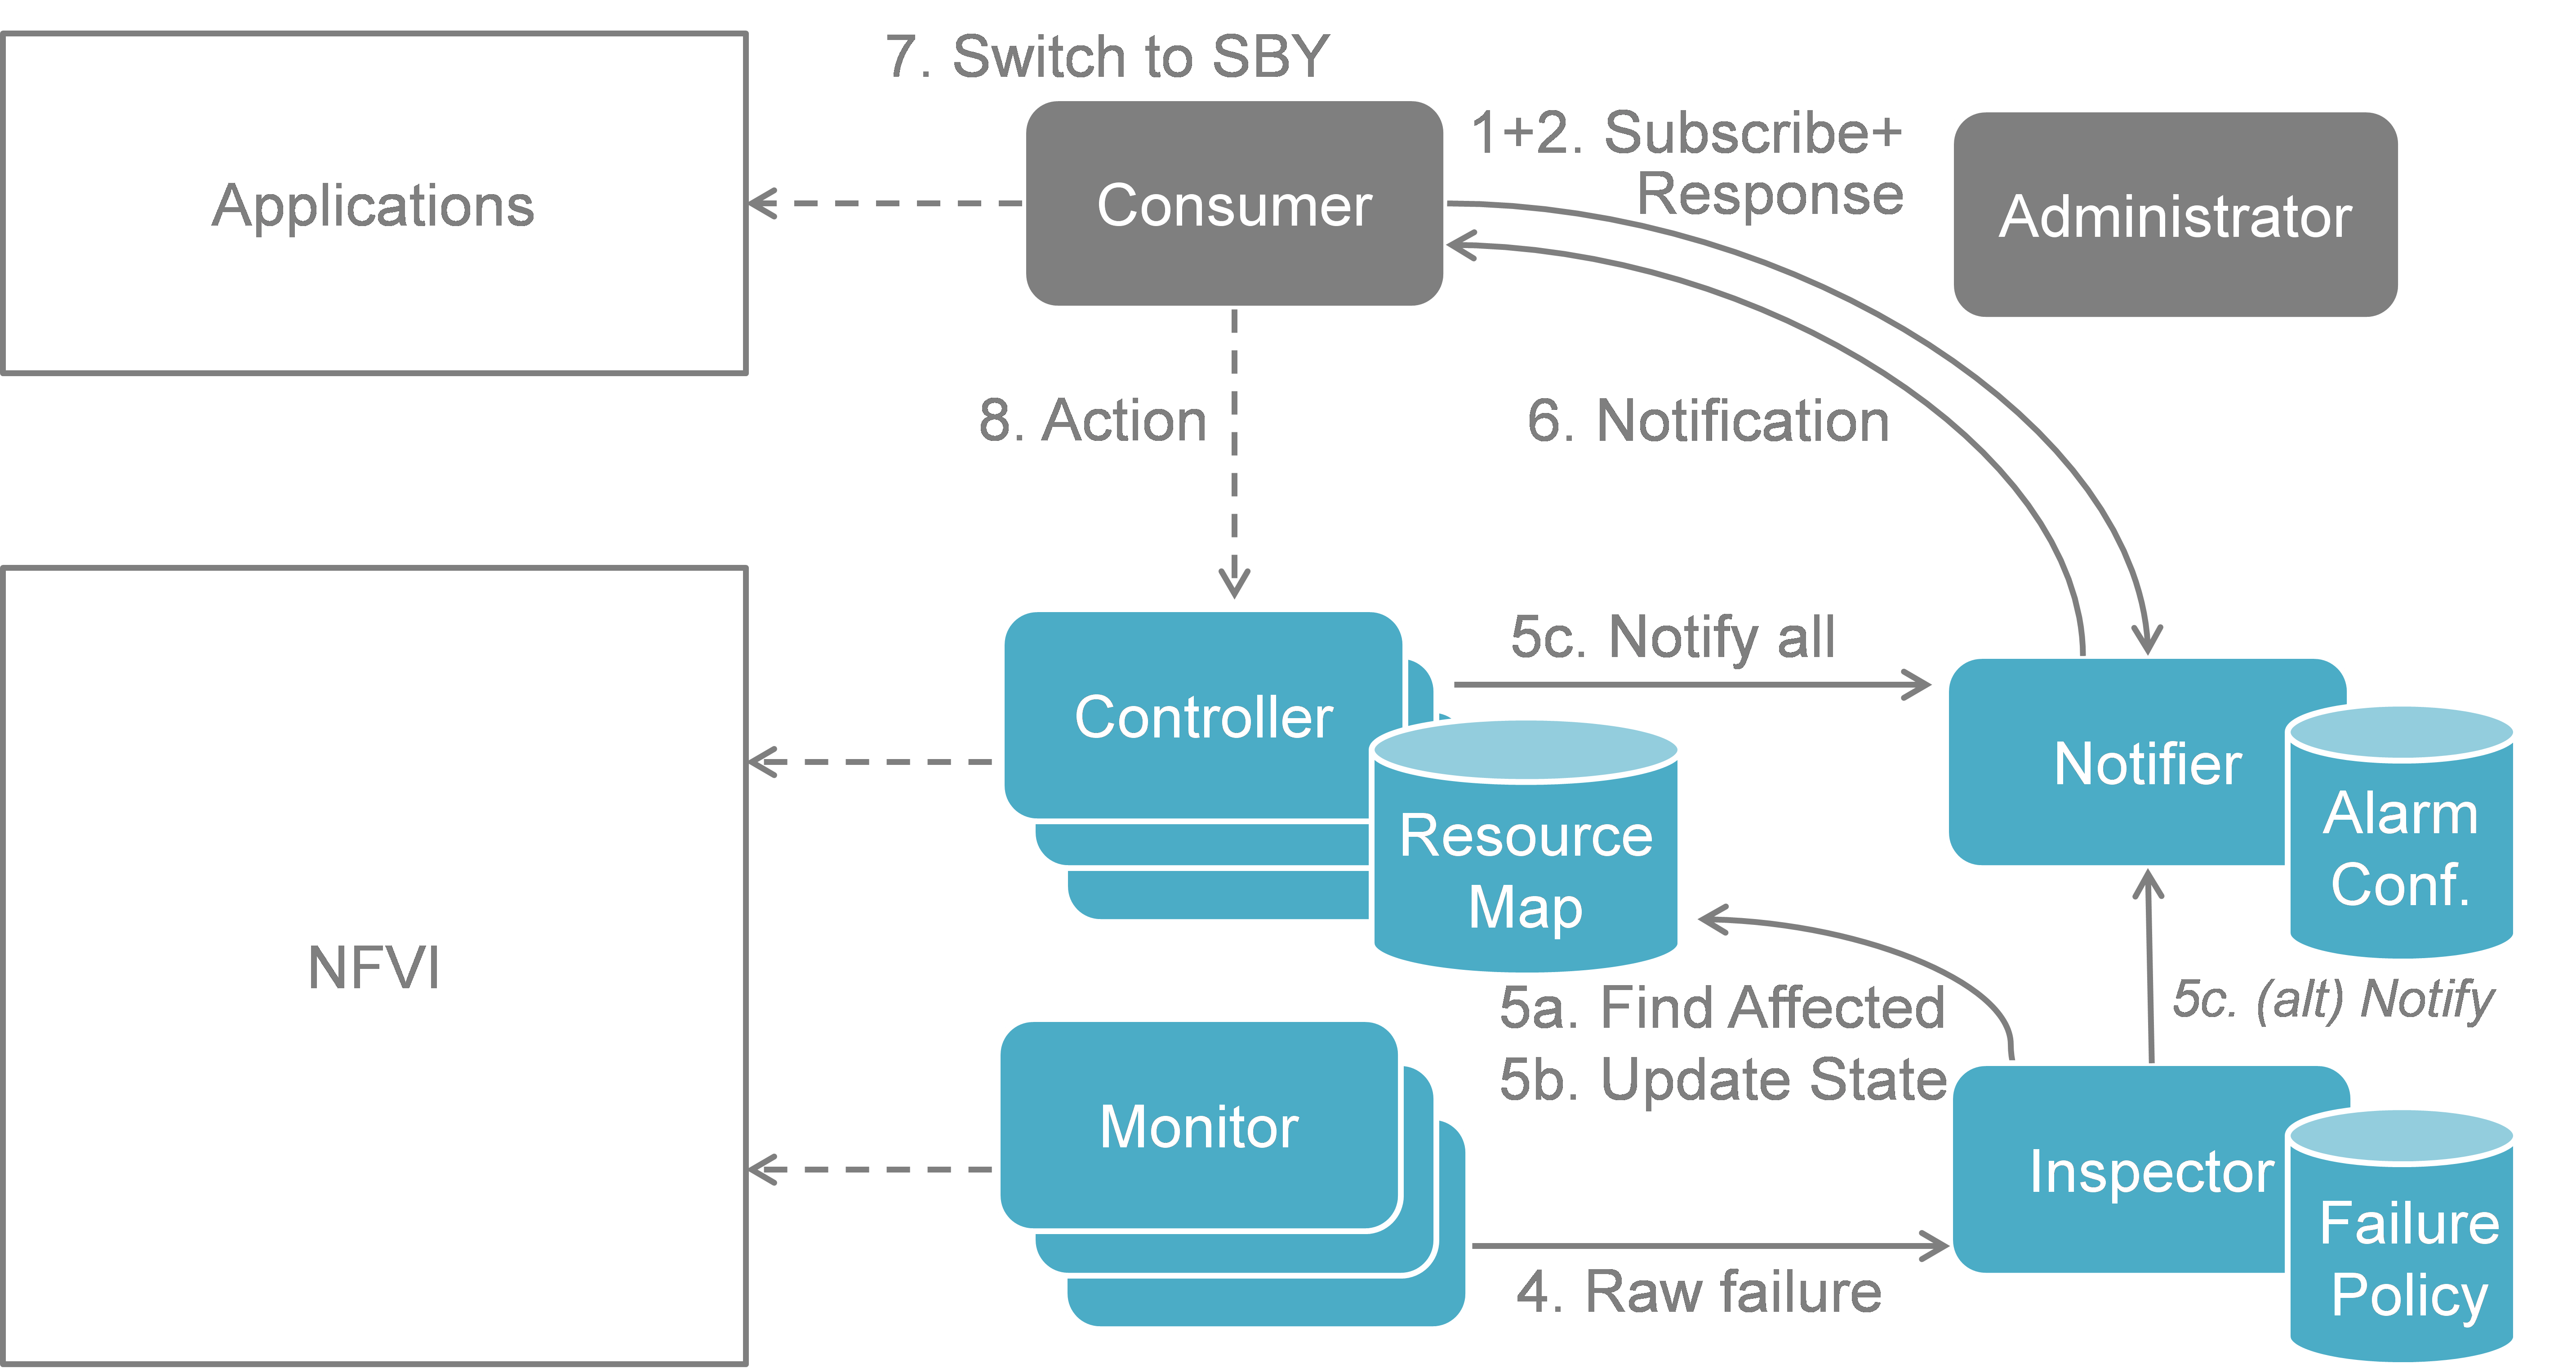
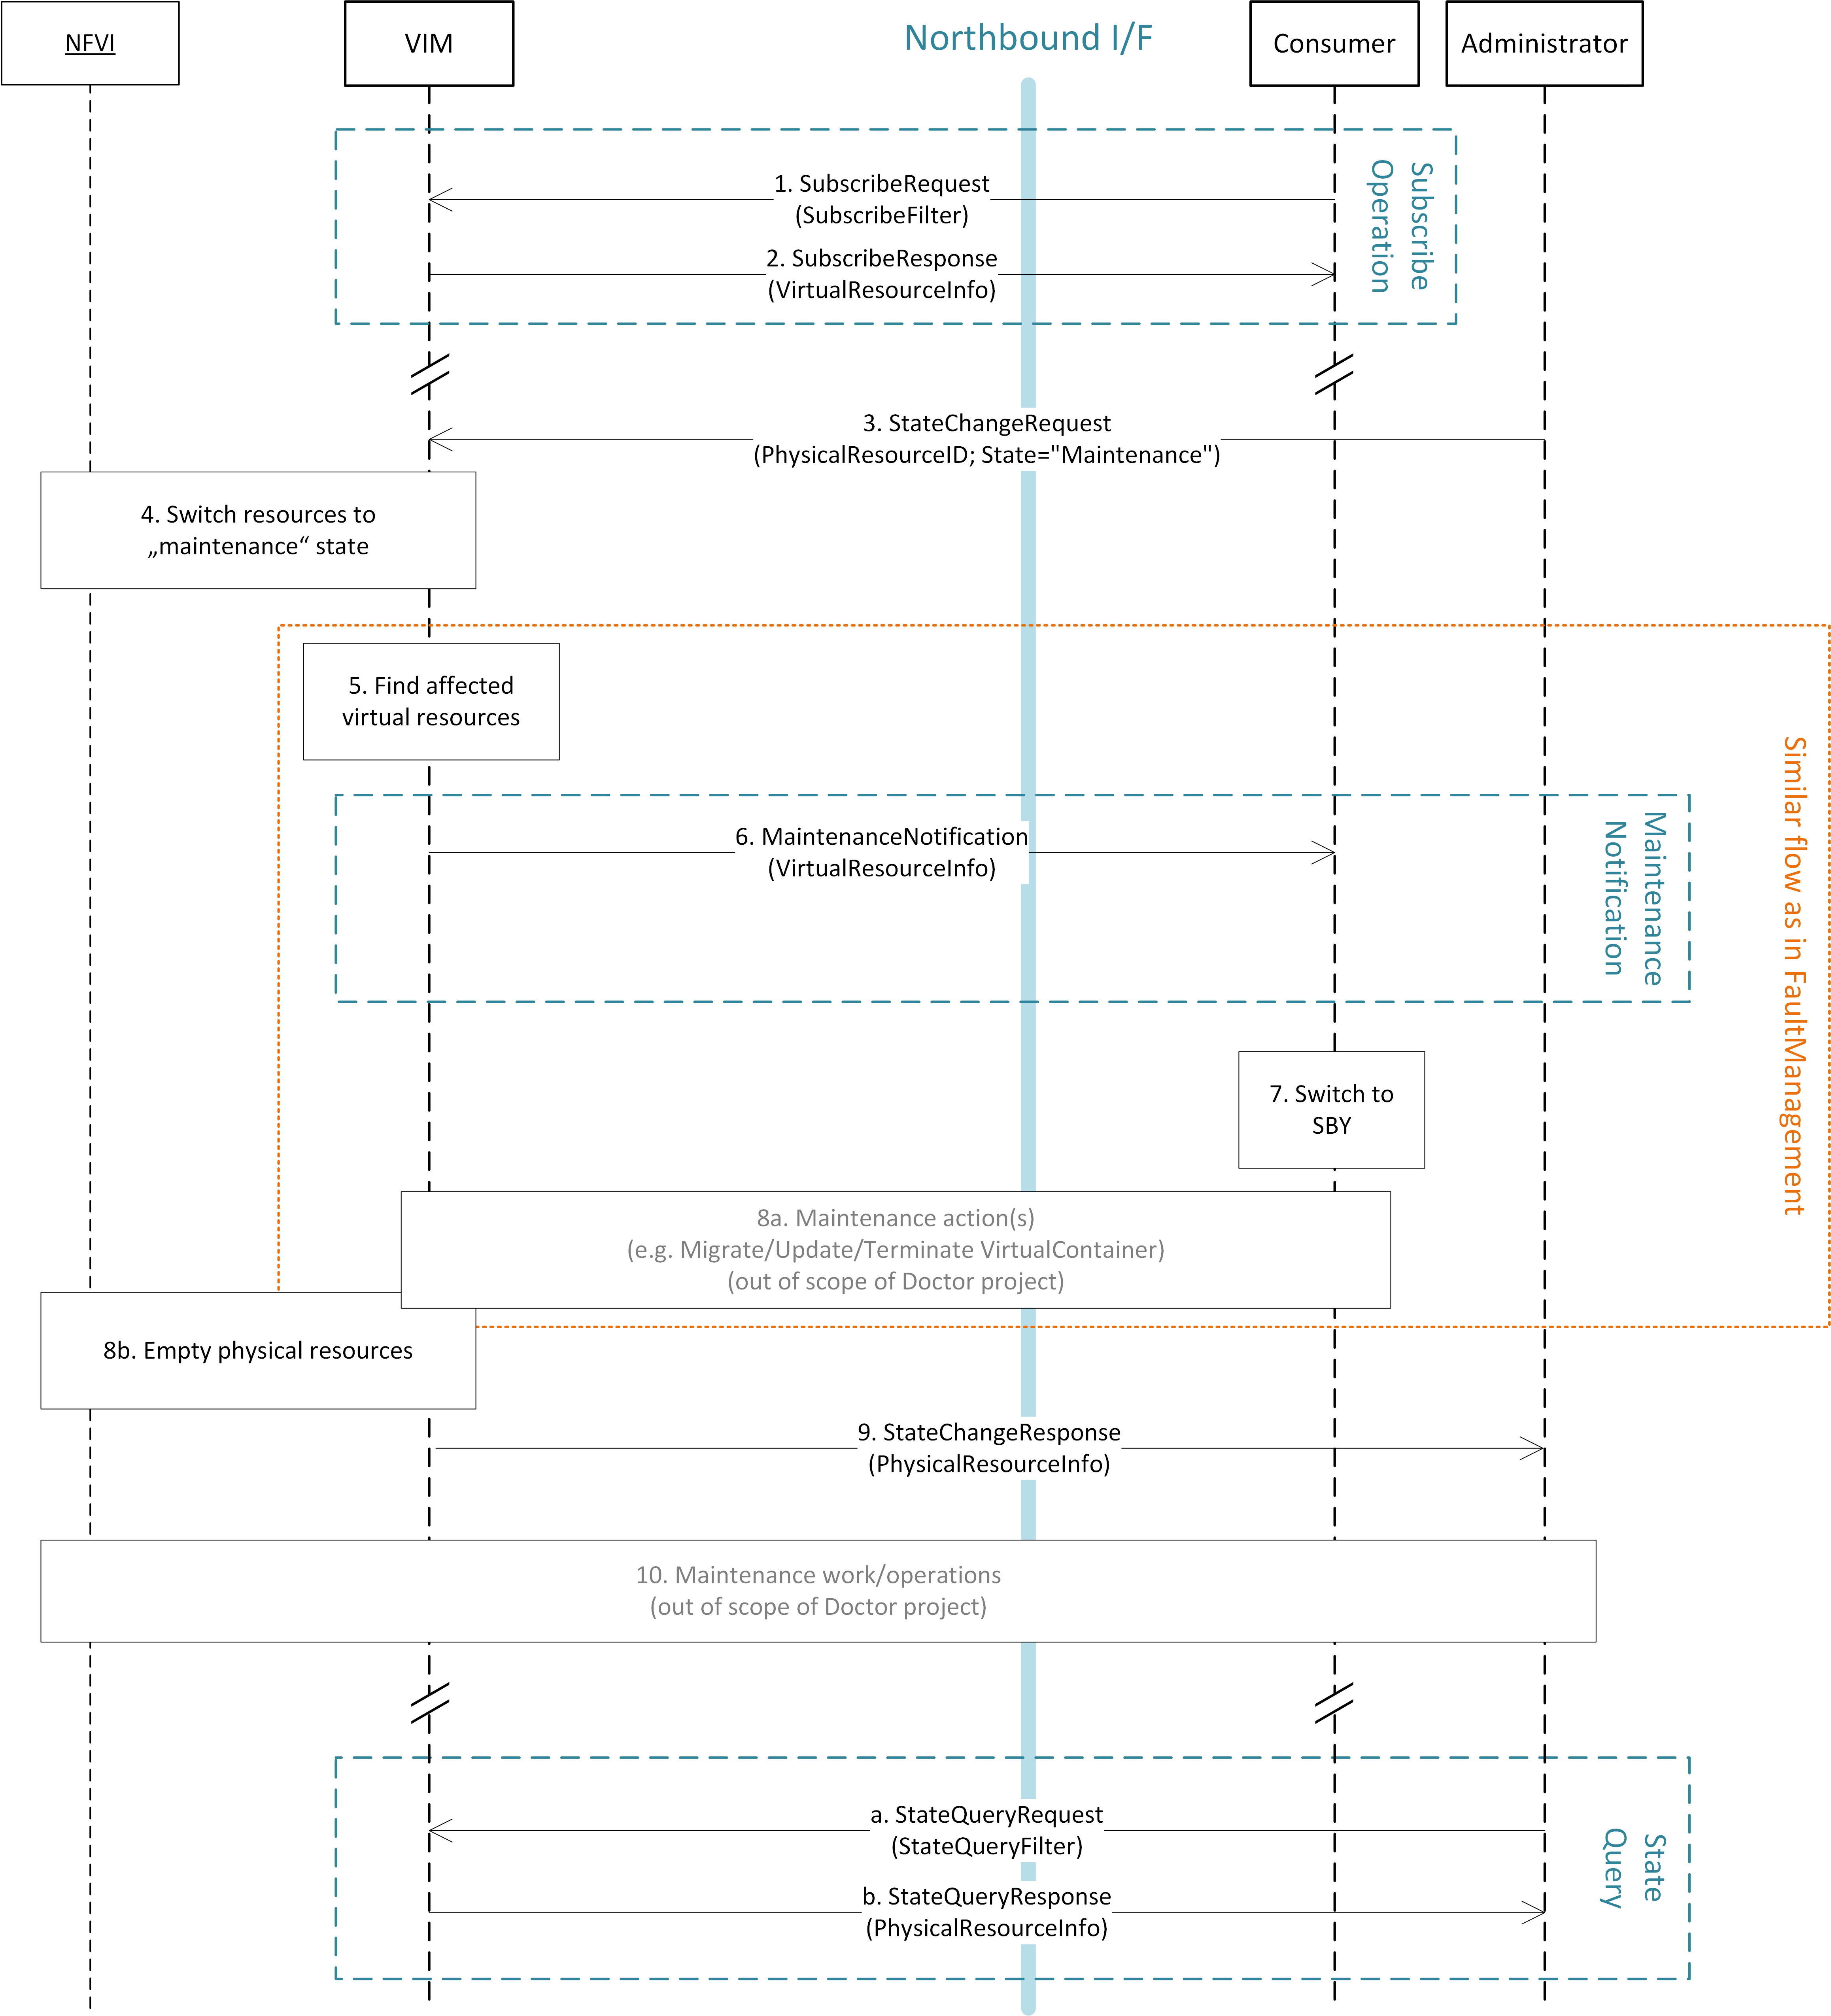
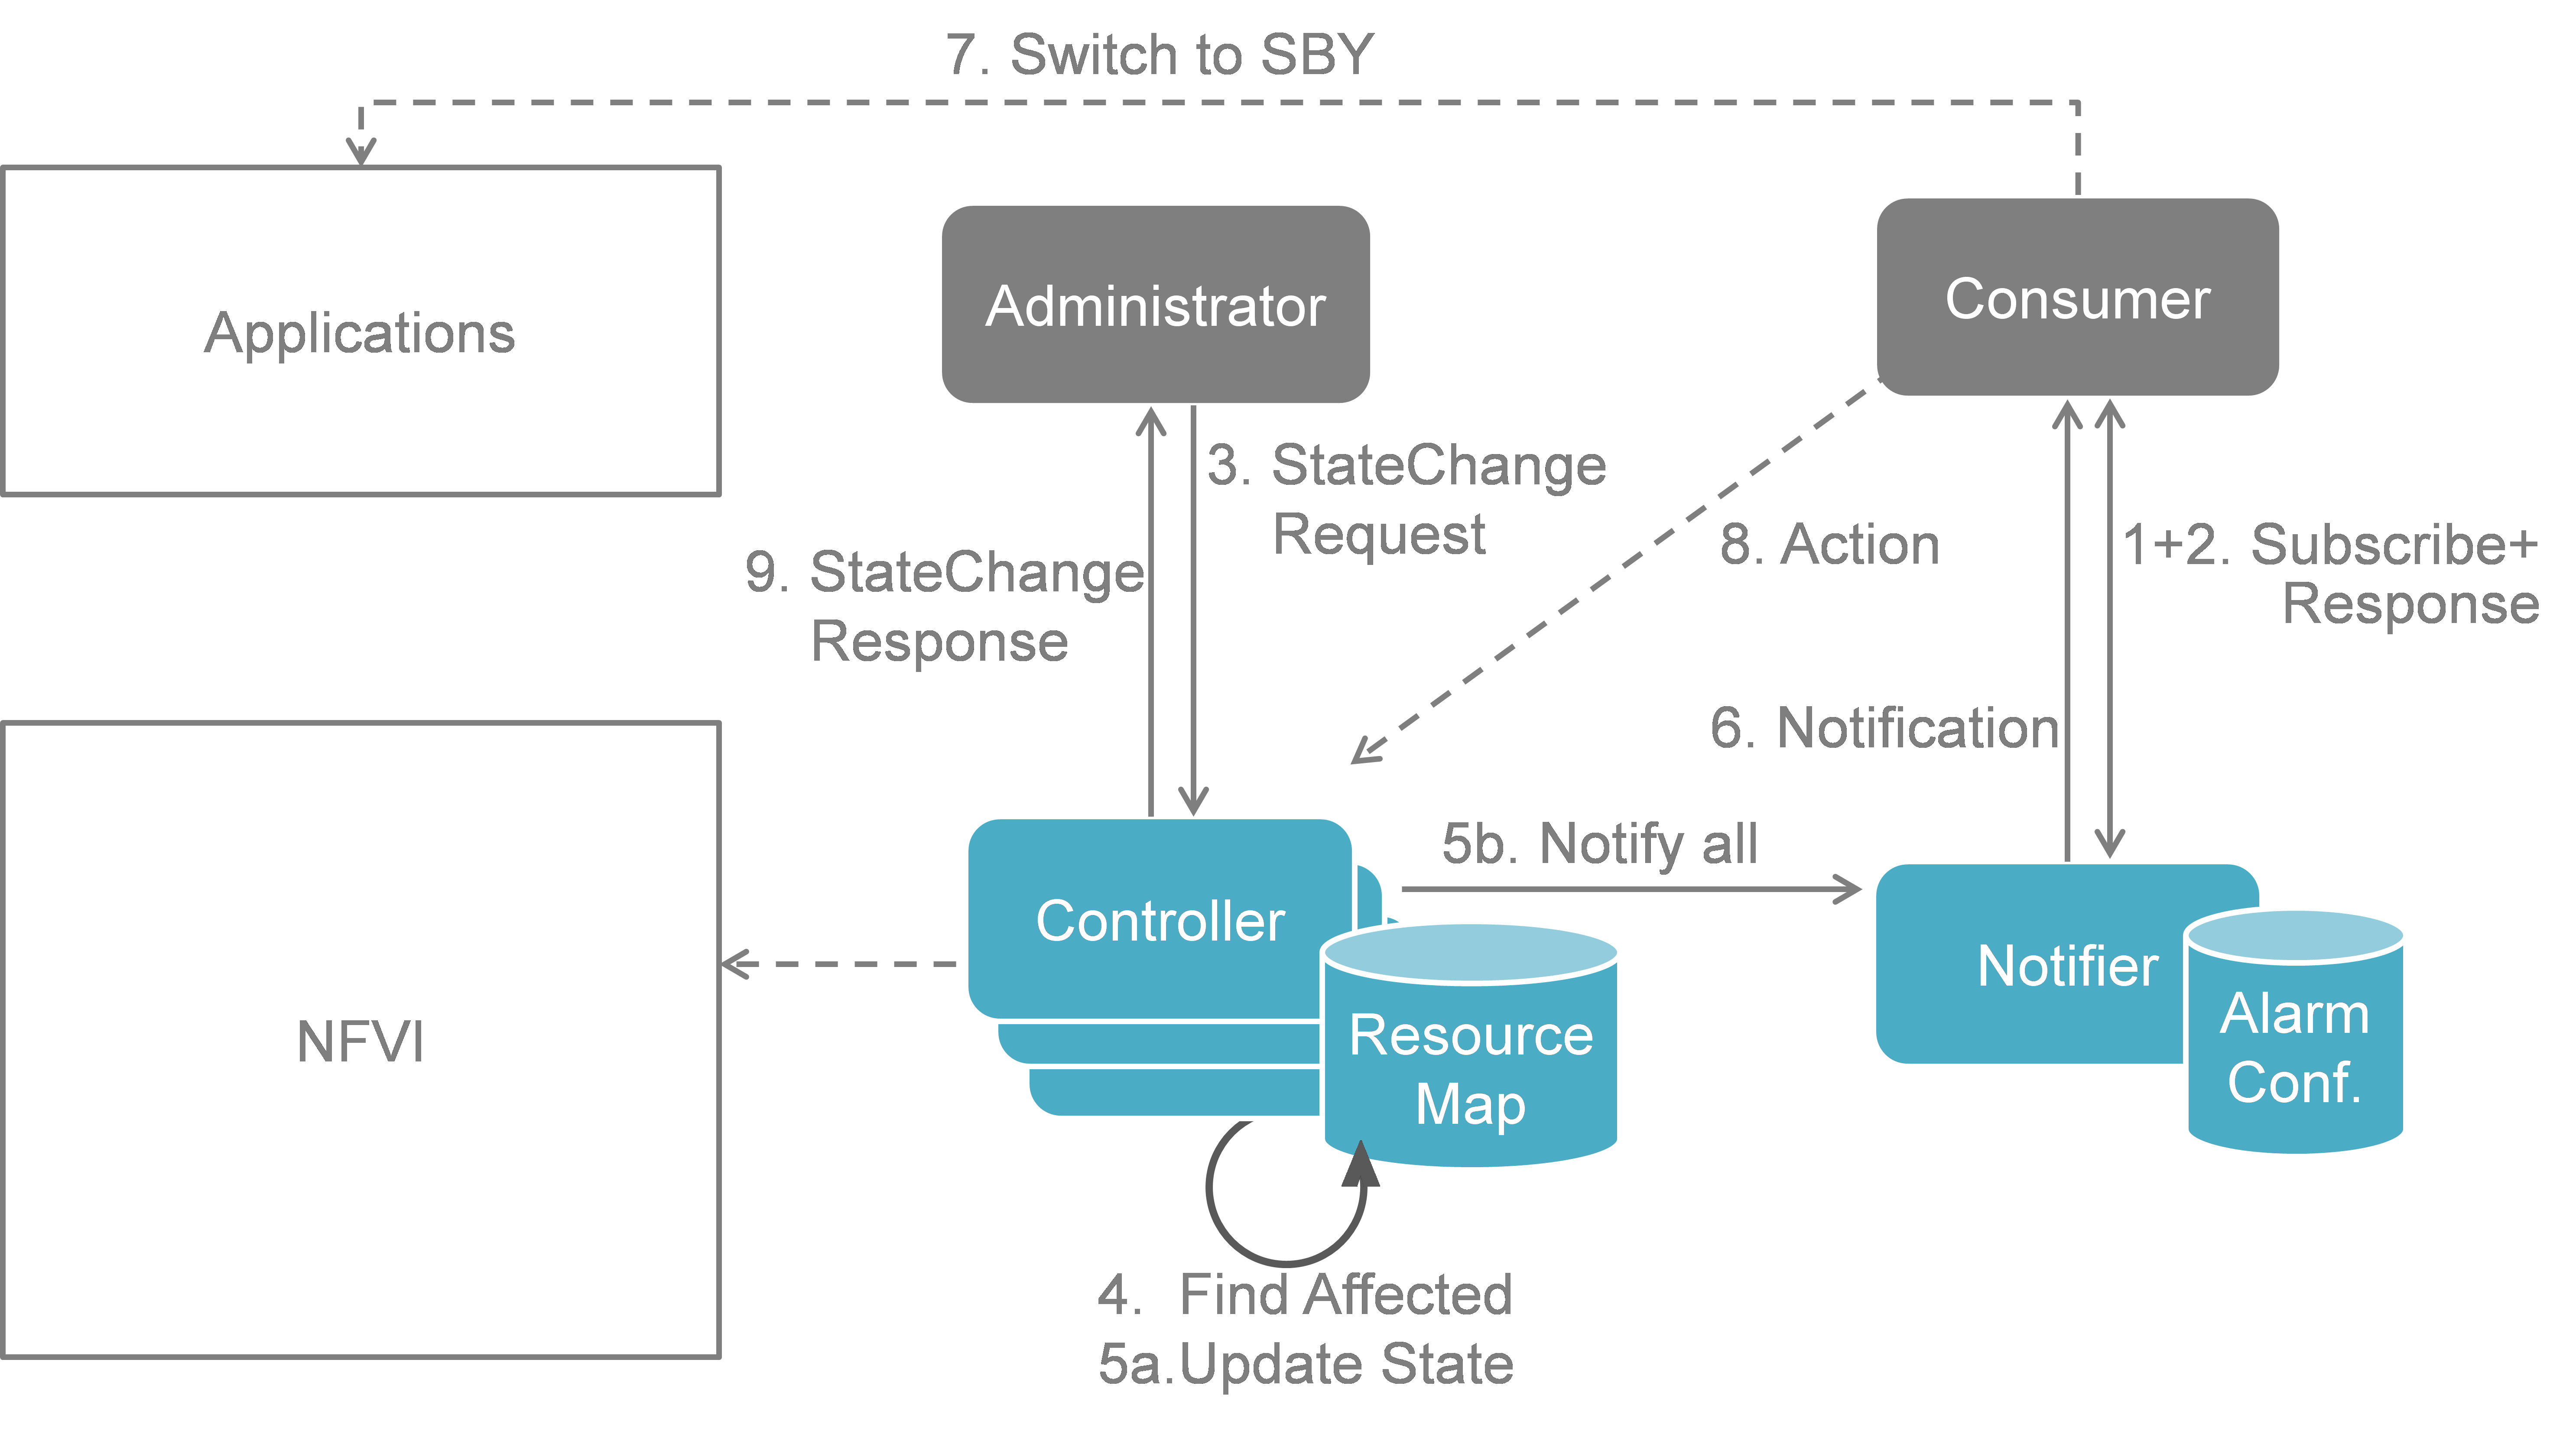
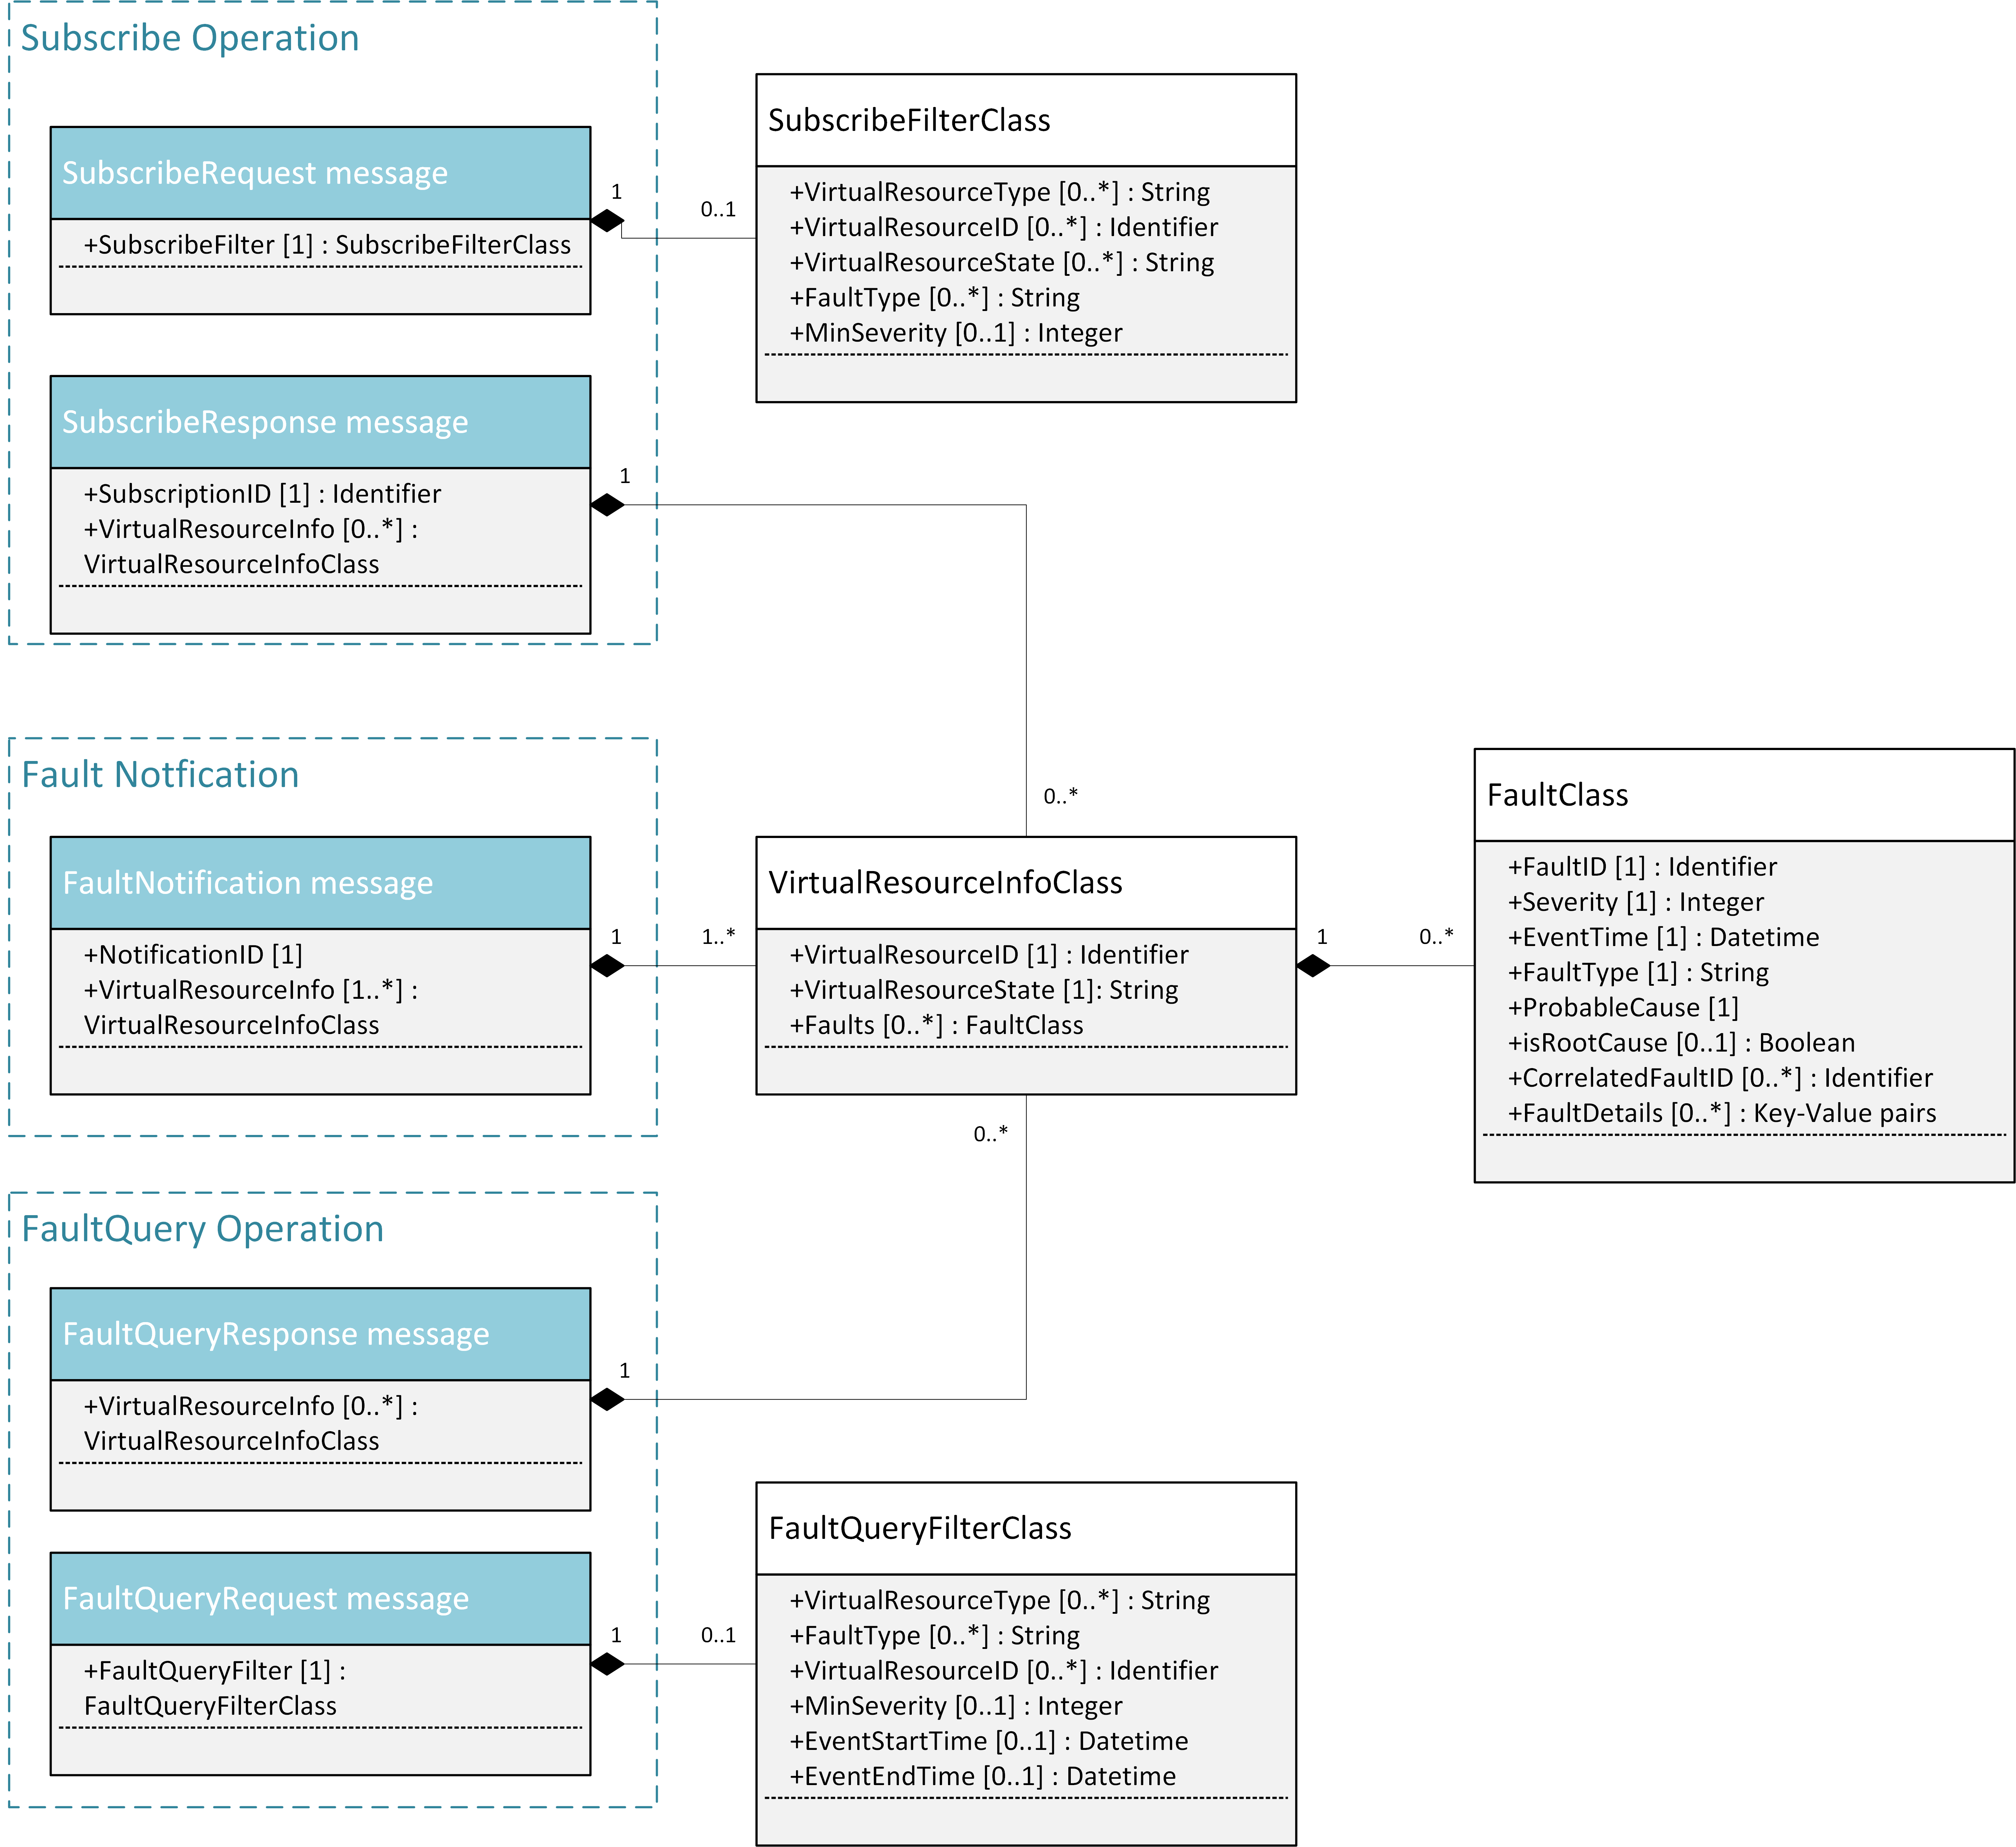
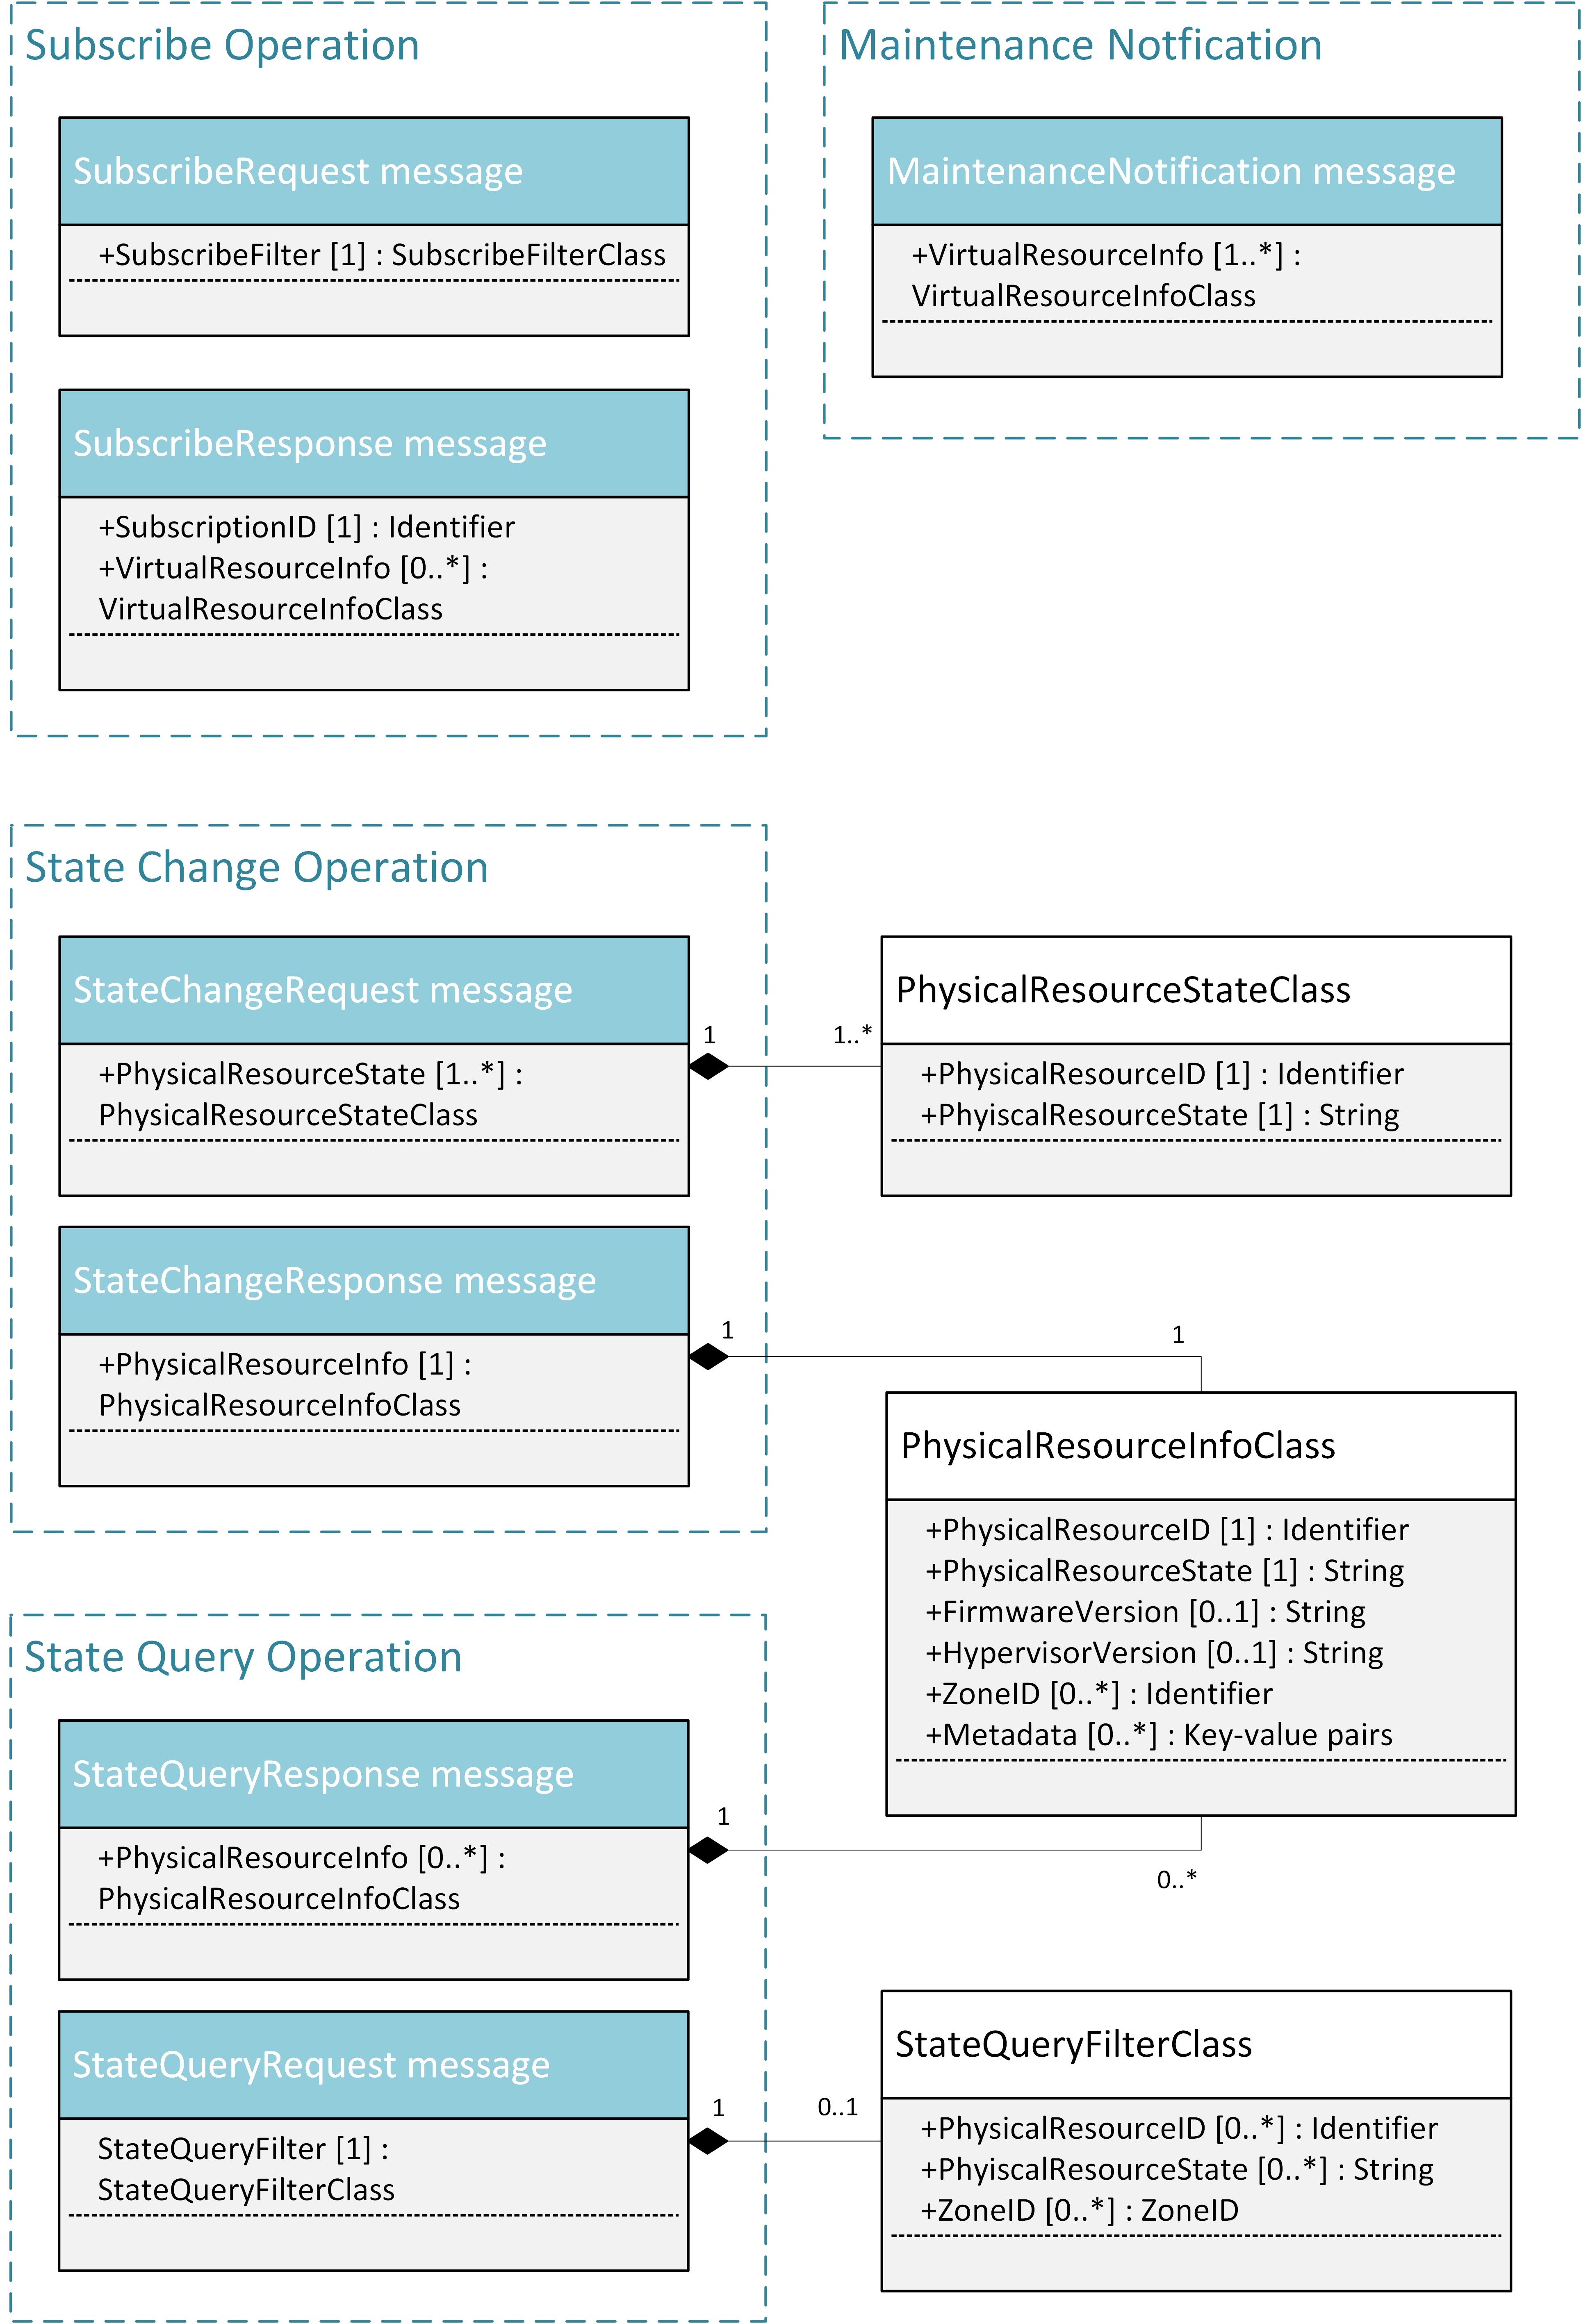
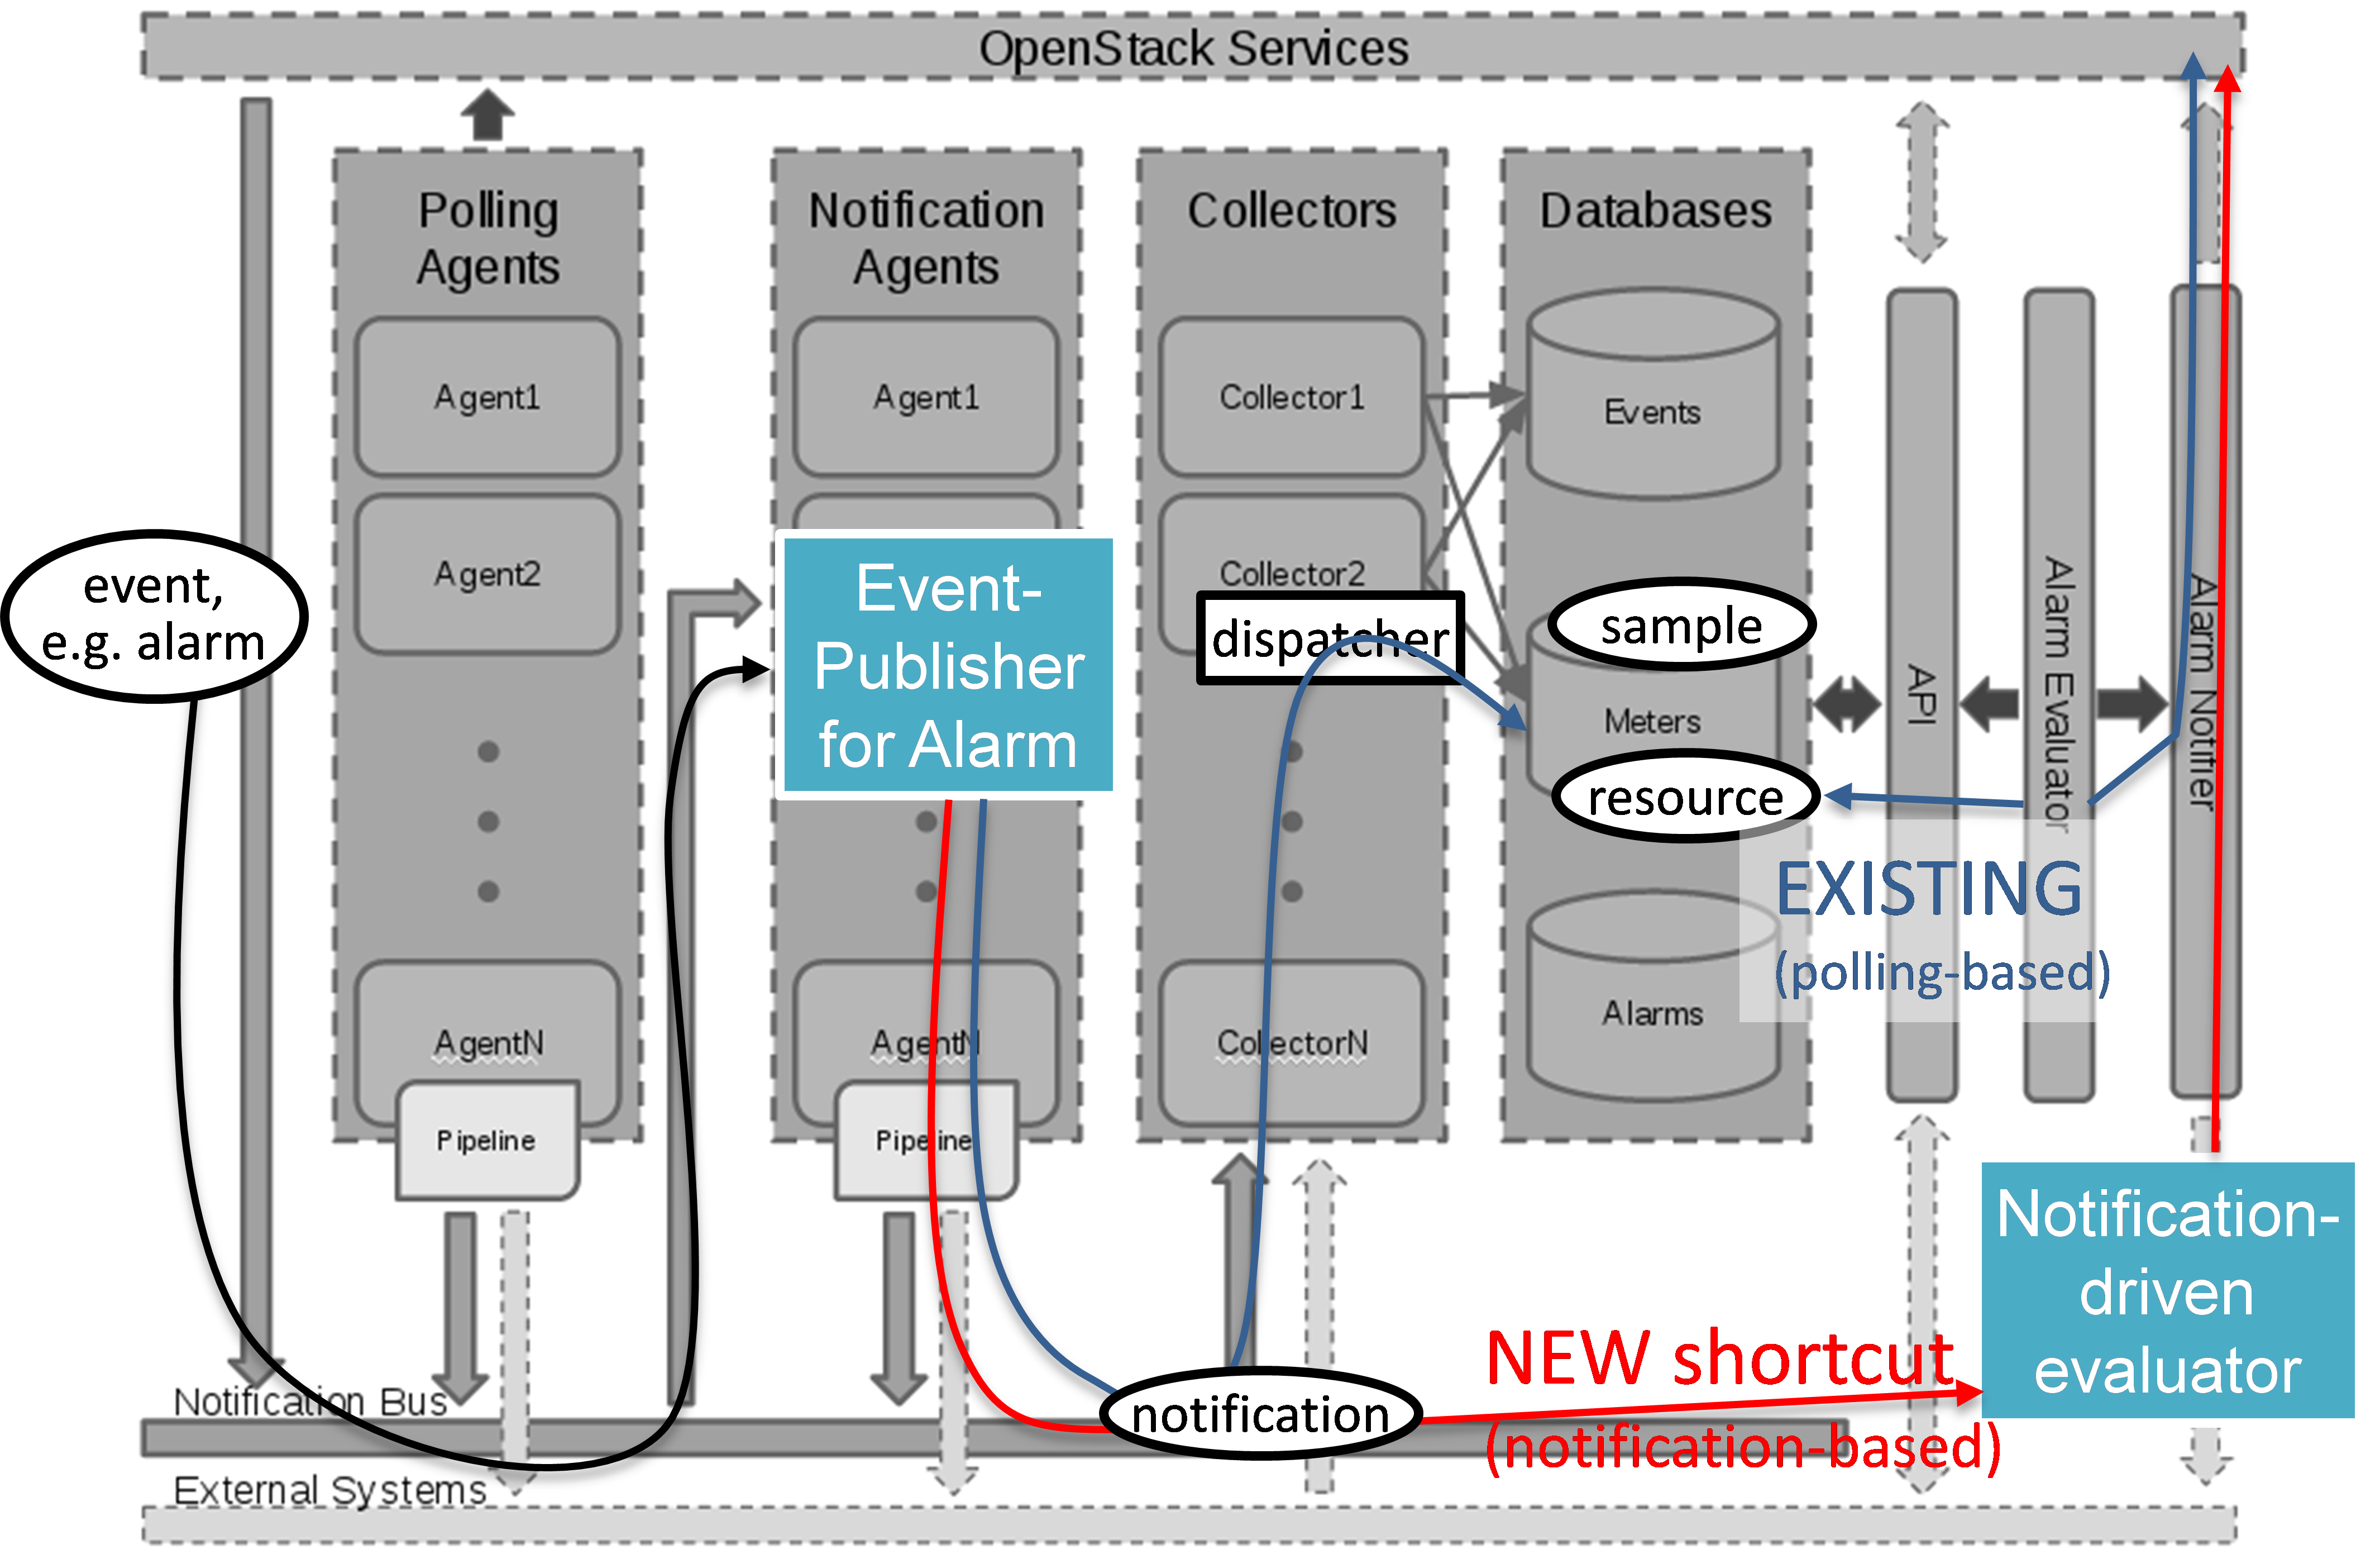
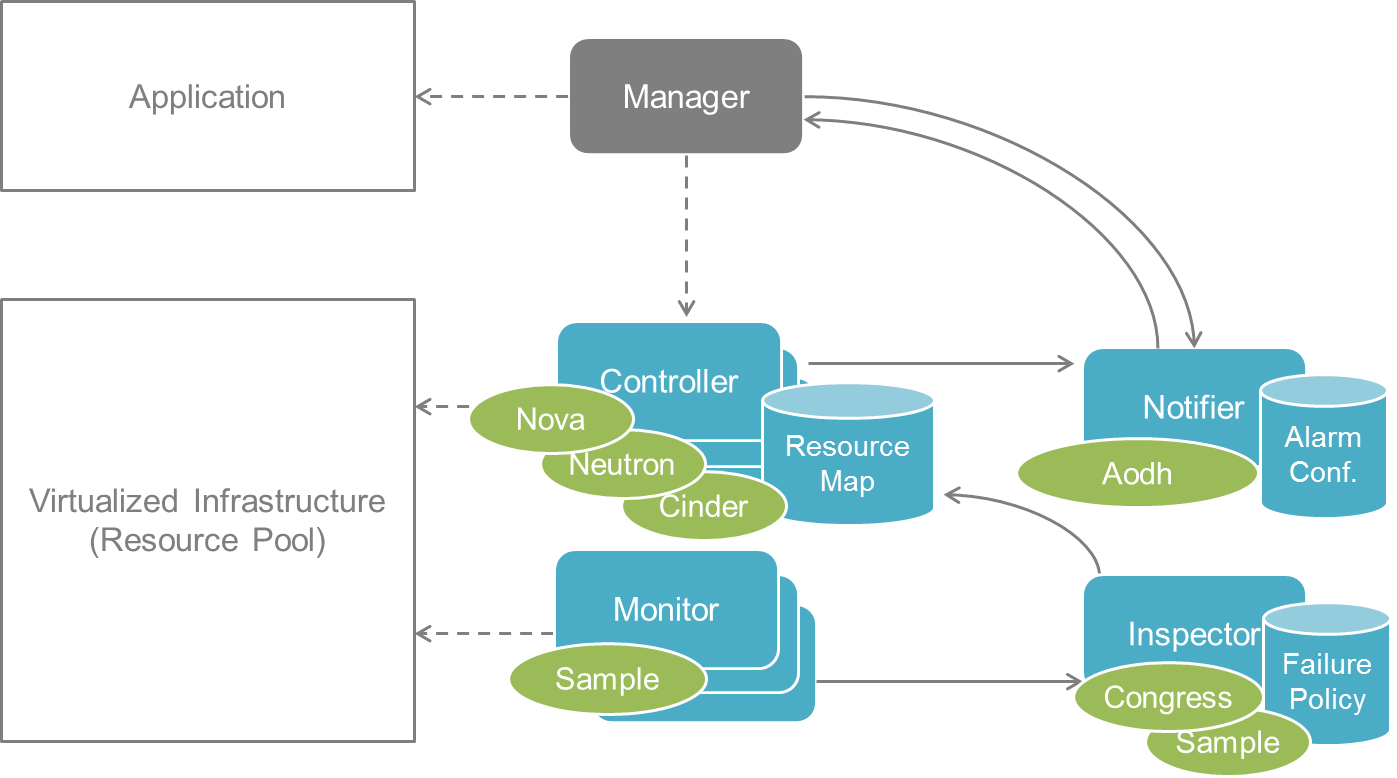
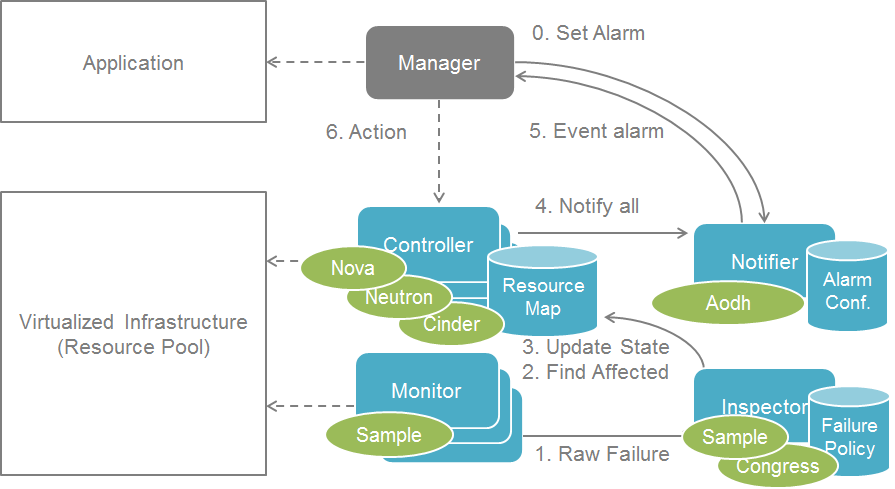
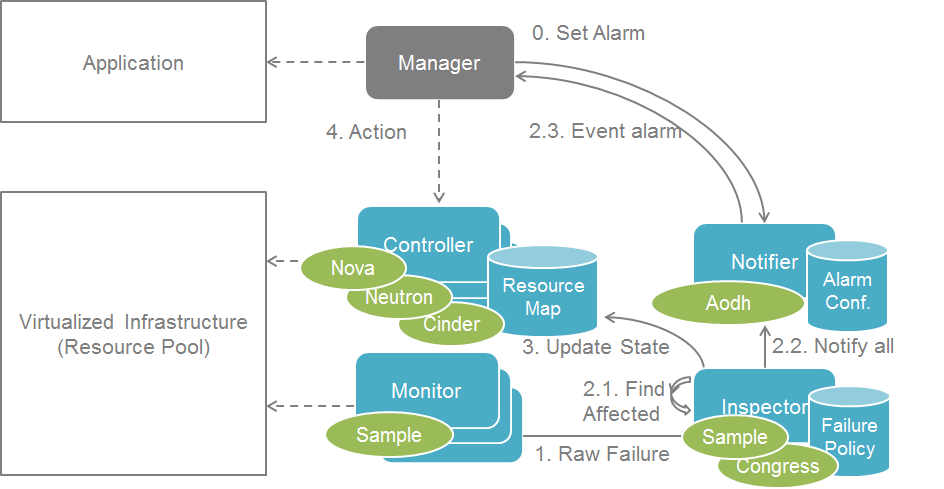
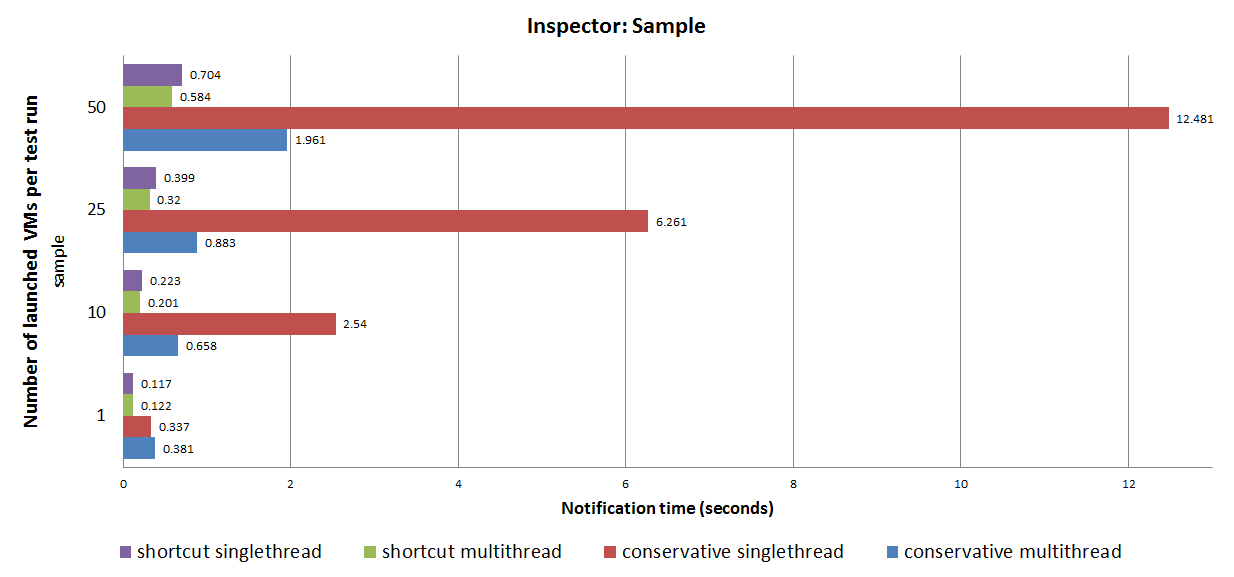
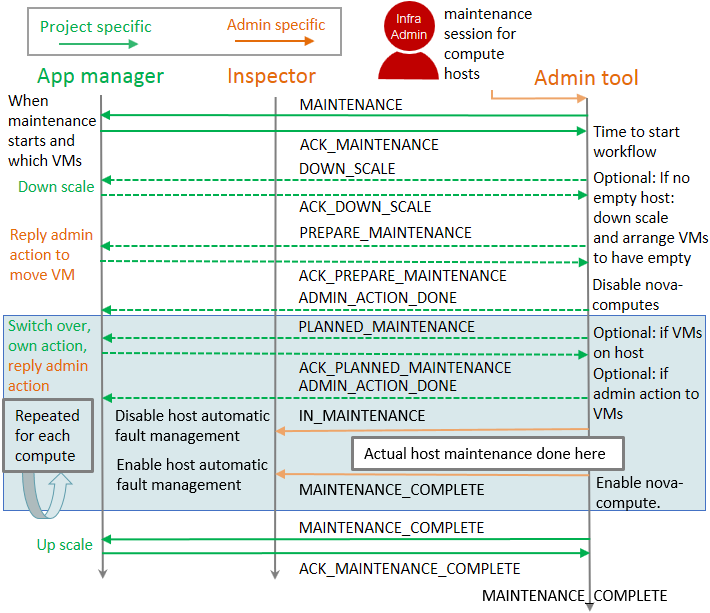
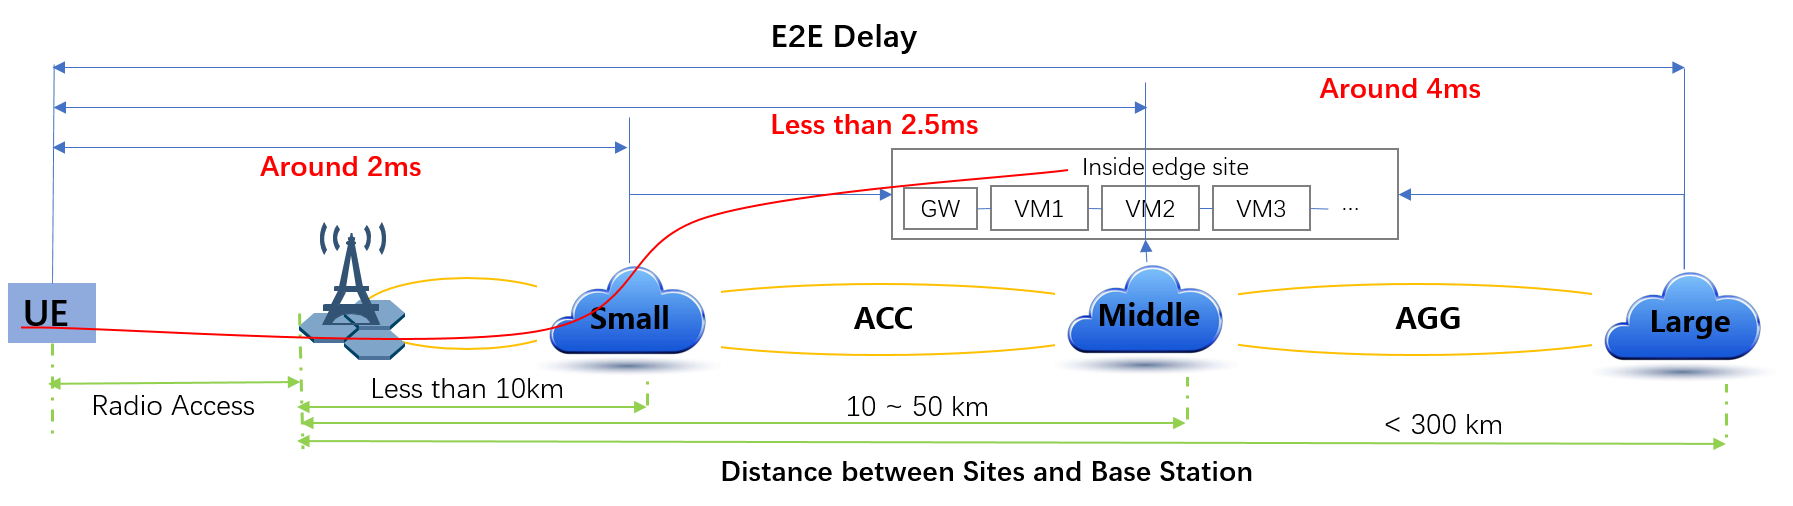
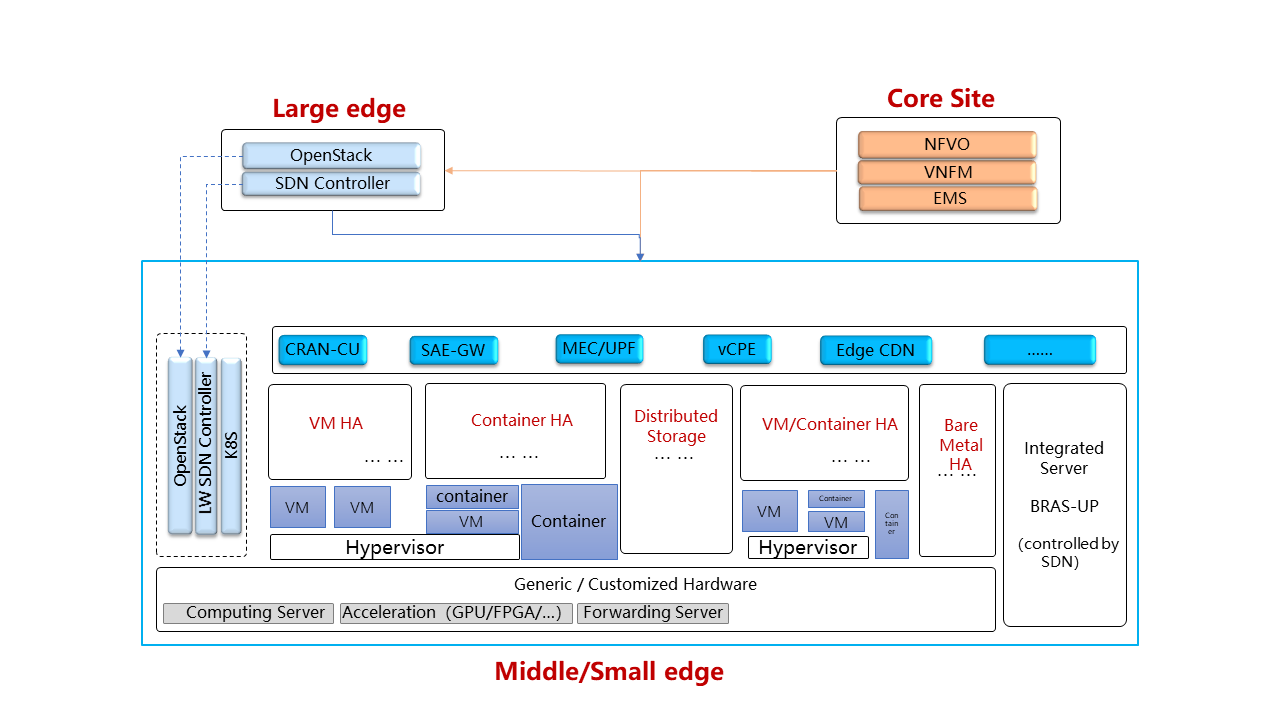
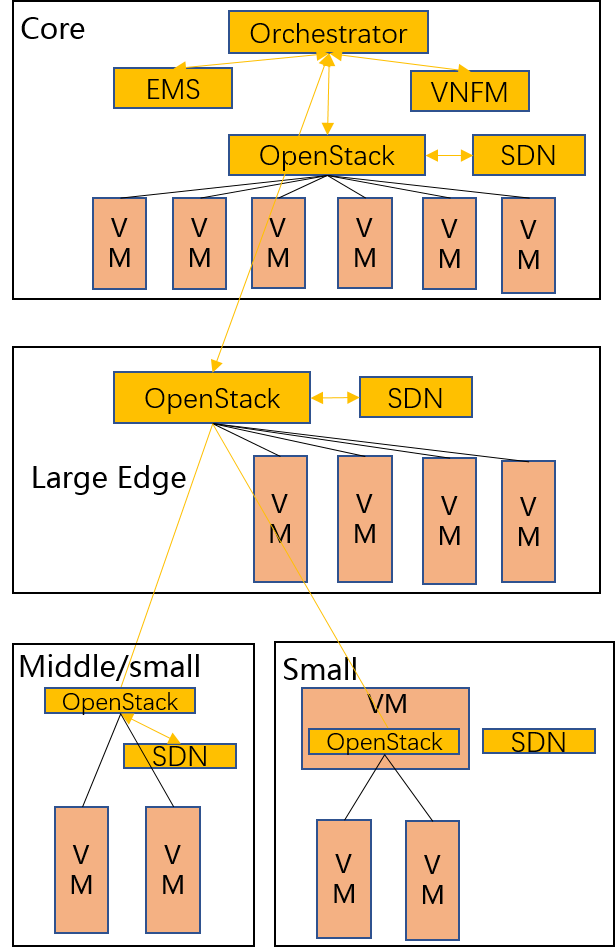
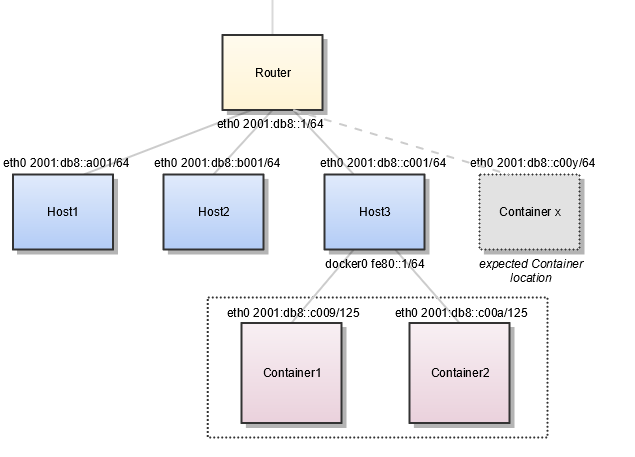
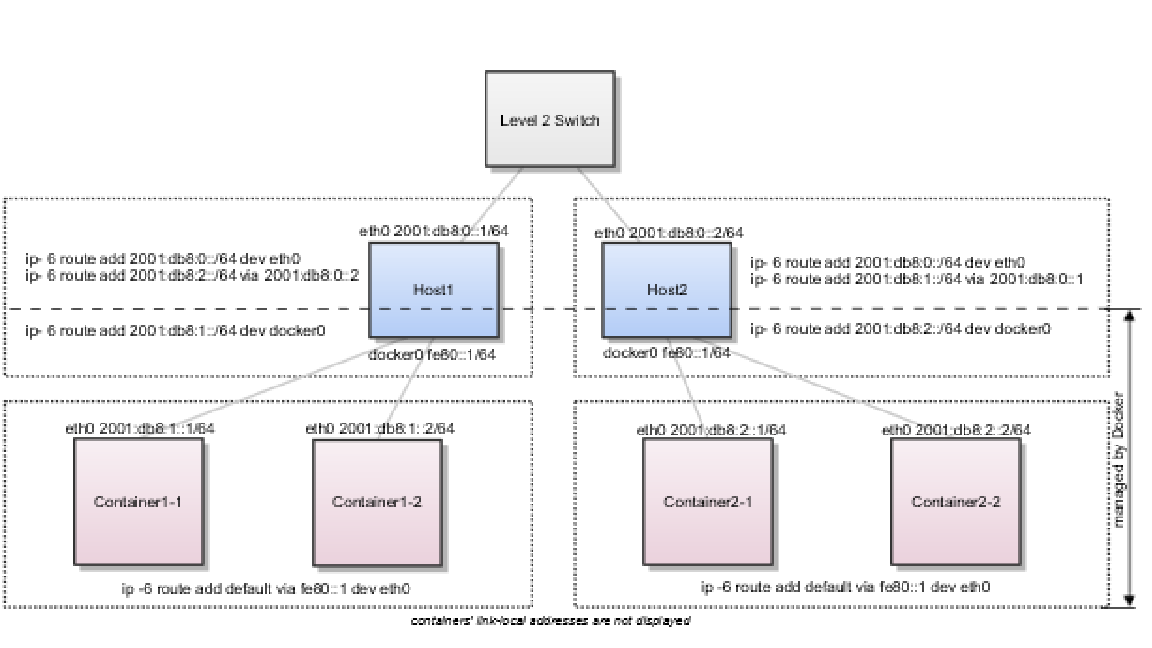
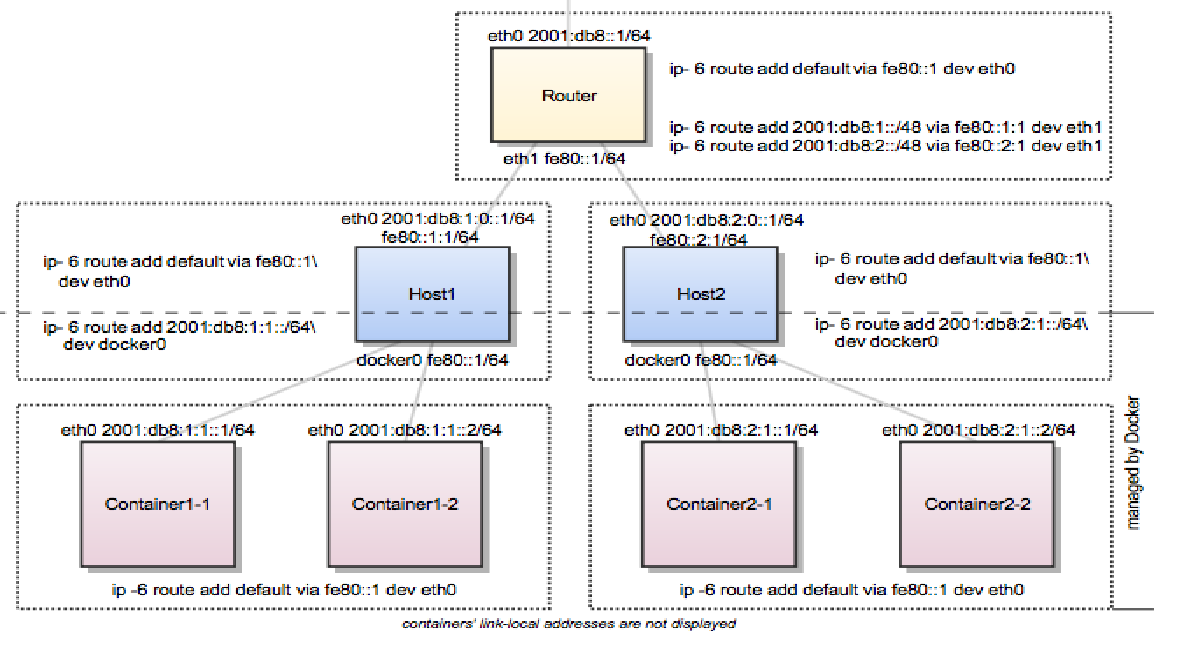


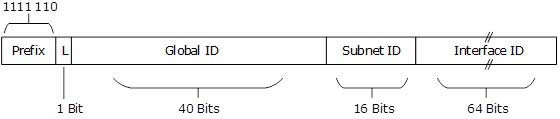
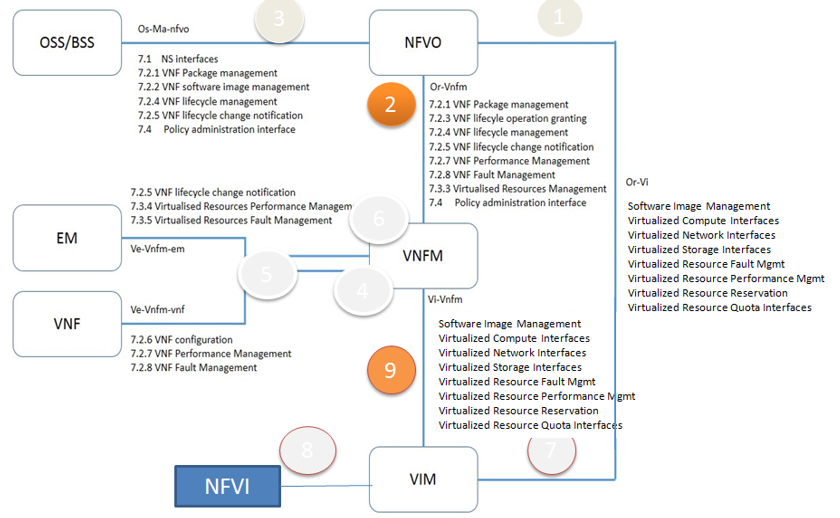
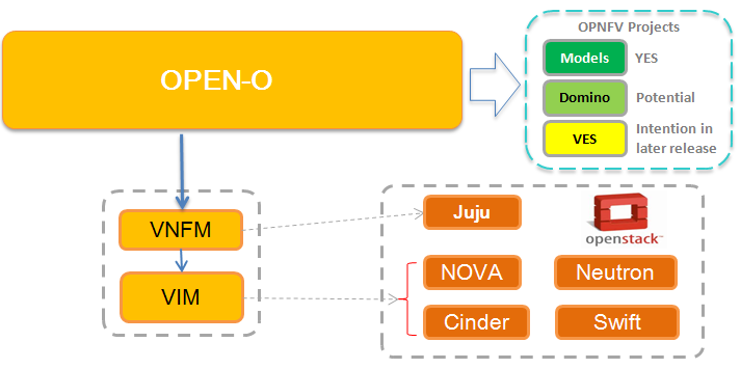

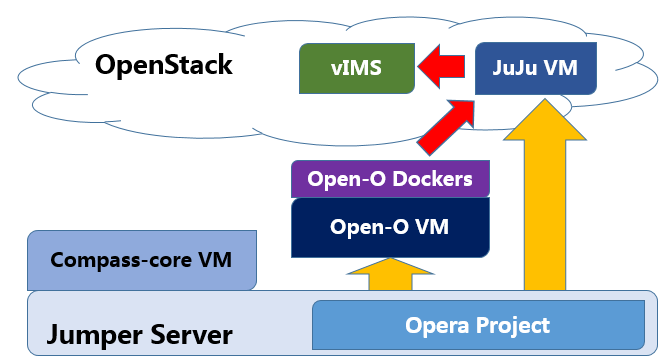
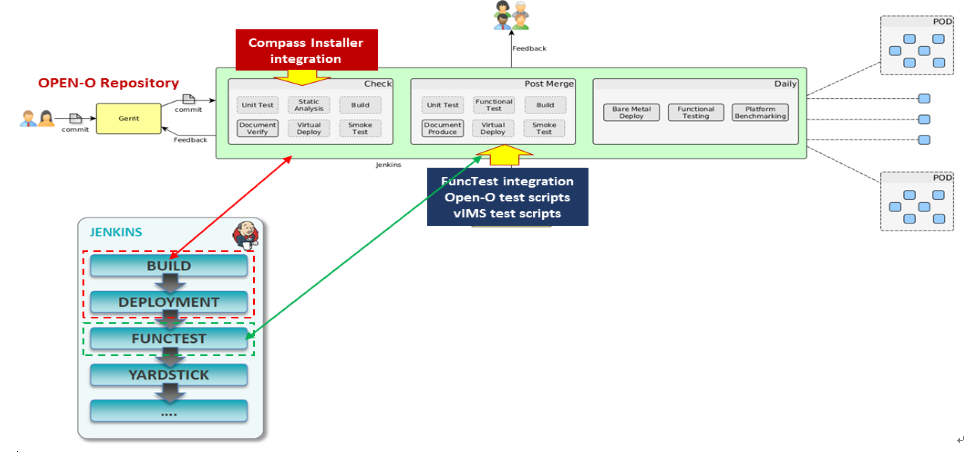
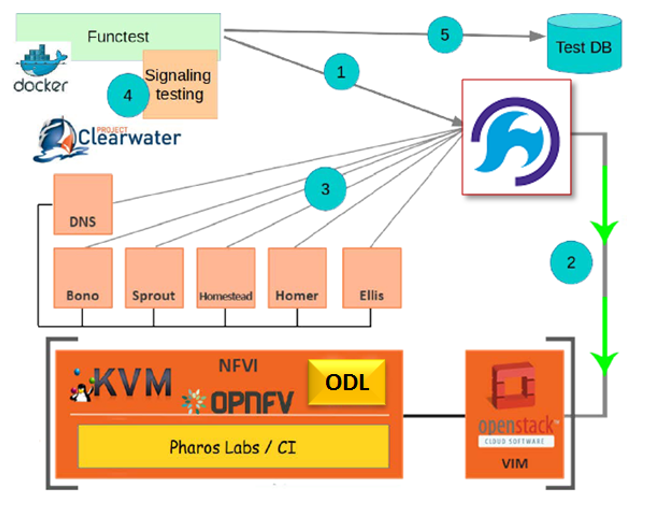
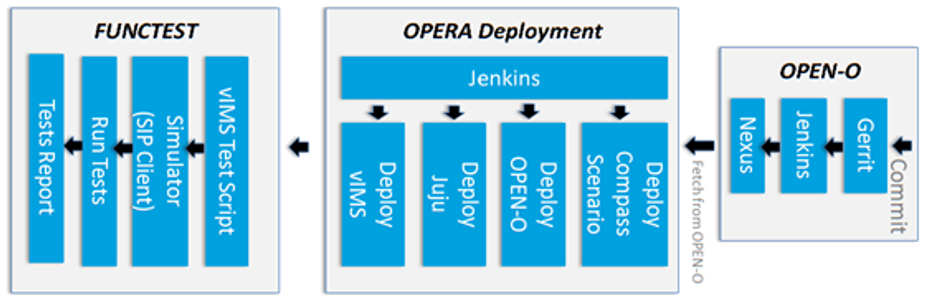
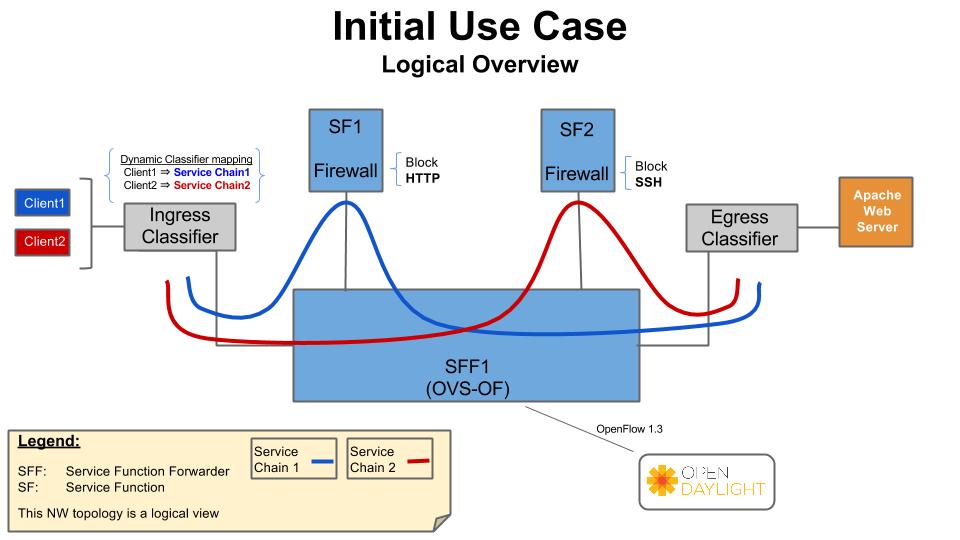
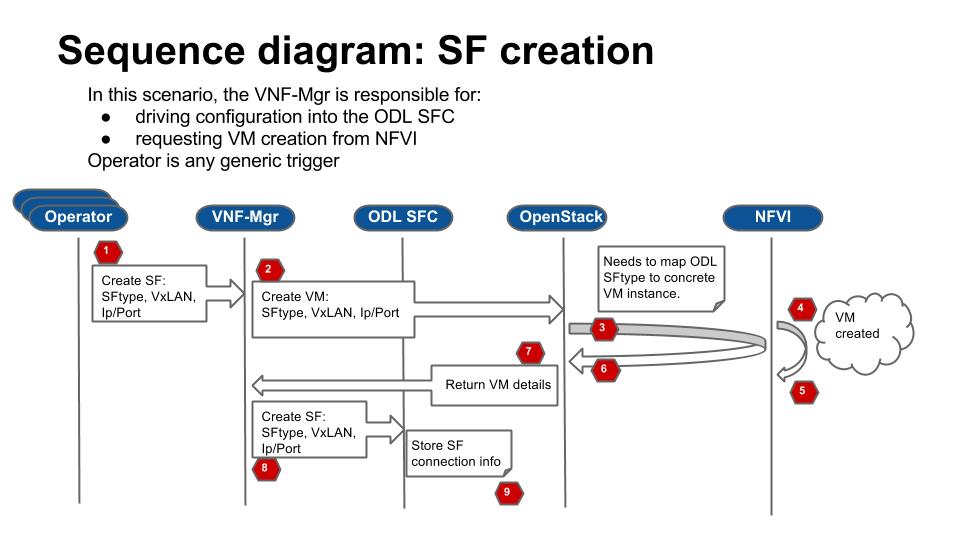
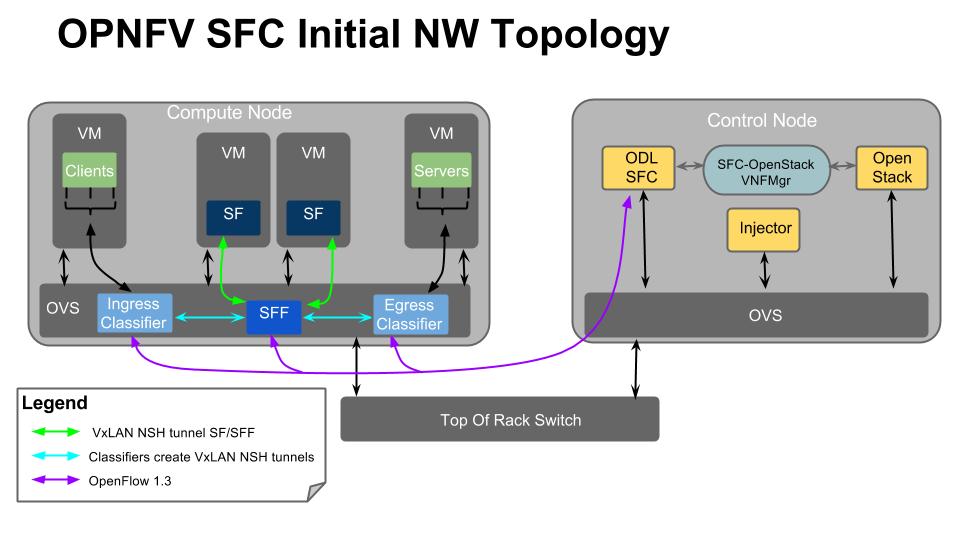
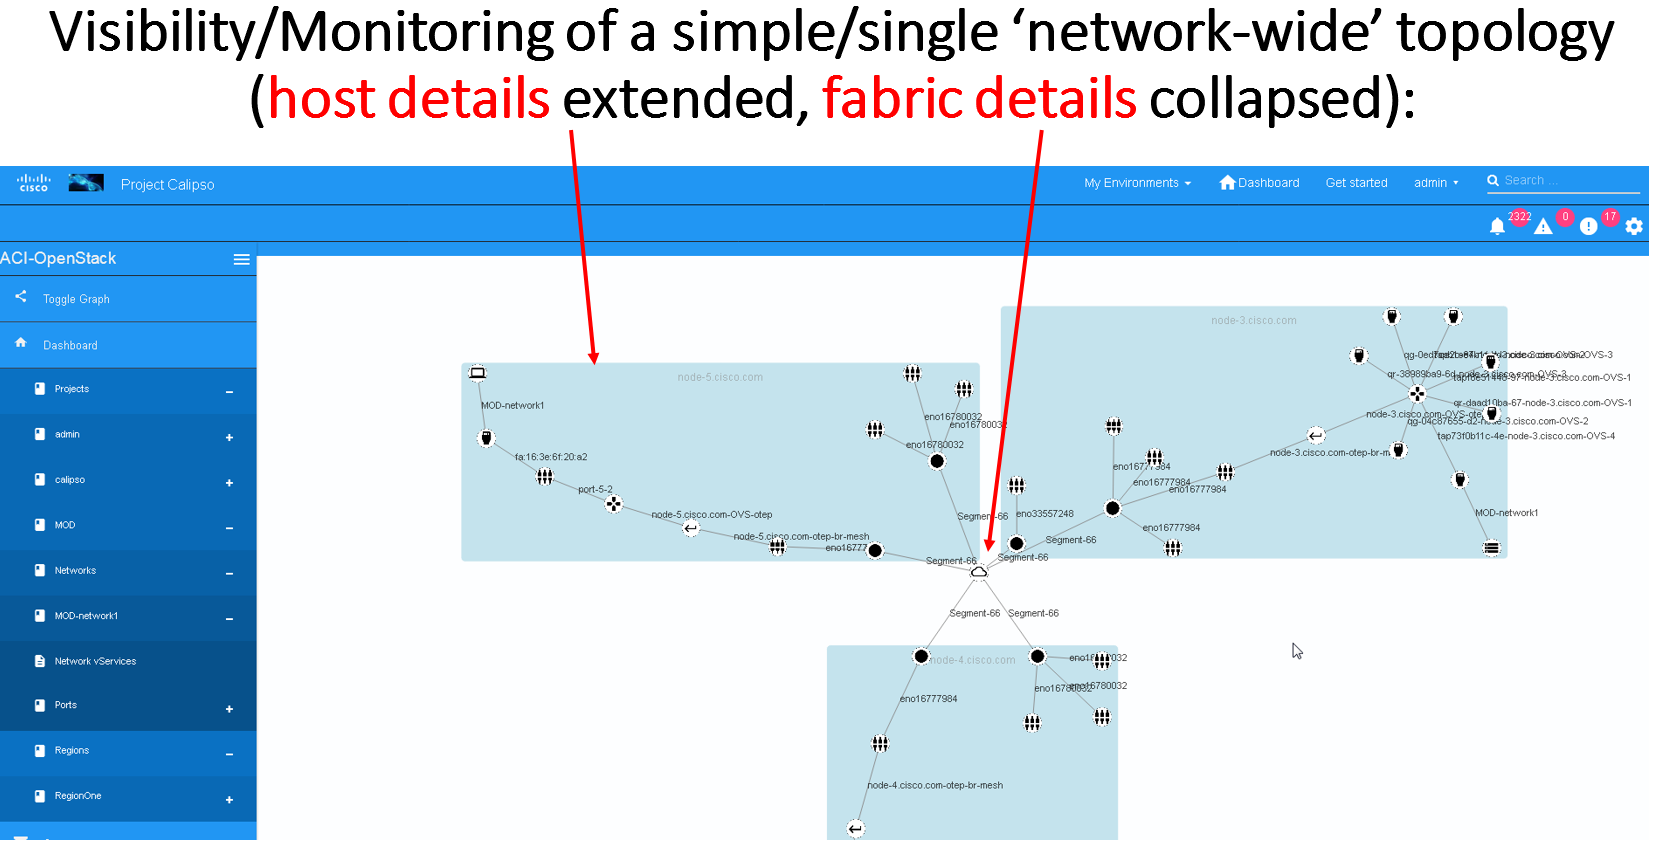