Open Platform for NFV (OPNFV) facilitates the development and evolution of NFV components across various open source ecosystems. Through system level integration, deployment and testing, OPNFV creates a reference NFV platform to accelerate the transformation of enterprise and service provider networks. Participation is open to anyone, whether you are an employee of a member company or just passionate about network transformation.
Network Functions Virtualization (NFV) is transforming the networking industry via software-defined infrastructures and open source is the proven method for quickly developing software for commercial products and services that can move markets. Open Platform for NFV (OPNFV) facilitates the development and evolution of NFV components across various open source ecosystems. Through system level integration, deployment and testing, OPNFV constructs a reference NFV platform to accelerate the transformation of enterprise and service provider networks. As an open source project, OPNFV is uniquely positioned to bring together the work of standards bodies, open source communities, service providers and commercial suppliers to deliver a de facto NFV platform for the industry.
By integrating components from upstream projects, the community is able to conduct performance and use case-based testing on a variety of solutions to ensure the platform’s suitability for NFV use cases. OPNFV also works upstream with other open source communities to bring contributions and learnings from its work directly to those communities in the form of blueprints, patches, bugs, and new code.
OPNFV focuses on building NFV Infrastructure (NFVI) and Virtualised Infrastructure Management (VIM) by integrating components from upstream projects such as OpenDaylight, ONOS, Tungsen Fabric, OVN, OpenStack, Kubernetes, Ceph Storage, KVM, Open vSwitch, and Linux. More recently, OPNFV has extended its portfolio of forwarding solutions to include DPDK, fd.io and ODP, is able to run on both Intel and ARM commercial and white-box hardware, support VM, Container and BareMetal workloads, and includes Management and Network Orchestration MANO components primarily for application composition and management in the Fraser release.
These capabilities, along with application programmable interfaces (APIs) to other NFV elements, form the basic infrastructure required for Virtualized Network Functions (VNF) and MANO components.
Concentrating on these components while also considering proposed projects on additional topics (such as the MANO components and applications themselves), OPNFV aims to enhance NFV services by increasing performance and power efficiency improving reliability, availability and serviceability, and delivering comprehensive platform instrumentation.
The OPNFV project addresses a number of aspects in the development of a consistent virtualisation platform including common hardware requirements, software architecture, MANO and applications.
OPNFV Platform Overview Diagram
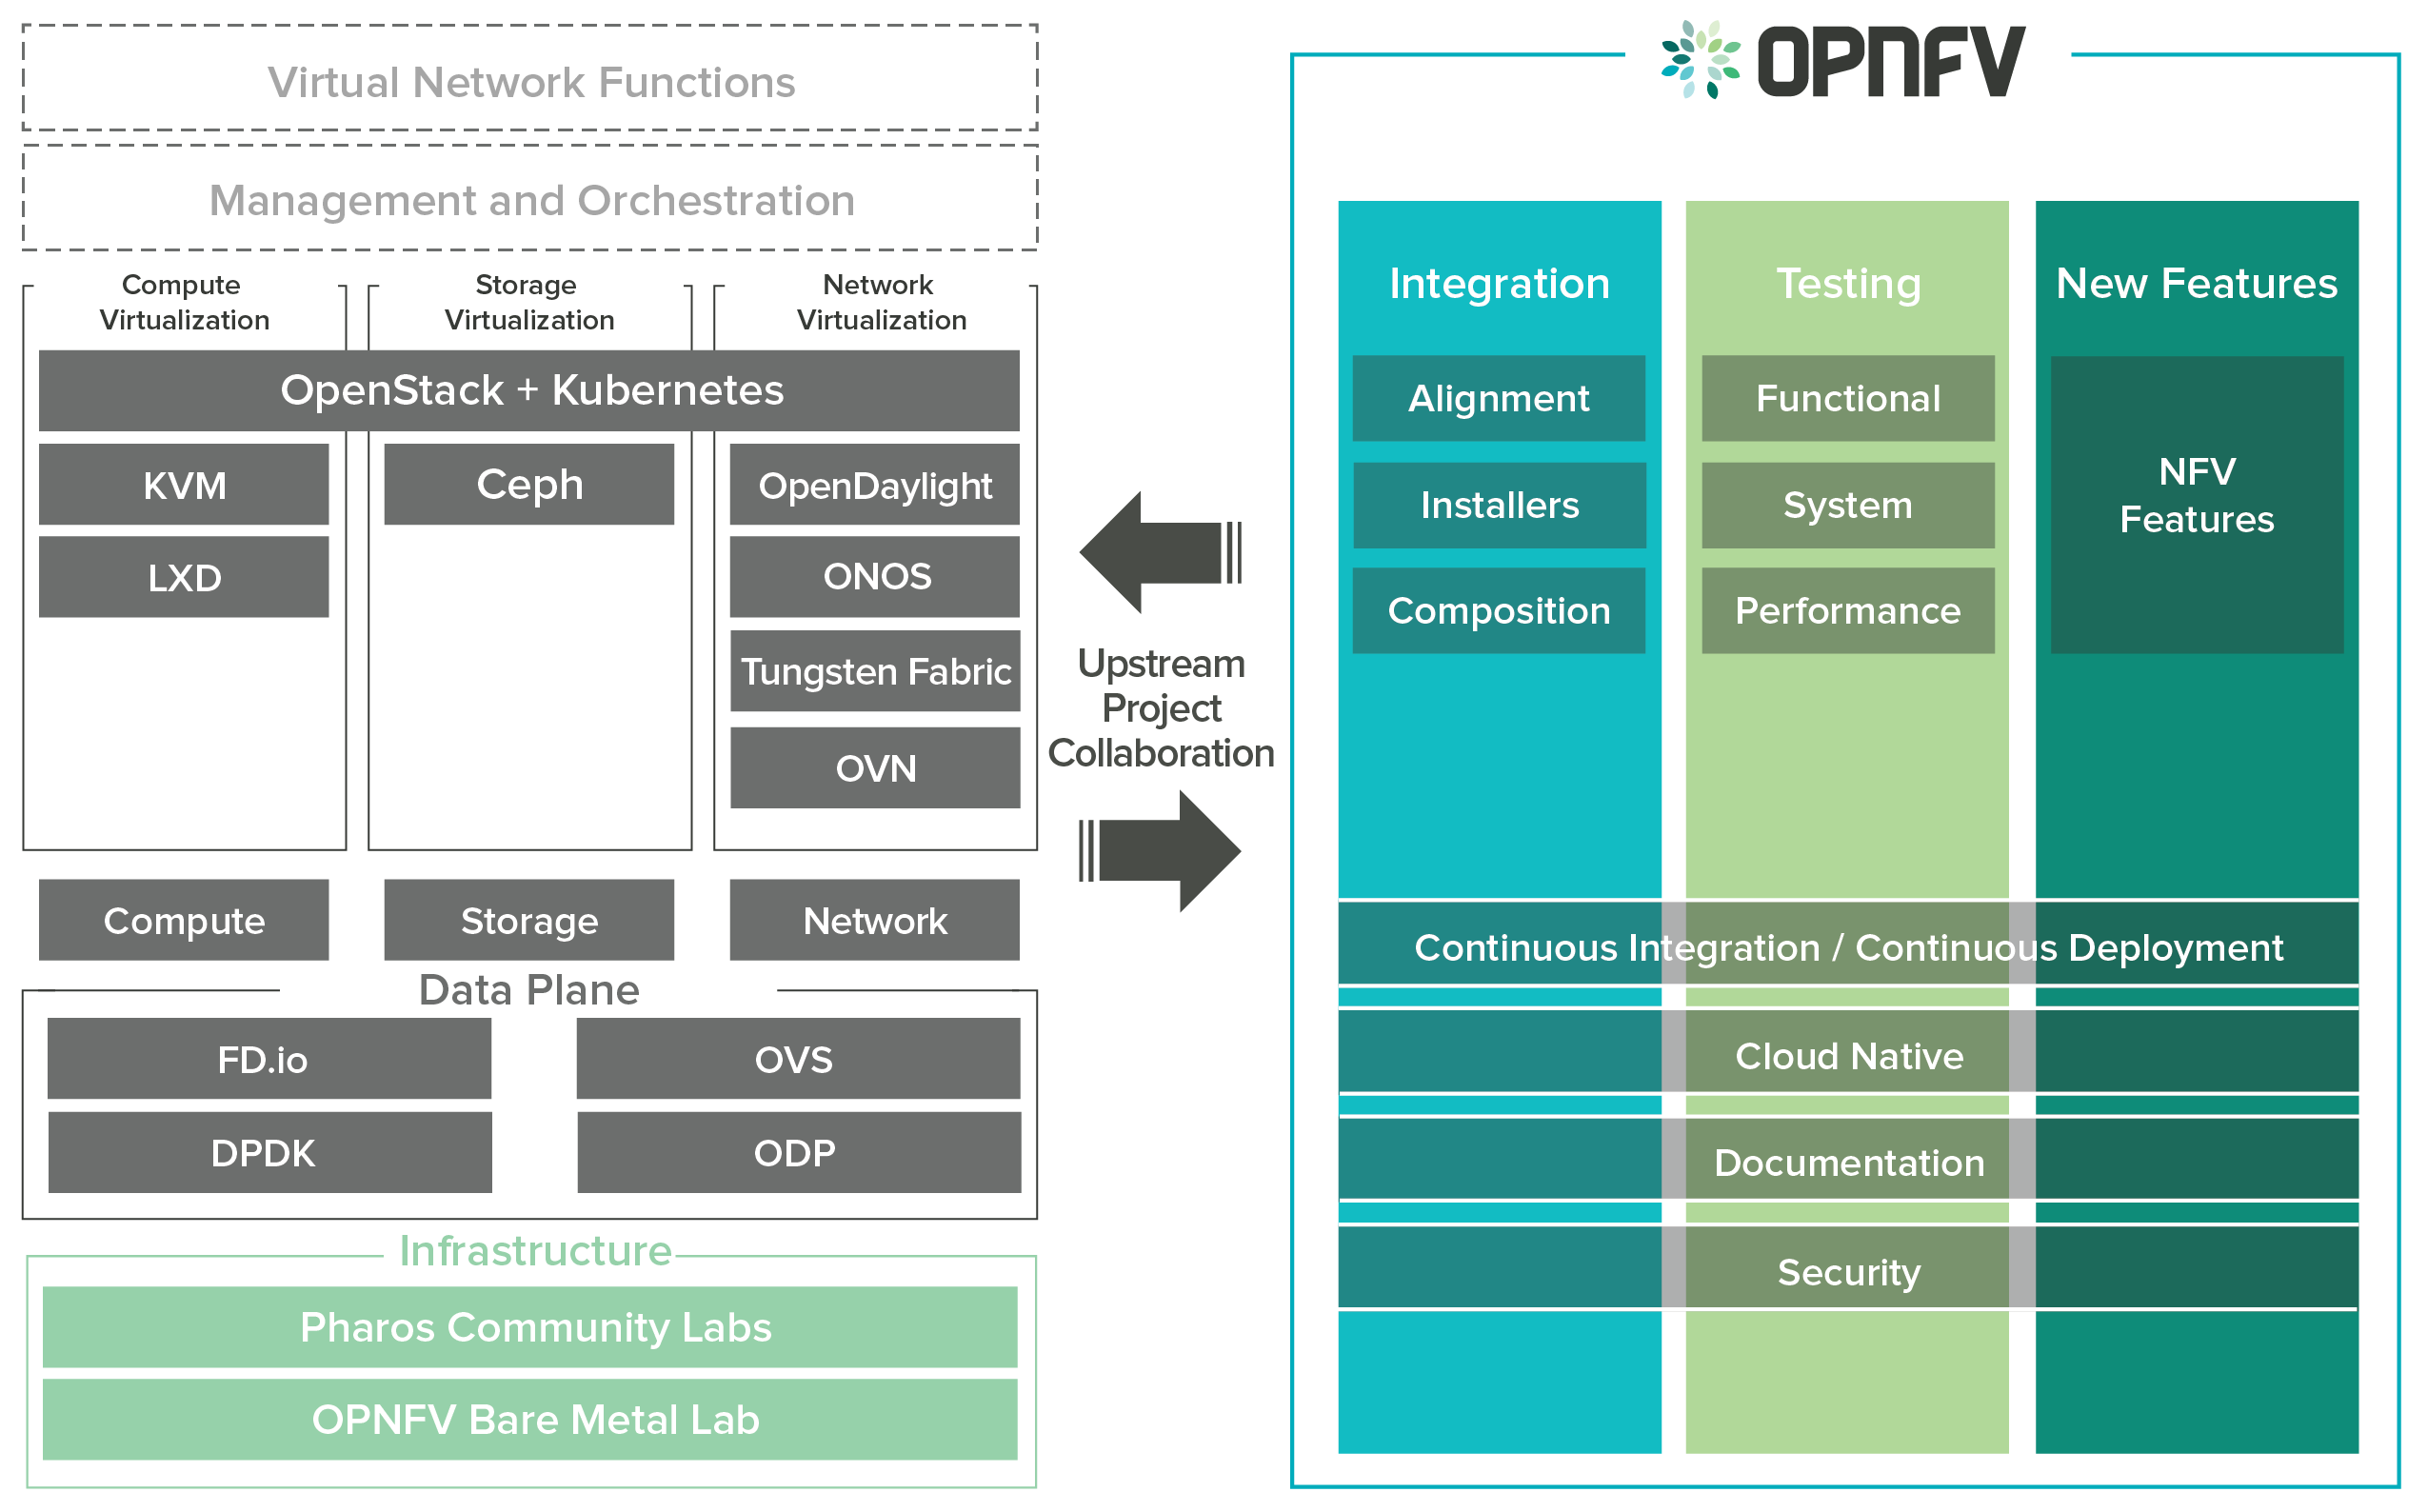
To address these areas effectively, the OPNFV platform architecture can be decomposed into the following basic building blocks:
The infrastructure working group oversees such topics as lab management, workflow, definitions, metrics and tools for OPNFV infrastructure.
Fundamental to the WG is the Pharos Specification which provides a set of defined lab infrastructures over a geographically and technically diverse federated global OPNFV lab.
Labs may instantiate bare-metal and virtual environments that are accessed remotely by the community and used for OPNFV platform and feature development, build, deploy and testing. No two labs are the same and the heterogeneity of the Pharos environment provides the ideal platform for establishing hardware and software abstractions providing well understood performance characteristics.
Community labs are hosted by OPNFV member companies on a voluntary basis. The Linux Foundation also hosts an OPNFV lab that provides centralized CI and other production resources which are linked to community labs.
The Lab-as-a-service (LaaS) offering provides developers to readily access NFV infrastructure on demand. Ongoing lab capabilities will include the ability easily automate deploy and test of any OPNFV install scenario in any lab environment using a concept called “Dynamic CI”.
The OPNFV software platform is comprised exclusively of open source implementations of platform component pieces. OPNFV is able to draw from the rich ecosystem of NFV related technologies available in open source communities, and then integrate, test, measure and improve these components in conjunction with our upstream communities.
OPNFV derives it’s virtual infrastructure management from one of our largest upstream ecosystems OpenStack. OpenStack provides a complete reference cloud management system and associated technologies. While the OpenStack community sustains a broad set of projects, not all technologies are relevant in the NFV domain, the OPNFV community consumes a sub-set of OpenStack projects and the usage and composition may vary depending on the installer and scenario.
For details on the scenarios available in OPNFV and the specific composition of components refer to the OPNFV User Guide & Configuration Guide.
OPNFV now also has initial support for containerized VNFs.
OPNFV currently uses Linux on all target machines, this can include Ubuntu, Centos or SUSE Linux. The specific version of Linux used for any deployment is documented in the installation guide.
OPNFV, as an NFV focused project, has a significant investment on networking technologies and provides a broad variety of integrated open source reference solutions. The diversity of controllers able to be used in OPNFV is supported by a similarly diverse set of forwarding technologies.
There are many SDN controllers available today relevant to virtual environments where the OPNFV community supports and contributes to a number of these. The controllers being worked on by the community during this release of OPNFV include:
OPNFV extends Linux virtual networking capabilities by using virtual switching and routing components. The OPNFV community proactively engages with the following open source communities to address performance, scale and resiliency needs apparent in carrier networks.
OPNFV integrates open source MANO projects for NFV orchestration and VNF management. New MANO projects are constantly being added.
A typical OPNFV deployment starts with three controller nodes running in a high availability configuration including control plane components from OpenStack, SDN controllers, etc. and a minimum of two compute nodes for deployment of workloads (VNFs). A detailed description of the hardware requirements required to support the 5 node configuration can be found in pharos specification: Pharos Project
In addition to the deployment on a highly available physical infrastructure, OPNFV can be deployed for development and lab purposes in a virtual environment. In this case each of the hosts is provided by a virtual machine and allows control and workload placement using nested virtualization.
The initial deployment is done using a staging server, referred to as the “jumphost”. This server-either physical or virtual-is first installed with the installation program that then installs OpenStack and other components on the controller nodes and compute nodes. See the OPNFV User Guide & Configuration Guide for more details.
The OPNFV community has set out to address the needs of virtualization in the carrier network and as such platform validation and measurements are a cornerstone to the iterative releases and objectives.
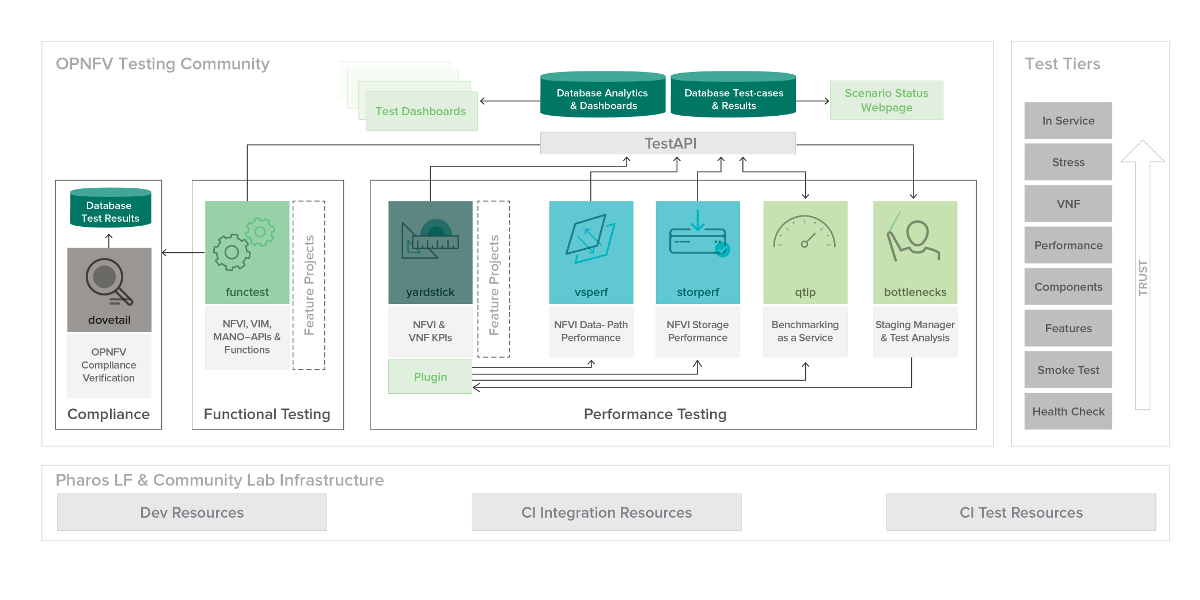
To simplify the complex task of feature, component and platform validation and characterization the testing community has established a fully automated method for addressing all key areas of platform validation. This required the integration of a variety of testing frameworks in our CI systems, real time and automated analysis of results, storage and publication of key facts for each run as shown in the following diagram.
The OPNFV community relies on its testing community to establish release criteria for each OPNFV release. With each release cycle the testing criteria become more stringent and better representative of our feature and resiliency requirements. Each release establishes a set of deployment scenarios to validate, the testing infrastructure and test suites need to accommodate these features and capabilities.
The release criteria as established by the testing teams include passing a set of test cases derived from the functional testing project ‘functest,’ a set of test cases derived from our platform system and performance test project ‘yardstick,’ and a selection of test cases for feature capabilities derived from other test projects such as bottlenecks, vsperf, cperf and storperf. The scenario needs to be able to be deployed, pass these tests, and be removed from the infrastructure iteratively in order to fulfill the release criteria.
Functest provides a functional testing framework incorporating a number of test suites and test cases that test and verify OPNFV platform functionality. The scope of Functest and relevant test cases can be found in the Functest User Guide
Functest provides both feature project and component test suite integration, leveraging OpenStack and SDN controllers testing frameworks to verify the key components of the OPNFV platform are running successfully.
Yardstick is a testing project for verifying the infrastructure compliance when running VNF applications. Yardstick benchmarks a number of characteristics and performance vectors on the infrastructure making it a valuable pre-deployment NFVI testing tools.
Yardstick provides a flexible testing framework for launching other OPNFV testing projects.
There are two types of test cases in Yardstick:
The OPNFV community is developing a set of test suites intended to evaluate a set of reference behaviors and capabilities for NFV systems developed externally from the OPNFV ecosystem to evaluate and measure their ability to provide the features and capabilities developed in the OPNFV ecosystem.
The Dovetail project will provide a test framework and methodology able to be used on any NFV platform, including an agreed set of test cases establishing an evaluation criteria for exercising an OPNFV compatible system. The Dovetail project has begun establishing the test framework and will provide a preliminary methodology for the Fraser release. Work will continue to develop these test cases to establish a stand alone compliance evaluation solution in future releases.
Besides the test suites and cases for release verification, additional testing is performed to validate specific features or characteristics of the OPNFV platform. These testing framework and test cases may include some specific needs; such as extended measurements, additional testing stimuli, or tests simulating environmental disturbances or failures.
These additional testing activities provide a more complete evaluation of the OPNFV platform. Some of the projects focused on these testing areas include:
Bottlenecks provides a framework to find system limitations and bottlenecks, providing root cause isolation capabilities to facilitate system evaluation.
NFVbench is a lightweight end-to-end dataplane benchmarking framework project. It includes traffic generator(s) and measures a number of packet performance related metrics.
QTIP boils down NFVI compute and storage performance into one single metric for easy comparison. QTIP crunches these numbers based on five different categories of compute metrics and relies on Storperf for storage metrics.
Storperf measures the performance of external block storage. The goal of this project is to provide a report based on SNIA’s (Storage Networking Industry Association) Performance Test Specification.
VSPERF provides an automated test-framework and comprehensive test suite for measuring data-plane performance of the NFVI including switching technology, physical and virtual network interfaces. The provided test cases with network topologies can be customized while also allowing individual versions of Operating System, vSwitch and hypervisor to be specified.
This an overview document for the installation of the Gambia release of OPNFV.
The Gambia release can be installed making use of any of the installer projects in OPNFV: Apex, Compass4Nfv or Fuel. Each installer provides the ability to install a common OPNFV platform as well as integrating additional features delivered through a variety of scenarios by the OPNFV community.
The OPNFV platform is comprised of a variety of upstream components that may be deployed on your infrastructure. A composition of components, tools and configurations is identified in OPNFV as a deployment scenario.
The various OPNFV scenarios provide unique features and capabilities that you may want to leverage, and it is important to understand your required target platform capabilities before installing and configuring your scenarios.
An OPNFV installation requires either a physical infrastructure environment as defined in the Pharos specification, or a virtual one. When configuring a physical infrastructure it is strongly advised to follow the Pharos configuration guidelines.
OPNFV scenarios are designed to host virtualised network functions (VNF’s) in a variety of deployment architectures and locations. Each scenario provides specific capabilities and/or components aimed at solving specific problems for the deployment of VNF’s.
A scenario may, for instance, include components such as OpenStack, OpenDaylight, OVS, KVM etc., where each scenario will include different source components or configurations.
To learn more about the scenarios supported in the Fraser release refer to the scenario description documents provided:
Detailed step by step instructions for working with an installation toolchain and installing the required scenario are provided by the installation projects. The projects providing installation support for the OPNFV Gambia release are: Apex, Compass4nfv and Fuel.
The instructions for each toolchain can be found in these links:
If you have elected to install the OPNFV platform using the deployment toolchain provided by OPNFV, your system will have been validated once the installation is completed. The basic deployment validation only addresses a small part of capabilities in the platform and you may want to execute more exhaustive tests. Some investigation will be required to select the right test suites to run on your platform.
Many of the OPNFV test project provide user-guide documentation and installation instructions in this document
OPNFV is a collaborative project aimed at providing a variety of virtualisation deployments intended to host applications serving the networking and carrier industries. This document provides guidance and instructions for using platform features designed to support these applications that are made available in the OPNFV Gambia release.
This document is not intended to replace or replicate documentation from other upstream open source projects such as KVM, OpenDaylight, OpenStack, etc., but to highlight the features and capabilities delivered through the OPNFV project.
OPNFV provides a suite of scenarios, infrastructure deployment options, which are able to be installed to host virtualised network functions (VNFs). This document intends to help users of the platform leverage the features and capabilities delivered by OPNFV.
OPNFVs’ Continuous Integration builds, deploys and tests combinations of virtual infrastructure components in what are defined as scenarios. A scenario may include components such as KVM, OpenDaylight, OpenStack, OVS, etc., where each scenario will include different source components or configurations. Scenarios are designed to enable specific features and capabilities in the platform that can be leveraged by the OPNFV user community.
The following links outline the feature deliverables from participating OPNFV projects in the Gambia release. Each of the participating projects provides detailed descriptions about the delivered features including use cases, implementation, and configuration specifics.
The following Configuration Guides and User Guides assume that the reader already has some knowledge about a given project’s specifics and deliverables. These Guides are intended to be used following the installation with an OPNFV installer to allow users to deploy and implement feature delivered by OPNFV.
If you are unsure about the specifics of a given project, please refer to the OPNFV wiki page at http://wiki.opnfv.org for more details.
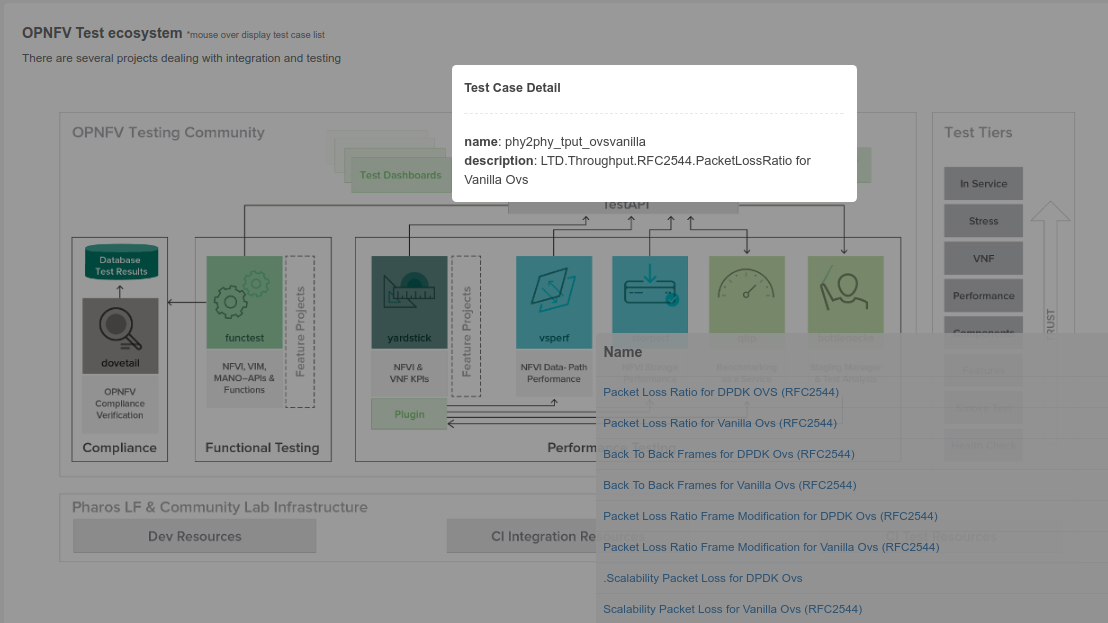
Testing is one of the key activities in OPNFV and includes unit, feature, component, system level testing for development, automated deployment, performance characterization and stress testing.
Test projects are dedicated to provide frameworks, tooling and test-cases categorized as functional, performance or compliance testing. Test projects fulfill different roles such as verifying VIM functionality, benchmarking components and platforms or analysis of measured KPIs for OPNFV release scenarios.
Feature projects also provide their own test suites that either run independently or within a test project.
This document details the OPNFV testing ecosystem, describes common test components used by individual OPNFV projects and provides links to project specific documentation.
The OPNFV testing projects are represented in the following diagram:

The major testing projects are described in the table below:
| Project | Description |
|---|---|
| Bottlenecks | This project aims to find system bottlenecks by testing and verifying OPNFV infrastructure in a staging environment before committing it to a production environment. Instead of debugging a deployment in production environment, an automatic method for executing benchmarks which plans to validate the deployment during staging is adopted. This project forms a staging framework to find bottlenecks and to do analysis of the OPNFV infrastructure. |
| CPerf | SDN Controller benchmarks and performance testing, applicable to controllers in general. Collaboration of upstream controller testing experts, external test tool developers and the standards community. Primarily contribute to upstream/external tooling, then add jobs to run those tools on OPNFV’s infrastructure. |
| Dovetail | This project intends to define and provide a set of OPNFV related validation criteria/tests that will provide input for the OPNFV Complaince Verification Program. The Dovetail project is executed with the guidance and oversight of the Complaince and Certification (C&C) committee and work to secure the goals of the C&C committee for each release. The project intends to incrementally define qualification criteria that establish the foundations of how one is able to measure the ability to utilize the OPNFV platform, how the platform itself should behave, and how applications may be deployed on the platform. |
| Functest | This project deals with the functional testing of the VIM and NFVI. It leverages several upstream test suites (OpenStack, ODL, ONOS, etc.) and can be used by feature project to launch feature test suites in CI/CD. The project is used for scenario validation. |
| NFVbench | NFVbench is a compact and self contained data plane performance measurement tool for OpensStack based NFVi platforms. It is agnostic of the NFVi distribution, Neutron networking implementation and hardware. It runs on any Linux server with a DPDK compliant NIC connected to the NFVi platform data plane and bundles a highly efficient software traffic generator. Provides a fully automated measurement of most common packet paths at any level of scale and load using RFC-2544. Available as a Docker container with simple command line and REST interfaces. Easy to use as it takes care of most of the guesswork generally associated to data plane benchmarking. Can run in any lab or in production environments. |
| QTIP | QTIP as the project for “Platform Performance Benchmarking” in OPNFV aims to provide user a simple indicator for performance, supported by comprehensive testing data and transparent calculation formula. It provides a platform with common services for performance benchmarking which helps users to build indicators by themselves with ease. |
| StorPerf | The purpose of this project is to provide a tool to measure block and object storage performance in an NFVI. When complemented with a characterization of typical VF storage performance requirements, it can provide pass/fail thresholds for test, staging, and production NFVI environments. |
| VSPERF | VSPERF is an OPNFV project that provides an automated test-framework and comprehensive test suite based on Industry Test Specifications for measuring NFVI data-plane performance. The data-path includes switching technologies with physical and virtual network interfaces. The VSPERF architecture is switch and traffic generator agnostic and test cases can be easily customized. Software versions and configurations including the vSwitch (OVS or VPP) as well as the network topology are controlled by VSPERF (independent of OpenStack). VSPERF is used as a development tool for optimizing switching technologies, qualification of packet processing components and for pre-deployment evaluation of the NFV platform data-path. |
| Yardstick | The goal of the Project is to verify the infrastructure compliance when running VNF applications. NFV Use Cases described in ETSI GS NFV 001 show a large variety of applications, each defining specific requirements and complex configuration on the underlying infrastructure and test tools.The Yardstick concept decomposes typical VNF work-load performance metrics into a number of characteristics/performance vectors, which each of them can be represented by distinct test-cases. |
Any test project running in the global OPNFV lab infrastructure and is integrated with OPNFV CI can push test results to the community Test Database using a common Test API. This database can be used to track the evolution of testing and analyse test runs to compare results across installers, scenarios and between technically and geographically diverse hardware environments.
Results from the databse are used to generate a dashboard with the current test status for each testing project. Please note that you can also deploy the Test Database and Test API locally in your own environment.
The management of test results can be summarized as follows:
+-------------+    +-------------+    +-------------+
|             |    |             |    |             |
|   Test      |    |   Test      |    |   Test      |
| Project #1  |    | Project #2  |    | Project #N  |
|             |    |             |    |             |
+-------------+    +-------------+    +-------------+
         |               |               |
         V               V               V
     +---------------------------------------------+
     |                                             |
     |           Test Rest API front end           |
     |    http://testresults.opnfv.org/test        |
     |                                             |
     +---------------------------------------------+
         ^                |                     ^
         |                V                     |
         |     +-------------------------+      |
         |     |                         |      |
         |     |    Test Results DB      |      |
         |     |         Mongo DB        |      |
         |     |                         |      |
         |     +-------------------------+      |
         |                                      |
         |                                      |
   +----------------------+        +----------------------+
   |                      |        |                      |
   | Testing Dashboards   |        |  Test Landing page   |
   |                      |        |                      |
   +----------------------+        +----------------------+
A Mongo DB Database was introduced for the Brahmaputra release. The following collections are declared in this database:
- pods: the list of pods used for production CI
- projects: the list of projects providing test cases
- test cases: the test cases related to a given project
- results: the results of the test cases
- scenarios: the OPNFV scenarios tested in CI
This database can be used by any project through the Test API. Please note that projects may also use additional databases. The Test Database is mainly use to collect CI test results and generate scenario trust indicators. The Test Database is also cloned for OPNFV Plugfests in order to provide a private datastore only accessible to Plugfest participants.
The Test API is used to declare pods, projects, test cases and test results. Pods correspond to a cluster of machines (3 controller and 2 compute nodes in HA mode) used to run the tests and are defined in the Pharos project. The results pushed in the database are related to pods, projects and test cases. Trying to push results generated from a non-referenced pod will return an error message by the Test API.
For detailed information, please go to http://artifacts.opnfv.org/releng/docs/testapi.html
The code of the Test API is hosted in the releng-testresults repository [TST2]. The static documentation of the Test API can be found at [TST3]. The Test API has been dockerized and may be installed locally in your lab.
The deployment of the Test API has been automated. A jenkins job manages:
- the unit tests of the Test API
- the creation of a new docker file
- the deployment of the new Test API
- the archive of the old Test API
- the backup of the Mongo DB
PUT/DELETE/POST operations of the TestAPI now require token based authorization. The token needs to be added in the request using a header ‘X-Auth-Token’ for access to the database.
e.g:
headers['X-Auth-Token']
The value of the header i.e the token can be accessed in the jenkins environment variable TestApiToken. The token value is added as a masked password.
headers['X-Auth-Token'] = os.environ.get('TestApiToken')
The above example is in Python. Token based authentication has been added so that only CI pods running Jenkins jobs can access the database. Please note that currently token authorization is implemented but is not yet enabled.
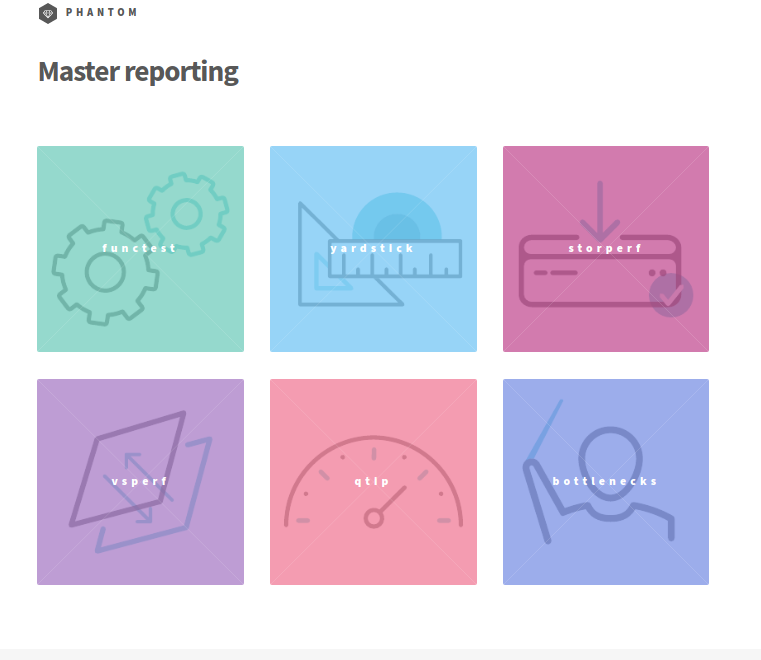
The reporting page for the test projects is http://testresults.opnfv.org/reporting/
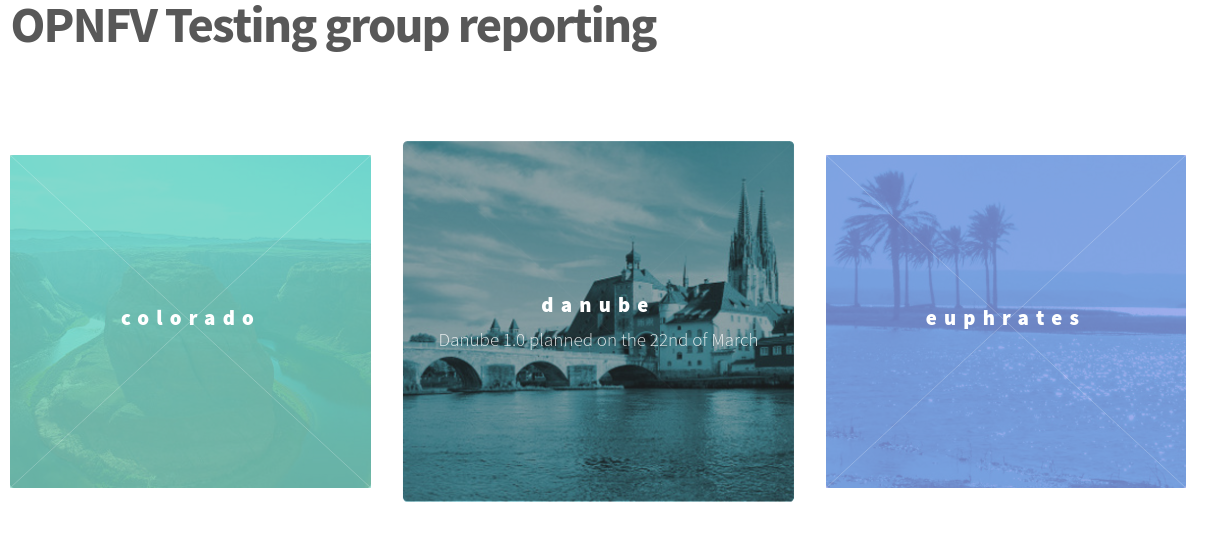
This page provides reporting per OPNFV release and per testing project.
An evolution of the reporting page is planned to unify test reporting by creating a landing page that shows the scenario status in one glance (this information was previously consolidated manually on a wiki page). The landing page will be displayed per scenario and show:
- the status of the deployment
- the score from each test suite. There is no overall score, it is determined
by each test project. * a trust indicator
Until the Colorado release, each testing project managed the list of its test cases. This made it very hard to have a global view of the available test cases from the different test projects. A common view was possible through the API but it was not very user friendly. Test cases per project may be listed by calling:
http://testresults.opnfv.org/test/api/v1/projects/<project_name>/cases
with project_name: bottlenecks, functest, qtip, storperf, vsperf, yardstick
A test case catalog has now been realized [TST4]. Roll over the project then click to get the list of test cases, and then click on the case to get more details.
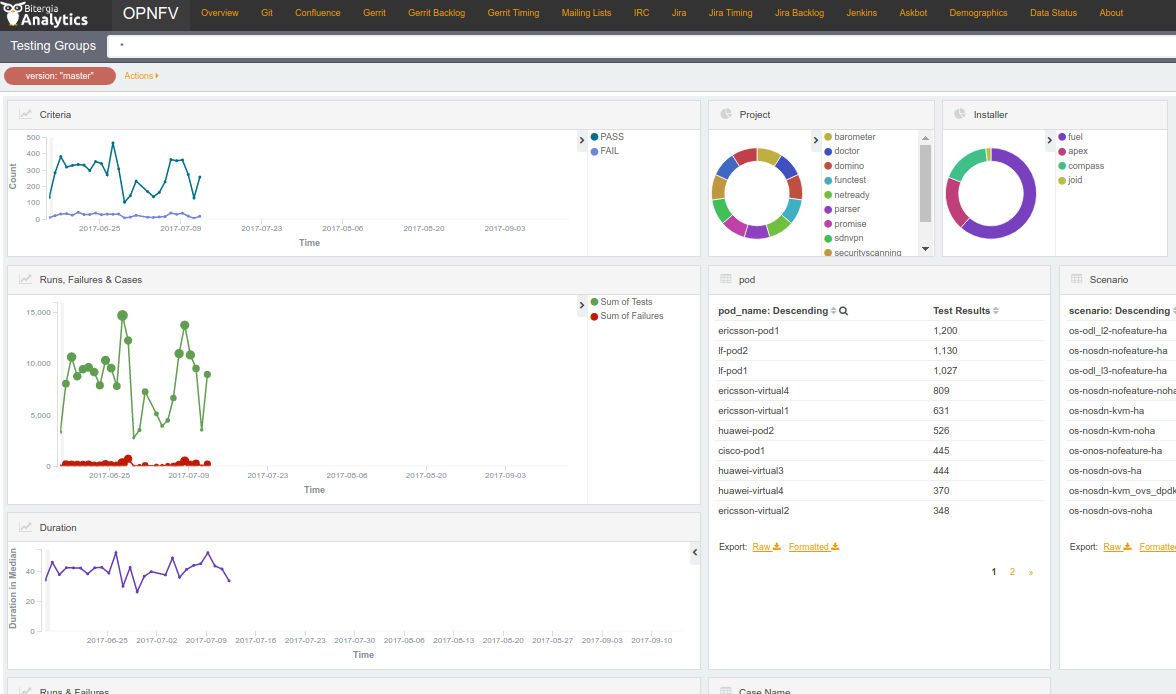
The Test Dashboard is used to provide a consistent view of the results collected in CI. The results shown on the dashboard are post processed from the Database, which only contains raw results. The dashboard can be used in addition to the reporting page (high level view) to allow the creation of specific graphs according to what the test owner wants to show.
In Brahmaputra, a basic dashboard was created in Functest. In Colorado, Yardstick used Grafana (time based graphs) and ELK (complex graphs). Since Danube, the OPNFV testing community decided to adopt the ELK framework and to use Bitergia for creating highly flexible dashboards [TST5].
Power consumption is a key driver for NFV. As an end user is interested to know which application is good or bad regarding power consumption and explains why he/she has to plug his/her smartphone every day, we would be interested to know which VNF is power consuming.
Power consumption is hard to evaluate empirically. It is however possible to collect information and leverage Pharos federation to try to detect some profiles/footprints. In fact thanks to CI, we know that we are running a known/deterministic list of cases. The idea is to correlate this knowledge with the power consumption to try at the end to find statistical biais.
The energy recorder high level architecture may be described as follows:
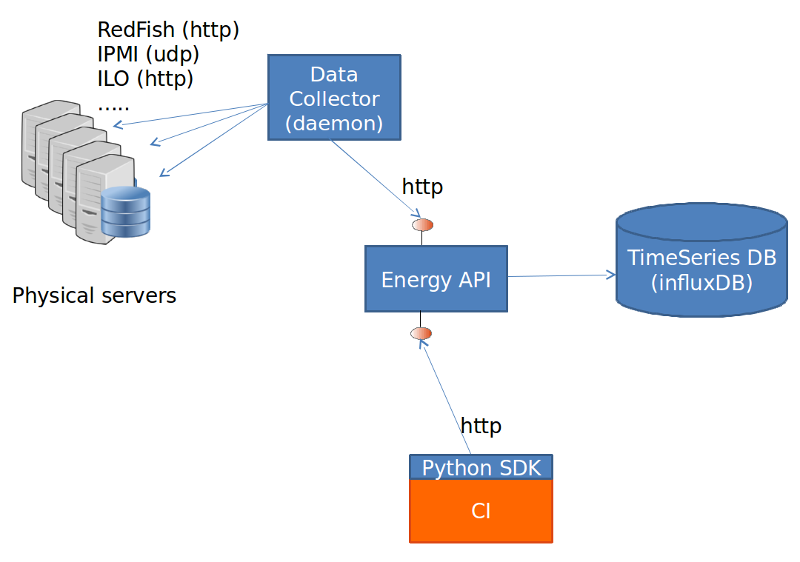
The energy monitoring system in based on 3 software components:
- Power info collector: poll server to collect instantaneous power consumption information
- Energy recording API + influxdb: On one leg receive servers consumption and
on the other, scenarios notfication. It then able to establish te correlation between consumption and scenario and stores it into a time-series database (influxdb) * Python SDK: A Python SDK using decorator to send notification to Energy recording API from testcases scenarios
It collects instantaneous power consumption information and send it to Event API in charge of data storing. The collector use different connector to read the power consumption on remote servers:
- IPMI: this is the basic method and is manufacturer dependent. Depending on manufacturer, refreshing delay may vary (generally for 10 to 30 sec.)
- RedFish: redfish is an industry RESTFUL API for hardware managment. Unfortunatly it is not yet supported by many suppliers.
- ILO: HP RESTFULL API: This connector support as well 2.1 as 2.4 version of HP-ILO
IPMI is supported by at least:
- HP
- IBM
- Dell
- Nokia
- Advantech
- Lenovo
- Huawei
Redfish API has been successfully tested on:
- HP
- Dell
- Huawei (E9000 class servers used in OPNFV Community Labs are IPMI 2.0
compliant and use Redfish login Interface through Browsers supporting JRE1.7/1.8)
Several test campaigns done with physical Wattmeter showed that IPMI results were notvery accurate but RedFish were. So if Redfish is available, it is highly recommended to use it.
To run the server power consumption collector agent, you need to deploy a docker container locally on your infrastructure.
This container requires:
- Connectivy on the LAN where server administration services (ILO, eDrac, IPMI,...) are configured and IP access to the POD’s servers
- Outgoing HTTP access to the Event API (internet)
Build the image by typing:
curl -s https://raw.githubusercontent.com/bherard/energyrecorder/master/docker/server-collector.dockerfile|docker build -t energyrecorder/collector -
Create local folder on your host for logs and config files:
mkdir -p /etc/energyrecorder
mkdir -p /var/log/energyrecorder
In /etc/energyrecorder create a configuration for logging in a file named collector-logging.conf:
curl -s https://raw.githubusercontent.com/bherard/energyrecorder/master/server-collector/conf/collector-logging.conf.sample > /etc/energyrecorder/collector-logging.conf
Check configuration for this file (folders, log levels.....) In /etc/energyrecorder create a configuration for the collector in a file named collector-settings.yaml:
curl -s https://raw.githubusercontent.com/bherard/energyrecorder/master/server-collector/conf/collector-settings.yaml.sample > /etc/energyrecorder/collector-settings.yaml
Define the “PODS” section and their “servers” section according to the environment to monitor. Note: The “environment” key should correspond to the pod name, as defined in the “NODE_NAME” environment variable by CI when running.
IMPORTANT NOTE: To apply a new configuration, you need to kill the running container an start a new one (see below)
To run the container, you have to map folder located on the host to folders in the container (config, logs):
docker run -d --name energy-collector --restart=always -v /etc/energyrecorder:/usr/local/energyrecorder/server-collector/conf -v /var/log/energyrecorder:/var/log/energyrecorder energyrecorder/collector
An event API to insert contextual information when monitoring energy (e.g. start Functest, start Tempest, destroy VM, ..) It is associated with an influxDB to store the power consumption measures It is hosted on a shared environment with the folling access points:
| Component | Connectivity |
|---|---|
| Energy recording API documentation | http://energy.opnfv.fr/resources/doc/ |
| influxDB (data) | http://energy.opnfv.fr:8086 |
In you need, you can also host your own version of the Energy recording API (in such case, the Python SDK may requires a settings update) If you plan to use the default shared API, following steps are not required.
First, you need to buid an image:
curl -s https://raw.githubusercontent.com/bherard/energyrecorder/master/docker/recording-api.dockerfile|docker build -t energyrecorder/api -
Create local folder on your host for logs and config files:
mkdir -p /etc/energyrecorder
mkdir -p /var/log/energyrecorder
mkdir -p /var/lib/influxdb
In /etc/energyrecorder create a configuration for logging in a file named webapp-logging.conf:
curl -s https://raw.githubusercontent.com/bherard/energyrecorder/master/recording-api/conf/webapp-logging.conf.sample > /etc/energyrecorder/webapp-logging.conf
Check configuration for this file (folders, log levels.....)
In /etc/energyrecorder create a configuration for the collector in a file named webapp-settings.yaml:
curl -s https://raw.githubusercontent.com/bherard/energyrecorder/master/recording-api/conf/webapp-settings.yaml.sample > /etc/energyrecorder/webapp-settings.yaml
Normaly included configuration is ready to use except username/passwer for influx (see run-container.sh bellow). Use here the admin user.
IMPORTANT NOTE: To apply a new configuration, you need to kill the running container an start a new one (see bellow)
To run the container, you have to map folder located on the host to folders in the container (config, logs):
docker run -d --name energyrecorder-api -p 8086:8086 -p 8888:8888 -v /etc/energyrecorder:/usr/local/energyrecorder/web.py/conf -v /var/log/energyrecorder/:/var/log/energyrecorder -v /var/lib/influxdb:/var/lib/influxdb energyrecorder/webapp admin-influx-user-name admin-password readonly-influx-user-name user-password
with
| Parameter name | Description |
|---|---|
|
Influx user with admin grants to create |
| Influx password to set to admin user | |
| Influx user with readonly grants to create | |
| Influx password to set to readonly user |
NOTE: Local folder /var/lib/influxdb is the location web influx data are stored. You may used anything else at your convience. Just remember to define this mapping properly when running the container.
a Python SDK - almost not intrusive, based on python decorator to trigger call to the event API.
It is currently hosted in Functest repo but if other projects adopt it, a dedicated project could be created and/or it could be hosted in Releng.
import the energy library:
import functest.energy.energy as energy
Notify that you want power recording in your testcase:
@energy.enable_recording
def run(self):
    self.do_some_stuff1()
    self.do_some_stuff2()
If you want to register additional steps during the scenarios you can to it in 2 different ways.
Notify step on method definition:
@energy.set_step("step1")
def do_some_stuff1(self):
...
@energy.set_step("step2")
def do_some_stuff2(self):
Notify directly from code:
@energy.enable_recording
def run(self):
  Energy.set_step("step1")
  self.do_some_stuff1()
  ...
  Energy.set_step("step2")
  self.do_some_stuff2()
Settings delivered in the project git are ready to use and assume that you will use the sahre energy recording API. If you want to use an other instance, you have to update the key “energy_recorder.api_url” in <FUNCTEST>/functest/ci/config_functest.yaml” by setting the proper hostname/IP
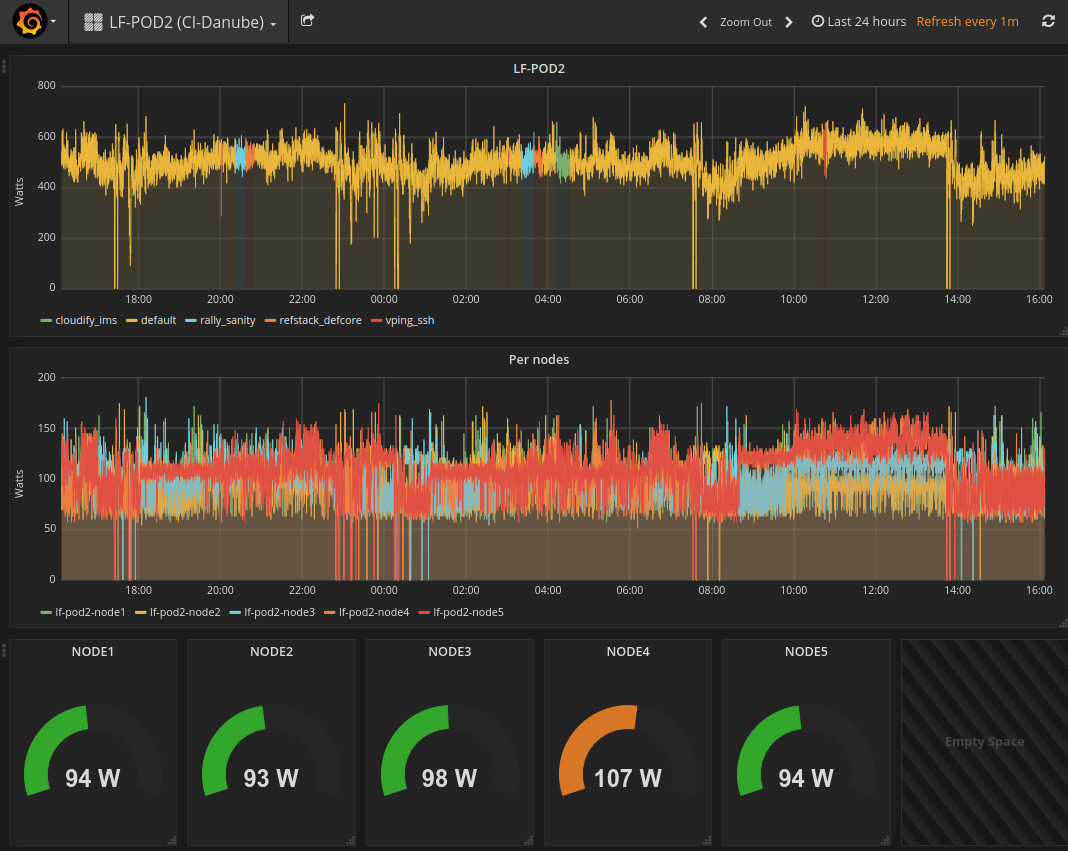
Here is an example of result comming from LF POD2. This sequence represents several CI runs in a raw. (0 power corresponds to hard reboot of the servers)
You may connect http://energy.opnfv.fr:3000 for more results (ask for credentials to infra team).
For more information or to participate in the OPNFV test community please see the following:
wiki: https://wiki.opnfv.org/testing
mailing list: test-wg@lists.opnfv.org
IRC channel: #opnfv-testperf
| Project | Documentation links |
|---|---|
| Bottlenecks | https://wiki.opnfv.org/display/bottlenecks/Bottlenecks |
| CPerf | https://wiki.opnfv.org/display/cperf |
| Dovetail | https://wiki.opnfv.org/display/dovetail |
| Functest | https://wiki.opnfv.org/display/functest/ |
| NFVbench | https://wiki.opnfv.org/display/nfvbench/ |
| QTIP | https://wiki.opnfv.org/display/qtip |
| StorPerf | https://wiki.opnfv.org/display/storperf/Storperf |
| VSPERF | https://wiki.opnfv.org/display/vsperf |
| Yardstick | https://wiki.opnfv.org/display/yardstick/Yardstick |
[TST1]: OPNFV web site
[TST2]: TestAPI code repository link in releng-testresults
[TST3]: TestAPI autogenerated documentation
[TST4]: Testcase catalog
[TST5]: Testing group dashboard
This page provides the links to the installation, configuration and user guides of the different test projects.
For each testsuite, you can either setup teststory or testcase to run certain test. teststory comprises several testcases as a set in one configuration file. You could call teststory or testcase by using Bottlenecks user interfaces. Details will be shown in the following section.
Brahmaputra:
Colorado:
Danube:
Euphrates:
These enhancements and test cases help the end users to gain more comprehensive understanding of the SUT. Graphic reports of the system behavior additional to test cases are provided to indicate the confidence level of SUT. Installer-agnostic testing framework allow end user to do stress testing adaptively over either Open Source or commercial deployments.
| Release | Integrated Installer | Supported Testsuite |
| Brahmaputra | Fuel | Rubbos, VSTF |
| Colorado | Compass | Rubbos, VSTF |
| Danube | Compass | POSCA |
| Euphrates | Any | POSCA |
| Fraser | Any | POSCA |
| Gambia | Any | POSCA, kubestone |
| POSCA | 1 | posca_factor_ping |
| 2 | posca_factor_system_bandwidth | |
| 3 | posca_facotor_soak_througputs | |
| 4 | posca_feature_vnf_scale_up | |
| 5 | posca_feature_vnf_scale_out | |
| 6 | posca_factor_storperf | |
| 7 | posca_factor_multistack_storage_parallel | |
| 8 | posca_factor_multistack_storage | |
| 9 | posca_feature_moon_resources | |
| 10 | posca_feature_moon_tenants | |
| Kubestone | 1 | deployment_capacity |
As for the abandoned test suite in the previous Bottlenecks releases, please refer to http://docs.opnfv.org/en/stable-danube/submodules/bottlenecks/docs/testing/user/userguide/deprecated.html.
The POSCA (Parametric Bottlenecks Testing Catalogue) test suite classifies the bottlenecks test cases and results into 5 categories. Then the results will be analyzed and bottlenecks will be searched among these categories.
The POSCA testsuite aims to locate the bottlenecks in parametric manner and to decouple the bottlenecks regarding the deployment requirements. The POSCA testsuite provides an user friendly way to profile and understand the E2E system behavior and deployment requirements.
Detailed workflow is illutrated below.
[Since Euphrates release, the docker-compose package is not required.]
if [ -d usr/local/bin/docker-compose ]; then
    rm -rf usr/local/bin/docker-compose
fi
curl -L https://github.com/docker/compose/releases/download/1.11.0/docker-compose-`uname -s`-`uname -m` > /usr/local/bin/docker-compose
chmod +x /usr/local/bin/docker-compose
The test environment preparation, the installation of the testing tools, the execution of the tests and the reporting/analyisis of POSCA test suite are highly automated. A few steps are needed to run it locally.
In Euphrates, Bottlenecks has modified its framework to support installer-agnostic testing which means that test cases could be executed over different deployments.
mkdir /home/opnfv
cd /home/opnfv
git clone https://gerrit.opnfv.org/gerrit/bottlenecks
cd bottlenecks
. pre_virt_env.sh
Put OpenStack RC file (admin_rc.sh), os_carcert and pod.yaml (pod descrition file) in /tmp directory. Edit admin_rc.sh and add the following line
export OS_CACERT=/tmp/os_cacert
If you have deployed your openstack environment by compass, you could use the following command to get the required files. As to Fuel, Apex and JOID installers, we only provide limited support now for retrieving the configuration/description files. If you find that the following command can not do the magic, you should put the required files in /tmp manually.
bash ./utils/env_prepare/config_prepare.sh -i <installer> [--debug]
Note that if we execute the command above, then admin_rc.sh and pod.yml will be created automatically in /tmp folder along with the line export OS_CACERT=/tmp/os_cacert added in admin_rc.sh file.
bottlenecks testcase|teststory run <testname>
For the testcase command, testname should be as the same name of the test case configuration file located in testsuites/posca/testcase_cfg. For stress tests in Danube/Euphrates, testcase should be replaced by either posca_factor_ping or posca_factor_system_bandwidth. For the teststory command, a user can specify the test cases to be executed by defining it in a teststory configuration file located in testsuites/posca/testsuite_story. There is also an example there named posca_factor_test.
There are also other 2 ways to run test cases and test stories.
The first one is to use shell script.
bash run_tests.sh [-h|--help] -s <testsuite>|-c <testcase>


The second is to use python interpreter.
$REPORT=False
opts="--privileged=true -id"
docker_volume="-v /var/run/docker.sock:/var/run/docker.sock -v /tmp:/tmp"
docker run $opts --name bottlenecks-load-master $docker_volume opnfv/bottlenecks:latest /bin/bash
sleep 5
POSCA_SCRIPT="/home/opnfv/bottlenecks/testsuites/posca"
docker exec bottlenecks-load-master python ${POSCA_SCRIPT}/../run_posca.py testcase|teststory <testname> ${REPORT}
Bottlenecks uses ELK to illustrate the testing results. Asumming IP of the SUT (System Under Test) is denoted as ipaddr, then the address of Kibana is http://[ipaddr]:5601. One can visit this address to see the illustrations. Address for elasticsearch is http://[ipaddr]:9200. One can use any Rest Tool to visit the testing data stored in elasticsearch.
. rm_virt_env.sh
If you want to clean the dockers that established during the test, you can excute the additional commands below.
bash run_tests.sh --cleanup
Note that you can also add cleanup parameter when you run a test case. Then environment will be automatically cleaned up when completing the test.
POSCA test cases are runned by OPNFV CI now. See https://build.opnfv.org for details of the building jobs. Each building job is set up to execute a single test case. The test results/logs will be printed on the web page and reported automatically to community MongoDB. There are two ways to report the results.
bash run_tests.sh [-h|--help] -s <testsuite>|-c <testcase> --report
REPORT=True
opts="--privileged=true -id"
docker_volume="-v /var/run/docker.sock:/var/run/docker.sock -v /tmp:/tmp"
docker run $opts --name bottlenecks-load-master $docker_volume opnfv/bottlenecks:latest /bin/bash
sleep 5
REPORT="True"
POSCA_SCRIPT="/home/opnfv/bottlenecks/testsuites/posca"
docker exec bottlenecks_load-master python ${POSCA_SCRIPT}/../run_posca.py testcase|teststory <testcase> ${REPORT}
This document provides an overview of the results of test cases developed by the OPNFV Bottlenecks Project, executed on OPNFV community labs.
OPNFV CI(Continous Integration) system provides automated build, deploy and testing for the software developed in OPNFV. Unless stated, the reported tests are automated via Jenkins Jobs.
Test results are visible in the following dashboard:
| Bottlenecks POSCA Stress Test Traffic | |
| test case name | posca_factor_system_bandwith |
| description | Stress test regarding baseline of the system for a single user, i.e., a VM pair while increasing the package size |
| configuration |
stack number: 1 |
| test result | PKT loss rate, latency, throupht, cpu usage |
test_config:
  tool: netperf
  protocol: tcp
  test_time: 20
  tx_pkt_sizes: 64, 256, 1024, 4096, 8192, 16384, 32768, 65536
  rx_pkt_sizes: 64, 256, 1024, 4096, 8192, 16384, 32768, 65536
  cpu_load: 0.9
  latency: 100000
runner_config:
  dashboard: "y"
  dashboard_ip:
  stack_create: yardstick
  yardstick_test_ip:
  yardstick_test_dir: "samples"
  yardstick_testcase: "netperf_bottlenecks"
| Bottlenecks POSCA Stress Test Ping | |
| test case name | posca_posca_ping |
| description | Stress test regarding life-cycle while using ping to validate the VM pairs constructions |
| configuration |
stack number: 5, 10, 20, 50 ... |
| test result | PKT loss rate, success rate, test time, latency |
load_manager:
  scenarios:
    tool: ping
    test_times: 100
    package_size:
    num_stack: 5, 5
    package_loss: 0

  contexts:
    stack_create: yardstick
    flavor:
    yardstick_test_ip:
    yardstick_test_dir: "samples"
    yardstick_testcase: "ping_bottlenecks"

dashboard:
  dashboard: "y"
  dashboard_ip:
| Bottlenecks POSCA Stress Test Storage | |
| test case name | posca_factor_storperf |
| description | Stress test regarding storage using Storperf |
| configuration |
|
| test result | Read / Write IOPS, Throughput, latency |
load_manager:
  scenarios:
    tool: storperf
| Bottlenecks POSCA Stress Test MultiStack Storage | |
| test case name | posca_factor_multistack_storage |
| description | Stress test regarding multistack storage using yardstick as a runner |
| configuration |
stack number: 5, 10, 20, 50 ... |
| test result | Read / Write IOPS, Throughput, latency |
load_manager:
  scenarios:
    tool: fio
    test_times: 10
    rw: write, read, rw, rr, randomrw
    bs: 4k
    size: 50g
    rwmixwrite: 50
    num_stack: 1, 3
    volume_num: 1
    numjobs: 1
    direct: 1

  contexts:
    stack_create: yardstick
    flavor:
    yardstick_test_ip:
    yardstick_test_dir: "samples"
    yardstick_testcase: "storage_bottlenecks"

dashboard:
  dashboard: "y"
  dashboard_ip:
| Bottlenecks POSCA Stress Test Storage (Multistack with Yardstick) | |
| test case name | posca_factor_multistack_storage_parallel |
| description | Stress test regarding storage while using yardstick for multistack as a runner |
| configuration |
|
| test result | Read / Write IOPS, Throughput, latency |
load_manager:
  scenarios:
    tool: fio
    test_times: 10
    rw: write, read, rw, rr, randomrw
    bs: 4k
    size: 50g
    rwmixwrite: 50
    num_stack: 1, 3
    volume_num: 1
    numjobs: 1
    direct: 1

  contexts:
    stack_create: yardstick
    flavor:
    yardstick_test_ip:
    yardstick_test_dir: "samples"
    yardstick_testcase: "storage_bottlenecks"

dashboard:
  dashboard: "y"
  dashboard_ip:
| Bottlenecks POSCA Soak Test Throughputs | |
| test case name | posca_factor_soak_throughputs |
| description | Long duration stability tests of data-plane traffic |
| configuration |
|
| test result | THROUGHPUT,THROUGHPUT_UNITS,MEAN_LATENCY,LOCAL_CPU_UTIL, REMOTE_CPU_UTIL,LOCAL_BYTES_SENT,REMOTE_BYTES_RECVD |
load_manager:
  scenarios:
    tool: netperf
    test_duration_hours: 1
    vim_pair_ttl: 300
    vim_pair_lazy_cre_delay: 2
    package_size:
    threshhold:
        package_loss: 0%
        latency: 300

  runners:
    stack_create: yardstick
    flavor:
    yardstick_test_dir: "samples"
    yardstick_testcase: "netperf_soak"
| Bottlenecks POSCA Soak Test Throughputs | |
| test case name | posca_feature_moon_resources |
| description | Moon authentication capability test for maximum number of authentication operations per tenant |
| configuration |
|
| test result | number of tenants, max number of users |
load_manager:
  scenarios:
    tool: https request
    # info that the cpus and memes have the same number of data.
    pdp_name: pdp
    policy_name: "MLS Policy example"
    model_name: MLS
    tenants: 1,5,10,20
    subject_number: 10
    object_number: 10
    timeout: 0.2

  runners:
    stack_create: yardstick
    Debug: False
    yardstick_test_dir: "samples"
    yardstick_testcase: "moon_resource"
| Bottlenecks POSCA Soak Test Throughputs | |
| test case name | posca_feature_moon_tenants |
| description | Moon authentication capability test for maximum tenants |
| configuration |
|
| test result | Max number of tenants |
load_manager:
  scenarios:
    tool: https request
    # info that the cpus and memes have the same number of data.
    pdp_name: pdp
    policy_name: "MLS Policy example"
    model_name: MLS
    subject_number: 20
    object_number: 20
    timeout: 0.003
    initial_tenants: 0
    steps_tenants: 1
    tolerate_time: 20
    SLA: 5

  runners:
    stack_create: yardstick
    Debug: False
    yardstick_test_dir: "samples"
    yardstick_testcase: "moon_tenant"
| Bottlenecks POSCA Soak Test Throughputs | |
| test case name | posca_feature_nfv_scale_out |
| description | SampleVNF Scale Out Test |
| configuration |
|
| test result | throughputs, latency, loss rate |
load_manager:
  scenarios:
    number_vnfs: 1, 2, 4
    iterations: 10
    interval: 35

  runners:
    stack_create: yardstick
    flavor:
    yardstick_test_dir: "samples/vnf_samples/nsut/acl"
    yardstick_testcase: "tc_heat_rfc2544_ipv4_1rule_1flow_64B_trex_correlated_traffic_scale_out"
| Bottlenecks Kubestone Deployment Capacity Test | |
| test case name | kubestone_deployment_capacity |
| description | Stress test regarding capacity of deployment |
| configuration |
|
| test result | Capcity, Life-Cycle Duration, Available Deployments |
apiVersion: apps/v1
kind: Deployment
namespace: bottlenecks-kubestone
test_type: Horizontal-Scaling
scaling_steps: 10, 50, 100, 200
template: None
metadata:
  name: nginx-deployment
  labels:
    app: nginx
spec:
  replicas: 3
  selector:
    matchLabels:
      app: nginx
  template:
    metadata:
      labels:
        app: nginx
    spec:
      containers:
      - name: nginx
        image: nginx:1.7.9
        ports:
        - containerPort: 80
This document provides guidance for prospective participants on how to obtain ‘OPNFV Verified’ status. The OPNFV Verified Program (OVP) is administered by the OPNFV Compliance and Certification (C&C) committee.
For further information about the workflow and general inquiries about the program, please check out the OVP web portal, or contact the C&C committee by email address verified@opnfv.org. This email address should be used for all communication with the OVP.
A participant should start the process by submitting an online participation form. The participation form can found on the OVP web portal or directly at OVP participation form and the following information must be provided:
Once the participation form information is received and in order, an email response will be sent to the primary contact with confirmation and information to proceed. The primary contact specified in the participation form will be entered into OVP web portal back-end by the program administrator and will be permitted to submit results for review on behalf of their organization.
There is no fee at this time for participation in the OVP.
The following documents guide testers to prepare the test environment and run tests:
A unique Test ID is generated by the Dovetail tool for each test run and can only be submitted to the OVP web portal once.
Users/testers other than the primary contact may use the OVP web portal as a resource to upload, evaluate and share results in a private manner. Testers can upload the test results to the OVP web portal. By default, the results are visible only to the tester who uploaded the data.
Testers can self-review the test results through the portal until they are ready to ask for OVP review. They may also add new test results as needed.
Once the tester is satisfied with the test result, the primary contact grants access to the test result for OVP review using a ‘submit for review’ operation via the portal. The test result is identified by the unique Test ID and becomes visible to a review group comprised of OPNFV community members.
When a test result is made visible to the reviewers, the program administrator will ask for volunteers from the review group using the verified@opnfv.org email and CC the primary contact email that a review request has been made. The program administrator will supply the Test ID and owner field (primary contact user ID) to the reviewers to identify the results.
Upon receiving the email request from the program administrator, the review group conducts a peer based review of the test result using reviewer guidelines published per OVP release. Persons employed by the same organization that submitted the test results or by affiliated organizations will not be part of the reviewers.
The primary contact may be asked via email for any missing information or clarification of the test results. The reviewers will make a determination and recommend compliance or non-compliance to the C&C Committee. A positive review requires a minimum of two approvals from two distinct organizations without any negative reviews. The program administrator sends an email to OVP/C&C emails announcing a positive review. A one week limit is given for issues to be raised. If no issue is raised, the C&C Committee approves the result and the program administrator sends an email to OVP/C&C emails stating the result is approved.
Normally, the outcome of the review should be communicated to the primary contact within 10 business days after all required information is in order.
If a test result is denied, an appeal can be made to the C&C Committee for arbitration.
If an application is approved, further information will be communicated to the primary contact on the guidelines of using OVP Program Marks (including OVP logo) and the status of compliance for promotional purposes.
This addendum provides a high-level description of the testing scope and pass/fail criteria used in the OPNFV Verified Program (OVP) for the 2018.09 release. This information is intended as an overview for OVP testers and for the Dovetail Project to help guide test-tool and test-case development for the OVP 2018.09 release. The Dovetail project is responsible for documenting test-case specifications as well as implementing the OVP tool-chain through collaboration with the OPNFV testing community. OVP testing focuses on establishing the ability of the System Under Test (SUT) to perform NFVI and VIM operations and support Service Provider oriented features that ensure manageable, resilient and secure networks.
OPNFV Compliance indicates adherence of an NFV platform to behaviors defined through specific platform capabilities, allowing to prepare, instantiate, operate and remove VNFs running on the NFVI. OVP 2018.09 compliance evaluates the ability of a platform to support Service Provider network capabilities and workloads that are supported in the OPNFV platform as of this release. Compliance test cases are designated as compulsory or optional based on the maturity of OPNFV capabilities as well as industry expectations. Compulsory test cases may for example include NFVI management capabilities whereas tests for certain high-availability features may be deemed as optional.
Test coverage and pass/fail criteria are designed to ensure an acceptable level of compliance but not be so restrictive as to disqualify variations in platform implementations, capabilities and features.
Assumptions about the System Under Test (SUT) include ...
The OVP Governance Guidelines, as approved by the Board of Directors, outlines the key objectives of the OVP as follows:
The guidelines further directs the scope to be constrained to “features, capabilities, components, and interfaces included in an OPNFV release that are generally available in the industry (e.g., through adoption by an upstream community)”, and that compliance verification is evaluated using “functional tests that focus on defined interfaces and/or behaviors without regard to the implementation of the underlying system under test”.
OPNFV provides a broad range of capabilities, including the reference platform itself as well as tools-chains and methodologies for building infrastructures, and deploying and testing the platform. Not all these aspects are in scope for OVP and not all functions and components are tested in the initial versions of OVP. For example, the deployment tools for the SUT and CI/CD toolchain are currently out of scope. Similarly, performance benchmarking related testing is also out of scope or for further study. Newer functional areas such as MANO (outside of APIs in the NFVI and VIM) are still developing and are for future considerations.
In order to meet the above objectives for OVP, we aim to follow a general approach by first identifying the overall requirements for all stake-holders, then analyzing what OPNFV and the upstream communities can effectively test and verify presently to derive an initial working scope for OVP, and to recommend what the community should strive to achieve in future releases.
The overall requirements for OVP can be categorized by the basic cloud capabilities representing common operations needed by basic VNFs, and additional requirements for VNFs that go beyond the common cloud capabilities including functional extensions, operational capabilities and additional carrier grade requirements.
For the basic NFV requirements, we will analyze the required test cases, leverage or improve upon existing test cases in OPNFV projects and upstream projects whenever we can, and bridge the gaps when we must, to meet these basic requirements.
We are not yet ready to include compliance requirements for capabilities such as hardware portability, carrier grade performance, fault management and other operational features, security, MANO and VNF verification. These areas are being studied for consideration in future OVP releases.
In some areas, we will start with a limited level of verification initially, constrained by what community resources are able to support at this time, but still serve a basic need that is not being fulfilled elsewhere. In these areas, we bring significant value to the community we serve by starting a new area of verification, breaking new ground and expanding it in the future.
In other areas, the functions being verified have yet to reach wide adoption but are seen as important requirements in NFV, or features are only needed for specific NFV use cases but an industry consensus about the APIs and behaviors is still deemed beneficial. In such cases, we plan to incorporate the test areas as optional. An optional test area will not have to be run or passed in order to achieve compliance. Optional tests provide an opportunity for vendors to demonstrate compliance with specific OPNFV features beyond the mandatory test scope.
In order to define the scope of the 2018.09 release of the compliance and verification program, this section analyzes NFV-focused platform capabilities with respect to the high-level objectives and the general approach outlined in the previous section. The analysis determines which capabilities are suitable for inclusion in this release of the OVP and which capabilities are to be addressed in future releases.
The intent of these tests is to verify that the SUT has the required capabilities that a basic VNF needs, and these capabilities are implemented in a way that enables this basic VNF to run on any OPNFV compliant deployment.
A basic VNF can be thought of as a single virtual machine that is networked and can perform the simplest network functions, for example, a simple forwarding gateway, or a set of such virtual machines connected only by simple virtual network services. Running such basic VNF leads to a set of common requirements, including:
OPNFV mainly supports OpenStack as the VIM up to the 2018.09 release. The VNFs used in the OVP program, and features in scope for the program which are considered to be basic to all VNFs, require commercial OpenStack distributions to support a common basic level of cloud capabilities, and to be compliant to a common specification for these capabilities. This requirement significantly overlaps with OpenStack community’s Interop working group’s goals, but they are not identical. The OVP runs the OpenStack Refstack-Compute test cases to verify compliance to the basic common API requirements of cloud management functions and VNF (as a VM) management for OPNFV. Additional NFV specific requirements are added in network data path validation, packet filtering by security group rules and port security, life cycle runtime events of virtual networks, multiple networks in a topology, validation of VNF’s functional state after common life-cycle events including reboot, pause, suspense, stop/start and cold migration. In addition, the basic requirement also verifies that the SUT can allocate VNF resources based on simple anti-affinity rules.
The combined test cases help to ensure that these basic operations are always supported by a compliant platform and they adhere to a common standard to enable portability across OPNFV compliant platforms.
NFV has functional requirements beyond the basic common cloud capabilities, esp. in the networking area. Examples like BGPVPN, IPv6, SFC may be considered additional NFV requirements beyond general purpose cloud computing. These feature requirements expand beyond common OpenStack (or other VIM) requirements. OPNFV OVP will incorporate test cases to verify compliance in these areas as they become mature. Because these extensions may impose new API demands, maturity and industry adoption is a prerequisite for making them a mandatory requirement for OPNFV compliance. At the time of the 2018.09 release, we have promoted tests of the OpenStack IPv6 API from optional to mandatory while keeping BGPVPN as optional test area. Passing optional tests will not be required to pass OPNFV compliance verification.
BGPVPNs are relevant due to the wide adoption of MPLS/BGP based VPNs in wide area networks, which makes it necessary for data centers hosting VNFs to be able to seamlessly interconnect with such networks. SFC is also an important NFV requirement, however its implementation has not yet been accepted or adopted in the upstream at the time of the 2018.09 release.
High availability is a common carrier grade requirement. Availability of a platform involves many aspects of the SUT, for example hardware or lower layer system failures or system overloads, and is also highly dependent on configurations. The current OPNFV high availability verification focuses on OpenStack control service failures and resource overloads, and verifies service continuity when the system encounters such failures or resource overloads, and also verifies the system heals after a failure episode within a reasonable time window. These service HA capabilities are commonly adopted in the industry and should be a mandatory requirement.
The current test cases in HA cover the basic area of failure and resource overload conditions for a cloud platform’s service availability, including all of the basic cloud capability services, and basic compute and storage loads, so it is a meaningful first step for OVP. We expect additional high availability scenarios be extended in future releases.
Resiliency testing involves stressing the SUT and verifying its ability to absorb stress conditions and still provide an acceptable level of service. Resiliency is an important requirement for end-users.
The 2018.09 release of OVP includes a load test which spins up a number of VMs pairs in parallel to assert that the system under test can process the workload spike in a stable and deterministic fashion.
Security is among the top priorities as a carrier grade requirement by the end-users. Some of the basic common functions, including virtual network isolation, security groups, port security and role based access control are already covered as part of the basic cloud capabilities that are verified in OVP. These test cases however do not yet cover the basic required security capabilities expected of an end-user deployment. It is an area that we should address in the near future, to define a common set of requirements and develop test cases for verifying those requirements.
The 2018.09 release includes new test cases which verify that the role-based access control (RBAC) functionality of the VIM is behaving as expected.
Another common requirement is security vulnerability scanning. While the OPNFV security project integrated tools for security vulnerability scanning, this has not been fully analyzed or exercised in 2018.09 release. This area needs further work to identify the required level of security for the purpose of OPNFV in order to be integrated into the OVP. End-user inputs on specific requirements in security is needed.
Service assurance (SA) is a broad area of concern for reliability of the NFVI/VIM and VNFs, and depends upon multiple subsystems of an NFV platform for essential information and control mechanisms. These subsystems include telemetry, fault management (e.g. alarms), performance management, audits, and control mechanisms such as security and configuration policies.
The current 2018.09 release implements some enabling capabilities in NFVI/VIM such as telemetry, policy, and fault management. However, the specification of expected system components, behavior and the test cases to verify them have not yet been adequately developed. We will therefore not be testing this area at this time but defer to future study.
Use-case test cases exercise multiple functional capabilities of a platform in order to realize a larger end-to-end scenario. Such end-to-end use cases do not necessarily add new API requirements to the SUT per se, but exercise aspects of the SUT’s functional capabilities in more complex ways. For instance, they allow for verifying the complex interactions among multiple VNFs and between VNFs and the cloud platform in a more realistic fashion. End-users consider use-case-level testing as a significant tool in verifying OPNFV compliance because it validates design patterns and support for the types of NFVI features that users care about.
There are a lot of projects in OPNFV developing use cases and sample VNFs. The 2018.09 release of OVP features two such use-case tests, spawning and verifying a vIMS and a vEPC, correspondingly.
In addition to the capabilities analyzed above, there are further system aspects which are of importance for the OVP. These comprise operational and management aspects such as platform in-place upgrades and platform operational insights such as telemetry and logging. Further aspects include API backward compatibility / micro-versioning, workload migration, multi-site federation and interoperability with workload automation platforms, e.g. ONAP. Finally, efficiency aspects such as the hardware and energy footprint of the platform are worth considering in the OVP.
OPNFV is addressing these items on different levels of details in different projects. However, the contributions developed in these projects are not yet considered widely available in commercial systems in order to include them in the OVP. Hence, these aspects are left for inclusion in future releases of the OVP.
Summarizing the results of the analysis above, the scope of the 2018.09 release of OVP is as follows:
* The OPNFV OVP utilizes the same set of test cases as the OpenStack interoperability program OpenStack Powered Compute. Passing the OPNFV OVP does not imply that the SUT is certified according to the OpenStack Powered Compute program. OpenStack Powered Compute is a trademark of the OpenStack foundation and the corresponding certification label can only be awarded by the OpenStack foundation.
Note: The SUT is limited to NFVI and VIM functions. While testing MANO component capabilities is out of scope, certain APIs exposed towards MANO are used by the current OPNFV compliance testing suite. MANO and other operational elements may be part of the test infrastructure; for example used for workload deployment and provisioning.
Based on the previous analysis, the following items are outside the scope of the 2018.09 release of OVP but are being considered for inclusion in future releases:
This section provides guidance on compliance criteria for each test area. The criteria described here are high-level, detailed pass/fail metrics are documented in Dovetail test specifications.
Exceptions to this rule may be legitimate, e.g. due to imperfect test tools or reasonable circumstances that we can not foresee. These exceptions must be documented and accepted by the reviewers.
Applicants who choose to run the optional test cases can include the results of the optional test cases to highlight the additional compliance.
Vendors of commercial NFVI products may have extended the Nova API to support proprietary add-on features. These additions can cause Nova Tempest API tests to fail due to unexpected data in API responses. In order to resolve this transparently in the context of OVP, a temporary exemption process has been created. More information on the exemption can be found in section Disabling Strict API Validation in Tempest.
This document provides detailed guidance for reviewers on how to handle the result review process.
The OPNFV Verified program (OVP) provides the ability for users to upload test results in OVP portal and request from OVP community to review them. After the user submit for review the test results Status is changed from ‘private’ to ‘review’ (as shown in figure 2).
OVP administrator will ask for review volunteers using the verified@opnfv.org email alias. The incoming results for review will be identified by the administrator with particular Test ID and Owner values.
Volunteers that will accept the review request can access the test results by login to the OVP portal and the click on the My Results tab in top-level navigation bar.

Figure 1
The corresponding OVP portal result will have a status of ‘review’.

Figure 2
Reviewers must follow the checklist below to ensure review consistency for the OPNFV Verified Program (OVP) 2018.09 (Fraser) release at a minimum.
Test results can be displayed by clicking on the hyperlink under the ‘Test ID’ column. User should validate that results for all mandatory test areas are included in the overall test suite. The required mandatory test cases are:
Note, that the ‘Test ID’ column in this view condenses the UUID used for ‘Test ID’ to eight characters even though the ‘Test ID’ is a longer UUID in the back-end.
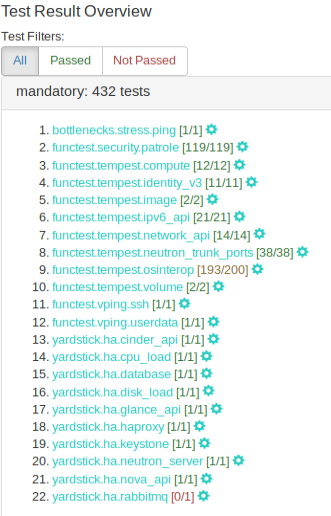
Figure 3
All mandatory test-cases have to run successfully. The below diagram of the ‘Test Run Results’ is one method and shows that 98.15% of the mandatory test-cases have passed. This value must not be lower than 100%.
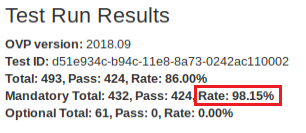
Figure 4
Failed test cases can also be easy identified by the color of pass/total number. :
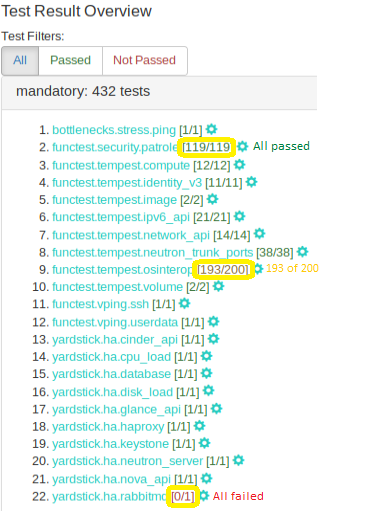
Figure 5
Each log file of the mandatory test cases have to be verified for content.
Log files can be displayed by clicking on the setup icon to the right of the results, as shown in figure below.
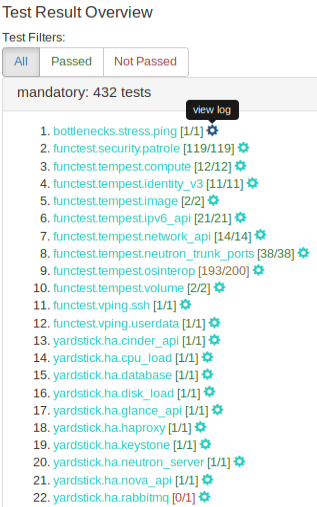
Figure 6
Note, all log files can be found at results/ directory as shown at the following table.
| Mandatory Test Case | Location |
| bottlenecks | results/stress_logs/ |
| functest.vping | results/vping_logs/ |
| functest.tempest | results/tempest_logs/ |
| functest.security | results/security_logs/ |
| yardstick | results/ha_logs/ |
The bottlenecks log must contain the ‘SUCCESS’ result as shown in following example:
2018-08-22 14:11:21,815 [INFO] yardstick.benchmark.core.task task.py:127 Testcase: “ping_bottlenecks” SUCCESS!!!
Functest logs opens an html page that lists all test cases as shown in figure 7. All test cases must have run successfuly.
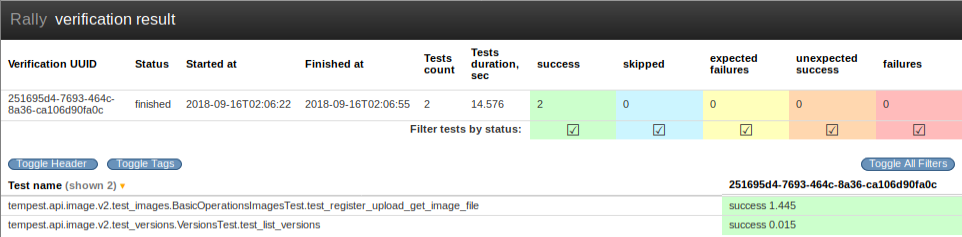
Figure 7
For the vping test area log file (functest.log). The two entries displayed in the tables below must be present in this log file.
functest.vping_userdata
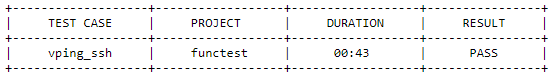
Figure 8
functest.vping_ssh
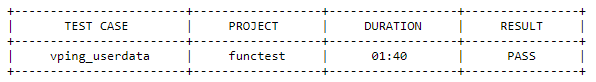
Figure 9
The yardstick log must contain the ‘SUCCESS’ result for each of the test-cases within this test area. This can be verified by searching the log for the keyword ‘SUCCESS’.
An example of a FAILED and a SUCCESS test case are listed below:
2018-08-28 10:25:09,946 [ERROR] yardstick.benchmark.scenarios.availability.monitor.monitor_multi monitor_multi.py:78 SLA failure: 14.015082 > 5.000000
2018-08-28 10:23:41,907 [INFO] yardstick.benchmark.core.task task.py:127 Testcase: “opnfv_yardstick_tc052” SUCCESS!!!
SUT information must be present in the results to validate that all required endpoint services and at least two controllers were present during test execution. For the results shown below, click the ‘info‘ hyperlink in the SUT column to navigate to the SUT information page.

Figure 10
In the ‘Endpoints‘ listing shown below for the SUT VIM component, ensure that services are present for identify, compute, image, volume and network at a minimum by inspecting the ‘Service Type‘ column.
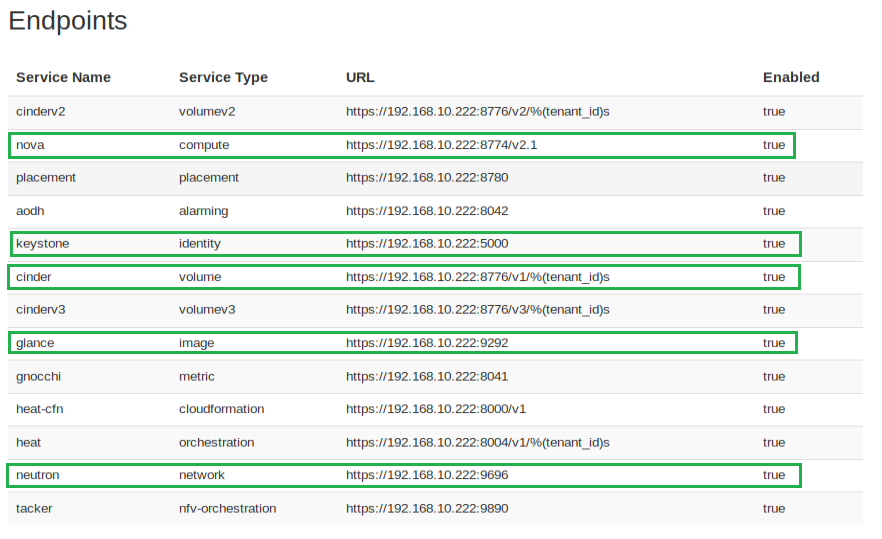
Figure 11
Inspect the ‘Hosts‘ listing found below the Endpoints secion of the SUT info page and ensure at least two hosts are present, as two controllers are required the for the mandatory HA test-cases.
This document provides a general guide to hardware system prerequisites and expectations for running OPNFV OVP testing. For detailed guide of preparing software tools and configurations, and conducting the test, please refer to the User Guide :ref:dovetail-testing_user_guide.
The OVP test tools expect that the hardware of the System Under Test (SUT) is Pharos compliant Pharos specification
The Pharos specification itself is a general guideline, rather than a set of specific hard requirements at this time, developed by the OPNFV community. For the purpose of helping OVP testers, we summarize the main aspects of hardware to consider in preparation for OVP testing.
As described by the OVP Testing User Guide, the hardware systems involved in OVP testing includes a Test Node, a System Under Test (SUT) system, and network connectivity between them.
The Test Node can be a bare metal machine or a virtual machine that can support Docker container environment. If it is a bare metal machine, it needs to be a x86 based at this time. Detailed information of how to configure and prepare the Test Node can be found in the User Guide.
The System Under Test (SUT) system is expected to consist of a set of general purpose servers, storage devices or systems, and networking infrastructure connecting them together. The set of servers are expected to be of the same architecture, either x86-64 or ARM-64. Mixing different architectures in the same SUT is not supported.
A minimum of 5 servers, 3 configured for controllers and 2 or more configured for compute resource are expected. However this is not a hard requirement at this phase. The OVP 1.0 mandatory test cases only require one compute server. At lease two compute servers are required to pass some of the optional test cases in the current OVP release. OVP control service high availability tests expect two or more control nodes to pass, depending on the HA mechanism implemented by the SUT.
The SUT is also expected to include components for persistent storage. The OVP testing does not expect or impose significant storage size or performance requirements.
The SUT is expected to be connected with high performance networks. These networks are expected in the SUT:
Additional networks, such as Light Out Management or storage networks, may be beneficial and found in the SUT, but they are not a requirement for OVP testing.
The OPNFV OVP provides a series or test areas aimed to evaluate the operation of an NFV system in accordance with carrier networking needs. Each test area contains a number of associated test cases which are described in detail in the associated test specification.
All tests in the OVP are required to fulfill a specific set of criteria in order that the OVP is able to provide a fair assessment of the system under test. Test requirements are described in the :ref:dovetail-test_case_requirements document.
All tests areas addressed in the OVP are covered in the following test specification documents.
The HA test area evaluates the ability of the System Under Test to support service continuity and recovery from component failures on part of OpenStack controller services(“nova-api”, “neutron-server”, “keystone”, “glance-api”, “cinder-api”) and on “load balancer” service.
The tests in this test area will emulate component failures by killing the processes of above target services, stressing the CPU load or blocking disk I/O on the selected controller node, and then check if the impacted services are still available and the killed processes are recovered on the selected controller node within a given time interval.
This test area references the following specifications:
The following terms and abbreviations are used in conjunction with this test area
The system under test is assumed to be the NFVi and VIM in operation on a Pharos compliant infrastructure.
SUT is assumed to be in high availability configuration, which typically means more than one controller nodes are in the System Under Test.
The HA test area is structured with the following test cases in a sequential manner.
Each test case is able to run independently. Preceding test case’s failure will not affect the subsequent test cases.
Preconditions of each test case will be described in the following test descriptions.
This test case verifies the service continuity capability in the face of the software process failure. It kills the processes of OpenStack “nova-api” service on the selected controller node, then checks whether the “nova-api” service is still available during the failure, by creating a VM then deleting the VM, and checks whether the killed processes are recovered within a given time interval.
There is more than one controller node, which is providing the “nova-api” service for API end-point.
Denoted a controller node as Node1 in the following configuration.
The service continuity and process recovery capabilities of “nova-api” service is evaluated by monitoring service outage time, process outage time, and results of nova operations.
Service outage time is measured by continuously executing “openstack server list” command in loop and checking if the response of the command request is returned with no failure. When the response fails, the “nova-api” service is considered in outage. The time between the first response failure and the last response failure is considered as service outage time.
Process outage time is measured by checking the status of “nova-api” processes on the selected controller node. The time of “nova-api” processes being killed to the time of the “nova-api” processes being recovered is the process outage time. Process recovery is verified by checking the existence of “nova-api” processes.
All nova operations are carried out correctly within a given time interval which suggests that the “nova-api” service is continuously available.
The process outage time is less than 30s.
The service outage time is less than 5s.
The nova operations are carried out in above order and no errors occur.
A negative result will be generated if the above is not met in completion.
Restart the process of “nova-api” if they are not running.
Delete image with “openstack image delete test-cirros”.
Delete flavor with “openstack flavor delete m1.test”.
yardstick.ha.neutron_server
Yardstick test case: opnfv_yardstick_tc045.yaml
This test verifies the high availability of the “neutron-server” service provided by OpenStack controller nodes. It kills the processes of OpenStack “neutron-server” service on the selected controller node, then checks whether the “neutron-server” service is still available, by creating a network and deleting the network, and checks whether the killed processes are recovered.
There is more than one controller node, which is providing the “neutron-server” service for API end-point.
Denoted a controller node as Node1 in the following configuration.
The high availability of “neutron-server” service is evaluated by monitoring service outage time, process outage time, and results of neutron operations.
Service outage time is tested by continuously executing “openstack router list” command in loop and checking if the response of the command request is returned with no failure. When the response fails, the “neutron-server” service is considered in outage. The time between the first response failure and the last response failure is considered as service outage time.
Process outage time is tested by checking the status of “neutron-server” processes on the selected controller node. The time of “neutron-server” processes being killed to the time of the “neutron-server” processes being recovered is the process outage time. Process recovery is verified by checking the existence of “neutron-server” processes.
The process outage time is less than 30s.
The service outage time is less than 5s.
The neutron operations are carried out in above order and no errors occur.
A negative result will be generated if the above is not met in completion.
Restart the processes of “neutron-server” if they are not running.
This test verifies the high availability of the “keystone” service provided by OpenStack controller nodes. It kills the processes of OpenStack “keystone” service on the selected controller node, then checks whether the “keystone” service is still available by executing command “openstack user list” and whether the killed processes are recovered.
There is more than one controller node, which is providing the “keystone” service for API end-point.
Denoted a controller node as Node1 in the following configuration.
The high availability of “keystone” service is evaluated by monitoring service outage time and process outage time
Service outage time is tested by continuously executing “openstack user list” command in loop and checking if the response of the command request is reutrned with no failure. When the response fails, the “keystone” service is considered in outage. The time between the first response failure and the last response failure is considered as service outage time.
Process outage time is tested by checking the status of “keystone” processes on the selected controller node. The time of “keystone” processes being killed to the time of the “keystone” processes being recovered is the process outage time. Process recovery is verified by checking the existence of “keystone” processes.
The process outage time is less than 30s.
The service outage time is less than 5s.
A negative result will be generated if the above is not met in completion.
Restart the processes of “keystone” if they are not running.
This test verifies the high availability of the “glance-api” service provided by OpenStack controller nodes. It kills the processes of OpenStack “glance-api” service on the selected controller node, then checks whether the “glance-api” service is still available, by creating image and deleting image, and checks whether the killed processes are recovered.
There is more than one controller node, which is providing the “glance-api” service for API end-point.
Denoted a controller node as Node1 in the following configuration.
The high availability of “glance-api” service is evaluated by monitoring service outage time, process outage time, and results of glance operations.
Service outage time is tested by continuously executing “openstack image list” command in loop and checking if the response of the command request is returned with no failure. When the response fails, the “glance-api” service is considered in outage. The time between the first response failure and the last response failure is considered as service outage time.
Process outage time is tested by checking the status of “glance-api” processes on the selected controller node. The time of “glance-api” processes being killed to the time of the “glance-api” processes being recovered is the process outage time. Process recovery is verified by checking the existence of “glance-api” processes.
The process outage time is less than 30s.
The service outage time is less than 5s.
The glance operations are carried out in above order and no errors occur.
A negative result will be generated if the above is not met in completion.
Restart the processes of “glance-api” if they are not running.
Delete image with “openstack image delete test-image”.
This test verifies the high availability of the “cinder-api” service provided by OpenStack controller nodes. It kills the processes of OpenStack “cinder-api” service on the selected controller node, then checks whether the “cinder-api” service is still available by executing command “openstack volume list” and whether the killed processes are recovered.
There is more than one controller node, which is providing the “cinder-api” service for API end-point.
Denoted a controller node as Node1 in the following configuration.
The high availability of “cinder-api” service is evaluated by monitoring service outage time and process outage time
Service outage time is tested by continuously executing “openstack volume list” command in loop and checking if the response of the command request is returned with no failure. When the response fails, the “cinder-api” service is considered in outage. The time between the first response failure and the last response failure is considered as service outage time.
Process outage time is tested by checking the status of “cinder-api” processes on the selected controller node. The time of “cinder-api” processes being killed to the time of the “cinder-api” processes being recovered is the process outage time. Process recovery is verified by checking the existence of “cinder-api” processes.
The process outage time is less than 30s.
The service outage time is less than 5s.
The cinder operations are carried out in above order and no errors occur.
A negative result will be generated if the above is not met in completion.
Restart the processes of “cinder-api” if they are not running.
This test verifies the availability of services when one of the controller node suffers from heavy CPU overload. When the CPU usage of the specified controller node is up to 100%, which breaks down the OpenStack services on this node, the Openstack services should continue to be available. This test case stresses the CPU usage of a specific controller node to 100%, then checks whether all services provided by the SUT are still available with the monitor tools.
There is more than one controller node, which is providing the “cinder-api”, “neutron-server”, “glance-api” and “keystone” services for API end-point.
Denoted a controller node as Node1 in the following configuration.
The high availability of related OpenStack service is evaluated by monitoring service outage time
Service outage time is tested by continuously executing “openstack router list”, “openstack stack list”, “openstack volume list”, “openstack image list” commands in loop and checking if the response of the command request is returned with no failure. When the response fails, the related service is considered in outage. The time between the first response failure and the last response failure is considered as service outage time.
To evaluate the high availability of target OpenStack service under heavy CPU load, the test case will first get the number of logical CPU cores on the target controller node by shell command, then use the number to execute ‘dd’ command to continuously copy from /dev/zero and output to /dev/null in loop. The ‘dd’ operation only uses CPU, no I/O operation, which is ideal for stressing the CPU usage.
Since the ‘dd’ command is continuously executed and the CPU usage rate is stressed to 100%, the scheduler will schedule each ‘dd’ command to be processed on a different logical CPU core. Eventually to achieve all logical CPU cores usage rate to 100%.
All the service outage times are less than 5s.
A negative result will be generated if the above is not met in completion.
No impact on the SUT.
This test verifies the high availability of control node. When the disk I/O of the specific disk is overload, which breaks down the OpenStack services on this node, the read and write services should continue to be available. This test case blocks the disk I/O of the specific controller node, then checks whether the services that need to read or write the disk of the controller node are available with some monitor tools.
There is more than one controller node. Denoted a controller node as Node1 in the following configuration. The controller node has at least 20GB free disk space.
The high availability of nova service is evaluated by monitoring service outage time
Service availability is tested by continuously executing “openstack flavor list” command in loop and checking if the response of the command request is returned with no failure. When the response fails, the related service is considered in outage.
To evaluate the high availability of target OpenStack service under heavy I/O load, the test case will execute shell command on the selected controller node to continuously writing 8kb blocks to /test.dbf
The service outage time is less than 5s.
The nova operations are carried out in above order and no errors occur.
A negative result will be generated if the above is not met in completion.
Delete flavor with “openstack flavor delete test-001”.
This test verifies the high availability of “haproxy” service. When the “haproxy” service of a specified controller node is killed, whether “haproxy” service on other controller nodes will work, and whether the controller node will restart the “haproxy” service are checked. This test case kills the processes of “haproxy” service on the selected controller node, then checks whether the request of the related OpenStack command is processed with no failure and whether the killed processes are recovered.
There is more than one controller node, which is providing the “haproxy” service for rest-api.
Denoted as Node1 in the following configuration.
The high availability of “haproxy” service is evaluated by monitoring service outage time and process outage time
Service outage time is tested by continuously executing “openstack image list” command in loop and checking if the response of the command request is returned with no failure. When the response fails, the “haproxy” service is considered in outage. The time between the first response failure and the last response failure is considered as service outage time.
Process outage time is tested by checking the status of processes of “haproxy” service on the selected controller node. The time of those processes being killed to the time of those processes being recovered is the process outage time. Process recovery is verified by checking the existence of processes of “haproxy” service.
The process outage time is less than 30s.
The service outage time is less than 5s.
A negative result will be generated if the above is not met in completion.
Restart the processes of “haproxy” if they are not running.
This test case verifies that the high availability of the data base instances used by OpenStack (mysql) on control node is working properly. Specifically, this test case kills the processes of database service on a selected control node, then checks whether the request of the related OpenStack command is OK and the killed processes are recovered.
In this test case, an attacker called “kill-process” is needed. This attacker includes three parameters: fault_type, process_name and host.
The purpose of this attacker is to kill any process with a specific process name which is run on the host node. In case that multiple processes use the same name on the host node, all of them are going to be killed by this attacker.
In order to verify this service two different monitors are going to be used.
As first monitor is used a OpenStack command and acts as watcher for database connection of different OpenStack components.
For second monitor is used a process monitor and the main purpose is to watch whether the database processes on the host node are killed properly.
Therefore, in this test case, there are two metrics:
Check whether the SLA is passed: - The process outage time is less than 30s. - The service outage time is less than 5s.
The database operations are carried out in above order and no errors occur.
A negative result will be generated if the above is not met in completion.
The database service is up and running again. If the database service did not recover successfully by itself, the test explicitly restarts the database service.
This test case will verify the high availability of the messaging queue service (RabbitMQ) that supports OpenStack on controller node. This test case expects that message bus service implementation is RabbitMQ. If the SUT uses a different message bus implementations, the Dovetail configuration (pod.yaml) can be changed accordingly. When messaging queue service (which is active) of a specified controller node is killed, the test case will check whether messaging queue services (which are standby) on other controller nodes will be switched active, and whether the cluster manager on the attacked controller node will restart the stopped messaging queue.
There is more than one controller node, which is providing the “messaging queue” service. Denoted as Node1 in the following configuration.
The high availability of “messaging queue” service is evaluated by monitoring service outage time and process outage time.
Service outage time is tested by continuously executing “openstack image list”, “openstack network list”, “openstack volume list” and “openstack stack list” commands in loop and checking if the responses of the command requests are returned with no failure. When the response fails, the “messaging queue” service is considered in outage. The time between the first response failure and the last response failure is considered as service outage time.
Process outage time is tested by checking the status of processes of “messaging queue” service on the selected controller node. The time of those processes being killed to the time of those processes being recovered is the process outage time. Process recovery is verified by checking the existence of processes of “messaging queue” service.
Test passes if the process outage time is no more than 30s and the service outage time is no more than 5s.
A negative result will be generated if the above is not met in completion.
Restart the processes of “messaging queue” if they are not running.
yardstick.ha.controller_restart
Yardstick test case: opnfv_yardstick_tc025.yaml
This test case verifies that the high availability of controller node is working properly. Specifically, this test case shutdowns a specified controller node via IPMI, then checks whether all services provided by the controller node are OK with some monitor tools.
In this test case, an attacker called “host-shutdown” is needed. This attacker includes two parameters: fault_type and host.
The purpose of this attacker is to shutdown a controller and check whether the services are handled by this controller are still working normally.
In order to verify this service one monitor is going to be used.
This monitor is using an OpenStack command and the respective command name of the OpenStack component that we want to verify that the respective service is still running normally.
In this test case, there is one metric: 1)service_outage_time: which indicates the maximum outage time (seconds) of the specified OpenStack command request.
Check whether the SLA is passed: - The process outage time is less than 30s. - The service outage time is less than 5s.
The controller operations are carried out in above order and no errors occur.
A negative result will be generated if the above is not met in completion.
The controller has been restarted
yardstick.ha.neutron_l3_agent
Yardstick test case: opnfv_yardstick_tc058.yaml
This test case will verify the high availability of virtual routers(L3 agent) on controller node. When a virtual router service on a specified controller node is shut down, this test case will check whether the network of virtual machines will be affected, and whether the attacked virtual router service will be recovered.
There is more than one controller node, which is providing the Neutron API extension called “neutron-l3-agent” virtual router service API.
Denoted as Node1 in the following configuration.
The high availability of “neutrol-l3-agent” virtual router service is evaluated by monitoring service outage time and process outage time.
Service outage is tested using ping to virtual machines. Ping tests that the network routing of virtual machines is ok. When the response fails, the virtual router service is considered in outage. The time between the first response failure and the last response failure is considered as service outage time.
Process outage time is tested by checking the status of processes of “neutron-l3-agent” service on the selected controller node. The time of those processes being killed to the time of those processes being recovered is the process outage time.
Process recovery is verified by checking the existence of processes of “neutron-l3-agent” service.
Check whether the SLA is passed: - The process outage time is less than 30s. - The service outage time is less than 5s.
A negative result will be generated if the above is not met in completion.
Delete image with “openstack image delete neutron-l3-agent_ha_image”.
Delete flavor with “openstack flavor delete neutron-l3-agent_ha_flavor”.
This test area evaluates the ability of a system under test to support the role-based access control (RBAC) implementation. The test area specifically validates services image and networking.
The system under test is assumed to be the NFVI and VIM deployed on a Pharos compliant infrastructure.
The test area is structured in individual tests as listed below. Each test case is able to run independently, i.e. irrelevant of the state created by a previous test. For detailed information on the individual steps and assertions performed by the tests, review the Python source code accessible via the following links.
Image basic RBAC test:
These tests cover the RBAC tests of image basic operations.
Implementation: BasicOperationsImagesRbacTest
Image namespaces RBAC test:
These tests cover the RBAC tests of image namespaces.
Implementation: ImageNamespacesRbacTest
Image namespaces objects RBAC test:
These tests cover the RBAC tests of image namespaces objects.
Implementation: ImageNamespacesObjectsRbacTest
Image namespaces property RBAC test:
These tests cover the RBAC tests of image namespaces property.
Implementation: NamespacesPropertyRbacTest
Image namespaces tags RBAC test:
These tests cover the RBAC tests of image namespaces tags.
Implementation: NamespaceTagsRbacTest
Image resource types RBAC test:
These tests cover the RBAC tests of image resource types.
Implementation: ImageResourceTypesRbacTest
Image member RBAC test:
These tests cover the RBAC tests of image member.
Implementation: ImagesMemberRbacTest
Network agents RBAC test:
These tests cover the RBAC tests of network agents.
Implementation: AgentsRbacTest and DHCPAgentSchedulersRbacTest.
Network floating ips RBAC test:
These tests cover the RBAC tests of network floating ips.
Implementation: FloatingIpsRbacTest
Network basic RBAC test:
These tests cover the RBAC tests of network basic operations.
Implementation: NetworksRbacTest
Network ports RBAC test:
These tests cover the RBAC tests of network ports.
Implementation: PortsRbacTest
Network routers RBAC test:
These tests cover the RBAC tests of network routers.
Implementation: RouterRbacTest
Network security groups RBAC test:
These tests cover the RBAC tests of network security groups.
Implementation: SecGroupRbacTest
Network service providers RBAC test:
These tests cover the RBAC tests of network service providers.
Implementation: ServiceProvidersRbacTest
Network subnetpools RBAC test:
These tests cover the RBAC tests of network subnetpools.
Implementation: SubnetPoolsRbacTest
Network subnets RBAC test:
These tests cover the RBAC tests of network subnets.
Implementation: SubnetsRbacTest
The SNAPS smoke test case contains tests that setup and destroy environments with VMs with and without Floating IPs with a newly created user and project.
This smoke test executes the Python Tests included with the SNAPS libraries that exercise many of the OpenStack APIs within Keystone, Glance, Neutron, and Nova.
The SUT is assumed to be the NFVi and VIM in operation on a Pharos compliant infrastructure.
The test area is structured in individual tests as listed below. For detailed information on the individual steps and assertions performed by the tests, review the Python source code accessible via the following links:
Dynamic creation of User/Project objects to be leveraged for the integration tests:
Floating IP and Ansible provisioning:
The stress test involves testing and verifying the ability of the SUT to withstand stress and other challenging factors. Main purpose behind the testing is to make sure the SUT is able to absorb failures while providing an acceptable level of service.
This test area references the following specifications, definitions and reviews:
The following terms and abbreviations are used in conjunction with this test area
The system under test is assumed to be the NFVI and VIM in operation on a Pharos compliant infrastructure.
According to the testing goals stated in the test scope section, preceding test will not affect the subsequent test as long as the SUT is able to sustain the given stress while providing an acceptable level of service. Any FAIL result from a single test case will cause the SUT failing the whole test.
dovetail.stress.ping
This test case verifies the ability of the SUT concurrently setting up VM pairs for different tenants (through different OpenStack related components) and providing acceptable capacity under stressful conditions. The connectivity between VMs in a VM pair for a tenant is validated through Ping test. A life-cycle event in this test case is particularly referred to a VM pair life-cycle consisting of spawning, pinging and destroying.
Validating capacity of the SUT based on life-cycle ping test generally involves 2 subtests which provides secondary validation for the SUT furnishing users with reliable capacity without being crushed.
Let N1, N2, N3 and P1 be certain preset numbers, respectively. In subtest 1, the SUT concurrently setting up N1 VM pairs with each VM pair belonging to a different tenant. Then VM1 in a VM pair pings VM2 for P1 times with P1 packets. The connectivity could be validated iff VM1 successfully pings VM2 with these P1 packets. Subtest 1 is finished iff all the concurrent (N1) requests for creating VM pairs are fulfilled with returned values that indicate the statuses of the VM pairs creations.
Subtest 2 is executed after subtest 1 as secondary validation of the capacity. It follows the same workflow as subtest 1 does to set up N2 VM pairs.
Assume S1 and S2 be the numbers of VM pairs that are successfully created in subtest 1 and subtest 2, respectively. If min(S1,S2)>=N3, then the SUT is considered as PASS. Otherwise, we denote the SUT with FAIL.
Note that for subtest 1, if the number of successfully created VM pairs, i.e., S1, is smaller than N3. Subtest 2 will not be executed and SUT will be marked with FAIL.
Typical setting of (N1, N2, N3, P1) is (5, 5, 5, 10). The reference setting above is acquired based on the results from OPNFV CI jobs and testing over commercial products.
The connectivity within a VM pair is validated iff:
The SUT is considered passing the test iff:
Note that after each subtest, the program will check if the successfully created number of VM pairs is smaller than N3. If true, the program will return and the SUT will be marked with FAIL. Then the passing criteria is equal to the equation above. When subtest 1 returns, S2 here is denoted by NaN.
N/A
The Tempest Compute test area evaluates the ability of the System Under Test (SUT) to support dynamic network runtime operations through the life of a VNF. The tests in this test area will evaluate IPv4 network runtime operations functionality.
These runtime operations includes:
The system under test is assumed to be the NFVi and VIM in operation on a Pharos compliant infrastructure.
The test area is structured in individual tests as listed below. For detailed information on the individual steps and assertions performed by the tests, review the Python source code accessible via the following links:
All these test cases are included in the test case dovetail.tempest.compute of OVP test suite.
The test area is structured in individual tests as listed below. For detailed information on the individual steps and assertions performed by the tests, review the Python source code accessible via the following links:
The Tempest Identity v3 test area evaluates the ability of the System Under Test (SUT) to create, list, delete and verify users through the life of a VNF. The tests in this test area will evaluate IPv4 network runtime operations functionality.
These runtime operations may include that create, list, verify and delete:
The system under test is assumed to be the NFVi and VIM in operation on a Pharos compliant infrastructure.
The test area is structured in individual tests as listed below. For detailed information on the individual steps and assertions performed by the tests, review the Python source code accessible via the following links:
All these test cases are included in the test case dovetail.tempest.identity_v3 of OVP test suite.
The Tempest Image test area tests the basic operations of Images of the System Under Test (SUT) through the life of a VNF. The tests in this test area will evaluate IPv4 network runtime operations functionality.
The system under test is assumed to be the NFVi and VIM in operation on a Pharos compliant infrastructure.
The test area is structured in individual tests as listed below. For detailed information on the individual steps and assertions performed by the tests, review the Python source code accessible via the following links:
All these test cases are included in the test case dovetail.tempest.image of OVP test suite.
The IPv6 test area will evaluate the ability for a SUT to support IPv6 Tenant Network features and functionality. The tests in this test area will evaluate,
The following terms and abbreviations are used in conjunction with this test area
The system under test is assumed to be the NFVI and VIM deployed with a Pharos compliant infrastructure.
The test area is structured based on network, port and subnet operations. Each test case is able to run independently, i.e. irrelevant of the state created by a previous test.
Networks: https://developer.openstack.org/api-ref/networking/v2/index.html#networks
Subnets: https://developer.openstack.org/api-ref/networking/v2/index.html#subnets
Routers and interface: https://developer.openstack.org/api-ref/networking/v2/index.html#routers-routers
Ports: https://developer.openstack.org/api-ref/networking/v2/index.html#ports
Security groups: https://developer.openstack.org/api-ref/networking/v2/index.html#security-groups-security-groups
Security groups rules: https://developer.openstack.org/api-ref/networking/v2/index.html#security-group-rules-security-group-rules
Servers: https://developer.openstack.org/api-ref/compute/
All IPv6 api and scenario test cases addressed in OVP are covered in the following test specification documents.
dovetail.tempest.ipv6_api.bulk_network_subnet_port_create_delete
This test case evaluates the SUT API ability of creating and deleting multiple networks, IPv6 subnets, ports in one request, the reference is,
tempest.api.network.test_networks.BulkNetworkOpsIpV6Test.test_bulk_create_delete_network tempest.api.network.test_networks.BulkNetworkOpsIpV6Test.test_bulk_create_delete_subnet tempest.api.network.test_networks.BulkNetworkOpsIpV6Test.test_bulk_create_delete_port
None
This test evaluates the ability to use bulk create commands to create networks, IPv6 subnets and ports on the SUT API. Specifically it verifies that:
N/A
dovetail.tempest.ipv6_api.network_subnet_create_update_delete
This test case evaluates the SUT API ability of creating, updating, deleting network and IPv6 subnet with the network, the reference is
tempest.api.network.test_networks.NetworksIpV6Test.test_create_update_delete_network_subnet
None
This test evaluates the ability to create, update, delete network, IPv6 subnet on the SUT API. Specifically it verifies that:
None
dovetail.tempest.ipv6_api.external_network_visibility
This test case verifies user can see external networks but not subnets, the reference is,
tempest.api.network.test_networks.NetworksIpV6Test.test_external_network_visibility
This test evaluates the ability to use list commands to list external networks, pre-configured public network. Specifically it verifies that:
None
dovetail.tempest.ipv6_api.network_subnet_list
This test case evaluates the SUT API ability of listing netowrks, subnets after creating a network and an IPv6 subnet, the reference is
tempest.api.network.test_networks.NetworksIpV6Test.test_list_networks tempest.api.network.test_networks.NetworksIpV6Test.test_list_subnets
None
This test evaluates the ability to use create commands to create network, IPv6 subnet, list commands to list the created networks, IPv6 subnet on the SUT API. Specifically it verifies that:
None
dovetail.tempest.ipv6_api.network_subnet_show
This test case evaluates the SUT API ability of showing the network, subnet details, the reference is,
tempest.api.network.test_networks.NetworksIpV6Test.test_show_network tempest.api.network.test_networks.NetworksIpV6Test.test_show_subnet
None
This test evaluates the ability to use create commands to create network, IPv6 subnet and show commands to show network, IPv6 subnet details on the SUT API. Specifically it verifies that:
None
dovetail.tempest.ipv6_api.port_create_in_allocation_pool
This test case evaluates the SUT API ability of creating an IPv6 subnet within allowed IPv6 address allocation pool and creating a port whose address is in the range of the pool, the reference is,
tempest.api.network.test_ports.PortsIpV6TestJSON.test_create_port_in_allowed_allocation_pools
There should be an IPv6 CIDR configuration, which prefixlen is less than 126.
This test evaluates the ability to use create commands to create an IPv6 subnet within allowed IPv6 address allocation pool and create a port whose address is in the range of the pool. Specifically it verifies that:
None
dovetail.tempest.ipv6_api.port_create_empty_security_group
This test case evaluates the SUT API ability of creating port with empty security group, the reference is,
tempest.api.network.test_ports.PortsIpV6TestJSON.test_create_port_with_no_securitygroups
None
This test evaluates the ability to use create commands to create port with empty security group of the SUT API. Specifically it verifies that:
None
dovetail.tempest.ipv6_api.port_create_update_delete
This test case evaluates the SUT API ability of creating, updating, deleting IPv6 port, the reference is,
tempest.api.network.test_ports.PortsIpV6TestJSON.test_create_update_delete_port
None
This test evaluates the ability to use create/update/delete commands to create/update/delete port of the SUT API. Specifically it verifies that:
None
dovetail.tempest.ipv6_api.port_list
This test case evaluates the SUT ability of creating a port on a network and finding the port in the all ports list, the reference is,
tempest.api.network.test_ports.PortsIpV6TestJSON.test_list_ports
None
This test evaluates the ability to use list commands to list the networks and ports on the SUT API. Specifically it verifies that:
None
dovetail.tempest.ipv6_api.port_show_details
This test case evaluates the SUT ability of showing the port details, the values in the details should be equal to the values to create the port, the reference is,
tempest.api.network.test_ports.PortsIpV6TestJSON.test_show_port
None
This test evaluates the ability to use show commands to show port details on the SUT API. Specifically it verifies that:
None
dovetail.tempest.ipv6_api.router_add_multiple_interface
This test case evaluates the SUT ability of adding multiple interface to a router, the reference is,
tempest.api.network.test_routers.RoutersIpV6Test.test_add_multiple_router_interfaces
None
This test evaluates the ability to use bulk create commands to create networks, IPv6 subnets and ports on the SUT API. Specifically it verifies that:
None
dovetail.tempest.ipv6_api.router_interface_add_remove_with_port
This test case evaluates the SUT abiltiy of adding, removing router interface to a port, the subnet_id and port_id of the interface will be checked, the port’s device_id will be checked if equals to the router_id or not. The reference is,
tempest.api.network.test_routers.RoutersIpV6Test.test_add_remove_router_interface_with_port_id
None
This test evaluates the ability to use add/remove commands to add/remove router interface to the port, show commands to show port details on the SUT API. Specifically it verifies that:
None
dovetail.tempest.ipv6_api.router_interface_add_remove
This test case evaluates the SUT API ability of adding and removing a router interface with the IPv6 subnet id, the reference is
tempest.api.network.test_routers.RoutersIpV6Test.test_add_remove_router_interface_with_subnet_id
None
This test evaluates the ability to add and remove router interface with the subnet id on the SUT API. Specifically it verifies that:
None
dovetail.tempest.ipv6_api.router_create_show_list_update_delete
This test case evaluates the SUT API ability of creating, showing, listing, updating and deleting routers, the reference is
tempest.api.network.test_routers.RoutersIpV6Test.test_create_show_list_update_delete_router
There should exist an OpenStack external network.
This test evaluates the ability to create, show, list, update and delete router on the SUT API. Specifically it verifies that:
None
dovetail.tempest.ipv6_api.security_group_create_list_update_show_delete
This test case evaluates the SUT API ability of creating, listing, updating, showing and deleting security groups, the reference is
tempest.api.network.test_security_groups.SecGroupIPv6Test.test_create_list_update_show_delete_security_group
None
This test evaluates the ability to create list, update, show and delete security group on the SUT API. Specifically it verifies that:
None
dovetail.tempest.ipv6_api.security_group_rule_create_show_delete
This test case evaluates the SUT API ability of creating, showing, listing and deleting security group rules, the reference is
tempest.api.network.test_security_groups.SecGroupIPv6Test.test_create_show_delete_security_group_rule
None
This test evaluates the ability to create, show, list and delete security group rules on the SUT API. Specifically it verifies that:
None
dovetail.tempest.ipv6_api.security_group_list
This test case evaluates the SUT API ability of listing security groups, the reference is
tempest.api.network.test_security_groups.SecGroupIPv6Test.test_list_security_groups
There should exist a default security group.
This test evaluates the ability to list security groups on the SUT API. Specifically it verifies that:
None
dovetail.tempest.ipv6_scenario.dhcpv6_stateless
This test case evaluates IPv6 address assignment in ipv6_ra_mode ‘dhcpv6_stateless’ and ipv6_address_mode ‘dhcpv6_stateless’. In this case, guest instance obtains IPv6 address from OpenStack managed radvd using SLAAC and optional info from dnsmasq using DHCPv6 stateless. This test case then verifies the ping6 available VM can ping the other VM’s v4 and v6 addresses as well as the v6 subnet’s gateway ip in the same network, the reference is
tempest.scenario.test_network_v6.TestGettingAddress.test_dhcp6_stateless_from_os
There should exist a public router or a public network.
This test evaluates the ability to assign IPv6 addresses in ipv6_ra_mode ‘dhcpv6_stateless’ and ipv6_address_mode ‘dhcpv6_stateless’, and verify the ping6 available VM can ping the other VM’s v4 and v6 addresses as well as the v6 subnet’s gateway ip in the same network. Specifically it verifies that:
None
dovetail.tempest.ipv6_scenario.dualnet_dhcpv6_stateless
This test case evaluates IPv6 address assignment in ipv6_ra_mode ‘dhcpv6_stateless’ and ipv6_address_mode ‘dhcpv6_stateless’. In this case, guest instance obtains IPv6 address from OpenStack managed radvd using SLAAC and optional info from dnsmasq using DHCPv6 stateless. This test case then verifies the ping6 available VM can ping the other VM’s v4 address in one network and v6 address in another network as well as the v6 subnet’s gateway ip, the reference is
tempest.scenario.test_network_v6.TestGettingAddress.test_dualnet_dhcp6_stateless_from_os
There should exists a public router or a public network.
This test evaluates the ability to assign IPv6 addresses in ipv6_ra_mode ‘dhcpv6_stateless’ and ipv6_address_mode ‘dhcpv6_stateless’, and verify the ping6 available VM can ping the other VM’s v4 address in one network and v6 address in another network as well as the v6 subnet’s gateway ip. Specifically it verifies that:
None
dovetail.tempest.ipv6_scenario.multiple_prefixes_dhcpv6_stateless
This test case evaluates IPv6 address assignment in ipv6_ra_mode ‘dhcpv6_stateless’ and ipv6_address_mode ‘dhcpv6_stateless’. In this case, guest instance obtains IPv6 addresses from OpenStack managed radvd using SLAAC and optional info from dnsmasq using DHCPv6 stateless. This test case then verifies the ping6 available VM can ping the other VM’s one v4 address and two v6 addresses with different prefixes as well as the v6 subnets’ gateway ips in the same network, the reference is
tempest.scenario.test_network_v6.TestGettingAddress.test_multi_prefix_dhcpv6_stateless
There should exist a public router or a public network.
This test evaluates the ability to assign IPv6 addresses in ipv6_ra_mode ‘dhcpv6_stateless’ and ipv6_address_mode ‘dhcpv6_stateless’, and verify the ping6 available VM can ping the other VM’s v4 address and two v6 addresses with different prefixes as well as the v6 subnets’ gateway ips in the same network. Specifically it verifies that:
None
dovetail.tempest.ipv6_scenario.dualnet_multiple_prefixes_dhcpv6_stateless
This test case evaluates IPv6 address assignment in ipv6_ra_mode ‘dhcpv6_stateless’ and ipv6_address_mode ‘dhcpv6_stateless’. In this case, guest instance obtains IPv6 addresses from OpenStack managed radvd using SLAAC and optional info from dnsmasq using DHCPv6 stateless. This test case then verifies the ping6 available VM can ping the other VM’s v4 address in one network and two v6 addresses with different prefixes in another network as well as the v6 subnets’ gateway ips, the reference is
tempest.scenario.test_network_v6.TestGettingAddress.test_dualnet_multi_prefix_dhcpv6_stateless
There should exist a public router or a public network.
This test evaluates the ability to assign IPv6 addresses in ipv6_ra_mode ‘dhcpv6_stateless’ and ipv6_address_mode ‘dhcpv6_stateless’, and verify the ping6 available VM can ping the other VM’s v4 address in one network and two v6 addresses with different prefixes in another network as well as the v6 subnets’ gateway ips. Specifically it verifies that:
None
dovetail.tempest.ipv6_scenario.slaac
This test case evaluates IPv6 address assignment in ipv6_ra_mode ‘slaac’ and ipv6_address_mode ‘slaac’. In this case, guest instance obtains IPv6 address from OpenStack managed radvd using SLAAC. This test case then verifies the ping6 available VM can ping the other VM’s v4 and v6 addresses as well as the v6 subnet’s gateway ip in the same network, the reference is
tempest.scenario.test_network_v6.TestGettingAddress.test_slaac_from_os
There should exist a public router or a public network.
This test evaluates the ability to assign IPv6 addresses in ipv6_ra_mode ‘slaac’ and ipv6_address_mode ‘slaac’, and verify the ping6 available VM can ping the other VM’s v4 and v6 addresses as well as the v6 subnet’s gateway ip in the same network. Specifically it verifies that:
None
dovetail.tempest.ipv6_scenario.dualnet_slaac
This test case evaluates IPv6 address assignment in ipv6_ra_mode ‘slaac’ and ipv6_address_mode ‘slaac’. In this case, guest instance obtains IPv6 address from OpenStack managed radvd using SLAAC. This test case then verifies the ping6 available VM can ping the other VM’s v4 address in one network and v6 address in another network as well as the v6 subnet’s gateway ip, the reference is
tempest.scenario.test_network_v6.TestGettingAddress.test_dualnet_slaac_from_os
There should exist a public router or a public network.
This test evaluates the ability to assign IPv6 addresses in ipv6_ra_mode ‘slaac’ and ipv6_address_mode ‘slaac’, and verify the ping6 available VM can ping the other VM’s v4 address in one network and v6 address in another network as well as the v6 subnet’s gateway ip. Specifically it verifies that:
None
dovetail.tempest.ipv6_scenario.multiple_prefixes_slaac
This test case evaluates IPv6 address assignment in ipv6_ra_mode ‘slaac’ and ipv6_address_mode ‘slaac’. In this case, guest instance obtains IPv6 addresses from OpenStack managed radvd using SLAAC. This test case then verifies the ping6 available VM can ping the other VM’s one v4 address and two v6 addresses with different prefixes as well as the v6 subnets’ gateway ips in the same network, the reference is
tempest.scenario.test_network_v6.TestGettingAddress.test_multi_prefix_slaac
There should exists a public router or a public network.
This test evaluates the ability to assign IPv6 addresses in ipv6_ra_mode ‘slaac’ and ipv6_address_mode ‘slaac’, and verify the ping6 available VM can ping the other VM’s v4 address and two v6 addresses with different prefixes as well as the v6 subnets’ gateway ips in the same network. Specifically it verifies that:
None
dovetail.tempest.ipv6_scenario.dualnet_multiple_prefixes_slaac
This test case evaluates IPv6 address assignment in ipv6_ra_mode ‘slaac’ and ipv6_address_mode ‘slaac’. In this case, guest instance obtains IPv6 addresses from OpenStack managed radvd using SLAAC. This test case then verifies the ping6 available VM can ping the other VM’s v4 address in one network and two v6 addresses with different prefixes in another network as well as the v6 subnets’ gateway ips, the reference is
tempest.scenario.test_network_v6.TestGettingAddress.test_dualnet_multi_prefix_slaac
There should exist a public router or a public network.
This test evaluates the ability to assign IPv6 addresses in ipv6_ra_mode ‘slaac’ and ipv6_address_mode ‘slaac’, and verify the ping6 available VM can ping the other VM’s v4 address in one network and two v6 addresses with different prefixes in another network as well as the v6 subnets’ gateway ips. Specifically it verifies that:
None
The VM resource scheduling test area evaluates the ability of the system under test to support VM resource scheduling on multiple nodes. The tests in this test area will evaluate capabilities to schedule VM to multiple compute nodes directly with scheduler hints, and create server groups with policy affinity and anti-affinity.
The following terms and abbreviations are used in conjunction with this test area
The system under test is assumed to be the NFVi and VIM in operation on a Pharos compliant infrastructure.
The test area is structured based on server group operations and server operations on multiple nodes. Each test case is able to run independently, i.e. irrelevant of the state created by a previous test. Specifically, every test performs clean-up operations which return the system to the same state as before the test.
All these test cases are included in the test case dovetail.tempest.multi_node_scheduling of OVP test suite.
Security Groups: https://developer.openstack.org/api-ref/network/v2/index.html#security-groups-security-groups
Networks: https://developer.openstack.org/api-ref/networking/v2/index.html#networks
Routers and interface: https://developer.openstack.org/api-ref/networking/v2/index.html#routers-routers
Subnets: https://developer.openstack.org/api-ref/networking/v2/index.html#subnets
Servers: https://developer.openstack.org/api-ref/compute/
Ports: https://developer.openstack.org/api-ref/networking/v2/index.html#ports
Floating IPs: https://developer.openstack.org/api-ref/networking/v2/index.html#floating-ips-floatingips
Availability zone: https://developer.openstack.org/api-ref/compute/
tempest.scenario.test_server_multinode.TestServerMultinode.test_schedule_to_all_nodes
This test evaluates the functionality of VM resource scheduling. Specifically, the test verifies that:
In order to pass this test, all test assertions listed in the test execution above need to pass.
N/A
tempest.api.compute.servers.test_server_group.ServerGroupTestJSON.test_create_delete_multiple_server_groups_with_same_name_policy
None
This test evaluates the functionality of creating and deleting server groups with the same name and policy. Specifically, the test verifies that:
In order to pass this test, all test assertions listed in the test execution above need to pass.
N/A
tempest.api.compute.servers.test_server_group.ServerGroupTestJSON.test_create_delete_server_group_with_affinity_policy
None
This test evaluates the functionality of creating and deleting server group with affinity policy. Specifically, the test verifies that:
In order to pass this test, all test assertions listed in the test execution above need to pass.
N/A
tempest.api.compute.servers.test_server_group.ServerGroupTestJSON.test_create_delete_server_group_with_anti_affinity_policy
None
This test evaluates the functionality of creating and deleting server group with anti-affinity policy. Specifically, the test verifies that:
In order to pass this test, all test assertions listed in the test execution above need to pass.
N/A
tempest.api.compute.servers.test_server_group.ServerGroupTestJSON.test_list_server_groups
None
This test evaluates the functionality of listing server groups. Specifically, the test verifies that:
In order to pass this test, all test assertions listed in the test execution above need to pass.
N/A
tempest.api.compute.servers.test_server_group.ServerGroupTestJSON.test_show_server_group
None
This test evaluates the functionality of showing server group details. Specifically, the test verifies that:
In order to pass this test, all test assertions listed in the test execution above need to pass.
N/A
The Tempest Network API test area tests the basic operations of the System Under Test (SUT) through the life of a VNF. The tests in this test area will evaluate IPv4 network runtime operations functionality.
These runtime operations may include that create, list, verify or delete:
The system under test is assumed to be the NFVi and VIM in operation on a Pharos compliant infrastructure.
The test area is structured in individual tests as listed below. For detailed information on the individual steps and assertions performed by the tests, review the Python source code accessible via the following links:
All these test cases are included in the test case dovetail.tempest.network of OVP test suite.
The Tempest Network scenario test area evaluates the ability of the system under test to support dynamic network runtime operations through the life of a VNF (e.g. attach/detach, enable/disable, read stats). The tests in this test area will evaluate IPv4 network runtime operations functionality. These runtime operations includes hotpluging network interface, detaching floating-ip from VM, attaching floating-ip to VM, updating subnet’s DNS, updating VM instance port admin state and updating router admin state.
The following terms and abbreviations are used in conjunction with this test area
The system under test is assumed to be the NFVi and VIM in operation on a Pharos compliant infrastructure.
The test area is structured based on dynamic network runtime operations. Each test case is able to run independently, i.e. irrelevant of the state created by a previous test. Specifically, every test performs clean-up operations which return the system to the same state as before the test.
All these test cases are included in the test case dovetail.tempest.network_scenario of OVP test suite.
Security Groups: https://developer.openstack.org/api-ref/network/v2/index.html#security-groups-security-groups
Networks: https://developer.openstack.org/api-ref/networking/v2/index.html#networks
Routers and interface: https://developer.openstack.org/api-ref/networking/v2/index.html#routers-routers
Subnets: https://developer.openstack.org/api-ref/networking/v2/index.html#subnets
Servers: https://developer.openstack.org/api-ref/compute/
Ports: https://developer.openstack.org/api-ref/networking/v2/index.html#ports
Floating IPs: https://developer.openstack.org/api-ref/networking/v2/index.html#floating-ips-floatingips
tempest.scenario.test_network_basic_ops.TestNetworkBasicOps.test_network_basic_ops
This test evaluates the functionality of basic network operations. Specifically, the test verifies that:
In order to pass this test, all test assertions listed in the test execution above need to pass.
N/A
tempest.scenario.test_network_basic_ops.TestNetworkBasicOps.test_hotplug_nic
This test evaluates the functionality of adding network to an active VM. Specifically, the test verifies that:
In order to pass this test, all test assertions listed in the test execution above need to pass.
N/A
tempest.scenario.test_network_basic_ops.TestNetworkBasicOps.test_subnet_details
This test evaluates the functionality of updating subnet’s configurations. Specifically, the test verifies that:
In order to pass this test, all test assertions listed in the test execution above need to pass.
N/A
tempest.scenario.test_network_basic_ops.TestNetworkBasicOps.test_update_instance_port_admin_state
This test evaluates the VM public and project connectivity status by changing VM port admin_state_up to True & False. Specifically, the test verifies that:
In order to pass this test, all test assertions listed in the test execution above need to pass.
N/A
tempest.scenario.test_network_basic_ops.TestNetworkBasicOps.test_update_router_admin_state
This test evaluates the router public connectivity status by changing router admin_state_up to True & False. Specifically, the test verifies that:
In order to pass this test, all test assertions listed in the test execution above need to pass.
N/A
The security group and port security test area evaluates the ability of the system under test to support packet filtering by security group and port security. The tests in this test area will evaluate preventing MAC spoofing by port security, basic security group operations including testing cross/in tenant traffic, testing multiple security groups, using port security to disable security groups and updating security groups.
N/A
The following terms and abbreviations are used in conjunction with this test area
The system under test is assumed to be the NFVi and VIM in operation on a Pharos compliant infrastructure.
The test area is structured based on the basic operations of security group and port security. Each test case is able to run independently, i.e. irrelevant of the state created by a previous test. Specifically, every test performs clean-up operations which return the system to the same state as before the test.
All these test cases are included in the test case dovetail.tempest.network_security of OVP test suite.
Security Groups: https://developer.openstack.org/api-ref/network/v2/index.html#security-groups-security-groups
Networks: https://developer.openstack.org/api-ref/networking/v2/index.html#networks
Routers and interface: https://developer.openstack.org/api-ref/networking/v2/index.html#routers-routers
Subnets: https://developer.openstack.org/api-ref/networking/v2/index.html#subnets
Servers: https://developer.openstack.org/api-ref/compute/
Ports: https://developer.openstack.org/api-ref/networking/v2/index.html#ports
tempest.scenario.test_network_basic_ops.TestNetworkBasicOps.test_port_security_macspoofing_port
This test evaluates the ability to prevent MAC spoofing by using port security. Specifically, the test verifies that:
In order to pass this test, all test assertions listed in the test execution above need to pass.
N/A
tempest.scenario.test_security_groups_basic_ops.TestSecurityGroupsBasicOps.test_cross_tenant_traffic
This test evaluates the ability of the security group to filter packets cross tenant. Specifically, the test verifies that:
In order to pass this test, all test assertions listed in the test execution above need to pass.
N/A
tempest.scenario.test_security_groups_basic_ops.TestSecurityGroupsBasicOps.test_in_tenant_traffic
This test evaluates the ability of the security group to filter packets in one tenant. Specifically, the test verifies that:
In order to pass this test, all test assertions listed in the test execution above need to pass.
N/A
tempest.scenario.test_security_groups_basic_ops.TestSecurityGroupsBasicOps.test_multiple_security_groups
This test evaluates the ability of multiple security groups to filter packets. Specifically, the test verifies that:
In order to pass this test, all test assertions listed in the test execution above need to pass.
N/A
tempest.scenario.test_security_groups_basic_ops.TestSecurityGroupsBasicOps.test_port_security_disable_security_group
This test evaluates the ability of port security to disable security group. Specifically, the test verifies that:
In order to pass this test, all test assertions listed in the test execution above need to pass.
N/A
tempest.scenario.test_security_groups_basic_ops.TestSecurityGroupsBasicOps.test_port_update_new_security_group
This test evaluates the ability to update port with a new security group. Specifically, the test verifies that:
In order to pass this test, all test assertions listed in the test execution above need to pass.
N/A
The test cases documented here are the API test cases in the OpenStack Interop guideline 2017.09 as implemented by the RefStack client.
All OpenStack interop test cases addressed in OVP are covered in the following test specification documents.
The VIM compute operations test area evaluates the ability of the system under test to support VIM compute operations. The test cases documented here are the compute API test cases in the OpenStack Interop guideline 2017.09 as implemented by the RefStack client. These test cases will evaluate basic OpenStack (as a VIM) compute operations, including:
The following terms and abbreviations are used in conjunction with this test area
The system under test is assumed to be the NFVi and VIM deployed with a Pharos compliant infrastructure.
The test area is structured based on VIM compute API operations. Each test case is able to run independently, i.e. irrelevant of the state created by a previous test. Specifically, every test performs clean-up operations which return the system to the same state as before the test.
For brevity, the test cases in this test area are summarized together based on the operations they are testing.
All these test cases are included in the test case dovetail.tempest.osinterop of OVP test suite.
Servers: https://developer.openstack.org/api-ref/compute/
Block storage: https://developer.openstack.org/api-ref/block-storage
tempest.api.compute.images.test_images_oneserver.ImagesOneServerTestJSON.test_create_delete_image tempest.api.compute.images.test_images_oneserver.ImagesOneServerTestJSON.test_create_image_specify_multibyte_character_image_name
This test evaluates the Compute API ability of creating image from server, deleting image, creating server image with multi-byte character name. Specifically, the test verifies that:
In order to pass this test, all test assertions listed in the test execution above need to pass.
N/A
tempest.api.compute.servers.test_instance_actions.InstanceActionsTestJSON.test_get_instance_action tempest.api.compute.servers.test_instance_actions.InstanceActionsTestJSON.test_list_instance_actions
This test evaluates the Compute API ability of getting the action details of a provided server and getting the action list of a deleted server. Specifically, the test verifies that:
In order to pass this test, all test assertions listed in the test execution above need to pass.
N/A
tempest.api.compute.servers.test_servers.ServersTestJSON.test_create_specify_keypair
This test evaluates the Compute API ability of creating a keypair, listing keypairs and creating a server with a provided keypair. Specifically, the test verifies that:
In order to pass this test, all test assertions listed in the test execution above need to pass.
N/A
tempest.api.compute.test_versions.TestVersions.test_list_api_versions
This test evaluates the functionality of listing all available APIs to API consumers. Specifically, the test verifies that:
In order to pass this test, all test assertions listed in the test execution above need to pass.
N/A
tempest.api.compute.test_quotas.QuotasTestJSON.test_get_default_quotas tempest.api.compute.test_quotas.QuotasTestJSON.test_get_quotas
This test evaluates the functionality of getting quota set. Specifically, the test verifies that:
In order to pass this test, all test assertions listed in the test execution above need to pass.
N/A
This test case evaluates the Compute API ability of basic server operations, including:
The reference is,
tempest.api.compute.servers.test_servers.ServersTestJSON.test_create_server_with_admin_password tempest.api.compute.servers.test_servers.ServersTestJSON.test_create_with_existing_server_name tempest.api.compute.servers.test_servers_negative.ServersNegativeTestJSON.test_create_numeric_server_name tempest.api.compute.servers.test_servers_negative.ServersNegativeTestJSON.test_create_server_metadata_exceeds_length_limit tempest.api.compute.servers.test_servers_negative.ServersNegativeTestJSON.test_create_server_name_length_exceeds_256 tempest.api.compute.servers.test_servers_negative.ServersNegativeTestJSON.test_create_with_invalid_flavor tempest.api.compute.servers.test_servers_negative.ServersNegativeTestJSON.test_create_with_invalid_image tempest.api.compute.servers.test_servers_negative.ServersNegativeTestJSON.test_create_with_invalid_network_uuid tempest.api.compute.servers.test_servers_negative.ServersNegativeTestJSON.test_delete_server_pass_id_exceeding_length_limit tempest.api.compute.servers.test_servers_negative.ServersNegativeTestJSON.test_delete_server_pass_negative_id tempest.api.compute.servers.test_servers_negative.ServersNegativeTestJSON.test_get_non_existent_server tempest.api.compute.servers.test_create_server.ServersTestJSON.test_host_name_is_same_as_server_name tempest.api.compute.servers.test_create_server.ServersTestManualDisk.test_host_name_is_same_as_server_name tempest.api.compute.servers.test_servers_negative.ServersNegativeTestJSON.test_invalid_ip_v6_address tempest.api.compute.servers.test_create_server.ServersTestJSON.test_list_servers tempest.api.compute.servers.test_create_server.ServersTestJSON.test_list_servers_with_detail tempest.api.compute.servers.test_create_server.ServersTestManualDisk.test_list_servers tempest.api.compute.servers.test_create_server.ServersTestManualDisk.test_list_servers_with_detail tempest.api.compute.servers.test_list_server_filters.ListServerFiltersTestJSON.test_list_servers_detailed_filter_by_flavor tempest.api.compute.servers.test_list_server_filters.ListServerFiltersTestJSON.test_list_servers_detailed_filter_by_image tempest.api.compute.servers.test_list_server_filters.ListServerFiltersTestJSON.test_list_servers_detailed_filter_by_server_name tempest.api.compute.servers.test_list_server_filters.ListServerFiltersTestJSON.test_list_servers_detailed_filter_by_server_status tempest.api.compute.servers.test_list_server_filters.ListServerFiltersTestJSON.test_list_servers_detailed_limit_results tempest.api.compute.servers.test_list_server_filters.ListServerFiltersTestJSON.test_list_servers_filter_by_flavor tempest.api.compute.servers.test_list_server_filters.ListServerFiltersTestJSON.test_list_servers_filter_by_image tempest.api.compute.servers.test_list_server_filters.ListServerFiltersTestJSON.test_list_servers_filter_by_limit tempest.api.compute.servers.test_list_server_filters.ListServerFiltersTestJSON.test_list_servers_filter_by_server_name tempest.api.compute.servers.test_list_server_filters.ListServerFiltersTestJSON.test_list_servers_filter_by_active_status tempest.api.compute.servers.test_list_server_filters.ListServerFiltersTestJSON.test_list_servers_filtered_by_name_wildcard tempest.api.compute.servers.test_list_servers_negative.ListServersNegativeTestJSON.test_list_servers_by_changes_since_future_date tempest.api.compute.servers.test_list_servers_negative.ListServersNegativeTestJSON.test_list_servers_by_changes_since_invalid_date tempest.api.compute.servers.test_list_servers_negative.ListServersNegativeTestJSON.test_list_servers_by_limits_greater_than_actual_count tempest.api.compute.servers.test_list_servers_negative.ListServersNegativeTestJSON.test_list_servers_by_limits_pass_negative_value tempest.api.compute.servers.test_list_servers_negative.ListServersNegativeTestJSON.test_list_servers_by_limits_pass_string tempest.api.compute.servers.test_list_servers_negative.ListServersNegativeTestJSON.test_list_servers_by_non_existing_flavor tempest.api.compute.servers.test_list_servers_negative.ListServersNegativeTestJSON.test_list_servers_by_non_existing_image tempest.api.compute.servers.test_list_servers_negative.ListServersNegativeTestJSON.test_list_servers_by_non_existing_server_name tempest.api.compute.servers.test_list_servers_negative.ListServersNegativeTestJSON.test_list_servers_detail_server_is_deleted tempest.api.compute.servers.test_list_servers_negative.ListServersNegativeTestJSON.test_list_servers_status_non_existing tempest.api.compute.servers.test_list_servers_negative.ListServersNegativeTestJSON.test_list_servers_with_a_deleted_server tempest.api.compute.servers.test_server_actions.ServerActionsTestJSON.test_lock_unlock_server tempest.api.compute.servers.test_server_metadata.ServerMetadataTestJSON.test_delete_server_metadata_item tempest.api.compute.servers.test_server_metadata.ServerMetadataTestJSON.test_get_server_metadata_item tempest.api.compute.servers.test_server_metadata.ServerMetadataTestJSON.test_list_server_metadata tempest.api.compute.servers.test_server_metadata.ServerMetadataTestJSON.test_set_server_metadata tempest.api.compute.servers.test_server_metadata.ServerMetadataTestJSON.test_set_server_metadata_item tempest.api.compute.servers.test_server_metadata.ServerMetadataTestJSON.test_update_server_metadata tempest.api.compute.servers.test_servers_negative.ServersNegativeTestJSON.test_server_name_blank tempest.api.compute.servers.test_server_actions.ServerActionsTestJSON.test_reboot_server_hard tempest.api.compute.servers.test_servers_negative.ServersNegativeTestJSON.test_reboot_non_existent_server tempest.api.compute.servers.test_server_actions.ServerActionsTestJSON.test_rebuild_server tempest.api.compute.servers.test_servers_negative.ServersNegativeTestJSON.test_rebuild_deleted_server tempest.api.compute.servers.test_servers_negative.ServersNegativeTestJSON.test_rebuild_non_existent_server tempest.api.compute.servers.test_server_actions.ServerActionsTestJSON.test_stop_start_server tempest.api.compute.servers.test_servers_negative.ServersNegativeTestJSON.test_stop_non_existent_server tempest.api.compute.servers.test_servers.ServersTestJSON.test_update_access_server_address tempest.api.compute.servers.test_servers.ServersTestJSON.test_update_server_name tempest.api.compute.servers.test_servers_negative.ServersNegativeTestJSON.test_update_name_of_non_existent_server tempest.api.compute.servers.test_servers_negative.ServersNegativeTestJSON.test_update_server_name_length_exceeds_256 tempest.api.compute.servers.test_servers_negative.ServersNegativeTestJSON.test_update_server_set_empty_name tempest.api.compute.servers.test_create_server.ServersTestJSON.test_verify_created_server_vcpus tempest.api.compute.servers.test_create_server.ServersTestJSON.test_verify_server_details tempest.api.compute.servers.test_create_server.ServersTestManualDisk.test_verify_created_server_vcpus tempest.api.compute.servers.test_create_server.ServersTestManualDisk.test_verify_server_details tempest.api.compute.servers.test_delete_server.DeleteServersTestJSON.test_delete_active_server
This test evaluates the functionality of basic server operations. Specifically, the test verifies that:
In order to pass this test, all test assertions listed in the test execution above need to pass.
N/A
This test case evaluates the Compute API ability of attaching volume to a specific server and retrieve volume information, the reference is,
tempest.api.compute.volumes.test_attach_volume.AttachVolumeTestJSON.test_attach_detach_volume tempest.api.compute.volumes.test_attach_volume.AttachVolumeTestJSON.test_list_get_volume_attachments
This test evaluates the functionality of retrieving volume information. Specifically, the test verifies that:
In order to pass this test, all test assertions listed in the test execution above need to pass.
N/A
This test case evaluates the Compute API ability of listing availability zones with a non admin user, the reference is,
tempest.api.compute.servers.test_availability_zone.AZV2TestJSON.test_get_availability_zone_list_with_non_admin_user
This test evaluates the functionality of listing availability zones with a non admin user. Specifically, the test verifies that:
In order to pass this test, all test assertions listed in the test execution above need to pass.
N/A
This test case evaluates the Compute API ability of listing flavors, the reference is,
tempest.api.compute.flavors.test_flavors.FlavorsV2TestJSON.test_list_flavors tempest.api.compute.flavors.test_flavors.FlavorsV2TestJSON.test_list_flavors_with_detail
This test evaluates the functionality of listing flavors within the Compute API. Specifically, the test verifies that:
In order to pass this test, all test assertions listed in the test execution above need to pass.
N/A
The VIM identity test area evaluates the ability of the system under test to support VIM identity operations. The tests in this area will evaluate API discovery operations within the Identity v3 API, auth operations within the Identity API.
The following terms and abbreviations are used in conjunction with this test area
The system under test is assumed to be the NFVi and VIM in operation on an Pharos compliant infrastructure.
The test area is structured based on VIM identity operations. Each test case is able to run independently, i.e. irrelevant of the state created by a previous test.
All these test cases are included in the test case dovetail.tempest.osinterop of OVP test suite.
The VIM identity operations test cases are a part of the OpenStack interoperability tempest test cases. For Fraser based dovetail release, the OpenStack interoperability guidelines (version 2017.09) is adopted, which is valid for Mitaka, Newton, Ocata and Pike releases of Openstack.
tempest.api.identity.v3.test_api_discovery.TestApiDiscovery.test_api_version_resources tempest.api.identity.v3.test_api_discovery.TestApiDiscovery.test_api_media_types tempest.api.identity.v3.test_api_discovery.TestApiDiscovery.test_api_version_statuses
None
This test case passes if all test action steps execute successfully and all assertions are affirmed. If any test steps fails to execute successfully or any of the assertions is not met, the test case fails.
None
tempest.api.identity.v3.test_tokens.TokensV3Test.test_create_token
None
This test case passes if all test action steps execute successfully and all assertions are affirmed. If any test steps fails to execute successfully or any of the assertions is not met, the test case fails.
None
The VIM image test area evaluates the ability of the system under test to support VIM image operations. The test cases documented here are the Image API test cases in the Openstack Interop guideline 2017.09 as implemented by the Refstack client. These test cases will evaluate basic Openstack (as a VIM) image operations including image creation, image list, image update and image deletion capabilities using Glance v2 API.
The following terms and abbreviations are used in conjunction with this test area
The system under test is assumed to be the NFVi and VIM in operation on a Pharos compliant infrastructure.
The test area is structured based on VIM image operations. Each test case is able to run independently, i.e. irrelevant of the state created by a previous test.
For brevity, the test cases in this test area are summarized together based on the operations they are testing.
All these test cases are included in the test case dovetail.tempest.osinterop of OVP test suite.
Images: https://developer.openstack.org/api-ref/image/v2/
tempest.api.image.v2.test_images.ListUserImagesTest.test_get_image_schema tempest.api.image.v2.test_images.ListUserImagesTest.test_get_images_schema tempest.api.image.v2.test_images_negative.ImagesNegativeTest.test_get_delete_deleted_image tempest.api.image.v2.test_images_negative.ImagesNegativeTest.test_get_image_null_id tempest.api.image.v2.test_images_negative.ImagesNegativeTest.test_get_non_existent_image
Glance is available.
The first two test cases evaluate the ability to use Glance v2 API to show image and images schema. The latter three test cases evaluate the ability to use Glance v2 API to show images with a deleted image id, a null image id and a non-existing image id. Specifically it verifies that:
In order to pass this test, all test assertions listed in the test execution above need to pass.
None
tempest.api.image.v2.test_images.ListUserImagesTest.test_list_no_params
Glance is available.
This test case evaluates the ability to use Glance v2 API to list images. Specifically it verifies that:
In order to pass this test, all test assertions listed in the test execution above need to pass.
None
tempest.api.image.v2.test_images.ListUserImagesTest.test_list_images_param_container_format tempest.api.image.v2.test_images.ListUserImagesTest.test_list_images_param_disk_format tempest.api.image.v2.test_images.ListUserImagesTest.test_list_images_param_limit tempest.api.image.v2.test_images.ListUserImagesTest.test_list_images_param_min_max_size tempest.api.image.v2.test_images.ListUserImagesTest.test_list_images_param_size tempest.api.image.v2.test_images.ListUserImagesTest.test_list_images_param_status tempest.api.image.v2.test_images.ListUserImagesTest.test_list_images_param_visibility
Glance is available.
This test case evaluates the ability to use Glance v2 API to list images with different parameters. Specifically it verifies that:
In order to pass this test, all test assertions listed in the test execution above need to pass.
None
tempest.api.image.v2.test_images.BasicOperationsImagesTest.test_update_image tempest.api.image.v2.test_images_tags.ImagesTagsTest.test_update_delete_tags_for_image tempest.api.image.v2.test_images_tags_negative.ImagesTagsNegativeTest.test_update_tags_for_non_existing_image
Glance is available.
This test case evaluates the ability to use Glance v2 API to update images with different parameters. Specifically it verifies that:
In order to pass this test, all test assertions listed in the test execution above need to pass.
None
tempest.api.image.v2.test_images.BasicOperationsImagesTest.test_delete_image tempest.api.image.v2.test_images_negative.ImagesNegativeTest.test_delete_image_null_id tempest.api.image.v2.test_images_negative.ImagesNegativeTest.test_delete_non_existing_image tempest.api.image.v2.test_images_tags_negative.ImagesTagsNegativeTest.test_delete_non_existing_tag
Glance is available.
The first three test cases evaluate the ability to use Glance v2 API to delete images with an existing image id, a null image id and a non-existing image id. The last one evaluates the ability to use the API to delete a non-existing image tag. Specifically it verifies that:
In order to pass this test, all test assertions listed in the test execution above need to pass.
None
The VIM network test area evaluates the ability of the system under test to support VIM network operations. The test cases documented here are the network API test cases in the Openstack Interop guideline 2017.09 as implemented by the Refstack client. These test cases will evaluate basic Openstack (as a VIM) network operations including basic CRUD operations on L2 networks, L2 network ports and security groups.
The following terms and abbreviations are used in conjunction with this test area
The system under test is assumed to be the NFVi and VIM in operation on a Pharos compliant infrastructure.
The test area is structured based on VIM network operations. Each test case is able to run independently, i.e. irrelevant of the state created by a previous test. Specifically, every test performs clean-up operations which return the system to the same state as before the test.
For brevity, the test cases in this test area are summarized together based on the operations they are testing.
All these test cases are included in the test case dovetail.tempest.osinterop of OVP test suite.
Network: http://developer.openstack.org/api-ref/networking/v2/index.html
tempest.api.network.test_networks.NetworksTest.test_create_delete_subnet_with_allocation_pools tempest.api.network.test_networks.NetworksTest.test_create_delete_subnet_with_dhcp_enabled tempest.api.network.test_networks.NetworksTest.test_create_delete_subnet_with_gw tempest.api.network.test_networks.NetworksTest.test_create_delete_subnet_with_gw_and_allocation_pools tempest.api.network.test_networks.NetworksTest.test_create_delete_subnet_with_host_routes_and_dns_nameservers tempest.api.network.test_networks.NetworksTest.test_create_delete_subnet_without_gateway tempest.api.network.test_networks.NetworksTest.test_create_delete_subnet_all_attributes tempest.api.network.test_networks.NetworksTest.test_create_update_delete_network_subnet tempest.api.network.test_networks.NetworksTest.test_delete_network_with_subnet tempest.api.network.test_networks.NetworksTest.test_list_networks tempest.api.network.test_networks.NetworksTest.test_list_networks_fields tempest.api.network.test_networks.NetworksTest.test_list_subnets tempest.api.network.test_networks.NetworksTest.test_list_subnets_fields tempest.api.network.test_networks.NetworksTest.test_show_network tempest.api.network.test_networks.NetworksTest.test_show_network_fields tempest.api.network.test_networks.NetworksTest.test_show_subnet tempest.api.network.test_networks.NetworksTest.test_show_subnet_fields tempest.api.network.test_networks.NetworksTest.test_update_subnet_gw_dns_host_routes_dhcp tempest.api.network.test_ports.PortsTestJSON.test_create_bulk_port tempest.api.network.test_ports.PortsTestJSON.test_create_port_in_allowed_allocation_pools tempest.api.network.test_ports.PortsTestJSON.test_create_update_delete_port tempest.api.network.test_ports.PortsTestJSON.test_list_ports tempest.api.network.test_ports.PortsTestJSON.test_list_ports_fields tempest.api.network.test_ports.PortsTestJSON.test_show_port tempest.api.network.test_ports.PortsTestJSON.test_show_port_fields
Neutron is available.
These test cases evaluate the ability of basic CRUD operations on L2 networks and L2 network ports. Specifically it verifies that:
In order to pass this test, all test assertions listed in the test execution above need to pass.
N/A
tempest.api.network.test_security_groups.SecGroupTest.test_create_list_update_show_delete_security_group tempest.api.network.test_security_groups.SecGroupTest.test_create_security_group_rule_with_additional_args tempest.api.network.test_security_groups.SecGroupTest.test_create_security_group_rule_with_icmp_type_code tempest.api.network.test_security_groups.SecGroupTest.test_create_security_group_rule_with_protocol_integer_value tempest.api.network.test_security_groups.SecGroupTest.test_create_security_group_rule_with_remote_group_id tempest.api.network.test_security_groups.SecGroupTest.test_create_security_group_rule_with_remote_ip_prefix tempest.api.network.test_security_groups.SecGroupTest.test_create_show_delete_security_group_rule tempest.api.network.test_security_groups.SecGroupTest.test_list_security_groups tempest.api.network.test_security_groups_negative.NegativeSecGroupTest.test_create_additional_default_security_group_fails tempest.api.network.test_security_groups_negative.NegativeSecGroupTest.test_create_duplicate_security_group_rule_fails tempest.api.network.test_security_groups_negative.NegativeSecGroupTest.test_create_security_group_rule_with_bad_ethertype tempest.api.network.test_security_groups_negative.NegativeSecGroupTest.test_create_security_group_rule_with_bad_protocol tempest.api.network.test_security_groups_negative.NegativeSecGroupTest.test_create_security_group_rule_with_bad_remote_ip_prefix tempest.api.network.test_security_groups_negative.NegativeSecGroupTest.test_create_security_group_rule_with_invalid_ports tempest.api.network.test_security_groups_negative.NegativeSecGroupTest.test_create_security_group_rule_with_non_existent_remote_groupid tempest.api.network.test_security_groups_negative.NegativeSecGroupTest.test_create_security_group_rule_with_non_existent_security_group tempest.api.network.test_security_groups_negative.NegativeSecGroupTest.test_delete_non_existent_security_group tempest.api.network.test_security_groups_negative.NegativeSecGroupTest.test_show_non_existent_security_group tempest.api.network.test_security_groups_negative.NegativeSecGroupTest.test_show_non_existent_security_group_rule
Neutron is available.
These test cases evaluate the ability of Basic CRUD operations on security groups and security group rules. Specifically it verifies that:
In order to pass this test, all test assertions listed in the test execution above need to pass.
N/A
tempest.api.network.test_subnetpools_extensions.SubnetPoolsTestJSON.test_create_list_show_update_delete_subnetpools
Neutron is available.
These test cases evaluate the ability of Basic CRUD operations on subnetpools. Specifically it verifies that:
In order to pass this test, all test assertions listed in the test execution above need to pass.
N/A
The VIM volume operations test area evaluates the ability of the system under test to support VIM volume operations. The test cases documented here are the volume API test cases in the OpenStack Interop guideline 2017.09 as implemented by the RefStack client. These test cases will evaluate basic OpenStack (as a VIM) volume operations, including:
The following terms and abbreviations are used in conjunction with this test area
The system under test is assumed to be the NFVI and VIM deployed with a Pharos compliant infrastructure.
The test area is structured based on VIM volume API operations. Each test case is able to run independently, i.e. irrelevant of the state created by a previous test. Specifically, every test performs clean-up operations which return the system to the same state as before the test.
For brevity, the test cases in this test area are summarized together based on the operations they are testing.
All these test cases are included in the test case dovetail.tempest.osinterop of OVP test suite.
Block storage: https://developer.openstack.org/api-ref/block-storage
tempest.api.volume.test_volumes_actions.VolumesActionsTest.test_volume_upload
This test case evaluates the volume API ability of uploading images. Specifically, the test verifies that:
In order to pass this test, all test assertions listed in the test execution above need to pass.
N/A
tempest.api.volume.test_availability_zone.AvailabilityZoneTestJSON.test_get_availability_zone_list
This test case evaluates the volume API ability of listing availability zones. Specifically, the test verifies that:
In order to pass this test, all test assertions listed in the test execution above need to pass.
N/A
tempest.api.volume.test_volumes_get.VolumesGetTest.test_volume_create_get_update_delete_as_clone
This test case evaluates the volume API ability of creating a cloned volume from a source volume, getting cloned volume detail information and updating cloned volume attributes.
Specifically, the test verifies that:
In order to pass this test, all test assertions listed in the test execution above need to pass.
N/A
tempest.api.volume.test_volumes_actions.VolumesActionsTest.test_volume_bootable tempest.api.volume.test_volumes_get.VolumesGetTest.test_volume_create_get_update_delete_from_image
This test case evaluates the volume API ability of updating volume’s bootable flag and creating a bootable volume from an image, getting bootable volume detail information and updating bootable volume.
Specifically, the test verifies that:
In order to pass this test, all test assertions listed in the test execution above need to pass.
N/A
tempest.api.volume.test_volumes_get.VolumesGetTest.test_volume_create_get_update_delete tempest.api.volume.test_volumes_negative.VolumesNegativeTest.test_create_volume_with_invalid_size tempest.api.volume.test_volumes_negative.VolumesNegativeTest.test_create_volume_with_nonexistent_source_volid tempest.api.volume.test_volumes_negative.VolumesNegativeTest.test_create_volume_with_nonexistent_volume_type tempest.api.volume.test_volumes_negative.VolumesNegativeTest.test_create_volume_without_passing_size tempest.api.volume.test_volumes_negative.VolumesNegativeTest.test_create_volume_with_size_negative tempest.api.volume.test_volumes_negative.VolumesNegativeTest.test_create_volume_with_size_zero
This test case evaluates the volume API ability of creating a volume, getting volume detail information and updating volume, the reference is, Specifically, the test verifies that:
In order to pass this test, all test assertions listed in the test execution above need to pass.
N/A
tempest.api.volume.test_extensions.ExtensionsTestJSON.test_list_extensions
This test case evaluates the volume API ability of listing all existent volume service extensions.
In order to pass this test, all test assertions listed in the test execution above need to pass.
N/A
tempest.api.volume.test_volumes_negative.VolumesNegativeTest.test_get_invalid_volume_id tempest.api.volume.test_volumes_negative.VolumesNegativeTest.test_get_volume_without_passing_volume_id tempest.api.volume.test_volumes_negative.VolumesNegativeTest.test_volume_get_nonexistent_volume_id
This test case evaluates the volume API ability of getting volumes. Specifically, the test verifies that:
In order to pass this test, all test assertions listed in the test execution above need to pass.
N/A
tempest.api.volume.test_volumes_list.VolumesListTestJSON.test_volume_list tempest.api.volume.test_volumes_list.VolumesListTestJSON.test_volume_list_by_name tempest.api.volume.test_volumes_list.VolumesListTestJSON.test_volume_list_details_by_name tempest.api.volume.test_volumes_list.VolumesListTestJSON.test_volume_list_param_display_name_and_status tempest.api.volume.test_volumes_list.VolumesListTestJSON.test_volume_list_with_detail_param_display_name_and_status tempest.api.volume.test_volumes_list.VolumesListTestJSON.test_volume_list_with_detail_param_metadata tempest.api.volume.test_volumes_list.VolumesListTestJSON.test_volume_list_with_details tempest.api.volume.test_volumes_list.VolumesListTestJSON.test_volume_list_with_param_metadata tempest.api.volume.test_volumes_list.VolumesListTestJSON.test_volumes_list_by_availability_zone tempest.api.volume.test_volumes_list.VolumesListTestJSON.test_volumes_list_by_status tempest.api.volume.test_volumes_list.VolumesListTestJSON.test_volumes_list_details_by_availability_zone tempest.api.volume.test_volumes_list.VolumesListTestJSON.test_volumes_list_details_by_status tempest.api.volume.test_volumes_negative.VolumesNegativeTest.test_list_volumes_detail_with_invalid_status tempest.api.volume.test_volumes_negative.VolumesNegativeTest.test_list_volumes_detail_with_nonexistent_name tempest.api.volume.test_volumes_negative.VolumesNegativeTest.test_list_volumes_with_invalid_status tempest.api.volume.test_volumes_negative.VolumesNegativeTest.test_list_volumes_with_nonexistent_name tempest.api.volume.test_volumes_list.VolumesListTestJSON.test_volume_list_details_pagination tempest.api.volume.test_volumes_list.VolumesListTestJSON.test_volume_list_details_with_multiple_params tempest.api.volume.test_volumes_list.VolumesListTestJSON.test_volume_list_pagination
This test case evaluates the volume API ability of getting a list of volumes and filtering the volume list. Specifically, the test verifies that:
In order to pass this test, all test assertions listed in the test execution above need to pass.
N/A
tempest.api.volume.test_volume_metadata.VolumesMetadataTest.test_crud_volume_metadata tempest.api.volume.test_volume_metadata.VolumesMetadataTest.test_update_show_volume_metadata_item
This test case evaluates the volume API ability of creating metadata for a volume, getting the metadata of a volume, updating volume metadata and deleting a metadata item of a volume. Specifically, the test verifies that:
In order to pass this test, all test assertions listed in the test execution above need to pass.
N/A
tempest.api.volume.test_volumes_actions.VolumesActionsTest.test_volume_readonly_update
This test case evaluates the volume API ability of setting and updating volume read-only access mode. Specifically, the test verifies that:
In order to pass this test, all test assertions listed in the test execution above need to pass.
N/A
tempest.api.volume.test_volumes_actions.VolumesActionsTest.test_reserve_unreserve_volume tempest.api.volume.test_volumes_negative.VolumesNegativeTest.test_reserve_volume_with_negative_volume_status tempest.api.volume.test_volumes_negative.VolumesNegativeTest.test_reserve_volume_with_nonexistent_volume_id tempest.api.volume.test_volumes_negative.VolumesNegativeTest.test_unreserve_volume_with_nonexistent_volume_id
This test case evaluates the volume API ability of reserving and un-reserving volumes. Specifically, the test verifies that:
In order to pass this test, all test assertions listed in the test execution above need to pass.
N/A
tempest.api.volume.test_snapshot_metadata.SnapshotMetadataTestJSON.test_crud_snapshot_metadata tempest.api.volume.test_snapshot_metadata.SnapshotMetadataTestJSON.test_update_show_snapshot_metadata_item tempest.api.volume.test_volumes_negative.VolumesNegativeTest.test_create_volume_with_nonexistent_snapshot_id tempest.api.volume.test_volumes_negative.VolumesNegativeTest.test_delete_invalid_volume_id tempest.api.volume.test_volumes_negative.VolumesNegativeTest.test_delete_volume_without_passing_volume_id tempest.api.volume.test_volumes_negative.VolumesNegativeTest.test_volume_delete_nonexistent_volume_id tempest.api.volume.test_volumes_snapshots.VolumesSnapshotTestJSON.test_snapshot_create_get_list_update_delete tempest.api.volume.test_volumes_snapshots.VolumesSnapshotTestJSON.test_volume_from_snapshot tempest.api.volume.test_volumes_snapshots_list.VolumesSnapshotListTestJSON.test_snapshots_list_details_with_params tempest.api.volume.test_volumes_snapshots_list.VolumesSnapshotListTestJSON.test_snapshots_list_with_params tempest.api.volume.test_volumes_snapshots_negative.VolumesSnapshotNegativeTestJSON.test_create_snapshot_with_nonexistent_volume_id tempest.api.volume.test_volumes_snapshots_negative.VolumesSnapshotNegativeTestJSON.test_create_snapshot_without_passing_volume_id
This test case evaluates the volume API ability of managing snapshot and snapshot metadata. Specifically, the test verifies that:
In order to pass this test, all test assertions listed in the test execution above need to pass.
N/A
tempest.api.volume.test_volumes_negative.VolumesNegativeTest.test_update_volume_with_empty_volume_id tempest.api.volume.test_volumes_negative.VolumesNegativeTest.test_update_volume_with_invalid_volume_id tempest.api.volume.test_volumes_negative.VolumesNegativeTest.test_update_volume_with_nonexistent_volume_id
This test case evaluates the volume API ability of updating volume attributes. Specifically, the test verifies that:
In order to pass this test, all test assertions listed in the test execution above need to pass.
N/A
This test area evaluates the ability of a system under test to support Neutron trunk ports. The test area specifically validates port and sub-port API CRUD operations, by means of both positive and negative tests.
The system under test is assumed to be the NFVI and VIM deployed on a Pharos compliant infrastructure.
The test area is structured in individual tests as listed below. Each test case is able to run independently, i.e. irrelevant of the state created by a previous test. For detailed information on the individual steps and assertions performed by the tests, review the Python source code accessible via the following links:
Trunk port and sub-port CRUD operations:
These tests cover the CRUD (Create, Read, Update, Delete) life-cycle operations of trunk ports and subports.
Implementation: TrunkTestInheritJSONBase and TrunkTestJSON.
MTU-related operations:
These tests validate that trunk ports and subports can be created and added when specifying valid MTU sizes. These tests do not include negative tests covering invalid MTU sizes.
Implementation: TrunkTestMtusJSON
API for listing query results:
These tests verify that listing operations of trunk port objects work. This functionality is required for CLI and UI operations.
Implementation: TrunksSearchCriteriaTest
Query trunk port details:
These tests validate that all attributes of trunk port objects can be queried.
Implementation: TestTrunkDetailsJSON
Negative tests:
These group of tests comprise negative tests which verify that invalid operations are handled correctly by the system under test.
Implementation: TrunkTestNegative
Scenario tests (tests covering more than one functionality):
In contrast to the API tests above, these tests validate more than one specific API capability. Instead they verify that a simple scenario (example workflow) functions as intended. To this end, they boot up two VMs with trunk ports and sub ports and verify connectivity between those VMs.
Implementation: TrunkTest
The common virtual machine life cycle events test area evaluates the ability of the system under test to behave correctly after common virtual machine life cycle events. The tests in this test area will evaluate:
The following terms and abbreviations are used in conjunction with this test area
The system under test is assumed to be the NFVi and VIM in operation on a Pharos compliant infrastructure.
The test area is structured based on common virtual machine life cycle events. Each test case is able to run independently, i.e. irrelevant of the state created by a previous test. Specifically, every test performs clean-up operations which return the system to the same state as before the test.
All these test cases are included in the test case dovetail.tempest.vm_lifecycle of OVP test suite.
Block storage: https://developer.openstack.org/api-ref/block-storage
Security Groups: https://developer.openstack.org/api-ref/network/v2/index.html#security-groups-security-groups
Networks: https://developer.openstack.org/api-ref/networking/v2/index.html#networks
Routers and interface: https://developer.openstack.org/api-ref/networking/v2/index.html#routers-routers
Subnets: https://developer.openstack.org/api-ref/networking/v2/index.html#subnets
Servers: https://developer.openstack.org/api-ref/compute/
Ports: https://developer.openstack.org/api-ref/networking/v2/index.html#ports
Floating IPs: https://developer.openstack.org/api-ref/networking/v2/index.html#floating-ips-floatingips
Availability zone: https://developer.openstack.org/api-ref/compute/
tempest.scenario.test_minimum_basic.TestMinimumBasicScenario.test_minimum_basic_scenario
This test evaluates a minimum basic scenario. Specifically, the test verifies that:
In order to pass this test, all test assertions listed in the test execution above need to pass.
N/A
tempest.scenario.test_network_advanced_server_ops.TestNetworkAdvancedServerOps.test_server_connectivity_cold_migration
This test evaluates the ability to cold migrate VMs. Specifically, the test verifies that:
In order to pass this test, all test assertions listed in the test execution above need to pass.
N/A
tempest.scenario.test_network_advanced_server_ops.TestNetworkAdvancedServerOps.test_server_connectivity_pause_unpause
This test evaluates the ability to pause and unpause VMs. Specifically, the test verifies that:
In order to pass this test, all test assertions listed in the test execution above need to pass.
N/A
tempest.scenario.test_network_advanced_server_ops.TestNetworkAdvancedServerOps.test_server_connectivity_reboot
This test evaluates the ability to reboot servers. Specifically, the test verifies that:
In order to pass this test, all test assertions listed in the test execution above need to pass.
N/A
tempest.scenario.test_network_advanced_server_ops.TestNetworkAdvancedServerOps.test_server_connectivity_rebuild
This test evaluates the ability to rebuild servers. Specifically, the test verifies that:
In order to pass this test, all test assertions listed in the test execution above need to pass.
N/A
tempest.scenario.test_network_advanced_server_ops.TestNetworkAdvancedServerOps.test_server_connectivity_resize
This test evaluates the ability to resize servers. Specifically, the test verifies that:
In order to pass this test, all test assertions listed in the test execution above need to pass.
N/A
tempest.scenario.test_network_advanced_server_ops.TestNetworkAdvancedServerOps.test_server_connectivity_stop_start
This test evaluates the ability to stop and start servers. Specifically, the test verifies that:
In order to pass this test, all test assertions listed in the test execution above need to pass.
N/A
tempest.scenario.test_network_advanced_server_ops.TestNetworkAdvancedServerOps.test_server_connectivity_suspend_resume
This test evaluates the ability to suspend and resume servers. Specifically, the test verifies that:
In order to pass this test, all test assertions listed in the test execution above need to pass.
N/A
tempest.scenario.test_server_advanced_ops.TestServerAdvancedOps.test_server_sequence_suspend_resume
This test evaluates the ability to suspend and resume servers in sequence. Specifically, the test verifies that:
In order to pass this test, all test assertions listed in the test execution above need to pass.
N/A
tempest.scenario.test_server_advanced_ops.TestServerAdvancedOps.test_resize_volume_backed_server_confirm
This test evaluates the ability to resize volume backed servers. Specifically, the test verifies that:
In order to pass this test, all test assertions listed in the test execution above need to pass.
N/A
tempest.scenario.test_shelve_instance.TestShelveInstance.test_shelve_instance
This test evaluates the ability to shelve and unshelve servers. Specifically, the test verifies that:
In order to pass this test, all test assertions listed in the test execution above need to pass.
N/A
tempest.scenario.test_shelve_instance.TestShelveInstance.test_shelve_volume_backed_instance
This test evaluates the ability to shelve and unshelve volume backed servers. Specifically, the test verifies that:
In order to pass this test, all test assertions listed in the test execution above need to pass.
N/A
This test area evaluates the ability of a system under test to manage volumes.
The test area specifically validates the creation, the deletion and the attachment/detach volume operations. tests.
N/A
The system under test is assumed to be the NFVi and VIM in operation on a Pharos compliant infrastructure.
The test area is structured in individual tests as listed below. For detailed information on the individual steps and assertions performed by the tests, review the Python source code accessible via the following links:
All these test cases are included in the test case dovetail.tempest.volume of OVP test suite.
Implementation: Attach Detach Volume to Instance
This test evaluates the volume API ability of attaching a volume to a server and detaching a volume from a server. Specifically, the test verifies that:
In order to pass this test, all test assertions listed in the test execution above need to pass.
N/A
Implementation: Volume Boot Pattern test
This test evaluates the volume storage consistency. Specifically, the test verifies that:
In order to pass this test, all test assertions listed in the test execution above need to pass.
N/A
The VNF test area evaluates basic NFV capabilities of the system under test. These capabilities include creating a small number of virtual machines, establishing the SUT VNF, VNFs which are going to support the test activities and an Orchestrator as well as verifying the proper behavior of the basic VNF.
This test area references the following specifications and guides:
The following terms and abbreviations are used in conjunction with this test area
The system under test is assumed to be the VNF and VIM in operation on a Pharos compliant infrastructure.
The test area is structured in two separate tests which are executed sequentially. The order of the tests is arbitrary as there are no dependencies across the tests. Specifically, every test performs clean-up operations which return the system to the same state as before the test.
dovetail.vnf.vepc
The Evolved Packet Core (EPC) is the main component of the System Architecture Evolution (SAE) which forms the core of the 3GPP LTE specification.
vEPC has been integrated in Functest to demonstrate the capability to deploy a complex mobility-specific NFV scenario on the OPNFV platform. The OAI EPC supports most of the essential functions defined by the 3GPP Technical Specs; hence the successful execution of functional tests on the OAI EPC provides a good endorsement of the underlying NFV platform.
At least one compute node is available. No further pre-configuration needed.
This integration also includes ABot, a Test Orchestration system that enables test scenarios to be defined in high-level DSL. ABot is also deployed as a VM on the OPNFV platform; and this provides an example of the automation driver and the Test VNF being both deployed as separate VNFs on the underlying OPNFV platform.
The VNF Manager (juju) should be deployed successfully
Test executor (ABot), test Orchestration system is deployed and enables test scenarios to be defined in high-level DSL
VMs which are act as VNFs (including the VNF that is the SUT for test case) are following the 3GPP technical specifications accordingly.
The clean-up operations are run.
dovetail.vnf.vims
The IP Multimedia Subsystem or IP Multimedia Core Network Subsystem (IMS) is an architectural framework for delivering IP multimedia services.
vIMS test case is integrated to demonstrate the capability to deploy a relatively complex NFV scenario on top of the OPNFV infrastructure.
Example of a real VNF deployment to show the NFV capabilities of the platform. The IP Multimedia Subsytem is a typical Telco test case, referenced by ETSI. It provides a fully functional VoIP System.
Certain ubuntu server and cloudify images version refer to dovetail testing user guide.
At least 30G RAMs and 50 vcpu cores required.
vIMS has been integrated in Functest to demonstrate the capability to deploy a relatively complex NFV scenario on the OPNFV platform. The deployment of a complete functional VNF allows the test of most of the essential functions needed for a NFV platform.
The VNF orchestrator (Cloudify) should be deployed successfully.
The Clearwater vIMS (IP Multimedia Subsystem) VNF from this orchestrator should be deployed successfully.
The suite of signaling tests on top of vIMS should be run successfully.
The test scenarios on the NFV platform should be executed successfully following the ETSI standards accordingly.
All resources created during the test run have been cleaned-up
The vping test area evaluates basic NFVi capabilities of the system under test. These capabilities include creating a small number of virtual machines, establishing basic L3 connectivity between them and verifying connectivity by means of ICMP packets.
The following terms and abbreviations are used in conjunction with this test area
The system under test is assumed to be the NFVi and VIM in operation on a Pharos compliant infrastructure.
The test area is structured in two separate tests which are executed sequentially. The order of the tests is arbitrary as there are no dependencies across the tests.
dovetail.vping.userdata
This test evaluates the use case where an NFVi tenant boots up two VMs and requires L3 connectivity between those VMs. The target IP is passed to the VM that will initiate pings by using a custom userdata script provided by nova metadata service.
At least one compute node is available. No further pre-configuration needed.
Connectivity between VMs is tested by sending ICMP ping packets between selected VMs. The target IP is passed to the VM sending pings by using a custom userdata script by means of the config driver mechanism provided by Nova metadata service. Whether or not a ping was successful is determined by checking the console output of the source VMs.
Test assertion 1: The network id, subnet id and router id can be found in the response
Test assertion 2: The security group id can be found in the response
Test action 3: boot VM1 by using nova client with configured name, image, flavor, private tenant network created in test action 1, security group created in test action 2
Test assertion 3: The VM1 object can be found in the response
Test action 4: Generate ping script with the IP of VM1 to be passed as userdata provided by the nova metadata service.
Test action 5: Boot VM2 by using nova client with configured name, image, flavor, private tenant network created in test action 1, security group created in test action 2, userdata created in test action 4
Test assertion 4: The VM2 object can be found in the response
Test action 6: Inside VM2, the ping script is executed automatically when booted and it contains a loop doing the ping until the return code is 0 or timeout reached. For each ping, when the return code is 0, “vPing OK” is printed in the VM2 console-log, otherwise, “vPing KO” is printed. Monitoring the console-log of VM2 to see the response generated by the script.
Test assertion 5: “vPing OK” is detected, when monitoring the console-log in VM2
Test action 7: delete VM1, VM2
Test assertion 6: VM1 and VM2 are not present in the VM list
Test action 8: delete security group, gateway, interface, router, subnet and network
Test assertion 7: The security group, gateway, interface, router, subnet and network are no longer present in the lists after deleting
This test evaluates basic NFVi capabilities of the system under test. Specifically, the test verifies that:
In order to pass this test, all test assertions listed in the test execution above need to pass.
None
dovetail.vping.ssh
This test evaluates the use case where an NFVi tenant boots up two VMs and requires
L3 connectivity between those VMs. An SSH connection is establised from the host to
a floating IP associated with VM2 and ping is executed on VM2 with the IP of VM1 as target.
At least one compute node is available. There should exist an OpenStack external network and can assign floating IP.
Connectivity between VMs is tested by sending ICMP ping packets between
selected VMs. To this end, the test establishes an SSH connection from the host
running the test suite to a floating IP associated with VM2 and executes ping
on VM2 with the IP of VM1 as target.
Test assertion 1: The network id, subnet id and router id can be found in the response
Test assertion 2: The security group id can be found in the response
Test action 3: Boot VM1 by using nova client with configured name, image, flavor, private tenant network created in test action 1, security group created in test action 2
Test assertion 3: The VM1 object can be found in the response
Test action 4: Boot VM2 by using nova client with configured name, image, flavor, private tenant network created in test action 1, security group created in test action 2
Test assertion 4: The VM2 object can be found in the response
Test action 5: create one floating IP by using neutron client, storing the floating IP address returned in the response
Test assertion 5: Floating IP address can be found in the response
Test action 6: Assign the floating IP address created in test action 5 to VM2 by using nova client
Test assertion 6: The assigned floating IP can be found in the VM2 console log file
Test action 7: Establish SSH connection between the test host and VM2 through the floating IP
Test assertion 7: SSH connection between the test host and VM2 is established within 300 seconds
Test action 8: Copy the Ping script from the test host to VM2 by using SCPClient
Test assertion 8: The Ping script can be found inside VM2
Test action 9: Inside VM2, to execute the Ping script to ping VM1, the Ping script contains a loop doing the ping until the return code is 0 or timeout reached, for each ping, when the return code is 0, “vPing OK” is printed in the VM2 console-log, otherwise, “vPing KO” is printed. Monitoring the console-log of VM2 to see the response generated by the script.
Test assertion 9: “vPing OK” is detected, when monitoring the console-log in VM2
Test action 10: delete VM1, VM2
Test assertion 10: VM1 and VM2 are not present in the VM list
Test action 11: delete floating IP, security group, gateway, interface, router, subnet and network
Test assertion 11: The security group, gateway, interface, router, subnet and network are no longer present in the lists after deleting
This test evaluates basic NFVi capabilities of the system under test. Specifically, the test verifies that:
In order to pass this test, all test assertions listed in the test execution above need to pass.
None
The VPN test area evaluates the ability of the system under test to support VPN networking for virtual workloads. The tests in this test area will evaluate establishing VPN networks, publishing and communication between endpoints using BGP and tear down of the networks.
This test area evaluates the ability of the system to perform selected actions defined in the following specifications. Details of specific features evaluated are described in the test descriptions.
The following terms and abbreviations are used in conjunction with this test area
The system under test is assumed to be the NFVi and VIM in operation on a Pharos compliant infrastructure.
The test area is structured in four separate tests which are executed sequentially. The order of the tests is arbitrary as there are no dependencies across the tests. Specifially, every test performs clean-up operations which return the system to the same state as before the test.
The test area evaluates the ability of the SUT to establish connectivity between Virtual Machines using an appropriate route target configuration, reconfigure the route targets to remove connectivity between the VMs, then reestablish connectivity by re-association.
dovetail.sdnvpn.subnet_connectivity
This test evaluates the use case where an NFVi tenant uses a BGPVPN to provide connectivity between VMs on different Neutron networks and subnets that reside on different hosts.
2 compute nodes are available, denoted Node1 and Node2 in the following.
Connectivity between VMs is tested by sending ICMP ping packets between selected VMs. The target IPs are passed to the VMs sending pings by means of a custom user data script. Whether or not a ping was successful is determined by checking the console output of the source VMs.
pingping exits with return code 0pingping exits with return code 0pingping exits with a non-zero return codepingping exits with return code 0pingping exits with return code 0pingping exits with return code 0This test evaluates the capability of the NFVi and VIM to provide routed IP connectivity between VMs by means of BGP/MPLS VPNs. Specifically, the test verifies that:
In order to pass this test, all test assertions listed in the test execution above need to pass.
N/A
dovetail.sdnvpn.tenant_separation
This test evaluates if VPNs provide separation of traffic such that overlapping IP ranges can be used.
2 compute nodes are available, denoted Node1 and Node2 in the following.
Connectivity between VMs is tested by establishing an SSH connection. Moreover, the command “hostname” is executed at the remote VM in order to retrieve the hostname of the remote VM. The retrieved hostname is furthermore compared against an expected value. This is used to verify tenant traffic separation, i.e., despite overlapping IPs, a connection is made to the correct VM as determined by means of the hostname of the target VM.
hostname on the VM with IP 10.10.10.12 via SSH.hostname. The
retrieved hostname equals the hostname of VM2.hostname on the VM with IP 10.10.11.13 via SSH.hostname. The
retrieved hostname equals the hostname of VM3.hostname on the VM with IP 10.10.11.13 via SSH.hostname. The
retrieved hostname equals the hostname of VM5.hostname on the VM with IP 10.10.11.11 via SSH.This test evaluates the capability of the NFVi and VIM to provide routed IP connectivity between VMs by means of BGP/MPLS VPNs. Specifically, the test verifies that:
In order to pass this test, all test assertions listed in the test execution above need to pass.
N/A
dovetail.sdnvpn.router_association
This test evaluates if a VPN provides connectivity between two subnets by utilizing two different VPN association mechanisms: a router association and a network association.
Specifically, the test network topology comprises two networks N1 and N2 with corresponding subnets. Additionally, network N1 is connected to a router R1. This test verifies that a VPN V1 provides connectivity between both networks when applying a router association to router R1 and a network association to network N2.
2 compute nodes are available, denoted Node1 and Node2 in the following.
Connectivity between VMs is tested by sending ICMP ping packets between selected VMs. The target IPs are passed to the VMs sending pings by means of a custom user data script. Whether or not a ping was successful is determined by checking the console output of the source VMs.
pingping exits with return code 0pingping exits with return code 0pingping exits with a non-zero return codepingping exits with return code 0pingping exits with return code 0pingping exits with return code 0This test evaluates the capability of the NFVi and VIM to provide routed IP connectivity between VMs by means of BGP/MPLS VPNs. Specifically, the test verifies that:
In order to pass this test, all test assertions listed in the test execution above need to pass.
N/A
dovetail.sdnvpn.router_association_floating_ip
This test evaluates if both the router association and network association mechanisms interwork with floating IP functionality.
Specifically, the test network topology comprises two networks N1 and N2 with corresponding subnets. Additionally, network N1 is connected to a router R1. This test verifies that i) a VPN V1 provides connectivity between both networks when applying a router association to router R1 and a network association to network N2 and ii) a VM in network N1 is reachable externally by means of a floating IP.
At least one compute node is available.
Connectivity between VMs is tested by sending ICMP ping packets between selected VMs. The target IPs are passed to the VMs sending pings by means of a custom user data script. Whether or not a ping was successful is determined by checking the console output of the source VMs.
pingping exits with return code 0pingping exits with return code 0This test evaluates the capability of the NFVi and VIM to provide routed IP connectivity between VMs by means of BGP/MPLS VPNs. Specifically, the test verifies that:
In order to pass this test, all test assertions listed in the test execution above need to pass.
N/A
dovetail.tempest.bgpvpn
This test case combines multiple CRUD (Create, Read, Update, Delete) tests for the objects defined by the BGPVPN API extension of Neutron.
These tests are implemented in the upstream networking-bgpvpn project repository as a Tempest plugin.
The VIM is operational and the networking-bgpvpn service plugin for Neutron is correctly configured and loaded. At least one compute node is available.
List of test cases
The tests include both positive tests and negative tests. The latter are identified with the suffix “_fail” in their name.
The tests are executed sequentially and a separate pass/fail result is recorded per test.
In general, every test case performs the API operations indicated in its name and asserts that the action succeeds (positive test) or a specific exception is triggered (negative test). The following describes the test execution per test in further detail.
This test validates that all supported CRUD operations (create, read, update, delete) can be applied to the objects of the Neutron BGPVPN extension. In order to pass this test, all test assertions listed in the test execution above need to pass.
N/A
The Dovetail testing framework for OVP consists of two major parts: the testing client that executes all test cases in a lab (vendor self-testing or a third party lab), and the server system that is hosted by the OVP administrator to store and view test results based on a web API. The following diagram illustrates this overall framework.
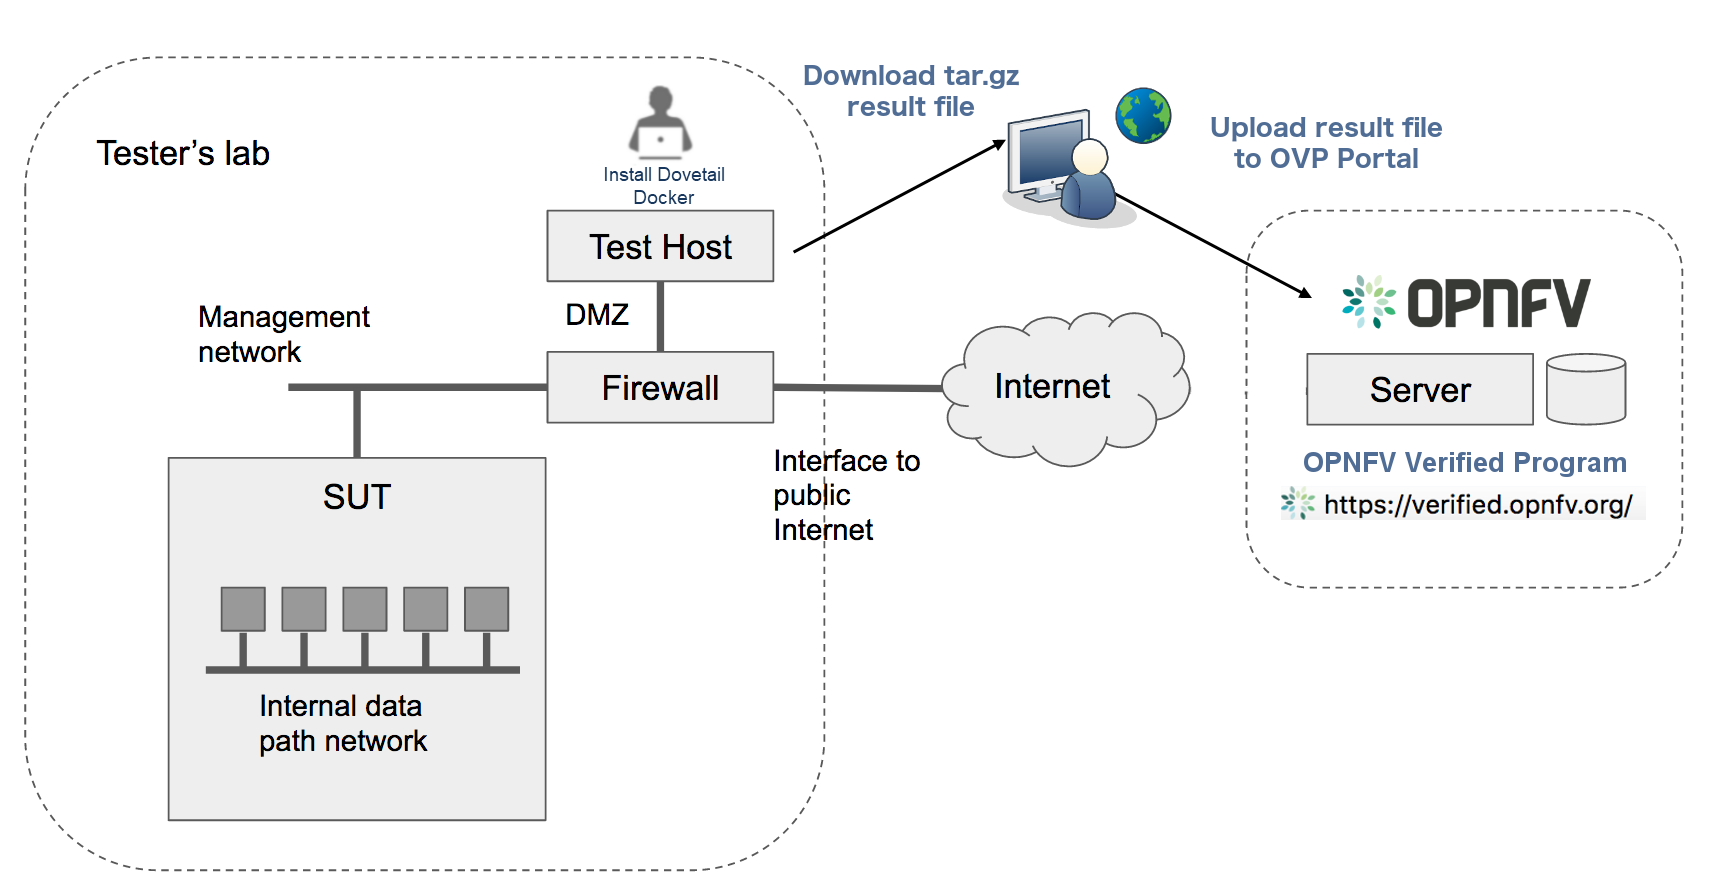
Within the tester’s lab, the Test Host is the machine where Dovetail executes all automated test cases. As it hosts the test harness, the Test Host must not be part of the System Under Test (SUT) itself. The above diagram assumes that the tester’s Test Host is situated in a DMZ, which has internal network access to the SUT and external access via the public Internet. The public Internet connection allows for easy installation of the Dovetail containers. A singular compressed file that includes all the underlying results can be pulled from the Test Host and uploaded to the OPNFV OVP server. This arrangement may not be supported in some labs. Dovetail also supports an offline mode of installation that is illustrated in the next diagram.
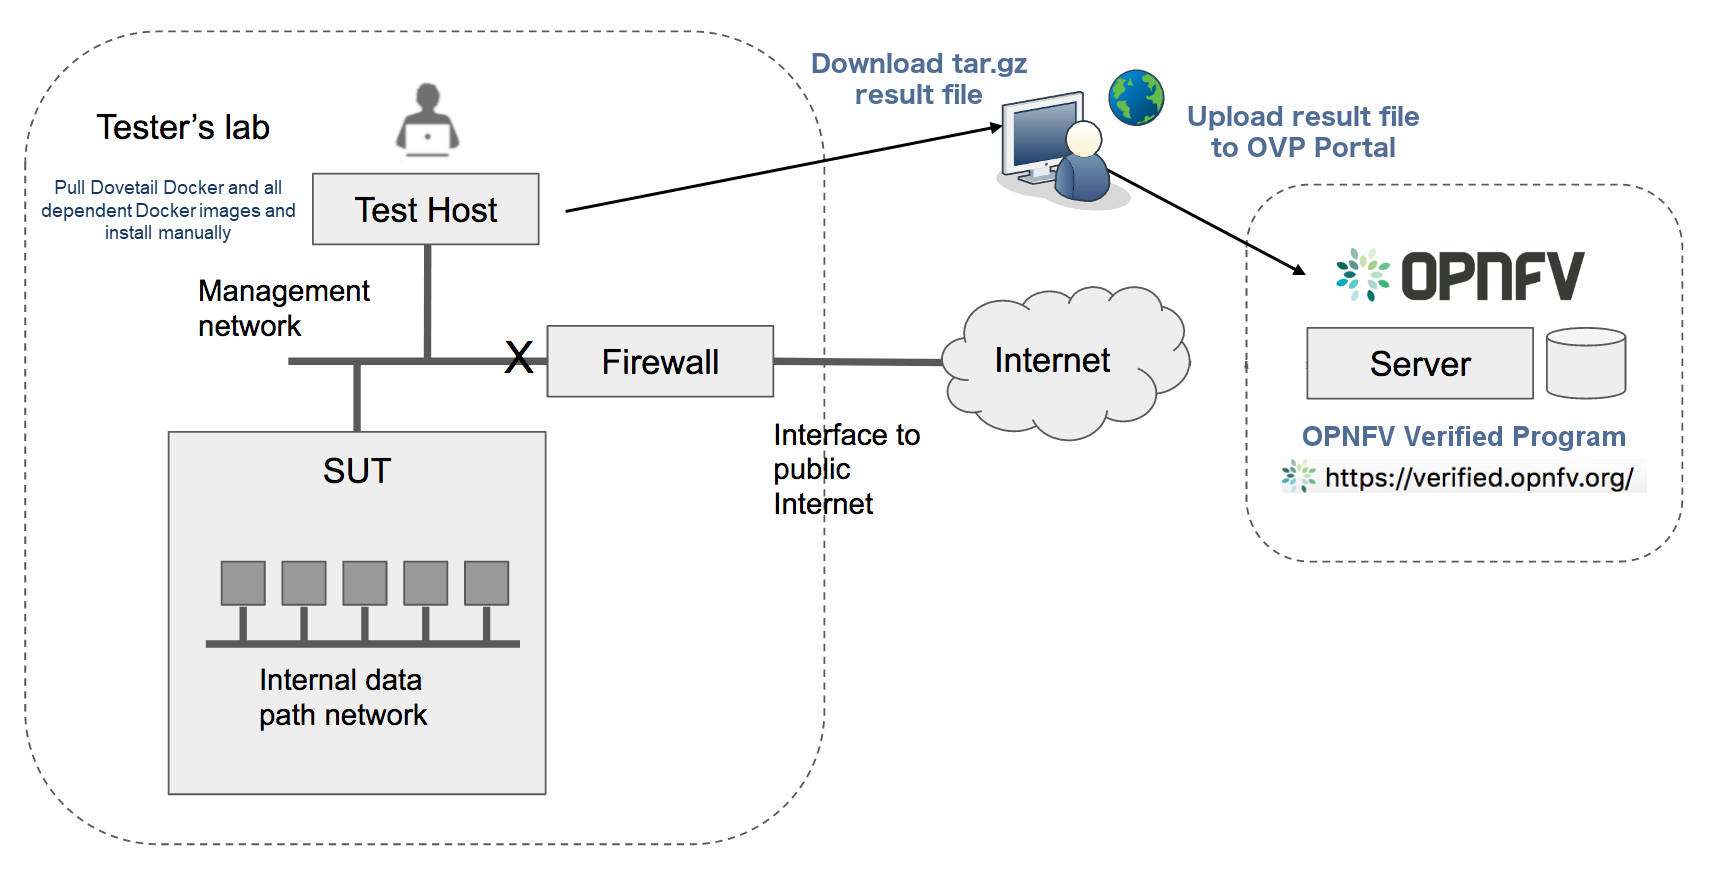
In the offline mode, the Test Host only needs to have access to the SUT via the internal network, but does not need to connect to the public Internet. This user guide will highlight differences between the online and offline modes of the Test Host. While it is possible to run the Test Host as a virtual machine, this user guide assumes it is a physical machine for simplicity.
The rest of this guide will describe how to install the Dovetail tool as a Docker container image, go over the steps of running the OVP test suite, and then discuss how to view test results and make sense of them.
Readers interested in using Dovetail for its functionalities beyond OVP testing, e.g. for in-house or extended testing, should consult the Dovetail developer’s guide for additional information.
In this section, we describe the procedure to install Dovetail client tool on the Test Host. The Test Host must have network access to the management network with access rights to the Virtual Infrastructure Manager’s API.
The Test Host must have network access to the Virtual Infrastructure Manager’s API
hosted in the SUT so that the Dovetail tool can exercise the API from the Test Host.
It must also have ssh access to the Linux operating system
of the compute nodes in the SUT. The ssh mechanism is used by some test cases
to generate test events in the compute nodes. You can find out which test cases
use this mechanism in the test specification document.
We have tested the Dovetail tool on the following host operating systems. Other versions or distributions of Linux may also work, but community support may be more available on these versions.
Use of Ubuntu 16.04 is highly recommended, as it has been most widely employed during testing. Non-Linux operating systems, such as Windows and Mac OS, have not been tested and are not supported.
If online mode is used, the tester should also validate that the Test Host can reach the public Internet. For example,
$ ping www.opnfv.org
PING www.opnfv.org (50.56.49.117): 56 data bytes
64 bytes from 50.56.49.117: icmp_seq=0 ttl=48 time=52.952 ms
64 bytes from 50.56.49.117: icmp_seq=1 ttl=48 time=53.805 ms
64 bytes from 50.56.49.117: icmp_seq=2 ttl=48 time=53.349 ms
...
Or, if the lab environment does not allow ping, try validating it using HTTPS instead.
$ curl https://www.opnfv.org
<!doctype html>


<html lang="en-US" class="no-js">
<head>
...
The main prerequisite software for Dovetail is Docker.
Dovetail does not work with Docker versions prior to 1.12.3. We have validated Dovetail with Docker 17.03 CE. Other versions of Docker later than 1.12.3 may also work, but community support may be more available on Docker 17.03 CE or greater.
$ sudo docker version
Client:
Version:      17.03.1-ce
API version:  1.27
Go version:   go1.7.5
Git commit:   c6d412e
Built:        Mon Mar 27 17:10:36 2017
OS/Arch:      linux/amd64

Server:
Version:      17.03.1-ce
API version:  1.27 (minimum version 1.12)
Go version:   go1.7.5
Git commit:   c6d412e
Built:        Mon Mar 27 17:10:36 2017
OS/Arch:      linux/amd64
Experimental: false
If your Test Host does not have Docker installed, or Docker is older than 1.12.3, or you have Docker version other than 17.03 CE and wish to change, you will need to install, upgrade, or re-install in order to run Dovetail. The Docker installation process can be more complex, you should refer to the official Docker installation guide that is relevant to your Test Host’s operating system.
The above installation steps assume that the Test Host is in the online mode. For offline testing, use the following offline installation steps instead.
In order to install Docker offline, download Docker static binaries and copy the tar file to the Test Host, such as for Ubuntu14.04, you may follow the following link to install,
https://github.com/meetyg/docker-offline-install
The Test Host needs a few environment variables set correctly in order to access the Openstack API required to drive the Dovetail tests. For convenience and as a convention, we will also create a home directory for storing all Dovetail related config files and results files:
$ mkdir -p ${HOME}/dovetail
$ export DOVETAIL_HOME=${HOME}/dovetail
Here we set dovetail home directory to be ${HOME}/dovetail for an example.
Then create 2 directories named pre_config and images in this directory
to store all Dovetail related config files and all test images respectively:
$ mkdir -p ${DOVETAIL_HOME}/pre_config
$ mkdir -p ${DOVETAIL_HOME}/images
At this point, you will need to consult your SUT (Openstack) administrator to correctly set
the configurations in a file named env_config.sh.
The Openstack settings need to be configured such that the Dovetail client has all the necessary
credentials and privileges to execute all test operations. If the SUT uses terms
somewhat differently from the standard Openstack naming, you will need to adjust
this file accordingly.
Create and edit the file ${DOVETAIL_HOME}/pre_config/env_config.sh so that
all parameters are set correctly to match your SUT. Here is an example of what
this file should contain.
$ cat ${DOVETAIL_HOME}/pre_config/env_config.sh

# Project-level authentication scope (name or ID), recommend admin project.
export OS_PROJECT_NAME=admin

# Authentication username, belongs to the project above, recommend admin user.
export OS_USERNAME=admin

# Authentication password. Use your own password
export OS_PASSWORD=xxxxxxxx

# Authentication URL, one of the endpoints of keystone service. If this is v3 version,
# there need some extra variables as follows.
export OS_AUTH_URL='http://xxx.xxx.xxx.xxx:5000/v3'

# Default is 2.0. If use keystone v3 API, this should be set as 3.
export OS_IDENTITY_API_VERSION=3

# Domain name or ID containing the user above.
# Command to check the domain: openstack user show <OS_USERNAME>
export OS_USER_DOMAIN_NAME=default

# Domain name or ID containing the project above.
# Command to check the domain: openstack project show <OS_PROJECT_NAME>
export OS_PROJECT_DOMAIN_NAME=default

# Special environment parameters for https.
# If using https + cacert, the path of cacert file should be provided.
# The cacert file should be put at $DOVETAIL_HOME/pre_config.
export OS_CACERT=/path/to/pre_config/cacert.pem

# If using https + no cacert, should add OS_INSECURE environment parameter.
export OS_INSECURE=True

# The name of a network with external connectivity for allocating floating
# IPs. It is required that at least one Neutron network with the attribute
# 'router:external=True' is pre-configured on the system under test.
# This network is used by test cases to SSH into tenant VMs and perform
# operations there.
export EXTERNAL_NETWORK=xxx

# Set an existing role used to create project and user for vping test cases.
# Otherwise, it will create a role 'Member' to do that.
export NEW_USER_ROLE=xxx
The OS_AUTH_URL variable is key to configure correctly, as the other admin services are gleaned from the identity service. HTTPS should be configured in the SUT so either OS_CACERT or OS_INSECURE should be uncommented. However, if SSL is disabled in the SUT, comment out both OS_CACERT and OS_INSECURE variables. Ensure the ‘/path/to/pre_config’ directory in the above file matches the directory location of the cacert file for the OS_CACERT variable.
The next three sections outline additional configuration files used by Dovetail. The tempest (tempest_conf.yaml) configuration file is required for executing all tempest test cases (e.g. functest.tempest.compute, functest.tempest.ipv6 ...) and functest.security.patrole. The HA (pod.yaml) configuration file is required for HA test cases and is also employed to collect SUT hardware info. The hosts.yaml is optional for hostname/IP resolution.
The test cases in the test areas tempest and security
are based on Tempest. A SUT-specific configuration of
Tempest is required in order to run those test cases successfully. The
corresponding SUT-specific configuration options must be supplied in the file
$DOVETAIL_HOME/pre_config/tempest_conf.yaml.
Create and edit file $DOVETAIL_HOME/pre_config/tempest_conf.yaml.
Here is an example of what this file should contain.
compute:
  # The minimum number of compute nodes expected.
  # This should be no less than 2 and no larger than the compute nodes the SUT actually has.
  min_compute_nodes: 2

  # Expected device name when a volume is attached to an instance.
  volume_device_name: vdb
Use the listing above as a minimum to execute the mandatory test areas.
If the optional BGPVPN Tempest API tests shall be run, Tempest needs to be told
that the BGPVPN service is available. To do that, add the following to the
$DOVETAIL_HOME/pre_config/tempest_conf.yaml configuration file:
service_available:
  bgpvpn: True
The HA test cases require OpenStack controller node info. It must include the node’s
name, role, ip, as well as the user and key_filename or password to login to the node. Users
must create the file ${DOVETAIL_HOME}/pre_config/pod.yaml to store the info.
For some HA test cases, they will log in the controller node ‘node1’ and kill the specific processes.
The names of the specific processes may be different with the actual ones of the SUTs.
The process names can also be changed with file ${DOVETAIL_HOME}/pre_config/pod.yaml.
This file is also used as basis to collect SUT hardware information that is stored alongside results and uploaded to the OVP web portal. The SUT hardware information can be viewed within the ‘My Results’ view in the OVP web portal by clicking the SUT column ‘info’ link. In order to collect SUT hardware information holistically, ensure this file has an entry for each of the controller and compute nodes within the SUT.
Below is a sample with the required syntax when password is employed by the controller.
nodes:
-
    # This can not be changed and must be node0.
    name: node0

    # This must be Jumpserver.
    role: Jumpserver

    # This is the install IP of a node which has ipmitool installed.
    ip: xx.xx.xx.xx

    # User name of this node. This user must have sudo privileges.
    user: root

    # Password of the user.
    password: root

-
    # This can not be changed and must be node1.
    name: node1

    # This must be controller.
    role: Controller

    # This is the install IP of a controller node, which is the haproxy primary node
    ip: xx.xx.xx.xx

    # User name of this node. This user must have sudo privileges.
    user: root

    # Password of the user.
    password: root

process_info:
-
    # The default attack process of yardstick.ha.rabbitmq is 'rabbitmq-server'.
    # Here can reset it to be 'rabbitmq'.
    testcase_name: yardstick.ha.rabbitmq
    attack_process: rabbitmq

-
    # The default attack host for all HA test cases is 'node1'.
    # Here can reset it to be any other node given in the section 'nodes'.
    testcase_name: yardstick.ha.glance_api
    attack_host: node2
Besides the ‘password’, a ‘key_filename’ entry can be provided to login to the controller node.
Users need to create file $DOVETAIL_HOME/pre_config/id_rsa to store the private key.
A sample is provided below to show the required syntax when using a key file.
nodes:
-
    name: node1
    role: Controller
    ip: 10.1.0.50
    user: root

    # Private ssh key for accessing the controller nodes. If a keyfile is
    # being used, the path specified **must** be as shown below as this
    # is the location of the user-provided private ssh key inside the
    # Yardstick container.
    key_filename: /home/opnfv/userconfig/pre_config/id_rsa
Under nodes, repeat entries for name, role, ip, user and password or key file for each of the controller/compute nodes that comprise the SUT. Use a ‘-‘ to separate each of the entries. Specify the value for the role key to be either ‘Controller’ or ‘Compute’ for each node.
Under process_info, repeat entries for testcase_name, attack_host and attack_process for each HA test case. Use a ‘-‘ to separate each of the entries. The default attack host of all HA test cases is node1. The default attack processes of all HA test cases are list here,
Test Case Name Attack Process Name yardstick.ha.cinder_api cinder-api yardstick.ha.database mysql yardstick.ha.glance_api glance-api yardstick.ha.haproxy haproxy yardstick.ha.keystone keystone yardstick.ha.neutron_l3_agent neutron-l3-agent yardstick.ha.neutron_server neutron-server yardstick.ha.nova_api nova-api yardstick.ha.rabbitmq rabbitmq-server
If your SUT uses a hosts file to translate hostnames into the IP of OS_AUTH_URL, then you need
to provide the hosts info in a file $DOVETAIL_HOME/pre_config/hosts.yaml.
Create and edit file $DOVETAIL_HOME/pre_config/hosts.yaml. Below is an example of what
this file should contain. Note, that multiple hostnames can be specified for each IP address,
as shown in the generic syntax below the example.
$ cat ${DOVETAIL_HOME}/pre_config/hosts.yaml

---
hosts_info:
  192.168.141.101:
    - identity.endpoint.url
    - compute.endpoint.url

  <ip>:
    - <hostname1>
    - <hostname2>
The Dovetail project maintains a Docker image that has Dovetail test tools preinstalled. This Docker image is tagged with versions. Before pulling the Dovetail image, check the OPNFV’s OVP web page first to determine the right tag for OVP testing.
If the Test Host is online, you can directly pull Dovetail Docker image and download Ubuntu and Cirros images. All other dependent docker images will automatically be downloaded. The Ubuntu and Cirros images are used by Dovetail for image creation and VM instantiation within the SUT.
$ wget -nc http://download.cirros-cloud.net/0.4.0/cirros-0.4.0-x86_64-disk.img -P ${DOVETAIL_HOME}/images
$ wget -nc https://cloud-images.ubuntu.com/releases/14.04/release/ubuntu-14.04-server-cloudimg-amd64-disk1.img -P ${DOVETAIL_HOME}/images
$ wget -nc https://cloud-images.ubuntu.com/releases/16.04/release/ubuntu-16.04-server-cloudimg-amd64-disk1.img -P ${DOVETAIL_HOME}/images
$ wget -nc http://repository.cloudifysource.org/cloudify/4.0.1/sp-release/cloudify-manager-premium-4.0.1.qcow2 -P ${DOVETAIL_HOME}/images

$ sudo docker pull opnfv/dovetail:ovp-2.0.0
ovp-2.0.0: Pulling from opnfv/dovetail
324d088ce065: Pull complete
2ab951b6c615: Pull complete
9b01635313e2: Pull complete
04510b914a6c: Pull complete
83ab617df7b4: Pull complete
40ebbe7294ae: Pull complete
d5db7e3e81ae: Pull complete
0701bf048879: Pull complete
0ad9f4168266: Pull complete
d949894f87f6: Pull complete
Digest: sha256:7449601108ebc5c40f76a5cd9065ca5e18053be643a0eeac778f537719336c29
Status: Downloaded newer image for opnfv/dovetail:ovp-2.0.0
If the Test Host is offline, you will need to first pull the Dovetail Docker image, and all the dependent images that Dovetail uses, to a host that is online. The reason that you need to pull all dependent images is because Dovetail normally does dependency checking at run-time and automatically pulls images as needed, if the Test Host is online. If the Test Host is offline, then all these dependencies will need to be manually copied.
The Docker images and Cirros image below are necessary for all mandatory test cases.
$ sudo docker pull opnfv/dovetail:ovp-2.0.0
$ sudo docker pull opnfv/functest-smoke:opnfv-6.3.0
$ sudo docker pull opnfv/yardstick:ovp-2.0.0
$ sudo docker pull opnfv/bottlenecks:ovp-2.0.0
$ wget -nc http://download.cirros-cloud.net/0.4.0/cirros-0.4.0-x86_64-disk.img -P {ANY_DIR}
The other Docker images and test images below are only used by optional test cases.
$ sudo docker pull opnfv/functest-healthcheck:opnfv-6.3.0
$ sudo docker pull opnfv/functest-features:opnfv-6.3.0
$ sudo docker pull opnfv/functest-vnf:opnfv-6.3.0
$ wget -nc https://cloud-images.ubuntu.com/releases/14.04/release/ubuntu-14.04-server-cloudimg-amd64-disk1.img -P {ANY_DIR}
$ wget -nc https://cloud-images.ubuntu.com/releases/16.04/release/ubuntu-16.04-server-cloudimg-amd64-disk1.img -P {ANY_DIR}
$ wget -nc http://repository.cloudifysource.org/cloudify/4.0.1/sp-release/cloudify-manager-premium-4.0.1.qcow2 -P {ANY_DIR}
Once all these images are pulled, save the images, copy to the Test Host, and then load the Dovetail image and all dependent images at the Test Host.
At the online host, save the images with the command below.
$ sudo docker save -o dovetail.tar opnfv/dovetail:ovp-2.0.0 \
  opnfv/functest-smoke:opnfv-6.3.0 opnfv/functest-healthcheck:opnfv-6.3.0 \
  opnfv/functest-features:opnfv-6.3.0 opnfv/functest-vnf:opnfv-6.3.0 \
  opnfv/yardstick:ovp-2.0.0 opnfv/bottlenecks:ovp-2.0.0
The command above creates a dovetail.tar file with all the images, which can then be copied to the Test Host. To load the Dovetail images on the Test Host execute the command below.
$ sudo docker load --input dovetail.tar
Now check to see that all Docker images have been pulled or loaded properly.
$ sudo docker images
REPOSITORY                      TAG                 IMAGE ID            CREATED             SIZE
opnfv/dovetail                  ovp-2.0.0           ac3b2d12b1b0        24 hours ago        784 MB
opnfv/functest-smoke            opnfv-6.3.0         010aacb7c1ee        17 hours ago        594.2 MB
opnfv/functest-healthcheck      opnfv-6.3.0         2cfd4523f797        17 hours ago        234 MB
opnfv/functest-features         opnfv-6.3.0         b61d4abd56fd        17 hours ago        530.5 MB
opnfv/functest-vnf              opnfv-6.3.0         929e847a22c3        17 hours ago        1.87 GB
opnfv/yardstick                 ovp-2.0.0           84b4edebfc44        17 hours ago        2.052 GB
opnfv/bottlenecks               ovp-2.0.0           3d4ed98a6c9a        21 hours ago        638 MB
After copying and loading the Dovetail images at the Test Host, also copy the test images (Ubuntu, Cirros and cloudify-manager) to the Test Host.
cirros-0.4.0-x86_64-disk.img to ${DOVETAIL_HOME}/images/.ubuntu-14.04-server-cloudimg-amd64-disk1.img to ${DOVETAIL_HOME}/images/.ubuntu-16.04-server-cloudimg-amd64-disk1.img to ${DOVETAIL_HOME}/images/.cloudify-manager-premium-4.0.1.qcow2 to ${DOVETAIL_HOME}/images/.Regardless of whether you pulled down the Dovetail image directly online, or loaded from a static image tar file, you are now ready to run Dovetail. Use the command below to create a Dovetail container and get access to its shell.
$ sudo docker run --privileged=true -it \
          -e DOVETAIL_HOME=$DOVETAIL_HOME \
          -v $DOVETAIL_HOME:$DOVETAIL_HOME \
          -v /var/run/docker.sock:/var/run/docker.sock \
          opnfv/dovetail:<tag> /bin/bash
The -e option sets the DOVETAIL_HOME environment variable in the container
and the -v options mounts files from the test host to the destination path
inside the container. The latter option allows the Dovetail container to read
the configuration files and write result files into DOVETAIL_HOME on the Test
Host. The user should be within the Dovetail container shell, once the command
above is executed.
All or a subset of the available tests can be executed at any location within the Dovetail container prompt. You can refer to Dovetail Command Line Interface Reference for the details of the CLI.
$ dovetail run --testsuite <test-suite-name>
The ‘–testsuite’ option is used to control the set of tests intended for execution
at a high level. For the purposes of running the OVP test suite, the test suite name follows
the following format, ovp.<major>.<minor>.<patch>. The latest and default test suite is
ovp.2018.09.
$ dovetail run
This command is equal to
$ dovetail run --testsuite ovp.2018.09
Without any additional options, the above command will attempt to execute all mandatory and optional test cases with test suite ovp.2018.09. To restrict the breadth of the test scope, it can also be specified using options ‘–mandatory’ or ‘–optional’.
$ dovetail run --mandatory
Also there is a ‘–testcase’ option provided to run a specified test case.
$ dovetail run --testcase functest.tempest.osinterop
Dovetail allows the user to disable strict API response validation implemented
by Nova Tempest tests by means of the --no-api-validation option. Usage of
this option is only advisable if the SUT returns Nova API responses that
contain additional attributes. For more information on this command line option
and its intended usage, refer to
Disabling Strict API Validation in Tempest.
$ dovetail run --testcase functest.tempest.osinterop --no-api-validation
By default, during test case execution, the respective feature is responsible to decide what flavor is going to use for the execution of each test scenario which is under of its umbrella. In parallel, there is also implemented a mechanism in order for the extra specs in flavors of executing test scenarios to be hugepages instead of the default option. This is happening if the name of the scenario contains the substring “ovs”. In this case, the flavor which is going to be used for the running test case has ‘hugepage’ characteristics.
Taking the above into our consideration and having in our mind that the DEPLOY_SCENARIO environment parameter is not used by dovetail framework (the initial value is ‘unknown’), we set as input, for the features that they are responsible for the test case execution, the DEPLOY_SCENARIO environment parameter having as substring the feature name “ovs” (e.g. os-nosdn-ovs-ha).
$ dovetail run --testcase functest.tempest.osinterop --deploy-scenario os-nosdn-ovs-ha
By default, results are stored in local files on the Test Host at $DOVETAIL_HOME/results.
Each time the ‘dovetail run’ command is executed, the results in the aforementioned directory
are overwritten. To create a singular compressed result file for upload to the OVP portal or
for archival purposes, the tool provided an option ‘–report’.
$ dovetail run --report
If the Test Host is offline, --offline should be added to support running with
local resources.
$ dovetail run --offline
Below is an example of running one test case and the creation of the compressed result file on the Test Host.
$ dovetail run --offline --testcase functest.vping.userdata --report
2018-05-22 08:16:16,353 - run - INFO - ================================================
2018-05-22 08:16:16,353 - run - INFO - Dovetail compliance: ovp.2018.09!
2018-05-22 08:16:16,353 - run - INFO - ================================================
2018-05-22 08:16:16,353 - run - INFO - Build tag: daily-master-660de986-5d98-11e8-b635-0242ac110001
2018-05-22 08:19:31,595 - run - WARNING - There is no hosts file /home/dovetail/pre_config/hosts.yaml, may be some issues with domain name resolution.
2018-05-22 08:19:31,595 - run - INFO - Get hardware info of all nodes list in file /home/dovetail/pre_config/pod.yaml ...
2018-05-22 08:19:39,778 - run - INFO - Hardware info of all nodes are stored in file /home/dovetail/results/all_hosts_info.json.
2018-05-22 08:19:39,961 - run - INFO - >>[testcase]: functest.vping.userdata
2018-05-22 08:31:17,961 - run - INFO - Results have been stored with file /home/dovetail/results/functest_results.txt.
2018-05-22 08:31:17,969 - report.Report - INFO -

Dovetail Report
Version: 1.0.0
Build Tag: daily-master-660de986-5d98-11e8-b635-0242ac110001
Upload Date: 2018-05-22 08:31:17 UTC
Duration: 698.01 s

Pass Rate: 100.00% (1/1)
vping:                     pass rate 100.00%
-functest.vping.userdata   PASS
When test execution is complete, a tar file with all result and log files is written in
$DOVETAIL_HOME on the Test Host. An example filename is
${DOVETAIL_HOME}/logs_20180105_0858.tar.gz. The file is named using a
timestamp that follows the convention ‘YearMonthDay-HourMinute’. In this case, it was generated
at 08:58 on January 5th, 2018. This tar file is used to upload to the OVP portal.
When a tester is performing trial runs, Dovetail stores results in local files on the Test Host by default within the directory specified below.
cd $DOVETAIL_HOME/results
tempest_logs/functest.tempest.XXX.html and
security_logs/functest.security.XXX.html respectively,
which has the passed, skipped and failed test cases results.vping_logs/functest.vping.XXX.log.ha_logs/yardstick.ha.XXX.log.stress_logs/bottlenecks.stress.XXX.log.snaps_logs/functest.snaps.smoke.log.vnf_logs/functest.vnf.XXX.log.bgpvpn_logs/functest.bgpvpn.XXX.log.The OVP portal is a public web interface for the community to collaborate on results and to submit results for official OPNFV compliance verification. The portal can be used as a resource by users and testers to navigate and inspect results more easily than by manually inspecting the log files. The portal also allows users to share results in a private manner until they are ready to submit results for peer community review.
- Web Site URL
- Sign In / Sign Up Links
- Accounts are exposed through Linux Foundation or OpenStack account credentials.
- If you already have a Linux Foundation ID, you can sign in directly with your ID.
- If you do not have a Linux Foundation ID, you can sign up for a new one using ‘Sign Up’
- My Results Tab
- This is the primary view where most of the workflow occurs.
- This page lists all results uploaded by you after signing in.
- You can also upload results on this page with the two steps below.
- Obtain results tar file located at
${DOVETAIL_HOME}/, examplelogs_20180105_0858.tar.gz- Use the Choose File button where a file selection dialog allows you to choose your result file from the hard-disk. Then click the Upload button and see a results ID once your upload succeeds.
- Results are status ‘private’ until they are submitted for review.
- Use the Operation column drop-down option ‘submit to review’, to expose results to OPNFV community peer reviewers. Use the ‘withdraw submit’ option to reverse this action.
- Use the Operation column drop-down option ‘share with’ to share results with other users by supplying either the login user ID or the email address associated with the share target account. The result is exposed to the share target but remains private otherwise.
- Profile Tab
- This page shows your account info after you sign in.
Follow the instructions in section Installing Dovetail on the Test Host and Running the OVP Test Suite by replacing the docker images with new_tags,
sudo docker pull opnfv/dovetail:<dovetail_new_tag>
sudo docker pull opnfv/functest:<functest_new_tag>
sudo docker pull opnfv/yardstick:<yardstick_new_tag>
This step is necessary if dovetail software or the OVP test suite have updates.
Dovetail command line is to have a simple command line interface in Dovetail to make easier for users to handle the functions that dovetail framework provides.
| Commands | Action |
|---|---|
| dovetail –help | -h | Show usage of command “dovetail” |
| dovetail –version | Show version number |
| Dovetail List Commands | |
| dovetail list –help | -h | Show usage of command “dovetail list” |
| dovetail list | List all available test suites and all test cases within each test suite |
| dovetail list <test_suite_name> | List all available test areas within test suite <test_suite_name> |
| Dovetail Show Commands | |
| dovetail show –help | -h | Show usage of command “dovetail show” |
| dovetail show <test_case_name> | Show the details of one test case |
| Dovetail Run Commands | |
| dovetail run –help | -h | Show usage of command “dovetail run” |
| dovetail run | Run Dovetail with all test cases within default test suite |
| dovetail run –testsuite <test_suite_name> | Run Dovetail with all test cases within test suite <test_suite_name> |
| dovetail run –testsuite <test_suite_name> –testarea <test_area_name> | Run Dovetail with test area <test_area_name> within test suite <test_suite_name>. Test area can be chosen from (vping, tempest, security, ha, stress, bgpvpn, vnf, snaps). Repeat option to set multiple test areas. |
| dovetail run –testcase <test_case_name> | Run Dovetail with one or more specified test cases. Repeat option to set multiple test cases. |
| dovetail run –mandatory –testsuite <test_suite_name> | Run Dovetail with all mandatory test cases within test suite <test_suite_name> |
| dovetail run –optional –testsuite <test_suite_name> | Run Dovetail with all optional test cases within test suite <test_suite_name> |
| dovetail run –debug | -d | Run Dovetail with debug mode and show all debug logs |
| dovetail run –offline | Run Dovetail offline, use local docker images instead of download online |
| dovetail run –report | -r <db_url> | Package the results directory which can be used to upload to OVP web portal |
| dovetail run –deploy-scenario <deploy_scenario_name> | Specify the deploy scenario having as project name ‘ovs’ |
| dovetail run –no-api-validation | Disable strict API response validation |
| dovetail run –no-clean | -n | Keep all Containers created for debuging |
| dovetail run –stop | -s | Stop immediately when one test case failed |
root@1f230e719e44:~/dovetail/dovetail# dovetail --help
Usage: dovetail [OPTIONS] COMMAND [ARGS]...

Options:
  --version   Show the version and exit.
  -h, --help  Show this message and exit.

Commands:
  list  list the testsuite details
  run   run the testcases
  show  show the testcases details
root@1f230e719e44:~/dovetail/dovetail# dovetail --version
dovetail, version 2018.9.0
root@1f230e719e44:~/dovetail/dovetail# dovetail list --help
Usage: dovetail list [OPTIONS] [TESTSUITE]

  list the testsuite details

Options:
  -h, --help  Show this message and exit.
root@1f230e719e44:~/dovetail/dovetail# dovetail list ovp.2018.09
- mandatory
    functest.vping.userdata
    functest.vping.ssh
    functest.tempest.osinterop
    functest.tempest.compute
    functest.tempest.identity_v3
    functest.tempest.image
    functest.tempest.network_api
    functest.tempest.volume
    functest.tempest.neutron_trunk_ports
    functest.tempest.ipv6_api
    functest.security.patrole
    yardstick.ha.nova_api
    yardstick.ha.neutron_server
    yardstick.ha.keystone
    yardstick.ha.glance_api
    yardstick.ha.cinder_api
    yardstick.ha.cpu_load
    yardstick.ha.disk_load
    yardstick.ha.haproxy
    yardstick.ha.rabbitmq
    yardstick.ha.database
    bottlenecks.stress.ping
- optional
    functest.tempest.ipv6_scenario
    functest.tempest.multi_node_scheduling
    functest.tempest.network_security
    functest.tempest.vm_lifecycle
    functest.tempest.network_scenario
    functest.tempest.bgpvpn
    functest.bgpvpn.subnet_connectivity
    functest.bgpvpn.tenant_separation
    functest.bgpvpn.router_association
    functest.bgpvpn.router_association_floating_ip
    yardstick.ha.neutron_l3_agent
    yardstick.ha.controller_restart
    functest.vnf.vims
    functest.vnf.vepc
    functest.snaps.smoke
root@1f230e719e44:~/dovetail/dovetail# dovetail show --help
Usage: dovetail show [OPTIONS] TESTCASE

  show the testcases details

Options:
  -h, --help  Show this message and exit.
root@1f230e719e44:~/dovetail/dovetail# dovetail show functest.vping.ssh
---
functest.vping.ssh:
  name: functest.vping.ssh
  objective: testing for vping using ssh
  validate:
    type: functest
    testcase: vping_ssh
  report:
    source_archive_files:
      - functest.log
    dest_archive_files:
      - vping_logs/functest.vping.ssh.log
    check_results_file: 'functest_results.txt'
    sub_testcase_list:
root@1f230e719e44:~/dovetail/dovetail# dovetail show functest.tempest.image
---
functest.tempest.image:
  name: functest.tempest.image
  objective: tempest smoke test cases about image
  validate:
    type: functest
    testcase: tempest_custom
    pre_condition:
      - 'cp /home/opnfv/userconfig/pre_config/tempest_conf.yaml /usr/lib/python2.7/site-packages/functest/opnfv_tests/openstack/tempest/custom_tests/tempest_conf.yaml'
      - 'cp /home/opnfv/userconfig/pre_config/testcases.yaml /usr/lib/python2.7/site-packages/xtesting/ci/testcases.yaml'
    pre_copy:
      src_file: tempest_custom.txt
      dest_path: /usr/lib/python2.7/site-packages/functest/opnfv_tests/openstack/tempest/custom_tests/test_list.txt
  report:
    source_archive_files:
      - functest.log
      - tempest_custom/tempest.log
      - tempest_custom/tempest-report.html
    dest_archive_files:
      - tempest_logs/functest.tempest.image.functest.log
      - tempest_logs/functest.tempest.image.log
      - tempest_logs/functest.tempest.image.html
    check_results_file: 'functest_results.txt'
    sub_testcase_list:
      - tempest.api.image.v2.test_images.BasicOperationsImagesTest.test_register_upload_get_image_file[id-139b765e-7f3d-4b3d-8b37-3ca3876ee318,smoke]
      - tempest.api.image.v2.test_versions.VersionsTest.test_list_versions[id-659ea30a-a17c-4317-832c-0f68ed23c31d,smoke]
root@1f230e719e44:~/dovetail/dovetail# dovetail run --help
Usage: run.py [OPTIONS]

Dovetail compliance test entry!

Options:
--deploy-scenario TEXT  Specify the DEPLOY_SCENARIO which will be used as input by each testcase respectively
--optional              Run all optional test cases.
--offline               run in offline method, which means not to update the docker upstream images, functest, yardstick, etc.
-r, --report            Create a tarball file to upload to OVP web portal
-d, --debug             Flag for showing debug log on screen.
--testcase TEXT         Compliance testcase. Specify option multiple times to include multiple test cases.
--testarea TEXT         Compliance testarea within testsuite. Specify option multiple times to include multiple test areas.
-s, --stop              Flag for stopping on test case failure.
-n, --no-clean          Keep all Containers created for debuging.
--no-api-validation     disable strict API response validation
--mandatory             Run all mandatory test cases.
--testsuite TEXT        compliance testsuite.
-h, --help              Show this message and exit.
root@1f230e719e44:~/dovetail/dovetail# dovetail run --testcase functest.vping.ssh --offline -r --deploy-scenario os-nosdn-ovs-ha
2017-10-12 14:57:51,278 - run - INFO - ================================================
2017-10-12 14:57:51,278 - run - INFO - Dovetail compliance: ovp.2018.09!
2017-10-12 14:57:51,278 - run - INFO - ================================================
2017-10-12 14:57:51,278 - run - INFO - Build tag: daily-master-b80bca76-af5d-11e7-879a-0242ac110002
2017-10-12 14:57:51,278 - run - INFO - DEPLOY_SCENARIO : os-nosdn-ovs-ha
2017-10-12 14:57:51,336 - run - WARNING - There is no hosts file /home/dovetail/pre_config/hosts.yaml, may be some issues with domain name resolution.
2017-10-12 14:57:51,336 - run - INFO - Get hardware info of all nodes list in file /home/cvp/pre_config/pod.yaml ...
2017-10-12 14:57:51,336 - run - INFO - Hardware info of all nodes are stored in file /home/cvp/results/all_hosts_info.json.
2017-10-12 14:57:51,517 - run - INFO - >>[testcase]: functest.vping.ssh
2017-10-12 14:58:21,325 - report.Report - INFO - Results have been stored with file /home/cvp/results/functest_results.txt.
2017-10-12 14:58:21,325 - report.Report - INFO -

Dovetail Report
Version: 2018.09
Build Tag: daily-master-b80bca76-af5d-11e7-879a-0242ac110002
Test Date: 2018-08-13 03:23:56 UTC
Duration: 291.92 s

Pass Rate: 0.00% (1/1)
vping:                     pass rate 100%
-functest.vping.ssh        PASS
This document describes how to install and configure Functest in OPNFV.
The high level architecture of Functest within OPNFV can be described as follows:
CIMC/Lights+out management               Admin  Mgmt/API  Public  Storage Private
                                          PXE
+                                           +       +        +       +       +
|                                           |       |        |       |       |
|     +----------------------------+        |       |        |       |       |
|     |                            |        |       |        |       |       |
+-----+       Jumphost             |        |       |        |       |       |
|     |                            |        |       |        |       |       |
|     |   +--------------------+   |        |       |        |       |       |
|     |   |                    |   |        |       |        |       |       |
|     |   | Tools              |   +----------------+        |       |       |
|     |   | - Rally            |   |        |       |        |       |       |
|     |   | - Robot            |   |        |       |        |       |       |
|     |   | - RefStack         |   |        |       |        |       |       |
|     |   |                    |   |-------------------------+       |       |
|     |   | Testcases          |   |        |       |        |       |       |
|     |   | - VIM              |   |        |       |        |       |       |
|     |   |                    |   |        |       |        |       |       |
|     |   | - SDN Controller   |   |        |       |        |       |       |
|     |   |                    |   |        |       |        |       |       |
|     |   | - Features         |   |        |       |        |       |       |
|     |   |                    |   |        |       |        |       |       |
|     |   | - VNF              |   |        |       |        |       |       |
|     |   |                    |   |        |       |        |       |       |
|     |   +--------------------+   |        |       |        |       |       |
|     |     Functest Docker        +        |       |        |       |       |
|     |                            |        |       |        |       |       |
|     |                            |        |       |        |       |       |
|     |                            |        |       |        |       |       |
|     +----------------------------+        |       |        |       |       |
|                                           |       |        |       |       |
|    +----------------+                     |       |        |       |       |
|    |             1  |                     |       |        |       |       |
+----+ +--------------+-+                   |       |        |       |       |
|    | |             2  |                   |       |        |       |       |
|    | | +--------------+-+                 |       |        |       |       |
|    | | |             3  |                 |       |        |       |       |
|    | | | +--------------+-+               |       |        |       |       |
|    | | | |             4  |               |       |        |       |       |
|    +-+ | | +--------------+-+             |       |        |       |       |
|      | | | |             5  +-------------+       |        |       |       |
|      +-+ | |  nodes for     |             |       |        |       |       |
|        | | |  deploying     +---------------------+        |       |       |
|        +-+ |  OPNFV         |             |       |        |       |       |
|          | |                +------------------------------+       |       |
|          +-+     SUT        |             |       |        |       |       |
|            |                +--------------------------------------+       |
|            |                |             |       |        |       |       |
|            |                +----------------------------------------------+
|            +----------------+             |       |        |       |       |
|                                           |       |        |       |       |
+                                           +       +        +       +       +
             SUT = System Under Test
Note connectivity to management network is not needed for most of the testcases. But it may be needed for some specific snaps tests.
All the libraries and dependencies needed by all of the Functest tools are pre-installed into the Docker images. This allows running Functest on any platform.
The automated mechanisms inside the Functest Docker containers will:
- Prepare the environment according to the System Under Test (SUT)
- Perform the appropriate functional tests
- Push the test results into the OPNFV test result database (optional)
The OpenStack credentials file must be provided to the container.
These Docker images can be integrated into CI or deployed independently.
Please note that the Functest Docker images have been designed for OPNFV, however, it would be possible to adapt them to any OpenStack based VIM + controller environment, since most of the test cases are integrated from upstream communities.
The functional test cases are described in the Functest User Guide
The OPNFV deployment is out of the scope of this document but it can be found in http://docs.opnfv.org. The OPNFV platform is considered as the SUT in this document.
Several prerequisites are needed for Functest:
- A Jumphost to run Functest on
- A Docker daemon shall be installed on the Jumphost
- A public/external network created on the SUT
- An admin/management network created on the SUT
- Connectivity from the Jumphost to the SUT public/external network
Some specific SNAPS tests may require a connectivity from the Jumphost to the SUT admin/management network but most of the test cases do not. This requirement can be changed by overriding the ‘interface’ attribute (OS_INTERFACE) value to ‘public’ in the credentials file. Another means to circumvent this issue would be to change the ‘snaps.use_keystone’ value from True to False.
WARNING: Connectivity from Jumphost is essential and it is of paramount importance to make sure it is working before even considering to install and run Functest. Make also sure you understand how your networking is designed to work.
NOTE: Jumphost refers to any server which meets the previous requirements. Normally it is the same server from where the OPNFV deployment has been triggered previously, but it could be any server with proper connectivity to the SUT.
NOTE: If your Jumphost is operating behind a company http proxy and/or firewall, please consult first the section Proxy support, towards the end of this document. The section details some tips/tricks which may be of help in a proxified environment.
Docker installation and configuration is only needed to be done once through the life cycle of Jumphost.
If your Jumphost is based on Ubuntu, SUSE, RHEL or CentOS linux, please consult the references below for more detailed instructions. The commands below are offered as a short reference.
Tip: For running docker containers behind the proxy, you need first some extra configuration which is described in section Docker Installation on CentOS behind http proxy. You should follow that section before installing the docker engine.
Docker installation needs to be done as root user. You may use other userid’s to create and run the actual containers later if so desired. Log on to your Jumphost as root user and install the Docker Engine (e.g. for CentOS family):
curl -sSL https://get.docker.com/ | sh
systemctl start docker

*Tip:* If you are working through proxy, please set the https_proxy
environment variable first before executing the curl command.
Add your user to docker group to be able to run commands without sudo:
sudo usermod -aG docker <your_user>
Some of the tests against the VIM (Virtual Infrastructure Manager) need connectivity through an existing public/external network in order to succeed. This is needed, for example, to create floating IPs to access VM instances through the public/external network (i.e. from the Docker container).
By default, the five OPNFV installers provide a fresh installation with a public/external network created along with a router. Make sure that the public/external subnet is reachable from the Jumphost and an external router exists.
Hint: For the given OPNFV Installer in use, the IP sub-net address used for the public/external network is usually a planning item and should thus be known. Ensure you can reach each node in the SUT, from the Jumphost using the ‘ping’ command using the respective IP address on the public/external network for each node in the SUT. The details of how to determine the needed IP addresses for each node in the SUT may vary according to the used installer and are therefore ommitted here.
Alpine containers have been introduced in Euphrates. Alpine allows Functest testing in several very light containers and thanks to the refactoring on dependency management should allow the creation of light and fully customized docker images.
Docker images are available on the dockerhub:
- opnfv/functest-core
- opnfv/functest-healthcheck
- opnfv/functest-smoke
- opnfv/functest-benchmarking
- opnfv/functest-features
- opnfv/functest-components
- opnfv/functest-vnf
cat env:
EXTERNAL_NETWORK=XXX
DEPLOY_SCENARIO=XXX  # if not os-nosdn-nofeature-noha scenario
NAMESERVER=XXX  # if not 8.8.8.8
See section on environment variables for details.
cat env_file:
export OS_AUTH_URL=XXX
export OS_USER_DOMAIN_NAME=XXX
export OS_PROJECT_DOMAIN_NAME=XXX
export OS_USERNAME=XXX
export OS_PROJECT_NAME=XXX
export OS_PASSWORD=XXX
export OS_IDENTITY_API_VERSION=3
See section on OpenStack credentials for details.
Create a directory for the different images (attached as a Docker volume):
mkdir -p images && wget -q -O- https://git.opnfv.org/functest/plain/functest/ci/download_images.sh?h=stable/fraser | bash -s -- images && ls -1 images/*

images/CentOS-7-aarch64-GenericCloud.qcow2
images/CentOS-7-aarch64-GenericCloud.qcow2.xz
images/CentOS-7-x86_64-GenericCloud.qcow2
images/cirros-0.4.0-x86_64-disk.img
images/cirros-0.4.0-x86_64-lxc.tar.gz
images/cloudify-manager-premium-4.0.1.qcow2
images/shaker-image-arm64.qcow2
images/shaker-image.qcow
images/ubuntu-14.04-server-cloudimg-amd64-disk1.img
images/ubuntu-14.04-server-cloudimg-arm64-uefi1.img
images/ubuntu-16.04-server-cloudimg-amd64-disk1.img
images/vyos-1.1.7.img
Run healthcheck suite:
sudo docker run --env-file env \
    -v $(pwd)/openstack.creds:/home/opnfv/functest/conf/env_file \
    -v $(pwd)/images:/home/opnfv/functest/images \
    opnfv/functest-healthcheck
Results shall be displayed as follows:
+----------------------------+------------------+---------------------+------------------+----------------+
|         TEST CASE          |     PROJECT      |         TIER        |     DURATION     |     RESULT     |
+----------------------------+------------------+---------------------+------------------+----------------+
|      connection_check      |     functest     |     healthcheck     |      00:09       |      PASS      |
|       tenantnetwork1       |     functest     |     healthcheck     |      00:14       |      PASS      |
|       tenantnetwork2       |     functest     |     healthcheck     |      00:11       |      PASS      |
|          vmready1          |     functest     |     healthcheck     |      00:19       |      PASS      |
|          vmready2          |     functest     |     healthcheck     |      00:16       |      PASS      |
|         singlevm1          |     functest     |     healthcheck     |      00:41       |      PASS      |
|         singlevm2          |     functest     |     healthcheck     |      00:36       |      PASS      |
|         vping_ssh          |     functest     |     healthcheck     |      00:46       |      PASS      |
|       vping_userdata       |     functest     |     healthcheck     |      00:41       |      PASS      |
|        cinder_test         |     functest     |     healthcheck     |      01:18       |      PASS      |
|         api_check          |     functest     |     healthcheck     |      10:33       |      PASS      |
|     snaps_health_check     |     functest     |     healthcheck     |      00:44       |      PASS      |
|            odl             |     functest     |     healthcheck     |      00:00       |      SKIP      |
+----------------------------+------------------+---------------------+------------------+----------------+
NOTE: the duration is a reference and it might vary depending on your SUT.
Run smoke suite:
sudo docker run --env-file env \
    -v $(pwd)/openstack.creds:/home/opnfv/functest/conf/env_file \
    -v $(pwd)/images:/home/opnfv/functest/images \
    opnfv/functest-smoke
Results shall be displayed as follows:
+------------------------------------+------------------+---------------+------------------+----------------+
|             TEST CASE              |     PROJECT      |      TIER     |     DURATION     |     RESULT     |
+------------------------------------+------------------+---------------+------------------+----------------+
|           tempest_smoke            |     functest     |     smoke     |      06:13       |      PASS      |
|     neutron-tempest-plugin-api     |     functest     |     smoke     |      09:32       |      PASS      |
|            rally_sanity            |     functest     |     smoke     |      29:34       |      PASS      |
|             rally_jobs             |     functest     |     smoke     |      24:02       |      PASS      |
|          refstack_defcore          |     functest     |     smoke     |      13:07       |      PASS      |
|              patrole               |     functest     |     smoke     |      05:17       |      PASS      |
|            snaps_smoke             |     functest     |     smoke     |      90:13       |      PASS      |
|           neutron_trunk            |     functest     |     smoke     |      00:00       |      SKIP      |
|         networking-bgpvpn          |     functest     |     smoke     |      00:00       |      SKIP      |
|           networking-sfc           |     functest     |     smoke     |      00:00       |      SKIP      |
|              barbican              |     functest     |     smoke     |      05:01       |      PASS      |
+------------------------------------+------------------+---------------+------------------+----------------+
Note: if the scenario does not support some tests, they are indicated as SKIP. See User guide for details.
Run benchmarking suite:
sudo docker run --env-file env \
    -v $(pwd)/openstack.creds:/home/opnfv/functest/conf/env_file \
    -v $(pwd)/images:/home/opnfv/functest/images \
    opnfv/functest-benchmarking
Results shall be displayed as follows:
+-------------------+------------------+----------------------+------------------+----------------+
|     TEST CASE     |     PROJECT      |         TIER         |     DURATION     |     RESULT     |
+-------------------+------------------+----------------------+------------------+----------------+
|        vmtp       |     functest     |     benchmarking     |      18:43       |      PASS      |
|       shaker      |     functest     |     benchmarking     |      29:45       |      PASS      |
+-------------------+------------------+----------------------+------------------+----------------+
Note: if the scenario does not support some tests, they are indicated as SKIP. See User guide for details.
Run features suite:
sudo docker run --env-file env \
    -v $(pwd)/openstack.creds:/home/opnfv/functest/conf/env_file \
    -v $(pwd)/images:/home/opnfv/functest/images \
    opnfv/functest-features
Results shall be displayed as follows:
+-----------------------------+------------------------+------------------+------------------+----------------+
|          TEST CASE          |        PROJECT         |       TIER       |     DURATION     |     RESULT     |
+-----------------------------+------------------------+------------------+------------------+----------------+
|     doctor-notification     |         doctor         |     features     |      00:00       |      SKIP      |
|            bgpvpn           |         sdnvpn         |     features     |      00:00       |      SKIP      |
|       functest-odl-sfc      |          sfc           |     features     |      00:00       |      SKIP      |
|      barometercollectd      |       barometer        |     features     |      00:00       |      SKIP      |
|             fds             |     fastdatastacks     |     features     |      00:00       |      SKIP      |
|             vgpu            |        functest        |     features     |      00:00       |      SKIP      |
|         stor4nfv_os         |        stor4nfv        |     features     |      00:00       |      SKIP      |
+-----------------------------+------------------------+------------------+------------------+----------------+
Note: if the scenario does not support some tests, they are indicated as SKIP. See User guide for details.
Run components suite:
sudo docker run --env-file env \
    -v $(pwd)/openstack.creds:/home/opnfv/functest/conf/env_file \
    -v $(pwd)/images:/home/opnfv/functest/images \
    opnfv/functest-components
Results shall be displayed as follows:
+--------------------------+------------------+--------------------+------------------+----------------+
|        TEST CASE         |     PROJECT      |        TIER        |     DURATION     |     RESULT     |
+--------------------------+------------------+--------------------+------------------+----------------+
|       tempest_full       |     functest     |     components     |      49:51       |      PASS      |
|     tempest_scenario     |     functest     |     components     |      18:50       |      PASS      |
|        rally_full        |     functest     |     components     |      167:13      |      PASS      |
+--------------------------+------------------+--------------------+------------------+----------------+
Run vnf suite:
sudo docker run --env-file env \
    -v $(pwd)/openstack.creds:/home/opnfv/functest/conf/env_file \
    -v $(pwd)/images:/home/opnfv/functest/images \
    opnfv/functest-vnf
Results shall be displayed as follows:
+----------------------+------------------+--------------+------------------+----------------+
|      TEST CASE       |     PROJECT      |     TIER     |     DURATION     |     RESULT     |
+----------------------+------------------+--------------+------------------+----------------+
|       cloudify       |     functest     |     vnf      |      04:05       |      PASS      |
|     cloudify_ims     |     functest     |     vnf      |      24:07       |      PASS      |
|       heat_ims       |     functest     |     vnf      |      18:15       |      PASS      |
|     vyos_vrouter     |     functest     |     vnf      |      15:48       |      PASS      |
|       juju_epc       |     functest     |     vnf      |      29:38       |      PASS      |
+----------------------+------------------+--------------+------------------+----------------+
Docker images are available on the dockerhub:
- opnfv/functest-kubernetes-core
- opnfv/functest-kubernetest-healthcheck
- opnfv/functest-kubernetest-smoke
- opnfv/functest-kubernetest-features
Run healthcheck suite:
sudo docker run -it --env-file env \
    -v $(pwd)/config:/root/.kube/config \
    opnfv/functest-kubernetes-healthcheck
A config file in the current dir ‘config’ is also required, which should be volume mapped to ~/.kube/config inside kubernetes container.
Results shall be displayed as follows:
+-------------------+------------------+---------------------+------------------+----------------+
|     TEST CASE     |     PROJECT      |         TIER        |     DURATION     |     RESULT     |
+-------------------+------------------+---------------------+------------------+----------------+
|     k8s_smoke     |     functest     |     healthcheck     |      02:27       |      PASS      |
+-------------------+------------------+---------------------+------------------+----------------+
Run smoke suite:
sudo docker run -it --env-file env \
    -v $(pwd)/config:/root/.kube/config \
    opnfv/functest-kubernetes-smoke
Results shall be displayed as follows:
+-------------------------+------------------+---------------+------------------+----------------+
|        TEST CASE        |     PROJECT      |      TIER     |     DURATION     |     RESULT     |
+-------------------------+------------------+---------------+------------------+----------------+
|     k8s_conformance     |     functest     |     smoke     |      57:14       |      PASS      |
+-------------------------+------------------+---------------+------------------+----------------+
Run features suite:
sudo docker run -it --env-file env \
    -v $(pwd)/config:/root/.kube/config \
    opnfv/functest-kubernetes-features
Results shall be displayed as follows:
+----------------------+------------------+------------------+------------------+----------------+
|      TEST CASE       |     PROJECT      |       TIER       |     DURATION     |     RESULT     |
+----------------------+------------------+------------------+------------------+----------------+
|     stor4nfv_k8s     |     stor4nfv     |     stor4nfv     |      00:00       |      SKIP      |
|      clover_k8s      |      clover      |      clover      |      00:00       |      SKIP      |
+----------------------+------------------+------------------+------------------+----------------+
Several environement variables may be specified:
- INSTALLER_IP=<Specific IP Address>
- DEPLOY_SCENARIO=<vim>-<controller>-<nfv_feature>-<ha_mode>
- NAMESERVER=XXX # if not 8.8.8.8
- VOLUME_DEVICE_NAME=XXX # if not vdb
- EXTERNAL_NETWORK=XXX # if not first network with router:external=True
- NEW_USER_ROLE=XXX # if not member
INSTALLER_IP is required by Barometer in order to access the installer node and the deployment.
If several features are pertinent then use the underscore character ‘_’ to separate each feature (e.g. ovs_kvm). ‘nofeature’ indicates that no OPNFV feature is deployed.
The list of supported scenarios per release/installer is indicated in the release note.
NOTE: The scenario name is mainly used to automatically detect if a test suite is runnable or not (e.g. it will prevent ODL test suite to be run on ‘nosdn’ scenarios). If not set, Functest will try to run the default test cases that might not include SDN controller or a specific feature.
NOTE: An HA scenario means that 3 OpenStack controller nodes are deployed. It does not necessarily mean that the whole system is HA. See installer release notes for details.
Finally, three additional environment variables can also be passed in to the Functest Docker Container, using the -e “<EnvironmentVariable>=<Value>” mechanism. The first two parameters are only relevant to Jenkins CI invoked testing and should not be used when performing manual test scenarios:
- INSTALLER_TYPE=(apex|compass|daisy|fuel)
- NODE_NAME=<Test POD Name>
- BUILD_TAG=<Jenkins Build Tag>
where:
- <Test POD Name> = Symbolic name of the POD where the tests are run.
Visible in test results files, which are stored to the database. This option is only used when tests are activated under Jenkins CI control. It indicates the POD/hardware where the test has been run. If not specified, then the POD name is defined as “Unknown” by default. DO NOT USE THIS OPTION IN MANUAL TEST SCENARIOS.
- <Jenkins Build tag> = Symbolic name of the Jenkins Build Job.
Visible in test results files, which are stored to the database. This option is only set when tests are activated under Jenkins CI control. It enables the correlation of test results, which are independently pushed to the results database from different Jenkins jobs. DO NOT USE THIS OPTION IN MANUAL TEST SCENARIOS.
OpenStack credentials are mandatory and must be provided to Functest. When running the command “functest env prepare”, the framework will automatically look for the Openstack credentials file “/home/opnfv/functest/conf/env_file” and will exit with error if it is not present or is empty.
There are 2 ways to provide that file:
- by using a Docker volume with -v option when creating the Docker container. This is referred to in docker documentation as “Bind Mounting”. See the usage of this parameter in the following chapter.
- or creating manually the file ‘/home/opnfv/functest/conf/env_file’ inside the running container and pasting the credentials in it. Consult your installer guide for further details. This is however not instructed in this document.
In proxified environment you may need to change the credentials file. There are some tips in chapter: Proxy support
If you need to connect to a server that is TLS-enabled (the auth URL begins with “https”) and it uses a certificate from a private CA or a self-signed certificate, then you will need to specify the path to an appropriate CA certificate to use, to validate the server certificate with the environment variable OS_CACERT:
echo $OS_CACERT
/etc/ssl/certs/ca.crt
However, this certificate does not exist in the container by default. It has to be copied manually from the OpenStack deployment. This can be done in 2 ways:
Create manually that file and copy the contents from the OpenStack controller.
(Recommended) Add the file using a Docker volume when starting the container:
-v <path_to_your_cert_file>:/etc/ssl/certs/ca.cert
You might need to export OS_CACERT environment variable inside the credentials file:
export OS_CACERT=/etc/ssl/certs/ca.crt
Certificate verification can be turned off using OS_INSECURE=true. For example, Fuel uses self-signed cacerts by default, so an pre step would be:
export OS_INSECURE=true
By default all the logs are put un /home/opnfv/functest/results/functest.log. If you want to have more logs in console, you may edit the logging.ini file manually. Connect on the docker then edit the file located in /usr/lib/python2.7/site-packages/xtesting/ci/logging.ini
Change wconsole to console in the desired module to get more traces.
You may also directly modify the python code or the configuration file (e.g. testcases.yaml used to declare test constraints) under /usr/lib/python2.7/site-packages/xtesting and /usr/lib/python2.7/site-packages/functest
When typing exit in the container prompt, this will cause exiting the container and probably stopping it. When stopping a running Docker container all the changes will be lost, there is a keyboard shortcut to quit the container without stopping it: <CTRL>-P + <CTRL>-Q. To reconnect to the running container DO NOT use the run command again (since it will create a new container), use the exec or attach command instead:
docker ps  # <check the container ID from the output>
docker exec -ti <CONTAINER_ID> /bin/bash
There are other useful Docker commands that might be needed to manage possible issues with the containers.
List the running containers:
docker ps
List all the containers including the stopped ones:
docker ps -a
Start a stopped container named “FunTest”:
docker start FunTest
Attach to a running container named “StrikeTwo”:
docker attach StrikeTwo
It is useful sometimes to remove a container if there are some problems:
docker rm <CONTAINER_ID>
Use the -f option if the container is still running, it will force to destroy it:
docker rm -f <CONTAINER_ID>
Check the Docker documentation [dockerdocs] for more information.
It is recommended and fairly straightforward to check that Openstack and credentials are working as expected.
Once the credentials are there inside the container, they should be sourced before running any Openstack commands:
source /home/opnfv/functest/conf/env_file
After this, try to run any OpenStack command to see if you get any output, for instance:
openstack user list
This will return a list of the actual users in the OpenStack deployment. In any other case, check that the credentials are sourced:
env|grep OS_
This command must show a set of environment variables starting with OS_, for example:
OS_REGION_NAME=RegionOne
OS_USER_DOMAIN_NAME=Default
OS_PROJECT_NAME=admin
OS_AUTH_VERSION=3
OS_IDENTITY_API_VERSION=3
OS_PASSWORD=da54c27ae0d10dfae5297e6f0d6be54ebdb9f58d0f9dfc
OS_AUTH_URL=http://10.1.0.9:5000/v3
OS_USERNAME=admin
OS_TENANT_NAME=admin
OS_ENDPOINT_TYPE=internalURL
OS_INTERFACE=internalURL
OS_NO_CACHE=1
OS_PROJECT_DOMAIN_NAME=Default
If the OpenStack command still does not show anything or complains about connectivity issues, it could be due to an incorrect url given to the OS_AUTH_URL environment variable. Check the deployment settings.
If your Jumphost node is operating behind a http proxy, then there are 2 places where some special actions may be needed to make operations succeed:
- Initial installation of docker engine First, try following the official Docker documentation for Proxy settings. Some issues were experienced on CentOS 7 based Jumphost. Some tips are documented in section: Docker Installation on CentOS behind http proxy below.
If that is the case, make sure the resolv.conf and the needed http_proxy and https_proxy environment variables, as well as the ‘no_proxy’ environment variable are set correctly:
# Make double sure that the 'no_proxy=...' line in the
# 'env_file' file is commented out first. Otherwise, the
# values set into the 'no_proxy' environment variable below will
# be ovewrwritten, each time the command
# 'source ~/functest/conf/env_file' is issued.

cd ~/functest/conf/
sed -i 's/export no_proxy/#export no_proxy/' env_file
source ./env_file

# Next calculate some IP addresses for which http_proxy
# usage should be excluded:

publicURL_IP=$(echo $OS_AUTH_URL | grep -Eo "([0-9]+\.){3}[0-9]+")

adminURL_IP=$(openstack catalog show identity | \
grep adminURL | grep -Eo "([0-9]+\.){3}[0-9]+")

export http_proxy="<your http proxy settings>"
export https_proxy="<your https proxy settings>"
export no_proxy="127.0.0.1,localhost,$publicURL_IP,$adminURL_IP"

# Ensure that "git" uses the http_proxy
# This may be needed if your firewall forbids SSL based git fetch
git config --global http.sslVerify True
git config --global http.proxy <Your http proxy settings>
For example, try to use the nc command from inside the functest docker container:
nc -v opnfv.org 80
Connection to opnfv.org 80 port [tcp/http] succeeded!

nc -v opnfv.org 443
Connection to opnfv.org 443 port [tcp/https] succeeded!
Note: In a Jumphost node based on the CentOS family OS, the nc commands might not work. You can use the curl command instead.
<HTML><HEAD><meta http-equiv=”content-type” . . </BODY></HTML>
curl https://www.opnfv.org:443
<HTML><HEAD><meta http-equiv=”content-type” . . </BODY></HTML>
(Ignore the content. If command returns a valid HTML page, it proves the connection.)
This section is applicable for CentOS family OS on Jumphost which itself is behind a proxy server. In that case, the instructions below should be followed before installing the docker engine:
1) # Make a directory '/etc/systemd/system/docker.service.d'
   # if it does not exist
   sudo mkdir /etc/systemd/system/docker.service.d

2) # Create a file called 'env.conf' in that directory with
   # the following contents:
   [Service]
   EnvironmentFile=-/etc/sysconfig/docker

3) # Set up a file called 'docker' in directory '/etc/sysconfig'
   # with the following contents:
   HTTP_PROXY="<Your http proxy settings>"
   HTTPS_PROXY="<Your https proxy settings>"
   http_proxy="${HTTP_PROXY}"
   https_proxy="${HTTPS_PROXY}"

4) # Reload the daemon
   systemctl daemon-reload

5) # Sanity check - check the following docker settings:
   systemctl show docker | grep -i env

   Expected result:
   ----------------
   EnvironmentFile=/etc/sysconfig/docker (ignore_errors=yes)
   DropInPaths=/etc/systemd/system/docker.service.d/env.conf
Now follow the instructions in [Install Docker on CentOS] to download and install the docker-engine. The instructions conclude with a “test pull” of a sample “Hello World” docker container. This should now work with the above pre-requisite actions.
In CI we use the Docker images and execute the appropriate commands within the container from Jenkins.
See [2] for details.
The goal of this document is to describe the OPNFV Functest test cases and to provide a procedure to execute them.
IMPORTANT: It is assumed here that Functest has been properly deployed following the installation guide procedure Functest Installation Guide.
Functest is the OPNFV project primarily targeting functional testing. In the Continuous Integration pipeline, it is launched after an OPNFV fresh installation to validate and verify the basic functions of the infrastructure.
Functest test suites are also distributed in the OPNFV testing categories: healthcheck, smoke, features, components, performance, VNF, Stress tests.
All the Healthcheck and smoke tests of a given scenario must be succesful to validate the scenario for the release.
| Domain | Tier | Test case | Comments |
|---|---|---|---|
| VIM | healthcheck | connection _check | Check OpenStack connectivity through SNAPS framework |
| api_check | Check OpenStack API through SNAPS framework | ||
| snaps _health _check | basic instance creation, check DHCP | ||
| smoke | vping_ssh | NFV “Hello World” using an SSH connection to a destination VM over a created floating IP address on the SUT Public / External network. Using the SSH connection a test script is then copied to the destination VM and then executed via SSH. The script will ping another VM on a specified IP address over the SUT Private Tenant network | |
| vping _userdata | Uses Ping with given userdata to test intra-VM connectivity over the SUT Private Tenant network. The correct operation of the NOVA Metadata service is also verified in this test | ||
| tempest _smoke | Generate and run a relevant Tempest Test Suite in smoke mode. The generated test set is dependent on the OpenStack deployment environment | ||
| rally _sanity | Run a subset of the OpenStack Rally Test Suite in smoke mode | ||
| snaps_smoke | Run the SNAPS-OO integration tests | ||
| refstack _defcore | Reference RefStack suite tempest selection for NFV | ||
| patrole | Patrole is a tempest plugin for testing and verifying RBAC policy enforcement, which offers testing for the following OpenStack services: Nova, Neutron, Glance, Cinder and Keystone | ||
| neutron _trunk | The neutron trunk port testcases have been introduced and they are supported by installers : Apex, Fuel and Compass. | ||
| components | tempest _full _parallel | Generate and run a full set of the OpenStack Tempest Test Suite. See the OpenStack reference test suite [2]. The generated test set is dependent on the OpenStack deployment environment | |
| rally_full | Run the OpenStack testing tool benchmarking OpenStack modules See the Rally documents [3] | ||
| Controllers | smoke | odl | Opendaylight Test suite Limited test suite to check the basic neutron (Layer 2) operations mainly based on upstream testcases. See below for details |
| Features | features | bgpvpn | Implementation of the OpenStack bgpvpn API from the SDNVPN feature project. It allows for the creation of BGP VPNs. See SDNVPN User Guide for details |
| doctor | Doctor platform, as of Colorado release, provides the three features: * Immediate Notification * Consistent resource state awareness for compute host down * Valid compute host status given to VM owner See Doctor User Guide for details | ||
| odl-sfc | SFC testing for odl scenarios See SFC User Guide for details | ||
| parser | Parser is an integration project which aims to provide placement/deployment templates translation for OPNFV platform, including TOSCA -> HOT, POLICY -> TOSCA and YANG -> TOSCA. it deals with a fake vRNC. See Parser User Guide for details | ||
| fds | Test Suite for the OpenDaylight SDN Controller when the GBP features are installed. It integrates some test suites from upstream using Robot as the test framework | ||
| VNF | vnf | cloudify _ims | Example of a real VNF deployment to show the NFV capabilities of the platform. The IP Multimedia Subsytem is a typical Telco test case, referenced by ETSI. It provides a fully functional VoIP System |
| vyos _vrouter | vRouter testing | ||
| juju_epc | Validates deployment of a complex mobility VNF on OPNFV Platform. Uses Juju for deploying the OAI EPC and ABot for defining test scenarios using high-level DSL. VNF tests reference 3GPP Technical Specs and are executed through protocol drivers provided by ABot. | ||
| Kubernetes | healthcheck | k8s_smoke | Test a running Kubernetes cluster and ensure it satisfies minimal functional requirements |
| smoke | k8s_ conformance | Run a subset of Kubernetes End-to-End tests, expected to pass on any Kubernetes cluster | |
| stor4nfv | stor4nfv _k8s | Run tests necessary to demonstrate conformance of the K8s+Stor4NFV deployment | |
| clover | clover_k8s | Test functionality of K8s+Istio+Clover deployment. |
As shown in the above table, Functest is structured into different ‘domains’, ‘tiers’ and ‘test cases’. Each ‘test case’ usually represents an actual ‘Test Suite’ comprised -in turn- of several test cases internally.
Test cases also have an implicit execution order. For example, if the early ‘healthcheck’ Tier testcase fails, or if there are any failures in the ‘smoke’ Tier testcases, there is little point to launch a full testcase execution round.
In Danube, we merged smoke and sdn controller tiers in smoke tier.
An overview of the Functest Structural Concept is depicted graphically below:
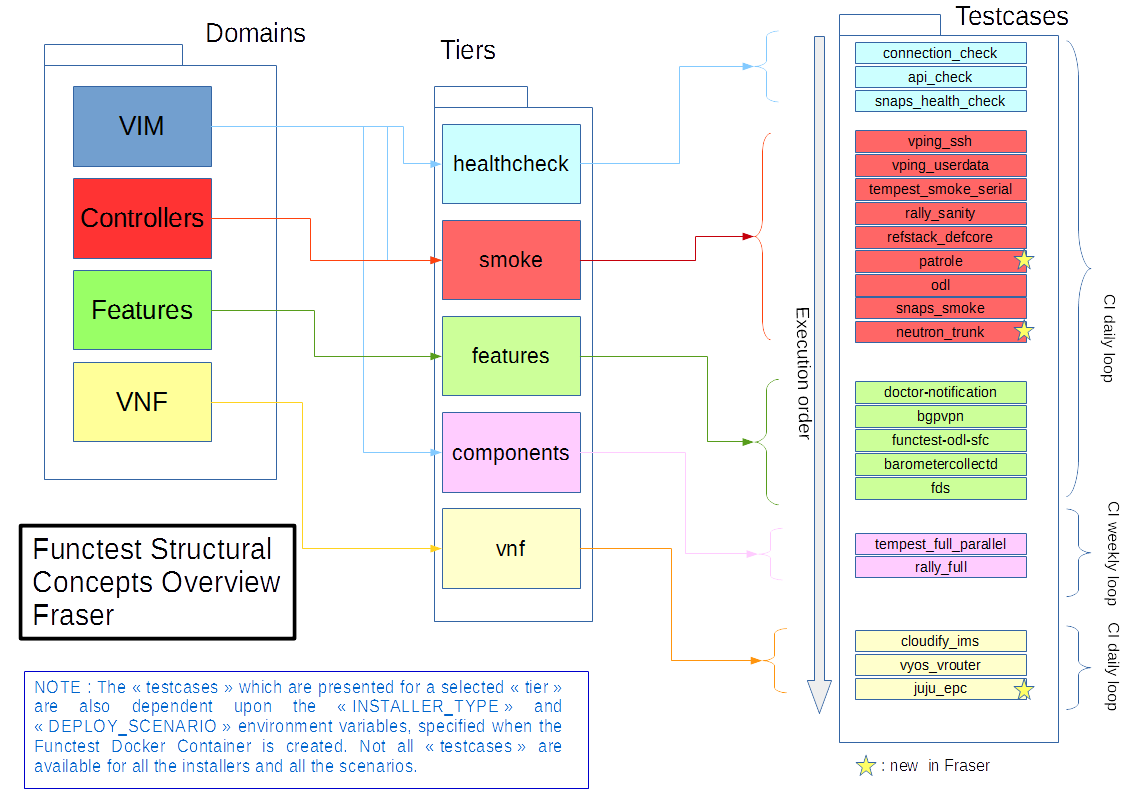
Some of the test cases are developed by Functest team members, whereas others are integrated from upstream communities or other OPNFV projects. For example, Tempest is the OpenStack integration test suite and Functest is in charge of the selection, integration and automation of those tests that fit suitably to OPNFV.
The Tempest test suite is the default OpenStack smoke test suite but no new test cases have been created in OPNFV Functest.
The results produced by the tests run from CI are pushed and collected into a NoSQL database. The goal is to populate the database with results from different sources and scenarios and to show them on a Functest Dashboard. A screenshot of a live Functest Dashboard is shown below:
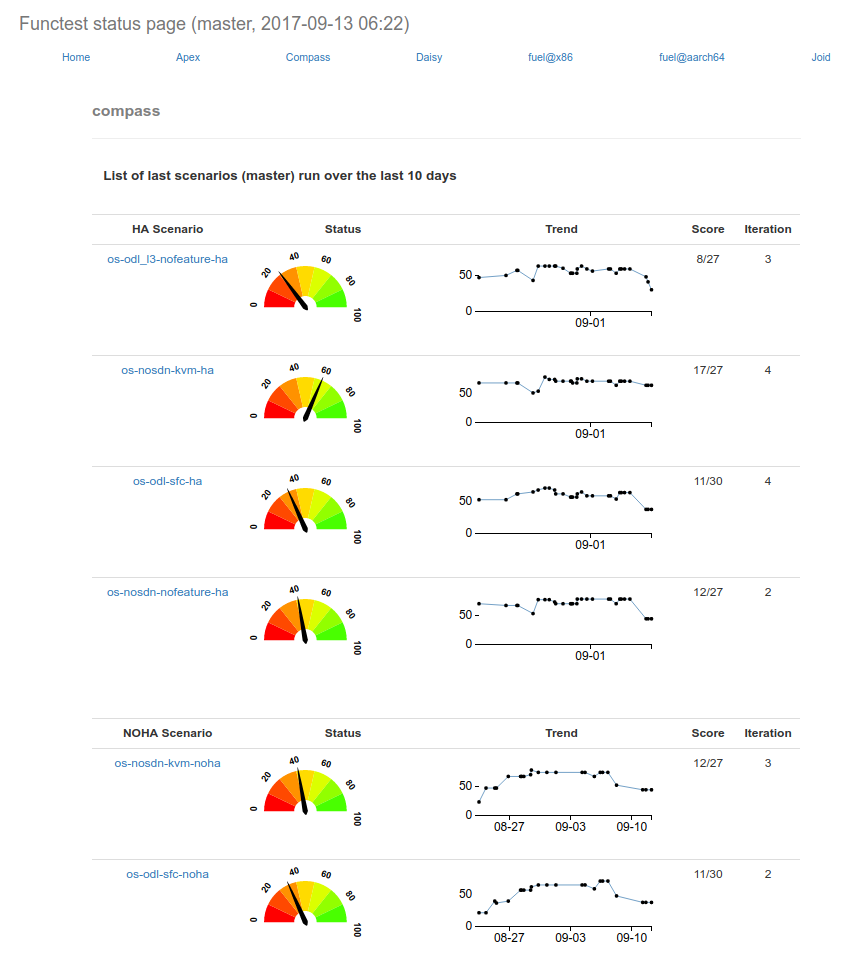
Basic components (VIM, SDN controllers) are tested through their own suites. Feature projects also provide their own test suites with different ways of running their tests.
The notion of domain has been introduced in the description of the test cases stored in the Database. This parameters as well as possible tags can be used for the Test case catalog.
vIMS test case was integrated to demonstrate the capability to deploy a relatively complex NFV scenario on top of the OPNFV infrastructure.
Functest considers OPNFV as a black box. OPNFV offers a lot of potential combinations (which may change from one version to another):
- 3 controllers (OpenDaylight, ONOS, OpenContrail)
- 5 installers (Apex, Compass, Daisy, Fuel, Joid)
Most of the tests are runnable by any combination, but some tests might have restrictions imposed by the utilized installers or due to the available deployed features. The system uses the environment variables (INSTALLER_TYPE and DEPLOY_SCENARIO) to automatically determine the valid test cases, for each given environment.
A convenience Functest CLI utility is also available to simplify setting up the Functest evironment, management of the OpenStack environment (e.g. resource clean-up) and for executing tests. The Functest CLI organised the testcase into logical Tiers, which contain in turn one or more testcases. The CLI allows execution of a single specified testcase, all test cases in a specified Tier, or the special case of execution of ALL testcases. The Functest CLI is introduced in more details in next section.
The different test cases are described in the remaining sections of this document.
Since Danube, healthcheck tests have been refactored and rely on SNAPS, an OPNFV middleware project.
SNAPS stands for “SDN/NFV Application development Platform and Stack”. SNAPS is an object-oriented OpenStack library packaged with tests that exercise OpenStack. More information on SNAPS can be found in [13]
Three tests are declared as healthcheck tests and can be used for gating by the installer, they cover functionally the tests previously done by healthcheck test case.
The tests are:
- connection_check
- api_check
- snaps_health_check
Connection_check consists in 9 test cases (test duration < 5s) checking the connectivity with Glance, Keystone, Neutron, Nova and the external network.
Api_check verifies the retrieval of OpenStack clients: Keystone, Glance, Neutron and Nova and may perform some simple queries. When the config value of snaps.use_keystone is True, functest must have access to the cloud’s private network. This suite consists in 49 tests (test duration < 2 minutes).
Snaps_health_check creates a VM with a single port with an IPv4 address that is assigned by DHCP and then validates the expected IP with the actual.
The flavors for the SNAPS test cases are able to be configured giving new metadata values as well as new values for the basic elements of flavor (i.e. ram, vcpu, disk, ephemeral, swap etc). The snaps.flavor_extra_specs dict in the config_functest.yaml file could be used for this purpose.
Self-obviously, successful completion of the ‘healthcheck’ testcase is a necessary pre-requisite for the execution of all other test Tiers.
Given the script ping.sh:
#!/bin/sh
ping -c 1 $1 2>&1 >/dev/null
RES=$?
if [ "Z$RES" = "Z0" ] ; then
    echo 'vPing OK'
else
    echo 'vPing KO'
fi
The goal of this test is to establish an SSH connection using a floating IP on the Public/External network and verify that 2 instances can talk over a Private Tenant network:
vPing_ssh test case
+-------------+                    +-------------+
|             |                    |             |
|             | Boot VM1 with IP1  |             |
|             +------------------->|             |
|   Tester    |                    |   System    |
|             | Boot VM2           |    Under    |
|             +------------------->|     Test    |
|             |                    |             |
|             | Create floating IP |             |
|             +------------------->|             |
|             |                    |             |
|             | Assign floating IP |             |
|             | to VM2             |             |
|             +------------------->|             |
|             |                    |             |
|             | Establish SSH      |             |
|             | connection to VM2  |             |
|             | through floating IP|             |
|             +------------------->|             |
|             |                    |             |
|             | SCP ping.sh to VM2 |             |
|             +------------------->|             |
|             |                    |             |
|             | VM2 executes       |             |
|             | ping.sh to VM1     |             |
|             +------------------->|             |
|             |                    |             |
|             |    If ping:        |             |
|             |      exit OK       |             |
|             |    else (timeout): |             |
|             |      exit Failed   |             |
|             |                    |             |
+-------------+                    +-------------+
This test can be considered as an “Hello World” example. It is the first basic use case which must work on any deployment.
This test case is similar to vPing_ssh but without the use of Floating IPs and the Public/External network to transfer the ping script. Instead, it uses Nova metadata service to pass it to the instance at booting time. As vPing_ssh, it checks that 2 instances can talk to each other on a Private Tenant network:
vPing_userdata test case
+-------------+                     +-------------+
|             |                     |             |
|             | Boot VM1 with IP1   |             |
|             +-------------------->|             |
|             |                     |             |
|             | Boot VM2 with       |             |
|             | ping.sh as userdata |             |
|             | with IP1 as $1.     |             |
|             +-------------------->|             |
|   Tester    |                     |   System    |
|             | VM2 executes ping.sh|    Under    |
|             | (ping IP1)          |     Test    |
|             +-------------------->|             |
|             |                     |             |
|             | Monitor nova        |             |
|             |  console-log VM 2   |             |
|             |    If ping:         |             |
|             |      exit OK        |             |
|             |    else (timeout)   |             |
|             |      exit Failed    |             |
|             |                     |             |
+-------------+                     +-------------+
When the second VM boots it will execute the script passed as userdata automatically. The ping will be detected by periodically capturing the output in the console-log of the second VM.
Tempest [2] is the reference OpenStack Integration test suite. It is a set of integration tests to be run against a live OpenStack cluster. Tempest has suites of tests for:
- OpenStack API validation
- Scenarios
- Other specific tests useful in validating an OpenStack deployment
Functest uses Rally [3] to run the Tempest suite. Rally generates automatically the Tempest configuration file tempest.conf. Before running the actual test cases, Functest creates the needed resources (user, tenant) and updates the appropriate parameters into the configuration file.
When the Tempest suite is executed, each test duration is measured and the full console output is stored to a log file for further analysis.
The Tempest testcases are distributed across three Tiers:
- Smoke Tier - Test Case ‘tempest_smoke’
- Components Tier - Test case ‘tempest_full’
- Neutron Trunk Port - Test case ‘neutron_trunk’
- OpenStack interop testcases - Test case ‘refstack_defcore’
- Testing and verifying RBAC policy enforcement - Test case ‘patrole’
NOTE: Test case ‘tempest_smoke’ executes a defined set of tempest smoke tests. Test case ‘tempest_full’ executes all defined Tempest tests.
NOTE: The ‘neutron_trunk’ test set allows to connect a VM to multiple VLAN separated networks using a single NIC. The feature neutron trunk ports have been supported by Apex, Fuel and Compass, so the tempest testcases have been integrated normally.
NOTE: Rally is also used to run Openstack Interop testcases [9], which focus on testing interoperability between OpenStack clouds.
NOTE: Patrole is a tempest plugin for testing and verifying RBAC policy enforcement. It runs Tempest-based API tests using specified RBAC roles, thus allowing deployments to verify that only intended roles have access to those APIs. Patrole currently offers testing for the following OpenStack services: Nova, Neutron, Glance, Cinder and Keystone. Currently in functest, only neutron and glance are tested.
The goal of the Tempest test suite is to check the basic functionalities of the different OpenStack components on an OPNFV fresh installation, using the corresponding REST API interfaces.
Rally [3] is a benchmarking tool that answers the question:
How does OpenStack work at scale?
The goal of this test suite is to benchmark all the different OpenStack modules and get significant figures that could help to define Telco Cloud KPIs.
The OPNFV Rally scenarios are based on the collection of the actual Rally scenarios:
- authenticate
- cinder
- glance
- heat
- keystone
- neutron
- nova
- quotas
A basic SLA (stop test on errors) has been implemented.
The Rally testcases are distributed across two Tiers:
- Smoke Tier - Test Case ‘rally_sanity’
- Components Tier - Test case ‘rally_full’
NOTE: Test case ‘rally_sanity’ executes a limited number of Rally smoke test cases. Test case ‘rally_full’ executes the full defined set of Rally tests.
This test case contains tests that setup and destroy environments with VMs with and without Floating IPs with a newly created user and project. Set the config value snaps.use_floating_ips (True|False) to toggle this functionality. Please note that When the configuration value of snaps.use_keystone is True, Functest must have access the cloud’s private network. This suite consists in 120 tests (test duration ~= 50 minutes)
The flavors for the SNAPS test cases are able to be configured giving new metadata values as well as new values for the basic elements of flavor (i.e. ram, vcpu, disk, ephemeral, swap etc). The snaps.flavor_extra_specs dict in the config_functest.yaml file could be used for this purpose.
The OpenDaylight (ODL) test suite consists of a set of basic tests inherited from the ODL project using the Robot [11] framework. The suite verifies creation and deletion of networks, subnets and ports with OpenDaylight and Neutron.
The list of tests can be described as follows:
- Basic Restconf test cases
- Connect to Restconf URL
- Check the HTTP code status
- Neutron Reachability test cases
- Get the complete list of neutron resources (networks, subnets, ports)
- Neutron Network test cases
- Check OpenStack networks
- Check OpenDaylight networks
- Create a new network via OpenStack and check the HTTP status code returned by Neutron
- Check that the network has also been successfully created in OpenDaylight
- Neutron Subnet test cases
- Check OpenStack subnets
- Check OpenDaylight subnets
- Create a new subnet via OpenStack and check the HTTP status code returned by Neutron
- Check that the subnet has also been successfully created in OpenDaylight
- Neutron Port test cases
- Check OpenStack Neutron for known ports
- Check OpenDaylight ports
- Create a new port via OpenStack and check the HTTP status code returned by Neutron
- Check that the new port has also been successfully created in OpenDaylight
- Delete operations
- Delete the port previously created via OpenStack
- Check that the port has been also successfully deleted in OpenDaylight
- Delete previously subnet created via OpenStack
- Check that the subnet has also been successfully deleted in OpenDaylight
- Delete the network created via OpenStack
- Check that the network has also been successfully deleted in OpenDaylight
Note: the checks in OpenDaylight are based on the returned HTTP status code returned by OpenDaylight.
Functest has been supporting several feature projects since Brahmaputra:
| Test | Brahma | Colorado | Danube | Euphrates | Fraser |
|---|---|---|---|---|---|
| barometer | X | X | X | ||
| bgpvpn | X | X | X | X | |
| copper | X | ||||
| doctor | X | X | X | X | X |
| domino | X | X | X | ||
| fds | X | X | X | ||
| moon | X | ||||
| multisite | X | X | |||
| netready | X | ||||
| odl_sfc | X | X | X | X | |
| opera | X | ||||
| orchestra | X | X | X | ||
| parser | X | X | X | ||
| promise | X | X | X | X | X |
| security_scan | X | X | |||
| clover | X | ||||
| stor4nfv | X |
Please refer to the dedicated feature user guides for details.
The IP Multimedia Subsystem or IP Multimedia Core Network Subsystem (IMS) is an architectural framework for delivering IP multimedia services.
vIMS has been integrated in Functest to demonstrate the capability to deploy a relatively complex NFV scenario on the OPNFV platform. The deployment of a complete functional VNF allows the test of most of the essential functions needed for a NFV platform.
The goal of this test suite consists of:
- deploy a VNF orchestrator (Cloudify)
- deploy a Clearwater vIMS (IP Multimedia Subsystem) VNF from this orchestrator based on a TOSCA blueprint defined in [5]
- run suite of signaling tests on top of this VNF
The Clearwater architecture is described as follows:
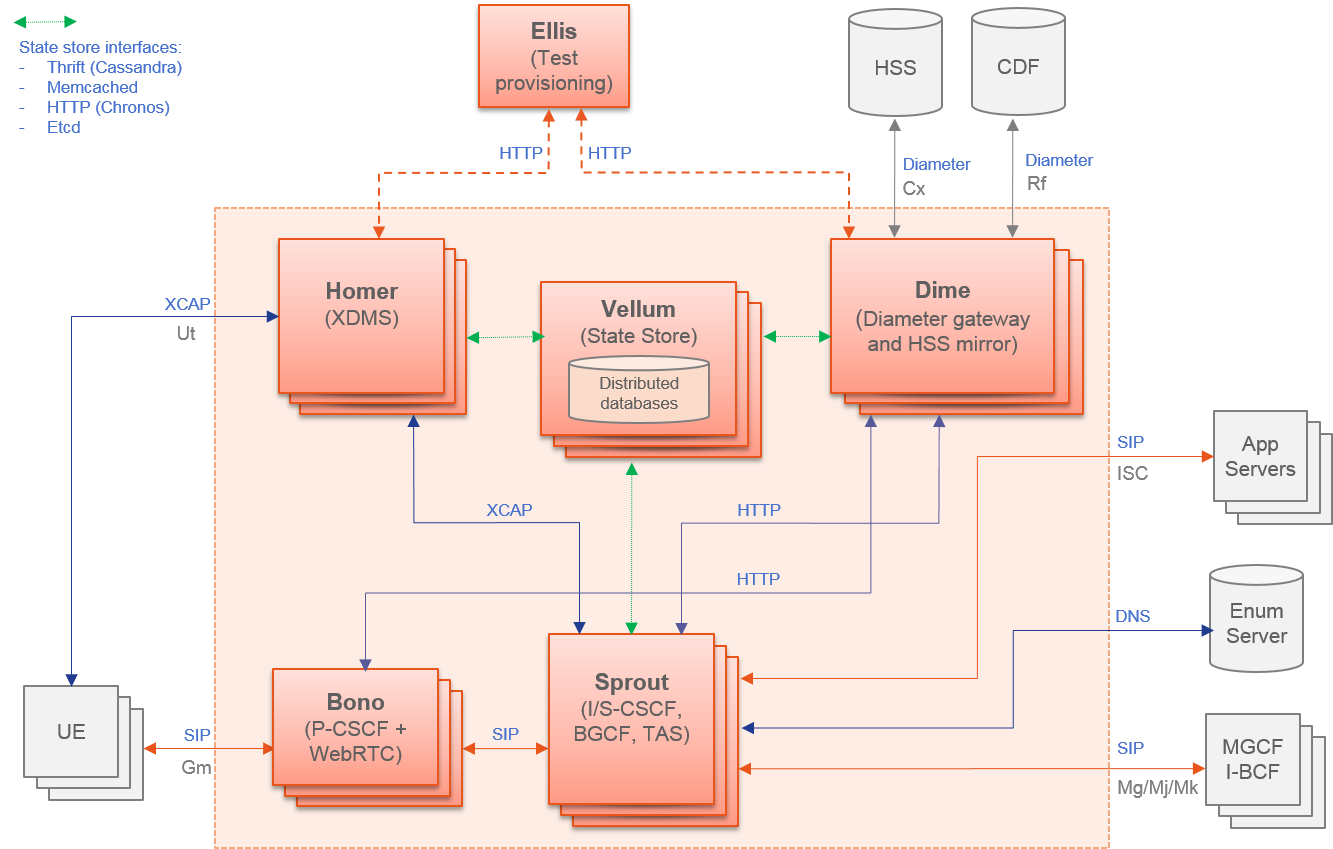
The IP Multimedia Subsystem or IP Multimedia Core Network Subsystem (IMS) is an architectural framework for delivering IP multimedia services.
vIMS has been integrated in Functest to demonstrate the capability to deploy a relatively complex NFV scenario on the OPNFV platform. The deployment of a complete functional VNF allows the test of most of the essential functions needed for a NFV platform.
The goal of this test suite consists of:
The Clearwater architecture is described as follows:
This test case deals with the deployment and the test of vyos vrouter with Cloudify orchestrator. The test case can do testing for interchangeability of BGP Protocol using vyos.
Deploy VNF Testing topology by Cloudify using blueprint.
Setting configuration to Target VNF and reference VNF using ssh
Execution of test command for test item written YAML format file. Check VNF status and behavior.
Output of report based on result using JSON format.
The vyos-vrouter architecture is described in [14]
The Evolved Packet Core (EPC) is the main component of the System Architecture Evolution (SAE) which forms the core of the 3GPP LTE specification.
vEPC has been integrated in Functest to demonstrate the capability to deploy a complex mobility-specific NFV scenario on the OPNFV platform. The OAI EPC supports most of the essential functions defined by the 3GPP Technical Specs; hence the successful execution of functional tests on the OAI EPC provides a good endorsement of the underlying NFV platform.
This integration also includes ABot, a Test Orchestration system that enables test scenarios to be defined in high-level DSL. ABot is also deployed as a VM on the OPNFV platform; and this provides an example of the automation driver and the Test VNF being both deployed as separate VNFs on the underlying OPNFV platform.
Deploy Juju controller using Bootstrap command.
Deploy ABot orchestrator and OAI EPC as Juju charms. Configuration of ABot and OAI EPC components is handled through built-in Juju relations.
Execution of ABot feature files triggered by Juju actions. This executes a suite of LTE signalling tests on the OAI EPC.
ABot test results are parsed accordingly and pushed to Functest Db.
Details of the ABot test orchestration tool may be found in [15]
Kubernetes testing relies on sets of tests, which are part of the Kubernetes source tree, such as the Kubernetes End-to-End (e2e) tests [16].
The kubernetes testcases are distributed across various Tiers:
- Healthcheck Tier
- k8s_smoke Test Case: Creates a Guestbook application that contains redis server, 2 instances of redis slave, frontend application, frontend service and redis master service and redis slave service. Using frontend service, the test will write an entry into the guestbook application which will store the entry into the backend redis database. Application flow MUST work as expected and the data written MUST be available to read.
- Smoke Tier
- k8s_conformance Test Case: Runs a series of k8s e2e tests expected to pass on any Kubernetes cluster. It is a subset of tests necessary to demonstrate conformance grows with each release. Conformance is thus considered versioned, with backwards compatibility guarantees and are designed to be run with no cloud provider configured.
As mentioned in the Functest Installation Guide, Alpine docker containers have been introduced in Euphrates. Tier containers have been created. Assuming that you pulled the container and your environement is ready, you can simply run the tiers by typing (e.g. with functest-healthcheck):
sudo docker run --env-file env \
    -v $(pwd)/openstack.creds:/home/opnfv/functest/conf/env_file  \
    -v $(pwd)/images:/home/opnfv/functest/images  \
    opnfv/functest-healthcheck
You should get:
+----------------------------+------------------+---------------------+------------------+----------------+
|         TEST CASE          |     PROJECT      |         TIER        |     DURATION     |     RESULT     |
+----------------------------+------------------+---------------------+------------------+----------------+
|      connection_check      |     functest     |     healthcheck     |      00:02       |      PASS      |
|         api_check          |     functest     |     healthcheck     |      03:19       |      PASS      |
|     snaps_health_check     |     functest     |     healthcheck     |      00:46       |      PASS      |
+----------------------------+------------------+---------------------+------------------+----------------+
You can run functest-healcheck, functest-smoke, functest-features, functest-components and functest-vnf.
The result tables show the results by test case, it can be:
* PASS
* FAIL
* SKIP: if the scenario/installer does not support the test case
If you want to run the test step by step, you may add docker option then run the different commands within the docker.
Considering the healthcheck example, running functest manaully means:
sudo docker run -ti --env-file env \
  -v $(pwd)/openstack.creds:/home/opnfv/functest/conf/env_file  \
  -v $(pwd)/images:/home/opnfv/functest/images  \
  opnfv/functest-healthcheck /bin/bash
The docker prompt shall be returned. Then within the docker run the following commands:
$ source /home/opnfv/functest/conf/env_file
Each Alpine container provided on the docker hub matches with a tier. The following commands are available:
# functest tier list
  - 0. healthcheck:
  ['connection_check', 'api_check', 'snaps_health_check']
# functest tier show healthcheck
+---------------------+---------------+--------------------------+-------------------------------------------------+------------------------------------+
|        TIERS        |     ORDER     |         CI LOOP          |                   DESCRIPTION                   |             TESTCASES              |
+---------------------+---------------+--------------------------+-------------------------------------------------+------------------------------------+
|     healthcheck     |       0       |     (daily)|(weekly)     |     First tier to be executed to verify the     |     connection_check api_check     |
|                     |               |                          |           basic operations in the VIM.          |         snaps_health_check         |
+---------------------+---------------+--------------------------+-------------------------------------------------+------------------------------------+
To run all the cases of the tier, type:
# functest tier run healthcheck
Testcases can be listed, shown and run though the CLI:
# functest testcase list
 connection_check
 api_check
 snaps_health_check
# functest testcase show api_check
+-------------------+--------------------------------------------------+------------------+---------------------------+
|     TEST CASE     |                   DESCRIPTION                    |     CRITERIA     |         DEPENDENCY        |
+-------------------+--------------------------------------------------+------------------+---------------------------+
|     api_check     |     This test case verifies the retrieval of     |       100        |       ^((?!lxd).)*$       |
|                   |       OpenStack clients: Keystone, Glance,       |                  |                           |
|                   |      Neutron and Nova and may perform some       |                  |                           |
|                   |     simple queries. When the config value of     |                  |                           |
|                   |       snaps.use_keystone is True, functest       |                  |                           |
|                   |     must have access to the cloud's private      |                  |                           |
|                   |                     network.                     |                  |                           |
+-------------------+--------------------------------------------------+------------------+---------------------------+
# functest testcase run connection_check
...
# functest run all
You can also type run_tests -t all to run all the tests.
Note the list of test cases depend on the installer and the scenario.
Note that the flavors for the SNAPS test cases are able to be configured giving new metadata values as well as new values for the basic elements of flavor (i.e. ram, vcpu, disk, ephemeral, swap etc). The snaps.flavor_extra_specs dict in the config_functest.yaml file could be used for this purpose.
In OPNFV CI we collect all the results from CI. A test API shall be available as well as a test database [16].
In manual mode test results are displayed in the console and result files are put in /home/opnfv/functest/results.
If you want additional logs, you may configure the logging.ini under /usr/lib/python2.7/site-packages/xtesting/ci.
In automated mode, tests are run within split Alpine containers, and test results are displayed in jenkins logs. The result summary is provided at the end of each suite and can be described as follow.
Healthcheck suite:
+----------------------------+------------------+---------------------+------------------+----------------+
|         TEST CASE          |     PROJECT      |         TIER        |     DURATION     |     RESULT     |
+----------------------------+------------------+---------------------+------------------+----------------+
|      connection_check      |     functest     |     healthcheck     |      00:07       |      PASS      |
|         api_check          |     functest     |     healthcheck     |      07:46       |      PASS      |
|     snaps_health_check     |     functest     |     healthcheck     |      00:36       |      PASS      |
+----------------------------+------------------+---------------------+------------------+----------------+
Smoke suite:
+------------------------------+------------------+---------------+------------------+----------------+
|          TEST CASE           |     PROJECT      |      TIER     |     DURATION     |     RESULT     |
+------------------------------+------------------+---------------+------------------+----------------+
|          vping_ssh           |     functest     |     smoke     |      00:57       |      PASS      |
|        vping_userdata        |     functest     |     smoke     |      00:33       |      PASS      |
|     tempest_smoke_serial     |     functest     |     smoke     |      13:22       |      PASS      |
|         rally_sanity         |     functest     |     smoke     |      24:07       |      PASS      |
|       refstack_defcore       |     functest     |     smoke     |      05:21       |      PASS      |
|           patrole            |     functest     |     smoke     |      04:29       |      PASS      |
|         snaps_smoke          |     functest     |     smoke     |      46:54       |      PASS      |
|             odl              |     functest     |     smoke     |      00:00       |      SKIP      |
|        neutron_trunk         |     functest     |     smoke     |      00:00       |      SKIP      |
+------------------------------+------------------+---------------+------------------+----------------+
Features suite:
+-----------------------------+------------------------+------------------+------------------+----------------+
|          TEST CASE          |        PROJECT         |       TIER       |     DURATION     |     RESULT     |
+-----------------------------+------------------------+------------------+------------------+----------------+
|     doctor-notification     |         doctor         |     features     |      00:00       |      SKIP      |
|            bgpvpn           |         sdnvpn         |     features     |      00:00       |      SKIP      |
|       functest-odl-sfc      |          sfc           |     features     |      00:00       |      SKIP      |
|      barometercollectd      |       barometer        |     features     |      00:00       |      SKIP      |
|             fds             |     fastdatastacks     |     features     |      00:00       |      SKIP      |
+-----------------------------+------------------------+------------------+------------------+----------------+
Components suite:
+-------------------------------+------------------+--------------------+------------------+----------------+
|           TEST CASE           |     PROJECT      |        TIER        |     DURATION     |     RESULT     |
+-------------------------------+------------------+--------------------+------------------+----------------+
|     tempest_full_parallel     |     functest     |     components     |      48:28       |      PASS      |
|           rally_full          |     functest     |     components     |      126:02      |      PASS      |
+-------------------------------+------------------+--------------------+------------------+----------------+
Vnf suite:
+----------------------+------------------+--------------+------------------+----------------+
|      TEST CASE       |     PROJECT      |     TIER     |     DURATION     |     RESULT     |
+----------------------+------------------+--------------+------------------+----------------+
|     cloudify_ims     |     functest     |     vnf      |      28:15       |      PASS      |
|     vyos_vrouter     |     functest     |     vnf      |      17:59       |      PASS      |
|       juju_epc       |     functest     |     vnf      |      46:44       |      PASS      |
+----------------------+------------------+--------------+------------------+----------------+
Parser testcase:
+-----------------------+-----------------+------------------+------------------+----------------+
|       TEST CASE       |     PROJECT     |       TIER       |     DURATION     |     RESULT     |
+-----------------------+-----------------+------------------+------------------+----------------+
|     parser-basics     |      parser     |     features     |      00:00       |      SKIP      |
+-----------------------+-----------------+------------------+------------------+----------------+
Functest Kubernetes test result:
+--------------------------------------+------------------------------------------------------------+
|               ENV VAR                |                           VALUE                            |
+--------------------------------------+------------------------------------------------------------+
|            INSTALLER_TYPE            |                          compass                           |
|           DEPLOY_SCENARIO            |                   k8-nosdn-nofeature-ha                    |
|              BUILD_TAG               |     jenkins-functest-compass-baremetal-daily-master-75     |
|               CI_LOOP                |                           daily                            |
+--------------------------------------+------------------------------------------------------------+
Kubernetes healthcheck suite:
+-------------------+------------------+---------------------+------------------+----------------+
|     TEST CASE     |     PROJECT      |         TIER        |     DURATION     |     RESULT     |
+-------------------+------------------+---------------------+------------------+----------------+
|     k8s_smoke     |     functest     |     healthcheck     |      01:54       |      PASS      |
+-------------------+------------------+---------------------+------------------+----------------+
Kubernetes smoke suite:
+-------------------------+------------------+---------------+------------------+----------------+
|        TEST CASE        |     PROJECT      |      TIER     |     DURATION     |     RESULT     |
+-------------------------+------------------+---------------+------------------+----------------+
|     k8s_conformance     |     functest     |     smoke     |      57:47       |      PASS      |
+-------------------------+------------------+---------------+------------------+----------------+
Kubernetes features suite:
+----------------------+------------------+------------------+------------------+----------------+
|      TEST CASE       |     PROJECT      |       TIER       |     DURATION     |     RESULT     |
+----------------------+------------------+------------------+------------------+----------------+
|     stor4nfv_k8s     |     stor4nfv     |     stor4nfv     |      00:00       |      SKIP      |
|      clover_k8s      |      clover      |      clover      |      00:00       |      SKIP      |
+----------------------+------------------+------------------+------------------+----------------+
Results are automatically pushed to the test results database, some additional result files are pushed to OPNFV artifact web sites.
Based on the results stored in the result database, a Functest reporting portal is also automatically updated. This portal provides information on the overall status per scenario and per installer
An automatic reporting page has been created in order to provide a consistent view of the Functest tests on the different scenarios.
In this page, each scenario is evaluated according to test criteria.
The results are collected from the centralized database every day and, per scenario. A score is calculated based on the results from the last 10 days. This score is the addition of single test scores. Each test case has a success criteria reflected in the criteria field from the results.
As an illustration, let’s consider the scenario os-odl_l2-nofeature-ha scenario, the scenario scoring is the addition of the scores of all the runnable tests from the categories (tiers, healthcheck, smoke and features) corresponding to this scenario.
Test Apex Compass Fuel Joid vPing_ssh X X X X vPing_userdata X X X X tempest_smoke X X X X rally_sanity X X X X odl X X X X promise X X doctor X X security_scan X parser X copper X X src: os-odl_l2-nofeature-ha Colorado (see release note for the last matrix version)
All the testcases (X) listed in the table are runnable on os-odl_l2-nofeature scenarios. Please note that other test cases (e.g. sfc_odl, bgpvpn) need ODL configuration addons and, as a consequence, specific scenario. There are not considered as runnable on the generic odl_l2 scenario.
If no result is available or if all the results are failed, the test case get 0 point. If it was successful at least once but not anymore during the 4 runs, the case get 1 point (it worked once). If at least 3 of the last 4 runs were successful, the case get 2 points. If the last 4 runs of the test are successful, the test get 3 points.
In the example above, the target score for fuel/os-odl_l2-nofeature-ha is 3 x 8 = 24 points and for compass it is 3 x 5 = 15 points .
The scenario is validated per installer when we got 3 points for all individual test cases (e.g 24/24 for fuel, 15/15 for compass).
Please note that complex or long duration tests are not considered yet for the scoring. In fact the success criteria are not always easy to define and may require specific hardware configuration.
Please also note that all the test cases have the same “weight” for the score calculation whatever the complexity of the test case. Concretely a vping has the same weight than the 200 tempest tests. Moreover some installers support more features than others. The more cases your scenario is dealing with, the most difficult to rich a good scoring.
Therefore the scoring provides 3 types of indicators:
- the richness of the scenario: if the target scoring is high, it means that the scenario includes lots of features
- the maturity: if the percentage (scoring/target scoring * 100) is high, it means that all the tests are PASS
- the stability: as the number of iteration is included in the calculation, the pecentage can be high only if the scenario is run regularly (at least more than 4 iterations over the last 10 days in CI)
In any case, the scoring is used to give feedback to the other projects and does not represent an absolute value of the scenario.
See reporting page for details. For the status, click on the version, Functest then the Status menu.
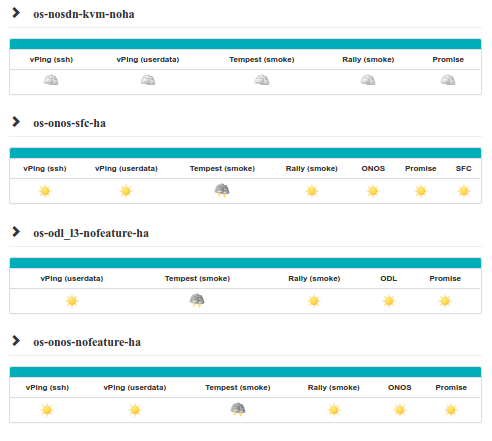
This section gives some guidelines about how to troubleshoot the test cases owned by Functest.
IMPORTANT: As in the previous section, the steps defined below must be executed inside the Functest Docker container and after sourcing the OpenStack credentials:
. $creds
or:
source /home/opnfv/functest/conf/env_file
This section covers the test cases related to the VIM (healthcheck, vping_ssh, vping_userdata, tempest_smoke, tempest_full, rally_sanity, rally_full).
For both vPing test cases (vPing_ssh, and vPing_userdata), the first steps are similar:
- Create Glance image
- Create Network
- Create Security Group
- Create Instances
After these actions, the test cases differ and will be explained in their respective section.
These test cases can be run inside the container, using new Functest CLI as follows:
$ run_tests -t vping_ssh
$ run_tests -t vping_userdata
The Functest CLI is designed to route a call to the corresponding internal python scripts, located in paths:
/usr/lib/python2.7/site-packages/functest/opnfv_tests/openstack/vping/vping_ssh.py
/usr/lib/python2.7/site-packages/functest/opnfv_tests/openstack/vping/vping_userdata.py
Notes:
There is one difference, between the Functest CLI based test case execution compared to the earlier used Bash shell script, which is relevant to point out in troubleshooting scenarios:
The Functest CLI does not yet support the option to suppress clean-up of the generated OpenStack resources, following the execution of a test case.
Explanation: After finishing the test execution, the corresponding script will remove, by default, all created resources in OpenStack (image, instances, network and security group). When troubleshooting, it is advisable sometimes to keep those resources in case the test fails and a manual testing is needed.
It is actually still possible to invoke test execution, with suppression of OpenStack resource cleanup, however this requires invocation of a specific Python script: ‘run_tests’. The OPNFV Functest Developer Guide provides guidance on the use of that Python script in such troubleshooting cases.
Some of the common errors that can appear in this test case are:
vPing_ssh- ERROR - There has been a problem when creating the neutron network....
This means that there has been some problems with Neutron, even before creating the instances. Try to create manually a Neutron network and a Subnet to see if that works. The debug messages will also help to see when it failed (subnet and router creation). Example of Neutron commands (using 10.6.0.0/24 range for example):
neutron net-create net-test
neutron subnet-create --name subnet-test --allocation-pool start=10.6.0.2,end=10.6.0.100 \
--gateway 10.6.0.254 net-test 10.6.0.0/24
neutron router-create test_router
neutron router-interface-add <ROUTER_ID> test_subnet
neutron router-gateway-set <ROUTER_ID> <EXT_NET_NAME>
Another related error can occur while creating the Security Groups for the instances:
vPing_ssh- ERROR - Failed to create the security group...
In this case, proceed to create it manually. These are some hints:
neutron security-group-create sg-test
neutron security-group-rule-create sg-test --direction ingress --protocol icmp \
--remote-ip-prefix 0.0.0.0/0
neutron security-group-rule-create sg-test --direction ingress --ethertype IPv4 \
--protocol tcp --port-range-min 80 --port-range-max 80 --remote-ip-prefix 0.0.0.0/0
neutron security-group-rule-create sg-test --direction egress --ethertype IPv4 \
--protocol tcp --port-range-min 80 --port-range-max 80 --remote-ip-prefix 0.0.0.0/0
The next step is to create the instances. The image used is located in /home/opnfv/functest/data/cirros-0.4.0-x86_64-disk.img and a Glance image is created with the name functest-vping. If booting the instances fails (i.e. the status is not ACTIVE), you can check why it failed by doing:
nova list
nova show <INSTANCE_ID>
It might show some messages about the booting failure. To try that manually:
nova boot --flavor m1.small --image functest-vping --nic net-id=<NET_ID> nova-test
This will spawn a VM using the network created previously manually. In all the OPNFV tested scenarios from CI, it never has been a problem with the previous actions. Further possible problems are explained in the following sections.
This test case creates a floating IP on the external network and assigns it to the second instance opnfv-vping-2. The purpose of this is to establish a SSH connection to that instance and SCP a script that will ping the first instance. This script is located in the repository under /usr/lib/python2.7/site-packages/functest/opnfv_tests/openstack/vping/ping.sh and takes an IP as a parameter. When the SCP is completed, the test will do a SSH call to that script inside the second instance. Some problems can happen here:
vPing_ssh- ERROR - Cannot establish connection to IP xxx.xxx.xxx.xxx. Aborting
If this is displayed, stop the test or wait for it to finish, if you have used the special method of test invocation with specific supression of OpenStack resource clean-up, as explained earler. It means that the Container can not reach the Public/External IP assigned to the instance opnfv-vping-2. There are many possible reasons, and they really depend on the chosen scenario. For most of the ODL-L3 and ONOS scenarios this has been noticed and it is a known limitation.
First, make sure that the instance opnfv-vping-2 succeeded to get an IP from the DHCP agent. It can be checked by doing:
nova console-log opnfv-vping-2
If the message Sending discover and No lease, failing is shown, it probably means that the Neutron dhcp-agent failed to assign an IP or even that it was not responding. At this point it does not make sense to try to ping the floating IP.
If the instance got an IP properly, try to ping manually the VM from the container:
nova list
<grab the public IP>
ping <public IP>
If the ping does not return anything, try to ping from the Host where the Docker container is running. If that solves the problem, check the iptable rules because there might be some rules rejecting ICMP or TCP traffic coming/going from/to the container.
At this point, if the ping does not work either, try to reproduce the test manually with the steps described above in the vPing common section with the addition:
neutron floatingip-create <EXT_NET_NAME>
nova floating-ip-associate nova-test <FLOATING_IP>
Further troubleshooting is out of scope of this document, as it might be due to problems with the SDN controller. Contact the installer team members or send an email to the corresponding OPNFV mailing list for more information.
This test case does not create any floating IP neither establishes an SSH connection. Instead, it uses nova-metadata service when creating an instance to pass the same script as before (ping.sh) but as 1-line text. This script will be executed automatically when the second instance opnfv-vping-2 is booted.
The only known problem here for this test to fail is mainly the lack of support of cloud-init (nova-metadata service). Check the console of the instance:
nova console-log opnfv-vping-2
If this text or similar is shown:
checking http://169.254.169.254/2009-04-04/instance-id
failed 1/20: up 1.13. request failed
failed 2/20: up 13.18. request failed
failed 3/20: up 25.20. request failed
failed 4/20: up 37.23. request failed
failed 5/20: up 49.25. request failed
failed 6/20: up 61.27. request failed
failed 7/20: up 73.29. request failed
failed 8/20: up 85.32. request failed
failed 9/20: up 97.34. request failed
failed 10/20: up 109.36. request failed
failed 11/20: up 121.38. request failed
failed 12/20: up 133.40. request failed
failed 13/20: up 145.43. request failed
failed 14/20: up 157.45. request failed
failed 15/20: up 169.48. request failed
failed 16/20: up 181.50. request failed
failed 17/20: up 193.52. request failed
failed 18/20: up 205.54. request failed
failed 19/20: up 217.56. request failed
failed 20/20: up 229.58. request failed
failed to read iid from metadata. tried 20
it means that the instance failed to read from the metadata service. Contact the Functest or installer teams for more information.
In the upstream OpenStack CI all the Tempest test cases are supposed to pass. If some test cases fail in an OPNFV deployment, the reason is very probably one of the following
| Error | Details |
|---|---|
| Resources required for testcase execution are missing | Such resources could be e.g. an external network and access to the management subnet (adminURL) from the Functest docker container. |
| OpenStack components or services are missing or not configured properly | Check running services in the controller and compute nodes (e.g. with “systemctl” or “service” commands). Configuration parameters can be verified from the related .conf files located under ‘/etc/<component>’ directories. |
| Some resources required for execution test cases are missing | The tempest.conf file, automatically generated by Rally in Functest, does not contain all the needed parameters or some parameters are not set properly. The tempest.conf file is located in directory ‘root/.rally/verification/verifier-<UUID> /for-deployment-<UUID>’ in the Functest Docker container. Use the “rally deployment list” command in order to check the UUID of the current deployment. |
When some Tempest test case fails, captured traceback and possibly also the related REST API requests/responses are output to the console. More detailed debug information can be found from tempest.log file stored into related Rally deployment folder.
Functest offers a possibility to test a customized list of Tempest test cases. To enable that, add a new entry in docker/components/testcases.yaml on the “components” container with the following content:
-
    case_name: tempest_custom
    project_name: functest
    criteria: 100
    blocking: false
    description: >-
        The test case allows running a customized list of tempest
        test cases
    dependencies:
        installer: ''
        scenario: ''
    run:
        module: 'functest.opnfv_tests.openstack.tempest.tempest'
        class: 'TempestCustom'
Also, a list of the Tempest test cases must be provided to the container or modify the existing one in /usr/lib/python2.7/site-packages/functest/opnfv_tests/openstack/tempest/custom_tests/test_list.txt
Example of custom list of tests ‘my-custom-tempest-tests.txt’:
tempest.scenario.test_server_basic_ops.TestServerBasicOps.test_server_basic_ops[compute,id-7fff3fb3-91d8-4fd0-bd7d-0204f1f180ba,network,smoke]
tempest.scenario.test_network_basic_ops.TestNetworkBasicOps.test_network_basic_ops[compute,id-f323b3ba-82f8-4db7-8ea6-6a895869ec49,network,smoke]
This is an example of running a customized list of Tempest tests in Functest:
sudo docker run --env-file env \
    -v $(pwd)/openstack.creds:/home/opnfv/functest/conf/env_file \
    -v $(pwd)/images:/home/opnfv/functest/images \
    -v $(pwd)/my-custom-testcases.yaml:/usr/lib/python2.7/site-packages/functest/ci/testcases.yaml \
    -v $(pwd)/my-custom-tempest-tests.txt:/usr/lib/python2.7/site-packages/functest/opnfv_tests/openstack/tempest/custom_tests/test_list.txt \
    opnfv/functest-components run_tests -t tempest_custom
The same error causes which were mentioned above for Tempest test cases, may also lead to errors in Rally as well.
To know more about what those scenarios are doing, they are defined in directory: /usr/lib/python2.7/site-packages/functest/opnfv_tests/openstack/rally/scenario For more info about Rally scenario definition please refer to the Rally official documentation. [3]
To check any possible problems with Rally, the logs are stored under /home/opnfv/functest/results/rally/ in the Functest Docker container.
If the Basic Restconf test suite fails, check that the ODL controller is reachable and its Restconf module has been installed.
If the Neutron Reachability test fails, verify that the modules implementing Neutron requirements have been properly installed.
If any of the other test cases fails, check that Neutron and ODL have been correctly configured to work together. Check Neutron configuration files, accounts, IP addresses etc.).
Please refer to the dedicated feature user guides for details.
vIMS deployment may fail for several reasons, the most frequent ones are described in the following table:
| Error | Comments |
|---|---|
| Keystone admin API not reachable | Impossible to create vIMS user and tenant |
| Impossible to retrieve admin role id | Impossible to create vIMS user and tenant |
| Error when uploading image from OpenStack to glance | impossible to deploy VNF |
| Cinder quota cannot be updated | Default quotas not sufficient, they are adapted in the script |
| Impossible to create a volume | VNF cannot be deployed |
| SSH connection issue between the Test Docker container and the VM | if vPing test fails, vIMS test will fail... |
| No Internet access from the VM | the VMs of the VNF must have an external access to Internet |
| No access to OpenStack API from the VM | Orchestrator can be installed but the vIMS VNF installation fails |
Please note that this test case requires resources (8 VM (2Go) + 1 VM (4Go)), it is there fore not recommended to run it on a light configuration.
[2]: OpenStack Tempest documentation
[3]: Rally documentation
[4]: Functest in depth (Danube)
[5]: Clearwater vIMS blueprint
[6]: Security Content Automation Protocol
[7]: OpenSCAP web site
[8]: Refstack client
[9]: Defcore
[10]: OpenStack interoperability procedure
[11]: Robot Framework web site
[13]: SNAPS wiki
[14]: vRouter
[15]: Testing OpenStack Tempest part 1
[16]: OPNFV Test API
OPNFV main site: OPNFV official web site
Functest page: Functest wiki page
IRC support chan: #opnfv-functest
The NFVbench tool provides an automated way to measure the network performance for the most common data plane packet flows on any OpenStack system. It is designed to be easy to install and easy to use by non experts (no need to be an expert in traffic generators and data plane performance testing).
NFVbench supports the following main measurement capabilities:
configurable frame sizes (any list of fixed sizes or ‘IMIX’)
built-in packet paths (PVP, PVVP)
built-in loopback VNFs based on fast L2 or L3 forwarders running in VMs
configurable number of flows and service chains
configurable traffic direction (single or bi-directional)
NDR is the highest throughput achieved without dropping packets. PDR is the highest throughput achieved without dropping more than a pre-set limit (called PDR threshold or allowance, expressed in %).
Results of each run include the following data:
NFVbench can stage OpenStack resources to build 1 or more service chains using direct OpenStack APIs. Each service chain is composed of:
OpenStack resources are staged before traffic is measured using OpenStack APIs (Nova and Neutron) then disposed after completion of measurements.
The loopback VM flavor to use can be configured in the NFVbench configuration file.
Note that NFVbench does not use OpenStack Heat nor any higher level service (VNFM or NFVO) to create the service chains because its main purpose is to measure the performance of the NFVi infrastructure which is mainly focused on L2 forwarding performance.
NFVbench supports settings that involve externally staged packet paths with or without OpenStack:
NFVbench supports benchmarking of pure L2 loopbacks (see “–l2-loopback vlan” option)
In this mode, NFVbench will take a vlan ID and send packets from each port to the other port (dest MAC set to the other port MAC) using the same VLAN ID on both ports. This can be useful for example to verify that the connectivity to the switch is working properly.
NFVbench currently integrates with the open source TRex traffic generator:
Packet paths describe where packets are flowing in the NFVi platform. The most commonly used paths are identified by 3 or 4 letter abbreviations. A packet path can generally describe the flow of packets associated to one or more service chains, with each service chain composed of 1 or more VNFs.
The following packet paths are currently supported by NFVbench:
The traffic is made of 1 or more flows of L3 frames (UDP packets) with different payload sizes. Each flow is identified by a unique source and destination MAC/IP tuple.
NFVbench provides a loopback VM image that runs CentOS with 2 pre-installed forwarders:
Frames are just forwarded from one interface to the other. In the case of testpmd, the source and destination MAC are rewritten, which corresponds to the mac forwarding mode (–forward-mode=mac). In the case of VPP, VPP will act as a real L3 router, and the packets are routed from one port to the other using static routes.
Which forwarder and what Nova flavor to use can be selected in the NFVbench configuration. Be default the DPDK testpmd forwarder is used with 2 vCPU per VM. The configuration of these forwarders (such as MAC rewrite configuration or static route configuration) is managed by NFVbench.
This packet path represents a single service chain with 1 loopback VNF and 2 Neutron networks:
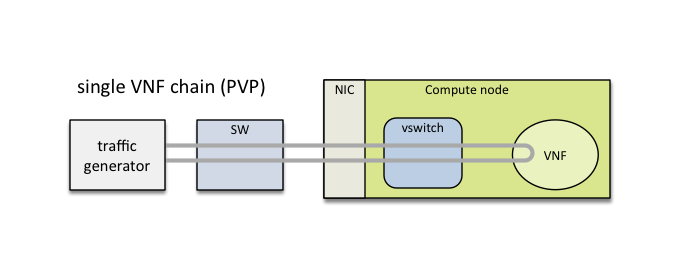
This packet path represents a single service chain with 2 loopback VNFs in sequence and 3 Neutron networks. The 2 VNFs can run on the same compute node (PVVP intra-node):
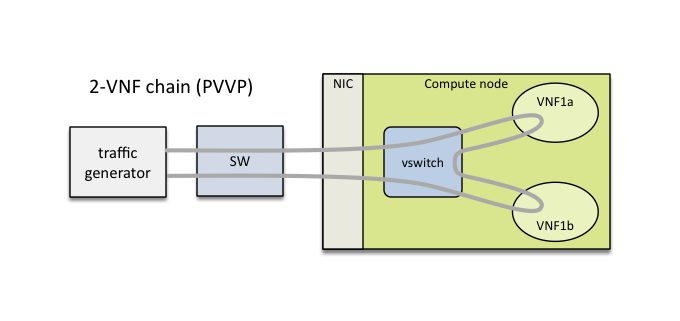
or on different compute nodes (PVVP inter-node) based on a configuration option:
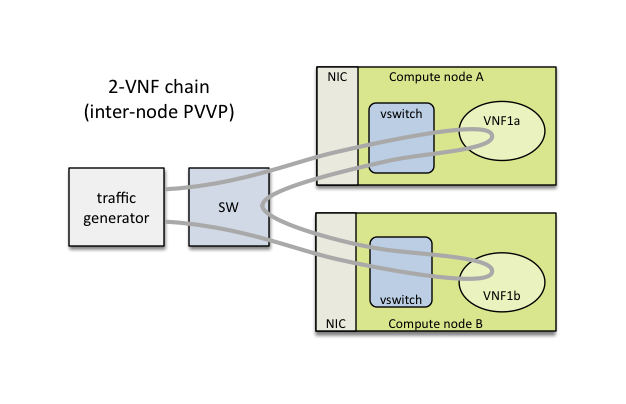
Multiple service chains can be setup by NFVbench without any limit on the concurrency (other than limits imposed by available resources on compute nodes). In the case of multiple service chains, NFVbench will instruct the traffic generator to use multiple L3 packet streams (frames directed to each path will have a unique destination MAC address).
Example of multi-chaining with 2 concurrent PVP service chains:
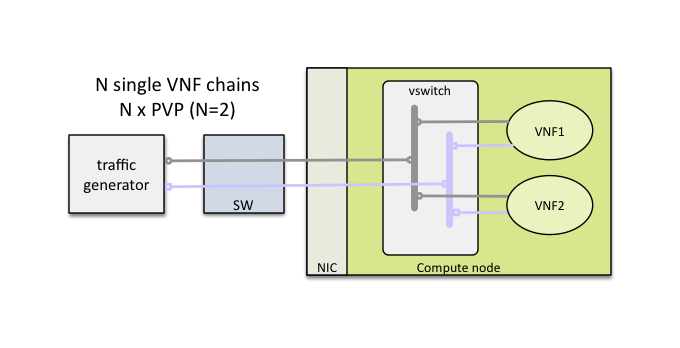
This innovative feature will allow to measure easily the performance of a fully loaded compute node running multiple service chains.
Multi-chaining is currently limited to 1 compute node (PVP or PVVP intra-node) or 2 compute nodes (for PVVP inter-node). The 2 edge interfaces for all service chains will share the same 2 networks. The total traffic will be split equally across all chains.
By default, service chains will be based on virtual switch interfaces.
NFVbench provides an option to select SR-IOV based virtual interfaces instead (thus bypassing any virtual switch) for those OpenStack system that include and support SR-IOV capable NICs on compute nodes.
The PVP packet path will bypass the virtual switch completely when the SR-IOV option is selected:
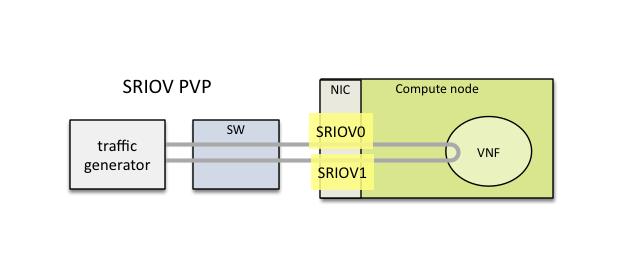
The PVVP packet path will use SR-IOV for the left and right networks and the virtual switch for the middle network by default:
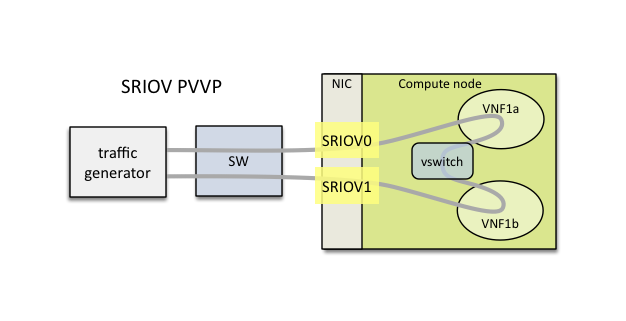
Or in the case of inter-node:
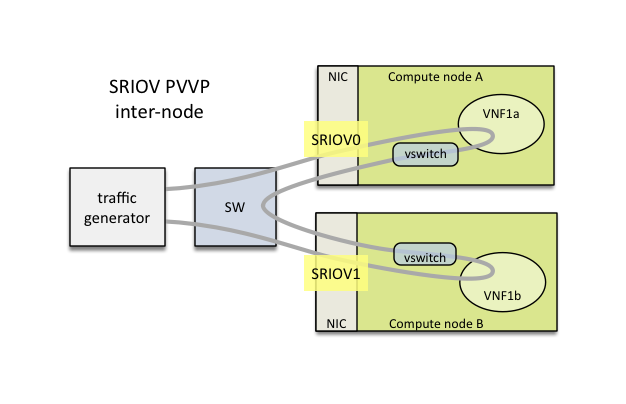
This packet path is a good way to approximate VM to VM (V2V) performance (middle network) given the high efficiency of the left and right networks. The V2V throughput will likely be very close to the PVVP throughput while its latency will be very close to the difference between the SR-IOV PVVP latency and the SR-IOV PVP latency.
It is possible to also force the middle network to use SR-IOV (in this version, the middle network is limited to use the same SR-IOV phys net):
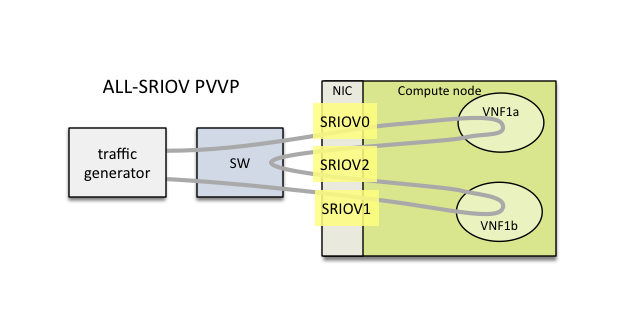
The chain can also span across 2 nodes with the use of 2 SR-IOV ports in each node:
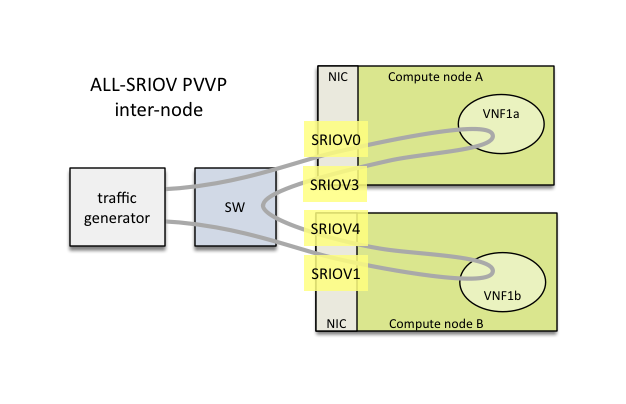
P2P (Physical interface to Physical interface - no VM) can be supported using the external chain/L2 forwarding mode.
V2V (VM to VM) is not supported but PVVP provides a more complete (and more realistic) alternative.
NFVbench only supports VLAN with OpenStack. NFVbench does not support VxLAN overlays.
To run NFVbench you need the following hardware: - a Linux server - a DPDK compatible NIC with at least 2 ports (preferably 10Gbps or higher) - 2 ethernet cables between the NIC and the OpenStack pod under test (usually through a top of rack switch)
The DPDK-compliant NIC must be one supported by the TRex traffic generator (such as Intel X710, refer to the Trex Installation Guide for a complete list of supported NIC)
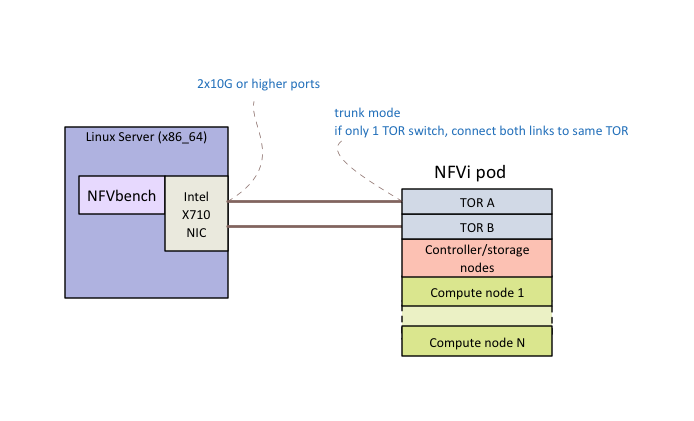
The 2 corresponding ports on the switch(es) facing the Trex ports on the Linux server should be configured in trunk mode (NFVbench will instruct TRex to insert the appropriate vlan tag).
Using a TOR switch is more representative of a real deployment and allows to measure packet flows on any compute node in the rack without rewiring and includes the overhead of the TOR switch.
Although not the primary targeted use case, NFVbench could also support the direct wiring of the traffic generator to a compute node without a switch.
You need Docker to be installed on the Linux server.
TRex uses the DPDK interface to interact with the DPDK compatible NIC for sending and receiving frames. The Linux server will need to be configured properly to enable DPDK.
DPDK requires a uio (User space I/O) or vfio (Virtual Function I/O) kernel module to be installed on the host to work. There are 2 main uio kernel modules implementations (igb_uio and uio_pci_generic) and one vfio kernel module implementation.
To check if a uio or vfio is already loaded on the host:
lsmod | grep -e igb_uio -e uio_pci_generic -e vfio
If missing, it is necessary to install a uio/vfio kernel module on the host server:
Example of installation of the igb_uio kernel module:
modprobe uio
insmod ./igb_uio.ko
Finally, the correct iommu options and huge pages to be configured on the Linux server on the boot command line:
More detailed instructions can be found in the DPDK documentation (https://media.readthedocs.org/pdf/dpdk/latest/dpdk.pdf).
Make sure you satisfy the hardware and software requirements <requirements> before you start .
The NFVbench container requires the following Docker options to operate properly.
| Docker options | Description |
|---|---|
| -v /lib/modules/$(uname -r):/lib/modules/$(uname -r) | needed by kernel modules in the container |
| -v /usr/src/kernels:/usr/src/kernels | needed by TRex to build kernel modules when needed |
| -v /dev:/dev | needed by kernel modules in the container |
| -v $PWD:/tmp/nfvbench | optional but recommended to pass files between the host and the docker space (see examples below) Here we map the current directory on the host to the /tmp/nfvbench director in the container but any other similar mapping can work as well |
| –net=host | (optional) needed if you run the NFVbench server in the container (or use any appropriate docker network mode other than “host”) |
| –privileged | (optional) required if SELinux is enabled on the host |
| -e HOST=”127.0.0.1” | (optional) required if REST server is enabled |
| -e PORT=7556 | (optional) required if REST server is enabled |
| -e CONFIG_FILE=”/root/nfvbenchconfig.json | (optional) required if REST server is enabled |
It can be convenient to write a shell script (or an alias) to automatically insert the necessary options.
The minimal configuration file required must specify the openrc file to use (using in-container path), the PCI addresses of the 2 NIC ports to use for generating traffic and the line rate (in each direction) of each of these 2 interfaces.
Here is an example of mimimal configuration where: the openrc file is located on the host current directory which is mapped under /tmp/nfvbench in the container (this is achieved using -v $PWD:/tmp/nfvbench) the 2 NIC ports to use for generating traffic have the PCI addresses “04:00.0” and “04:00.1”
{
    "openrc_file": "/tmp/nfvbench/openrc",
    "traffic_generator": {
        "generator_profile": [
            {
                "interfaces": [
                    {
                        "pci": "04:00.0",
                        "port": 0,
                    },
                    {
                        "pci": "04:00.1",
                        "port": 1,
                    }
                ],
                "intf_speed": "",
                "ip": "127.0.0.1",
                "name": "trex-local",
                "software_mode": false,
                "tool": "TRex"
            }
        ]
    }
}
The other options in the minimal configuration must be present and must have the same values as above.
As for any Docker container, you can execute NFVbench measurement sessions using a temporary container (“docker run” - which exits after each NFVbench run) or you can decide to run the NFVbench container in the background then execute one or more NFVbench measurement sessions on that container (“docker exec”).
The former approach is simpler to manage (since each container is started and terminated after each command) but incurs a small delay at start time (several seconds). The second approach is more responsive as the delay is only incurred once when starting the container.
We will take the second approach and start the NFVbench container in detached mode with the name “nfvbench” (this works with bash, prefix with “sudo” if you do not use the root login)
First create a new working directory, and change the current working directory to there. A “nfvbench_ws” directory under your home directory is good place for that, and this is where the OpenStack RC file and NFVbench config file will sit.
To run NFVBench without server mode
cd ~/nfvbench_ws
docker run --detach --net=host --privileged -v $PWD:/tmp/nfvbench -v /dev:/dev -v /lib/modules/$(uname -r):/lib/modules/$(uname -r) -v /usr/src/kernels:/usr/src/kernels --name nfvbench opnfv/nfvbench
To run NFVBench enabling REST server (mount the configuration json and the path for openrc)
cd ~/nfvbench_ws
docker run --detach --net=host --privileged -e HOST="127.0.0.1" -e PORT=7556 -e CONFIG_FILE="/tmp/nfvbench/nfvbenchconfig.json -v $PWD:/tmp/nfvbench -v /dev:/dev -v /lib/modules/$(uname -r):/lib/modules/$(uname -r) -v /usr/src/kernels:/usr/src/kernels --name nfvbench opnfv/nfvbench start_rest_server
The create an alias to make it easy to execute nfvbench commands directly from the host shell prompt:
alias nfvbench='docker exec -it nfvbench nfvbench'
The next to last “nfvbench” refers to the name of the container while the last “nfvbench” refers to the NFVbench binary that is available to run in the container.
To verify it is working:
nfvbench --version
nfvbench --help
Create a new file containing the minimal configuration for NFVbench, we can call it any name, for example “my_nfvbench.cfg” and paste the following yaml template in the file:
openrc_file:
traffic_generator:
    generator_profile:
        - name: trex-local
          tool: TRex
          ip: 127.0.0.1
          cores: 3
          software_mode: false,
          interfaces:
            - port: 0
              switch_port:
              pci:
            - port: 1
              switch_port:
              pci:
          intf_speed:
NFVbench requires an openrc file to connect to OpenStack using the OpenStack API. This file can be downloaded from the OpenStack Horizon dashboard (refer to the OpenStack documentation on how to
retrieve the openrc file). The file pathname in the container must be stored in the “openrc_file” property. If it is stored on the host in the current directory, its full pathname must start with /tmp/nfvbench (since the current directory is mapped to /tmp/nfvbench in the container).
The required configuration is the PCI address of the 2 physical interfaces that will be used by the traffic generator. The PCI address can be obtained for example by using the “lspci” Linux command. For example:
[root@sjc04-pod6-build ~]# lspci | grep 710
0a:00.0 Ethernet controller: Intel Corporation Ethernet Controller X710 for 10GbE SFP+ (rev 01)
0a:00.1 Ethernet controller: Intel Corporation Ethernet Controller X710 for 10GbE SFP+ (rev 01)
0a:00.2 Ethernet controller: Intel Corporation Ethernet Controller X710 for 10GbE SFP+ (rev 01)
0a:00.3 Ethernet controller: Intel Corporation Ethernet Controller X710 for 10GbE SFP+ (rev 01)
Example of edited configuration with an OpenStack RC file stored in the current directory with the “openrc” name, and PCI addresses “0a:00.0” and “0a:00.1” (first 2 ports of the quad port NIC):
openrc_file: /tmp/nfvbench/openrc
traffic_generator:
    generator_profile:
        - name: trex-local
          tool: TRex
          ip: 127.0.0.1
          cores: 3
          software_mode: false,
          interfaces:
            - port: 0
              switch_port:
              pci: "0a:00.0"
            - port: 1
              switch_port:
              pci: "0a:00.1"
          intf_speed:
Warning
You have to put quotes around the pci addresses as shown in the above example, otherwise TRex will read it wrong.
Alternatively, the full template with comments can be obtained using the –show-default-config option in yaml format:
nfvbench --show-default-config > my_nfvbench.cfg
Edit the nfvbench.cfg file to only keep those properties that need to be modified (preserving the nesting).
Make sure you have your nfvbench configuration file (my_nfvbench.cfg) and OpenStack RC file in your pre-created working directory.
To do a single run at 10,000pps bi-directional (or 5kpps in each direction) using the PVP packet path:
nfvbench -c /tmp/nfvbench/my_nfvbench.cfg --rate 10kpps
NFVbench options used:
-c /tmp/nfvbench/my_nfvbench.cfg : specify the config file to use (this must reflect the file path from inside the container)--rate 10kpps : specify rate of packets for test for both directions using the kpps unit (thousands of packets per second)This should produce a result similar to this (a simple run with the above options should take less than 5 minutes):
[TBP]
When no longer needed, the container can be terminated using the usual docker commands:
docker kill nfvbench
docker rm nfvbench
Example run for fixed rate
nfvbench -c /nfvbench/nfvbenchconfig.json --rate 1%
========== NFVBench Summary ==========
Date: 2017-09-21 23:57:44
NFVBench version 1.0.9
Openstack Neutron:
  vSwitch: BASIC
  Encapsulation: BASIC
Benchmarks:
> Networks:
  > Components:
    > TOR:
        Type: None
    > Traffic Generator:
        Profile: trex-local
        Tool: TRex
    > Versions:
      > TOR:
      > Traffic Generator:
          build_date: Aug 30 2017
          version: v2.29
          built_by: hhaim
          build_time: 16:43:55
  > Service chain:
    > PVP:
      > Traffic:
          Profile: traffic_profile_64B
          Bidirectional: True
          Flow count: 10000
          Service chains count: 1
          Compute nodes: []

            Run Summary:

              +-----------------+-------------+----------------------+----------------------+----------------------+
              |   L2 Frame Size |  Drop Rate  |   Avg Latency (usec) |   Min Latency (usec) |   Max Latency (usec) |
              +=================+=============+======================+======================+======================+
              |              64 |   0.0000%   |                   53 |                   20 |                  211 |
              +-----------------+-------------+----------------------+----------------------+----------------------+


            L2 frame size: 64
            Chain analysis duration: 60.076 seconds

            Run Config:

              +-------------+---------------------------+------------------------+-----------------+---------------------------+------------------------+-----------------+
              |  Direction  |  Requested TX Rate (bps)  |  Actual TX Rate (bps)  |  RX Rate (bps)  |  Requested TX Rate (pps)  |  Actual TX Rate (pps)  |  RX Rate (pps)  |
              +=============+===========================+========================+=================+===========================+========================+=================+
              |   Forward   |       100.0000 Mbps       |      95.4546 Mbps      |  95.4546 Mbps   |        148,809 pps        |      142,045 pps       |   142,045 pps   |
              +-------------+---------------------------+------------------------+-----------------+---------------------------+------------------------+-----------------+
              |   Reverse   |       100.0000 Mbps       |      95.4546 Mbps      |  95.4546 Mbps   |        148,809 pps        |      142,045 pps       |   142,045 pps   |
              +-------------+---------------------------+------------------------+-----------------+---------------------------+------------------------+-----------------+
              |    Total    |       200.0000 Mbps       |     190.9091 Mbps      |  190.9091 Mbps  |        297,618 pps        |      284,090 pps       |   284,090 pps   |
              +-------------+---------------------------+------------------------+-----------------+---------------------------+------------------------+-----------------+

            Chain Analysis:

              +-------------------+----------+-----------------+---------------+---------------+-----------------+---------------+---------------+
              |     Interface     |  Device  |  Packets (fwd)  |   Drops (fwd) |  Drop% (fwd)  |  Packets (rev)  |   Drops (rev) |  Drop% (rev)  |
              +===================+==========+=================+===============+===============+=================+===============+===============+
              | traffic-generator |   trex   |    8,522,729    |               |               |    8,522,729    |             0 |    0.0000%    |
              +-------------------+----------+-----------------+---------------+---------------+-----------------+---------------+---------------+
              | traffic-generator |   trex   |    8,522,729    |             0 |    0.0000%    |    8,522,729    |               |               |
              +-------------------+----------+-----------------+---------------+---------------+-----------------+---------------+---------------+
Example run for NDR/PDR with package size 1518B
nfvbench -c /nfvbench/nfvbenchconfig.json -fs 1518
========== NFVBench Summary ==========
Date: 2017-09-22 00:02:07
NFVBench version 1.0.9
Openstack Neutron:
  vSwitch: BASIC
  Encapsulation: BASIC
Benchmarks:
> Networks:
  > Components:
    > TOR:
        Type: None
    > Traffic Generator:
        Profile: trex-local
        Tool: TRex
    > Versions:
      > TOR:
      > Traffic Generator:
          build_date: Aug 30 2017
          version: v2.29
          built_by: hhaim
          build_time: 16:43:55
  > Measurement Parameters:
      NDR: 0.001
      PDR: 0.1
  > Service chain:
    > PVP:
      > Traffic:
          Profile: custom_traffic_profile
          Bidirectional: True
          Flow count: 10000
          Service chains count: 1
          Compute nodes: []

            Run Summary:

              +-----+-----------------+------------------+------------------+-----------------+----------------------+----------------------+----------------------+
              |  -  |   L2 Frame Size |  Rate (fwd+rev)  |  Rate (fwd+rev)  |  Avg Drop Rate  |   Avg Latency (usec) |   Min Latency (usec) |  Max Latency (usec)  |
              +=====+=================+==================+==================+=================+======================+======================+======================+
              | NDR |            1518 |   19.9805 Gbps   |  1,623,900 pps   |     0.0001%     |                  342 |                   30 |         704          |
              +-----+-----------------+------------------+------------------+-----------------+----------------------+----------------------+----------------------+
              | PDR |            1518 |   20.0000 Gbps   |  1,625,486 pps   |     0.0022%     |                  469 |                   40 |        1,266         |
              +-----+-----------------+------------------+------------------+-----------------+----------------------+----------------------+----------------------+


            L2 frame size: 1518
            Chain analysis duration: 660.442 seconds
            NDR search duration: 660 seconds
            PDR search duration: 0 seconds
This section covers a few examples on how to run NFVbench with multiple different settings. Below are shown the most common and useful use-cases and explained some fields from a default config file.
NFVbench always starts with a default configuration which can further be refined (overridden) by the user from the CLI or from REST requests.
At first have a look at the default config:
nfvbench --show-default-config
It is sometimes useful derive your own configuration from a copy of the default config:
nfvbench --show-default-config > nfvbench.cfg
At this point you can edit the copy by:
A run with the new confguration can then simply be requested using the -c option and by using the actual path of the configuration file as seen from inside the container (in this example, we assume the current directory is mapped to /tmp/nfvbench in the container):
nfvbench -c /tmp/nfvbench/nfvbench.cfg
The same -c option also accepts any valid yaml or json string to override certain parameters without having to create a configuration file.
NFVbench provides many configuration options as optional arguments. For example the number of flows can be specified using the –flow-count option.
The flow count option can be specified in any of 3 ways:
Because configuration parameters can be overriden, it is sometimes useful to show the final configuration (after all oevrrides are done) by using the –show-config option. This final configuration is also called the “running” configuration.
For example, this will only display the running configuration (without actually running anything):
nfvbench -c "{flow_count: 100k, debug: true}" --show-config
NFVbench allows to test connectivity to devices used with the selected packet path. It runs the whole test, but without actually sending any traffic. It is also a good way to check if everything is configured properly in the configuration file and what versions of components are used.
To verify everything works without sending any traffic, use the –no-traffic option:
nfvbench --no-traffic
Used parameters:
--no-traffic or -0 : sending traffic from traffic generator is skippedFixed rate run is the most basic type of NFVbench usage. It can be used to measure the drop rate with a fixed transmission rate of packets.
This example shows how to run the PVP packet path (which is the default packet path) with multiple different settings:
nfvbench -c nfvbench.cfg --no-cleanup --rate 100000pps --duration 30 --interval 15 --json results.json
Used parameters:
-c nfvbench.cfg : path to the config file--no-cleanup : resources (networks, VMs, attached ports) are not deleted after test is finished--rate 100000pps : defines rate of packets sent by traffic generator--duration 30 : specifies how long should traffic be running in seconds--interval 15 : stats are checked and shown periodically (in seconds) in this interval when traffic is flowing--json results.json : collected data are stored in this file after run is finishedNote
It is your responsibility to clean up resources if needed when --no-cleanup parameter is used. You can use the nfvbench_cleanup helper script for that purpose.
The --json parameter makes it easy to store NFVbench results. The –show-summary (or -ss) option can be used to display the results in a json results file in a text tabular format:
nfvbench --show-summary results.json
This example shows how to specify a different packet path:
nfvbench -c nfvbench.cfg --rate 1Mbps --inter-node --service-chain PVVP
Used parameters:
-c nfvbench.cfg : path to the config file--rate 1Mbps : defines rate of packets sent by traffic generator--inter-node : VMs are created on different compute nodes, works only with PVVP flow--service-chain PVVP or -sc PVVP : specifies the type of service chain (or packet path) to useNote
When parameter --inter-node is not used or there aren’t enough compute nodes, VMs are on the same compute node.
Parameter --rate accepts different types of values:
1000pps or 10kpps50%1Gbps, 1000bpsndr_pdrNDR/PDR is the default rate when not specified.
The NDR and PDR test is used to determine the maximum throughput performance of the system under test following guidelines defined in RFC-2544:
The NDR search can also be relaxed to allow some very small amount of drop rate (lower than the PDR maximum drop rate). NFVbench will measure the NDR and PDR values by driving the traffic generator through multiple iterations at different transmission rates using a binary search algorithm.
The configuration file contains section where settings for NDR/PDR can be set.
# NDR/PDR configuration
measurement:
    # Drop rates represent the ratio of dropped packet to the total number of packets sent.
    # Values provided here are percentages. A value of 0.01 means that at most 0.01% of all
    # packets sent are dropped (or 1 packet every 10,000 packets sent)

    # No Drop Rate; Default to 0.001%
    NDR: 0.001
    # Partial Drop Rate; NDR should always be less than PDR
    PDR: 0.1
    # The accuracy of NDR and PDR load percentiles; The actual load percentile that match NDR
    # or PDR should be within `load_epsilon` difference than the one calculated.
    load_epsilon: 0.1
Because NDR/PDR is the default --rate value, it is possible to run NFVbench simply like this:
nfvbench -c nfvbench.cfg
Other possible run options:
nfvbench -c nfvbench.cfg --duration 120 --json results.json
Used parameters:
-c nfvbench.cfg : path to the config file--duration 120 : specifies how long should be traffic running in each iteration--json results.json : collected data are stored in this file after run is finishedNFVbench allows to run multiple chains at the same time. For example it is possible to stage the PVP service chain N-times, where N can be as much as your compute power can scale. With N = 10, NFVbench will spawn 10 VMs as a part of 10 simultaneous PVP chains.
The number of chains is specified by --service-chain-count or -scc flag with a default value of 1.
For example to run NFVbench with 3 PVP chains:
nfvbench -c nfvbench.cfg --rate 10000pps -scc 3
It is not necessary to specify the service chain type (-sc) because PVP is set as default. The PVP service chains will have 3 VMs in 3 chains with this configuration.
If -sc PVVP is specified instead, there would be 6 VMs in 3 chains as this service chain has 2 VMs per chain.
Both single run or NDR/PDR can be run as multichain. Running multichain is a scenario closer to a real life situation than runs with a single chain.
NFVbench can measure the performance of 1 or more L3 service chains that are setup externally. Instead of being setup by NFVbench, the complete environment (VMs and networks) has to be setup prior to running NFVbench.
Each external chain is made of 1 or more VNFs and has exactly 2 end network interfaces (left and right network interfaces) that are connected to 2 neutron networks (left and right networks). The internal composition of a multi-VNF service chain can be arbitrary (usually linear) as far as NFVbench is concerned, the only requirement is that the service chain can route L3 packets properly between the left and right networks.
To run NFVbench on such external service chains:
explicitly tell NFVbench to use external service chain by adding -sc EXT or --service-chain EXT to NFVbench CLI options
specify the number of external chains using the -scc option (defaults to 1 chain)
external_networks inside the config file.specify the router gateway IPs for the external service chains (1.1.0.2 and 2.2.0.2)
specify the traffic generator gateway IPs for the external service chains (1.1.0.102 and 2.2.0.102 in diagram below)
specify the packet source and destination IPs for the virtual devices that are simulated (10.0.0.0/8 and 20.0.0.0/8)
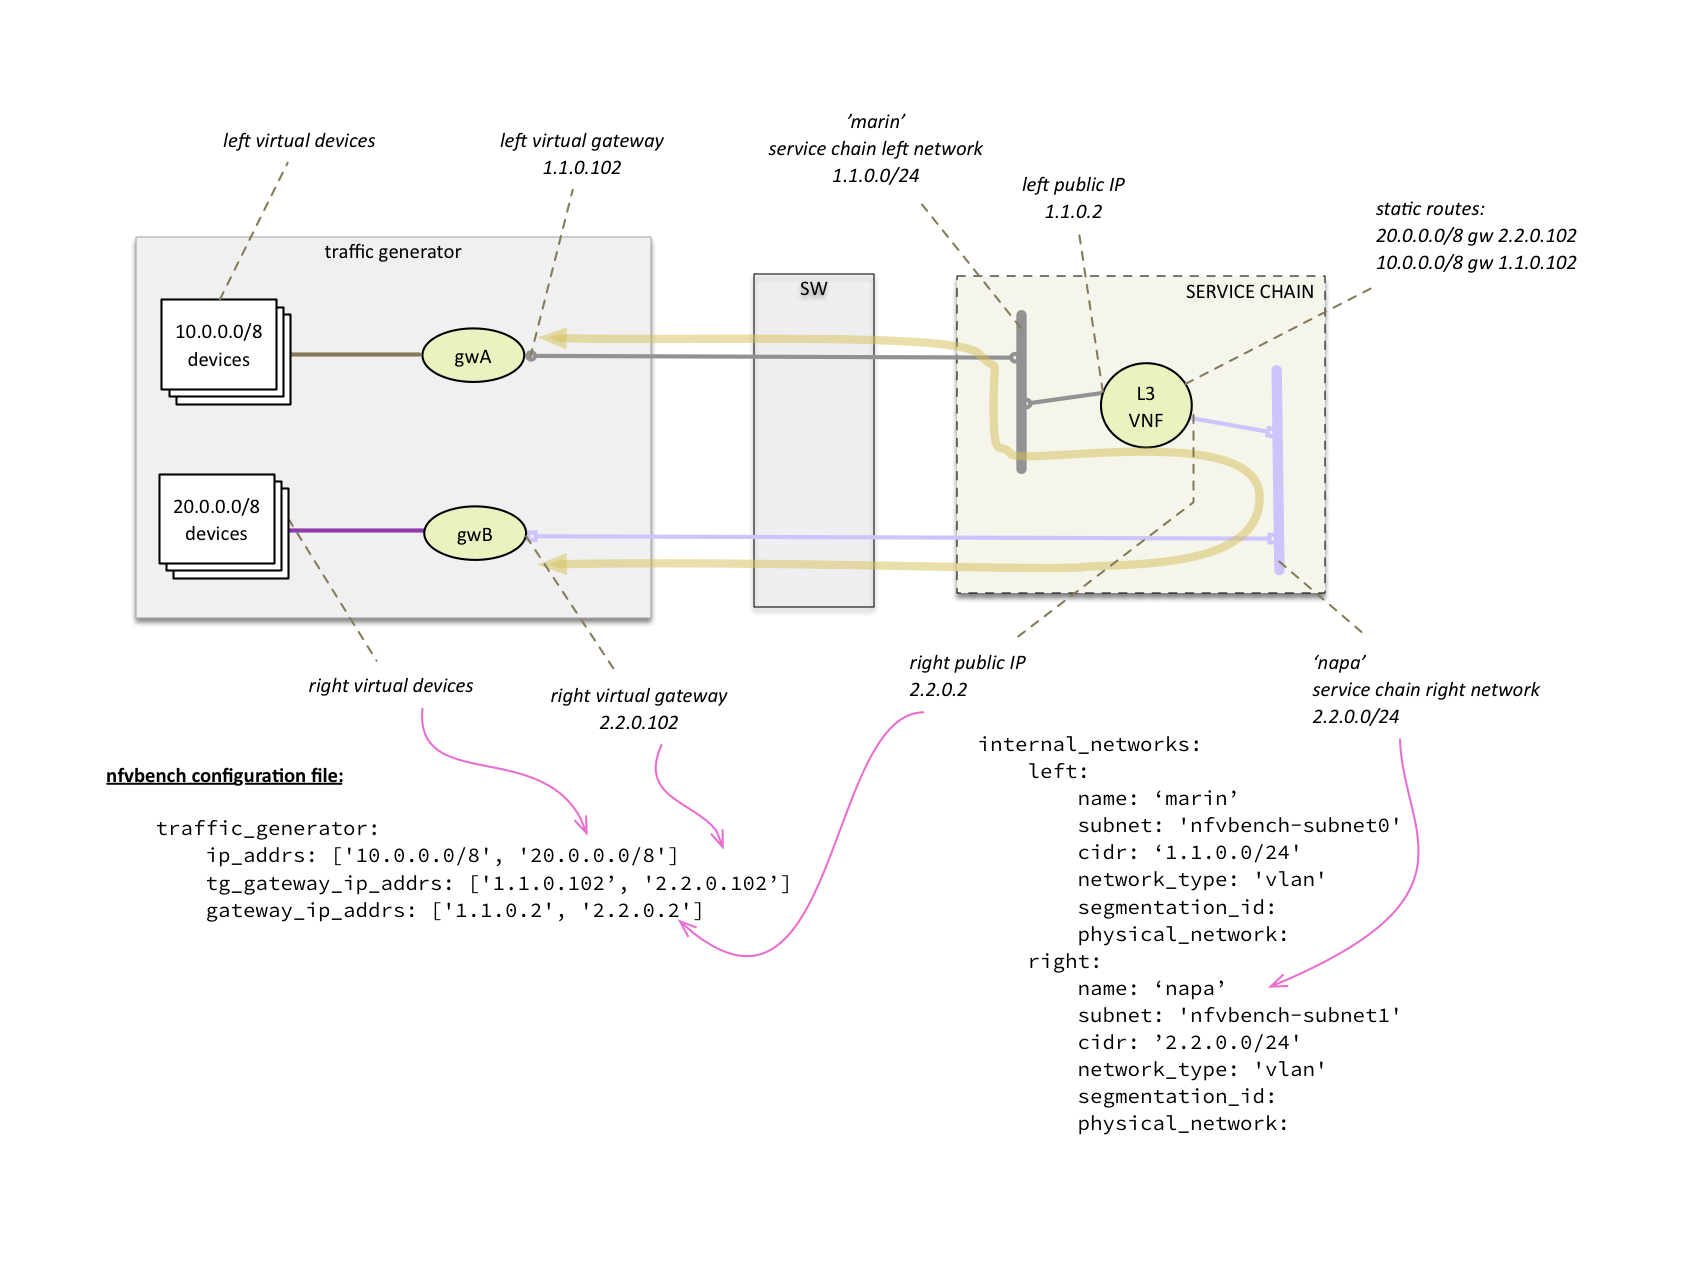
L3 routing must be enabled in the VNF and configured to:
Upon start, NFVbench will: - first retrieve the properties of the left and right networks using Neutron APIs, - extract the underlying network ID (typically VLAN segmentation ID), - generate packets with the proper VLAN ID and measure traffic.
Note that in the case of multiple chains, all chains end interfaces must be connected to the same two left and right networks. The traffic will be load balanced across the corresponding gateway IP of these external service chains.
NFVbench always generates L3 packets from the traffic generator but allows the user to specify how many flows to generate. A flow is identified by a unique src/dest MAC IP and port tuple that is sent by the traffic generator. Flows are generated by ranging the IP adresses but using a small fixed number of MAC addresses.
The number of flows will be spread roughly even between chains when more than 1 chain is being tested. For example, for 11 flows and 3 chains, number of flows that will run for each chain will be 3, 4, and 4 flows respectively.
The number of flows is specified by --flow-count or -fc flag, the default value is 2 (1 flow in each direction).
To run NFVbench with 3 chains and 100 flows, use the following command:
nfvbench -c nfvbench.cfg --rate 10000pps -scc 3 -fc 100
Note that from a vswitch point of view, the number of flows seen will be higher as it will be at least 4 times the number of flows sent by the traffic generator (add flow to VM and flow from VM).
IP addresses generated can be controlled with the following NFVbench configuration options:
ip_addrs: ['10.0.0.0/8', '20.0.0.0/8']
ip_addrs_step: 0.0.0.1
tg_gateway_ip_addrs: ['1.1.0.100', '2.2.0.100']
tg_gateway_ip_addrs_step: 0.0.0.1
gateway_ip_addrs: ['1.1.0.2', '2.2.0.2']
gateway_ip_addrs_step: 0.0.0.1
ip_addrs are the start of the 2 ip address ranges used by the traffic generators as the packets source and destination packets
where each range is associated to virtual devices simulated behind 1 physical interface of the traffic generator.
These can also be written in CIDR notation to represent the subnet.
tg_gateway_ip_addrs are the traffic generator gateway (virtual) ip addresses, all traffic to/from the virtual devices go through them.
gateway_ip_addrs are the 2 gateway ip address ranges of the VMs used in the external chains. They are only used with external chains and must correspond to their public IP address.
The corresponding step is used for ranging the IP addresses from the ip_addrs`, tg_gateway_ip_addrs and gateway_ip_addrs base addresses.
0.0.0.1 is the default step for all IP ranges. In ip_addrs, ‘random’ can be configured which tells NFVBench to generate random src/dst IP pairs in the traffic stream.
While traffic configuration can be modified using the configuration file, it can be inconvenient to have to change the configuration file everytime you need to change a traffic configuration option. Traffic configuration options can be overridden with a few CLI options.
Here is an example of configuring traffic via CLI:
nfvbench --rate 10kpps --service-chain-count 2 -fs 64 -fs IMIX -fs 1518 --unidir
This command will run NFVbench with a unidirectional flow for three packet sizes 64B, IMIX, and 1518B.
Used parameters:
--rate 10kpps : defines rate of packets sent by traffic generator (total TX rate)-scc 2 or --service-chain-count 2 : specifies number of parallel chains of given flow to run (default to 1)-fs 64 or --frame-size 64: add the specified frame size to the list of frame sizes to run--unidir : run traffic with unidirectional flow (default to bidirectional flow)NFVbench will dicover the MAC addresses to use for generated frames using: - either OpenStack discovery (find the MAC of an existing VM) in the case of PVP and PVVP service chains - or using dynamic ARP discovery (find MAC from IP) in the case of external chains.
The –status option will display the status of NFVbench and list any NFVbench resources. You need to pass the OpenStack RC file in order to connect to OpenStack.
# nfvbench --status -r /tmp/nfvbench/openrc
2018-04-09 17:05:48,682 INFO Version: 1.3.2.dev1
2018-04-09 17:05:48,683 INFO Status: idle
2018-04-09 17:05:48,757 INFO Discovering instances nfvbench-loop-vm...
2018-04-09 17:05:49,252 INFO Discovering flavor nfvbench.medium...
2018-04-09 17:05:49,281 INFO Discovering networks...
2018-04-09 17:05:49,365 INFO No matching NFVbench resources found
#
The Status can be either “idle” or “busy (run pending)”.
The –cleanup option will first discover resources created by NFVbench and prompt if you want to proceed with cleaning them up. Example of run:
# nfvbench --cleanup -r /tmp/nfvbench/openrc
2018-04-09 16:58:00,204 INFO Version: 1.3.2.dev1
2018-04-09 16:58:00,205 INFO Status: idle
2018-04-09 16:58:00,279 INFO Discovering instances nfvbench-loop-vm...
2018-04-09 16:58:00,829 INFO Discovering flavor nfvbench.medium...
2018-04-09 16:58:00,876 INFO Discovering networks...
2018-04-09 16:58:00,960 INFO Discovering ports...
2018-04-09 16:58:01,012 INFO Discovered 6 NFVbench resources:
+----------+-------------------+--------------------------------------+
| Type     | Name              | UUID                                 |
|----------+-------------------+--------------------------------------|
| Instance | nfvbench-loop-vm0 | b039b858-777e-467e-99fb-362f856f4a94 |
| Flavor   | nfvbench.medium   | a027003c-ad86-4f24-b676-2b05bb06adc0 |
| Network  | nfvbench-net0     | bca8d183-538e-4965-880e-fd92d48bfe0d |
| Network  | nfvbench-net1     | c582a201-8279-4309-8084-7edd6511092c |
| Port     |                   | 67740862-80ac-4371-b04e-58a0b0f05085 |
| Port     |                   | b5db95b9-e419-4725-951a-9a8f7841e66a |
+----------+-------------------+--------------------------------------+
2018-04-09 16:58:01,013 INFO NFVbench will delete all resources shown...
Are you sure? (y/n) y
2018-04-09 16:58:01,865 INFO Deleting instance nfvbench-loop-vm0...
2018-04-09 16:58:02,058 INFO     Waiting for 1 instances to be fully deleted...
2018-04-09 16:58:02,182 INFO     1 yet to be deleted by Nova, retries left=6...
2018-04-09 16:58:04,506 INFO     1 yet to be deleted by Nova, retries left=5...
2018-04-09 16:58:06,636 INFO     1 yet to be deleted by Nova, retries left=4...
2018-04-09 16:58:08,701 INFO Deleting flavor nfvbench.medium...
2018-04-09 16:58:08,729 INFO Deleting port 67740862-80ac-4371-b04e-58a0b0f05085...
2018-04-09 16:58:09,102 INFO Deleting port b5db95b9-e419-4725-951a-9a8f7841e66a...
2018-04-09 16:58:09,620 INFO Deleting network nfvbench-net0...
2018-04-09 16:58:10,357 INFO Deleting network nfvbench-net1...
#
The –force-cleanup option will do the same but without prompting for confirmation.
NFVbench has an optional fluentd integration to save logs and results.
The following configurations should be added to Fluentd configuration file to enable logs or results.
To receive logs, and forward to a storage server:
In the example below nfvbench is the tag name for logs (which should be matched with logging_tag under NFVbench configuration), and storage backend is elasticsearch which is running at localhost:9200.
<match nfvbench.**>
@type copy
<store>
    @type elasticsearch
    host localhost
    port 9200
    logstash_format true
    logstash_prefix nfvbench
    utc_index false
    flush_interval 15s
</store>
</match>
To receive results, and forward to a storage server:
In the example below resultnfvbench is the tag name for results (which should be matched with result_tag under NFVbench configuration), and storage backend is elasticsearch which is running at localhost:9200.
<match resultnfvbench.**>
@type copy
<store>
    @type elasticsearch
    host localhost
    port 9200
    logstash_format true
    logstash_prefix resultnfvbench
    utc_index false
    flush_interval 15s
</store>
</match>
To configure NFVbench to connect Fluentd, fill following configuration parameters in the configuration file
| Configuration | Description |
|---|---|
| logging_tag | Tag for NFVbench logs, it should be the same tag defined in Fluentd configuration |
| result_tag | Tag for NFVbench results, it should be the same tag defined in Fluentd configuration |
| ip | ip address of Fluentd server |
| port | port number of Fluentd serverd |
An example of configuration for Fluentd working at 127.0.0.1:24224 and tags for logging is nfvbench and result is resultnfvbench
fluentd:
    # by default (logging_tag is empty) nfvbench log messages are not sent to fluentd
    # to enable logging to fluents, specify a valid fluentd tag name to be used for the
    # log records
    logging_tag: nfvbench

    # by default (result_tag is empty) nfvbench results are not sent to fluentd
    # to enable sending nfvbench results to fluentd, specify a valid fluentd tag name
    # to be used for the results records, which is different than logging_tag
    result_tag: resultnfvbench

    # IP address of the server, defaults to loopback
    ip: 127.0.0.1

    # port # to use, by default, use the default fluentd forward port
    port: 24224
An example of log obtained from fluentd by elasticsearch:
{
  "_index": "nfvbench-2017.10.17",
  "_type": "fluentd",
  "_id": "AV8rhnCjTgGF_dX8DiKK",
  "_version": 1,
  "_score": 3,
  "_source": {
    "loglevel": "INFO",
    "message": "Service chain 'PVP' run completed.",
    "@timestamp": "2017-10-17T18:09:09.516897+0000",
    "runlogdate": "2017-10-17T18:08:51.851253+0000"
  },
  "fields": {
    "@timestamp": [
      1508263749516
    ]
  }
}
For each packet size and rate a result record is sent. Users can label those results by passing –user-label parameter to NFVbench run
And the results of this command obtained from fluentd by elasticsearch:
{
  "_index": "resultnfvbench-2017.10.17",
  "_type": "fluentd",
  "_id": "AV8rjYlbTgGF_dX8Drl1",
  "_version": 1,
  "_score": null,
  "_source": {
    "compute_nodes": [
      "nova:compute-3"
    ],
    "total_orig_rate_bps": 200000000,
    "@timestamp": "2017-10-17T18:16:43.755240+0000",
    "frame_size": "64",
    "forward_orig_rate_pps": 148809,
    "flow_count": 10000,
    "avg_delay_usec": 6271,
    "total_tx_rate_pps": 283169,
    "total_tx_rate_bps": 190289668,
    "forward_tx_rate_bps": 95143832,
    "reverse_tx_rate_bps": 95145836,
    "forward_tx_rate_pps": 141583,
    "chain_analysis_duration": "60.091",
    "service_chain": "PVP",
    "version": "1.0.10.dev1",
    "runlogdate": "2017-10-17T18:10:12.134260+0000",
    "Encapsulation": "VLAN",
    "user_label": "nfvbench-label",
    "min_delay_usec": 70,
    "profile": "traffic_profile_64B",
    "reverse_rx_rate_pps": 68479,
    "reverse_rx_rate_bps": 46018044,
    "reverse_orig_rate_pps": 148809,
    "total_rx_rate_bps": 92030085,
    "drop_rate_percent": 51.6368455626846,
    "forward_orig_rate_bps": 100000000,
    "bidirectional": true,
    "vSwitch": "OPENVSWITCH",
    "sc_count": 1,
    "total_orig_rate_pps": 297618,
    "type": "single_run",
    "reverse_orig_rate_bps": 100000000,
    "total_rx_rate_pps": 136949,
    "max_delay_usec": 106850,
    "forward_rx_rate_pps": 68470,
    "forward_rx_rate_bps": 46012041,
    "reverse_tx_rate_pps": 141586
  },
  "fields": {
    "@timestamp": [
      1508264203755
    ]
  },
  "sort": [
    1508264203755
  ]
}
NFVbench supports SR-IOV with the PVP packet flow (PVVP is not supported). SR-IOV support is not applicable for external chains since the networks have to be setup externally (and can themselves be pre-set to use SR-IOV or not).
To test SR-IOV you need to have compute nodes configured to support one or more SR-IOV interfaces (also knows as PF or physical function) and you need OpenStack to be configured to support SR-IOV. You will also need to know: - the name of the physical networks associated to your SR-IOV interfaces (this is a configuration in Nova compute) - the VLAN range that can be used on the switch ports that are wired to the SR-IOV ports. Such switch ports are normally configured in trunk mode with a range of VLAN ids enabled on that port
For example, in the case of 2 SR-IOV ports per compute node, 2 physical networks are generally configured in OpenStack with a distinct name. The VLAN range to use is is also allocated and reserved by the network administrator and in coordination with the corresponding top of rack switch port configuration.
To enable SR-IOV test, you will need to provide the following configuration options to NFVbench (in the configuration file). This example instructs NFVbench to create the left and right networks of a PVP packet flow to run on 2 SRIOV ports named “phys_sriov0” and “phys_sriov1” using resp. segmentation_id 2000 and 2001:
internal_networks:
   left:
       segmentation_id: 2000
       physical_network: phys_sriov0
   right:
       segmentation_id: 2001
       physical_network: phys_sriov1
The segmentation ID fields must be different. In the case of PVVP, the middle network also needs to be provisioned properly. The same physical network can also be shared by the virtual networks but with different segmentation IDs.
If the 2 selected ports reside on NICs that are on different NUMA sockets, you will need to explicitly tell Nova to use 2 numa nodes in the flavor used for the VMs in order to satisfy the filters, for example:
flavor:
  # Number of vCPUs for the flavor
  vcpus: 2
  # Memory for the flavor in MB
  ram: 8192
  # Size of local disk in GB
  disk: 0
  extra_specs:
      "hw:cpu_policy": dedicated
      "hw:mem_page_size": large
      "hw:numa_nodes": 2
Failure to do so might cause the VM creation to fail with the Nova error “Instance creation error: Insufficient compute resources: Requested instance NUMA topology together with requested PCI devices cannot fit the given host NUMA topology.”
NFVbench can run as an HTTP server to:
To run in server mode, simply use the –server <http_root_path> and optionally the listen address to use (–host <ip>, default is 0.0.0.0) and listening port to use (–port <port>, default is 7555).
If HTTP files are to be serviced, they must be stored right under the http root path. This root path must contain a static folder to hold static files (css, js) and a templates folder with at least an index.html file to hold the template of the index.html file to be used. This mode is convenient when you do not already have a WEB server hosting the UI front end. If HTTP files servicing is not needed (REST only or WebSocket/SocketIO mode), the root path can point to any dummy folder.
Once started, the NFVbench server will be ready to service HTTP or WebSocket/SocketIO requests at the advertised URL.
Example of NFVbench server start in a container:
# get to the container shell (assume the container name is "nfvbench")
docker exec -it nfvbench bash
# from the container shell start the NFVbench server in the background
nfvbench -c /tmp/nfvbench/nfvbench.cfg --server /tmp &
# exit container
exit
This request simply returns whatever content is sent in the body of the request (body should be in json format, only used for testing)
Example request:
curl -XGET '127.0.0.1:7556/echo' -H "Content-Type: application/json" -d '{"nfvbench": "test"}'
Response:
{
  "nfvbench": "test"
}
This request fetches the status of an asynchronous run. It will return in json format:
The client can keep polling until the run completes.
Example of return when the run is still pending:
{
  "error_message": "nfvbench run still pending",
  "status": "PENDING"
}
Example of return when the run completes:
{
  "result": {...}
  "status": "OK"
}
This request starts an NFVBench run with passed configurations. If no configuration is passed, a run with default configurations will be executed.
Example request: curl -XPOST ‘localhost:7556/start_run’ -H “Content-Type: application/json” -d @nfvbenchconfig.json
See “NFVbench configuration JSON parameter” below for details on how to format this parameter.
The request returns immediately with a json content indicating if there was an error (status=ERROR) or if the request was submitted successfully (status=PENDING). Example of return when the submission is successful:
{
  "error_message": "NFVbench run still pending",
  "request_id": "42cccb7effdc43caa47f722f0ca8ec96",
  "status": "PENDING"
}
If there is already an NFVBench running then it will return:
{
 "error_message": "there is already an NFVbench request running",
 "status": "ERROR"
}
List of SocketIO events supported:
start_run:
sent by client to start a new run with the configuration passed in argument (JSON). The configuration can be any valid NFVbench configuration passed as a JSON document (see “NFVbench configuration JSON parameter” below)
run_interval_stats:
sent by server to report statistics during a run the message contains the statistics {‘time_ms’: time_ms, ‘tx_pps’: tx_pps, ‘rx_pps’: rx_pps, ‘drop_pct’: drop_pct}
ndr_found:
(during NDR-PDR search) sent by server when the NDR rate is found the message contains the NDR value {‘rate_pps’: ndr_pps}
ndr_found:
(during NDR-PDR search) sent by server when the PDR rate is found the message contains the PDR value {‘rate_pps’: pdr_pps}
run_end:
sent by server to report the end of a run the message contains the complete results in JSON format
The NFVbench configuration describes the parameters of an NFVbench run and can be passed to the NFVbench server as a JSON document.
The simplest JSON document is the empty dictionary “{}” which indicates to use the default NFVbench configuration:
The entire default configuration can be viewed using the –show-json-config option on the cli:
# nfvbench --show-config
{
    "availability_zone": null,
    "compute_node_user": "root",
    "compute_nodes": null,
    "debug": false,
    "duration_sec": 60,
    "flavor": {
        "disk": 0,
        "extra_specs": {
            "hw:cpu_policy": "dedicated",
            "hw:mem_page_size": 2048
        },
        "ram": 8192,
        "vcpus": 2
    },
    "flavor_type": "nfv.medium",
    "flow_count": 1,
    "generic_poll_sec": 2,
    "generic_retry_count": 100,
    "inter_node": false,
    "internal_networks": {
        "left": {
            "name": "nfvbench-net0",
            "subnet": "nfvbench-subnet0",
            "cidr": "192.168.1.0/24",
        },
        "right": {
            "name": "nfvbench-net1",
            "subnet": "nfvbench-subnet1",
            "cidr": "192.168.2.0/24",
        },
        "middle": {
            "name": "nfvbench-net2",
            "subnet": "nfvbench-subnet2",
            "cidr": "192.168.3.0/24",
        }
    },
    "interval_sec": 10,
    "json": null,
    "loop_vm_name": "nfvbench-loop-vm",
    "measurement": {
        "NDR": 0.001,
        "PDR": 0.1,
        "load_epsilon": 0.1
    },
    "name": "(built-in default config)",
    "no_cleanup": false,
    "no_traffic": false,
    "openrc_file": "/tmp/nfvbench/openstack/openrc",
    "rate": "ndr_pdr",
    "service_chain": "PVP",
    "service_chain_count": 1,
    "sriov": false,
    "std_json": null,
    "traffic": {
        "bidirectional": true,
        "profile": "traffic_profile_64B"
    },
    "traffic_generator": {
        "default_profile": "trex-local",
        "gateway_ip_addrs": [
            "1.1.0.2",
            "2.2.0.2"
        ],
        "gateway_ip_addrs_step": "0.0.0.1",
        "generator_profile": [
            {
                "cores": 3,
                "interfaces": [
                    {
                        "pci": "0a:00.0",
                        "port": 0,
                        "switch_port": "Ethernet1/33",
                        "vlan": null
                    },
                    {
                        "pci": "0a:00.1",
                        "port": 1,
                        "switch_port": "Ethernet1/34",
                        "vlan": null
                    }
                ],
                "intf_speed": null,
                "ip": "127.0.0.1",
                "name": "trex-local",
                "tool": "TRex"
            }
        ],
        "host_name": "nfvbench_tg",
        "ip_addrs": [
            "10.0.0.0/8",
            "20.0.0.0/8"
        ],
        "ip_addrs_step": "0.0.0.1",
        "mac_addrs": [
            "00:10:94:00:0A:00",
            "00:11:94:00:0A:00"
        ],
        "step_mac": null,
        "tg_gateway_ip_addrs": [
            "1.1.0.100",
            "2.2.0.100"
        ],
        "tg_gateway_ip_addrs_step": "0.0.0.1"
    },
    "traffic_profile": [
        {
            "l2frame_size": [
                "64"
            ],
            "name": "traffic_profile_64B"
        },
        {
            "l2frame_size": [
                "IMIX"
            ],
            "name": "traffic_profile_IMIX"
        },
        {
            "l2frame_size": [
                "1518"
            ],
            "name": "traffic_profile_1518B"
        },
        {
            "l2frame_size": [
                "64",
                "IMIX",
                "1518"
            ],
            "name": "traffic_profile_3sizes"
        }
    ],
    "unidir_reverse_traffic_pps": 1,
    "vlan_tagging": true,
}
Use the default configuration but use 10000 flows per direction (instead of 1):
{ "flow_count": 10000 }
Use default confguration but with 10000 flows, “EXT” chain and IMIX packet size:
{
   "flow_count": 10000,
   "service_chain": "EXT",
    "traffic": {
        "profile": "traffic_profile_IMIX"
    },
}
A short run of 5 seconds at a fixed rate of 1Mpps (and everything else same as the default configuration):
{
   "duration": 5,
   "rate": "1Mpps"
}
HTTP requests can be sent directly to the NFVbench server from CLI using curl from any host that can connect to the server (here we run it from the local host).
This is a POST request to start a run using the default NFVbench configuration but with traffic generation disabled (“no_traffic” property is set to true):
[root@sjc04-pod3-mgmt ~]# curl -H "Accept: application/json" -H "Content-type: application/json" -X POST -d '{"no_traffic":true}' http://127.0.0.1:7555/start_run
{
  "error_message": "nfvbench run still pending",
  "status": "PENDING"
}
[root@sjc04-pod3-mgmt ~]#
This request will return immediately with status set to “PENDING” if the request was started successfully.
The status can be polled until the run completes. Here the poll returns a “PENDING” status, indicating the run is still not completed:
[root@sjc04-pod3-mgmt ~]# curl -G http://127.0.0.1:7555/status
{
  "error_message": "nfvbench run still pending",
  "status": "PENDING"
}
[root@sjc04-pod3-mgmt ~]#
Finally, the status request returns a “OK” status along with the full results (truncated here):
[root@sjc04-pod3-mgmt ~]# curl -G http://127.0.0.1:7555/status
{
  "result": {
    "benchmarks": {
      "network": {
        "service_chain": {
          "PVP": {
            "result": {
              "bidirectional": true,
              "compute_nodes": {
                "nova:sjc04-pod3-compute-4": {
                  "bios_settings": {
                    "Adjacent Cache Line Prefetcher": "Disabled",
                    "All Onboard LOM Ports": "Enabled",
                    "All PCIe Slots OptionROM": "Enabled",
                    "Altitude": "300 M",
...

    "date": "2017-03-31 22:15:41",
    "nfvbench_version": "0.3.5",
    "openstack_spec": {
      "encaps": "VxLAN",
      "vswitch": "VTS"
    }
  },
  "status": "OK"
}
[root@sjc04-pod3-mgmt ~]#
The module client/client.py contains an example of python class that can be used to control the NFVbench server from a python app using HTTP or WebSocket/SocketIO.
The module client/nfvbench_client.py has a simple main application to control the NFVbench server from CLI. The “nfvbench_client” wrapper script can be used to invoke the client front end (this wrapper is pre-installed in the NFVbench container)
Example of invocation of the nfvbench_client front end, from the host (assume the name of the NFVbench container is “nfvbench”), use the default NFVbench configuration but do not generate traffic (no_traffic property set to true, the full json result is truncated here):
[root@sjc04-pod3-mgmt ~]# docker exec -it nfvbench nfvbench_client -c '{"no_traffic":true}' http://127.0.0.1:7555
{u'status': u'PENDING', u'error_message': u'nfvbench run still pending'}
{u'status': u'PENDING', u'error_message': u'nfvbench run still pending'}
{u'status': u'PENDING', u'error_message': u'nfvbench run still pending'}

{u'status': u'OK', u'result': {u'date': u'2017-03-31 22:04:59', u'nfvbench_version': u'0.3.5',
 u'config': {u'compute_nodes': None, u'compute_node_user': u'root', u'traffic_generator': {u'tg_gateway_ip_addrs': [u'1.1.0.100', u'2.2.0.100'], u'ip_addrs_step': u'0.0.0.1',
 u'step_mac': None, u'generator_profile': [{u'intf_speed': u'', u'interfaces': [{u'pci': u'0a:00.0', u'port': 0, u'vlan': 1998, u'switch_port': None},

...

[root@sjc04-pod3-mgmt ~]#
The http interface is used unless –use-socketio is defined.
Example of invocation using Websocket/SocketIO, execute NFVbench using the default configuration but with a duration of 5 seconds and a fixed rate run of 5kpps.
[root@sjc04-pod3-mgmt ~]# docker exec -it nfvbench nfvbench_client -c '{"duration":5,"rate":"5kpps"}' --use-socketio http://127.0.0.1:7555 >results.json
Yes. This can be done using the EXT chain mode, with or without ARP (depending on whether your systen under test can do routing) and by setting the openrc_file property to empty in the NFVbench configuration.
This is possible but requires developing a new python class to manage the new traffic generator interface.
Yes.
NFVbench can run in server mode and accept HTTP or WebSocket/SocketIO events to run any type of measurement (fixed rate run or NDR_PDR run) with any run configuration.
Yes provided your UCS-B series server has a Cisco VIC 1340 (with a recent firmware version). TRex will require VIC firmware version 3.1(2) or higher for blade servers (which supports more filtering capabilities). In this setting, the 2 physical interfaces for data plane traffic are simply hooked to the UCS-B fabric interconnect (no need to connect to a switch).
Prior to running a benchmark, NFVbench will make sure that traffic is passing in the service chain by sending a small flow of packets in each direction and verifying that they are received back at the other end. This exception means that NFVbench cannot pass any traffic in the service chain.
The most common issues that prevent traffic from passing are: - incorrect wiring of the NFVbench/TRex interfaces - incorrect vlan_tagging setting in the NFVbench configuration, this needs to match how the NFVbench ports on the switch are configured (trunk or access port)
- if the switch port is configured as access port, you must disable vlan_tagging in the NFVbench configuration
- of the switch port is configured as trunk (recommended method), you must enable it
The purpose of StorPerf is to provide a tool to measure ephemeral and block storage performance of OpenStack.
A key challenge to measuring disk performance is to know when the disk (or, for OpenStack, the virtual disk or volume) is performing at a consistent and repeatable level of performance. Initial writes to a volume can perform poorly due to block allocation, and reads can appear instantaneous when reading empty blocks. How do we know when the data reported is valid? The Storage Network Industry Association (SNIA) has developed methods which enable manufacturers to set, and customers to compare, the performance specifications of Solid State Storage devices. StorPerf applies this methodology to OpenStack Cinder and Glance services to provide a high level of confidence in the performance metrics in the shortest reasonable time.
Once launched, StorPerf presents a ReST interface, along with a Swagger UI that makes it easier to form HTTP ReST requests. Issuing an HTTP POST to the configurations API causes StorPerf to talk to OpenStack’s heat service to create a new stack with as many agent VMs and attached Cinder volumes as specified.
After the stack is created, we can issue one or more jobs by issuing a POST to the jobs ReST API. The job is the smallest unit of work that StorPerf can use to measure the disk’s performance.
While the job is running, StorPerf collects the performance metrics from each of the disks under test every minute. Once the trend of metrics match the criteria specified in the SNIA methodology, the job automatically terminates and the valid set of metrics are available for querying.
What is the criteria? Simply put, it specifies that when the metrics measured start to “flat line” and stay within that range for the specified amount of time, then the metrics are considered to be indicative of a repeatable level of performance.
First of all, StorPerf is not able to give pointers on how to tune a Cinder implementation, as there are far too many backends (Ceph, NFS, LVM, etc), each with their own methods of tuning. StorPerf is here to assist in getting a reliable performance measurement by encoding the test specification from SNIA, and helping present the results in a way that makes sense.
Having said that, there are some general guidelines that we can present to assist with planning a performance test.
This is an important item to address as there are many parameters to how data is accessed. Databases typically use a fixed block size and tend to manage their data so that sequential access is more likely. GPS image tiles can be around 20-60kb and will be accessed by reading the file in full, with no easy way to predict what tiles will be needed next. Some programs are able to submit I/O asynchronously where others need to have different threads and may be synchronous. There is no one size fits all here, so knowing what type of I/O pattern we need to model is critical to getting realistic measurements.
The unfortunate part is that StorPerf does not have any knowledge about the underlying OpenStack itself – we can only see what is available through OpenStack APIs, and none of them provide details about the underlying storage implementation. As the test executor, we need to know information such as: the number of disks or storage nodes; the amount of RAM available for caching; the type of connection to the storage and bandwidth available.
As part of the test data size, we need to ensure that we prevent caching from interfering in the measurements. The total size of the data set in the test must exceed the total size of all the disk cache memory available by a certain amount in order to ensure we are forcing non-cached I/O. There is no exact science here, but if we balance test duration against cache hit ratio, it can be argued that 20% cache hit is good enough and increasing file size would result in diminishing returns. Let’s break this number down a bit. Given a cache size of 10GB, we could write, then read the following dataset sizes:
This means that for the first test, 100% of the results are unreliable due to cache. At 50GB, the true performance without cache has only a 20% margin of error. Given the fact that the 100GB would take twice as long, and that we are only reducing the margin of error by 10%, we recommend this as the best tradeoff.
How much cache do we actually have? This depends on the storage device being used. For hardware NAS or other arrays, it should be fairly easy to get the number from the manufacturer, but for software defined storage, it can be harder to determine. Let’s take Ceph as an example. Ceph runs as software on the bare metal server and therefore has access to all the RAM available on the server to use as its cache. Well, not exactly all the memory. We have to take into account the memory consumed by the operating system, by the Ceph processes, as well as any other processes running on the same system. In the case of hyper-converged Ceph, where workload VMs and Ceph run on the systems, it can become quite difficult to predict. Ultimately, the amount of memory that is left over is the cache for that single Ceph instance. We now need to add the memory available from all the other Ceph storage nodes in the environment. Time for another example: given 3 Ceph storage nodes with 256GB RAM each. Let’s take 20% off to pin to the OS and other processes, leaving approximately 240GB per node This gives us 3 x 240 or 720GB total RAM available for cache. The total amount of data we want to write in order to initialize our Cinder volumes would then be 5 x 720, or 3,600 GB. The following illustrates some ways to allocate the data:
Now that we know there is 3.6 TB of data to be written, we need to go back to the workload model to determine how we are going to write it. Factors to consider:
Once we have the information gathered, we can now start executing some tests. Let’s take some of the points discussed above and describe our system:
The first thing we know is that we want to keep our cache hit ratio around 20%, so we will be moving 3,600 GB of data. We also know this will take a significant amount of time, so here is where StorPerf helps.
First, we use the configurations API to launch our 10 virtual machines each with a 360 GB volume. Next comes the most time consuming part: we call the initializations API to fill each one of these volumes with random data. By preloading the data, we ensure a number of things:
This last part is important as we can now use StorPerf’s implementation of SNIA’s steady state algorithm to ensure our follow up tests execute as quickly as possible. Given the fact that 80% of the data in any given test results in a cache miss, we can run multiple tests in a row without having to re-initialize or invalidate the cache again in between test runs. We can also mix and match the types of workloads to be run in a single performance job submission.
Now we can submit a job to the jobs API to execute a 70%/30% mix of read/write, with a block size of 4k and an I/O queue depth of 6. This job will run until either the maximum time has expired, or until StorPerf detects steady state has been reached, at which point it will immediately complete and report the results of the measurements.
StorPerf uses FIO as its workload engine, so whatever workload parameters we would like to use with FIO can be passed directly through via StorPerf’s jobs API.
StorPerf provides the following metrics:
These metrics are available for every job, and for the specific workloads, I/O loads and I/O types (read, write) associated with the job.
For each metric, StorPerf also provides the set of samples that were collected along with the slope, min and max values that can be used for plotting or comparison.
As of this time, StorPerf only provides textual reports of the metrics.
If you do not have an Ubuntu 16.04 image in Glance, you will need to add one. You also need to create the StorPerf flavor, or choose one that closely matches. For Ubuntu 16.04, it must have a minimum of a 4 GB disk. It should also have about 8 GB RAM to support FIO’s memory mapping of written data blocks to ensure 100% coverage of the volume under test.
There are scripts in storperf/ci directory to assist, or you can use the follow code snippets:
# Put an Ubuntu Image in glance
wget -q https://cloud-images.ubuntu.com/releases/16.04/release/ubuntu-16.04-server-cloudimg-amd64-disk1.img
openstack image create "Ubuntu 16.04 x86_64" --disk-format qcow2 --public \
    --container-format bare --file ubuntu-16.04-server-cloudimg-amd64-disk1.img

# Create StorPerf flavor
openstack flavor create storperf \
    --id auto \
    --ram 8192 \
    --disk 4 \
    --vcpus 2
You must have your OpenStack Controller environment variables defined and passed to the StorPerf container. The easiest way to do this is to put the rc file contents into a clean file called admin.rc that looks similar to this for V2 authentication:
cat << 'EOF' > admin.rc
OS_AUTH_URL=http://10.13.182.243:5000/v2.0
OS_TENANT_ID=e8e64985506a4a508957f931d1800aa9
OS_TENANT_NAME=admin
OS_PROJECT_NAME=admin
OS_USERNAME=admin
OS_PASSWORD=admin
OS_REGION_NAME=RegionOne
EOF
For V3 authentication, at a minimum, use the following:
cat << 'EOF' > admin.rc
OS_AUTH_URL=http://10.10.243.14:5000/v3
OS_USERNAME=admin
OS_PASSWORD=admin
OS_PROJECT_DOMAIN_NAME=Default
OS_PROJECT_NAME=admin
OS_USER_DOMAIN_NAME=Default
EOF
Additionally, if you want your results published to the common OPNFV Test Results DB, add the following:
TEST_DB_URL=http://testresults.opnfv.org/testapi
StorPerf is delivered as a series of Docker containers managed by docker-compose. There are two possible methods for installation:
Requirements:
Local disk used for the Carbon DB storage as the default size of the docker container is only 10g. Here is an example of how to create a local storage directory and set its permissions so that StorPerf can write to it:
mkdir -p ./carbon
sudo chown 33:33 ./carbon
The following ports are exposed if you use the supplied docker-compose.yaml file:
Note: Port 8000 is no longer exposed and graphite can be accesed via http://storperf:5000/graphite
As of Euphrates (development) release (June 2017), StorPerf has changed to use docker-compose in order to start its services.
Docker compose requires a local file to be created in order to define the services that make up the full StorPerf application. This file can be:
Manual creation involves taking the sample in the StorPerf git repo and typing in the contents by hand on your target system.
wget https://raw.githubusercontent.com/opnfv/storperf/master/docker-compose/docker-compose.yaml
sha256sum docker-compose.yaml
which should result in:
69856e9788bec36308a25303ec9154ed68562e126788a47d54641d68ad22c8b9 docker-compose.yaml
To run, you must specify two environment variables:
The following command will start all the StorPerf services:
TAG=latest ENV_FILE=./admin.rc CARBON_DIR=./carbon/ docker-compose pull
TAG=latest ENV_FILE=./admin.rc CARBON_DIR=./carbon/ docker-compose up -d
StorPerf is now available at http://docker-host:5000/
A tool to help you get started with the docker-compose.yaml can be downloaded from:
wget https://raw.githubusercontent.com/opnfv/storperf/master/docker-compose/create-compose.py
sha256sum create-compose.py
which should result in:
327cad2a7b3a3ca37910978005c743799313c2b90709e4a3f142286a06e53f57 create-compose.py
Note: The script will run fine on python3. Install python future package to avoid error on python2.
pip install future
If needed, any StorPerf container can be entered with docker exec. This is not normally required.
docker exec -it storperf-master /bin/bash
The tags for StorPerf can be found here: https://hub.docker.com/r/opnfv/storperf-master/tags/
This tag represents StorPerf at its most current state of development. While self-tests have been run, there is not a guarantee that all features will be functional, or there may be bugs.
Documentation for latest can be found using the latest label at:
For x86_64 based systems, use:
TAG=x86_64-latest ENV_FILE=./admin.rc CARBON_DIR=./carbon/ docker-compose pull
TAG=x86_64-latest ENV_FILE=./admin.rc CARBON_DIR=./carbon/ docker-compose up -d
For 64 bit ARM based systems, use:
TAG=aarch64-latest ENV_FILE=./admin.rc CARBON_DIR=./carbon/ docker-compose pull
TAG=aarch64-latest ENV_FILE=./admin.rc CARBON_DIR=./carbon/ docker-compose up -d
This tag represents StorPerf at its most recent stable release. There are no known bugs and known issues and workarounds are documented in the release notes. Issues found here should be reported in JIRA:
https://jira.opnfv.org/secure/RapidBoard.jspa?rapidView=3
For x86_64 based systems, use:
TAG=x86_64-stable ENV_FILE=./admin.rc CARBON_DIR=./carbon/ docker-compose pull
TAG=x86_64-stable ENV_FILE=./admin.rc CARBON_DIR=./carbon/ docker-compose up -d
For 64 bit ARM based systems, use:
TAG=aarch64-stable ENV_FILE=./admin.rc CARBON_DIR=./carbon/ docker-compose pull
TAG=aarch64-stable ENV_FILE=./admin.rc CARBON_DIR=./carbon/ docker-compose up -d
This tag represents the 6th OPNFV release and the 5th StorPerf release. There are no known bugs and known issues and workarounds are documented in the release notes. Documentation can be found under the Fraser label at:
http://docs.opnfv.org/en/stable-fraser/submodules/storperf/docs/testing/user/index.html
Issues found here should be reported against release 6.0.0 in JIRA:
https://jira.opnfv.org/secure/RapidBoard.jspa?rapidView=3
For x86_64 based systems, use:
TAG=x86_64-opnfv-6.0.0 ENV_FILE=./admin.rc CARBON_DIR=./carbon/ docker-compose pull
TAG=x86_64-opnfv-6.0.0 ENV_FILE=./admin.rc CARBON_DIR=./carbon/ docker-compose up -d
For 64 bit ARM based systems, use:
TAG=aarch64-opnfv-6.0.0 ENV_FILE=./admin.rc CARBON_DIR=./carbon/ docker-compose pull
TAG=aarch64-opnfv-6.0.0 ENV_FILE=./admin.rc CARBON_DIR=./carbon/ docker-compose up -d
This tag represents the 5th OPNFV release and the 4th StorPerf release. There are no known bugs and known issues and workarounds are documented in the release notes. Documentation can be found under the Euphrates label at:
http://docs.opnfv.org/en/stable-euphrates/submodules/storperf/docs/testing/user/index.html
Issues found here should be reported against release 6.0.0 in JIRA:
https://jira.opnfv.org/secure/RapidBoard.jspa?rapidView=3
For x86_64 based systems, use:
TAG=x86_64-opnfv-6.0.0 ENV_FILE=./admin.rc CARBON_DIR=./carbon/ docker-compose pull
TAG=x86_64-opnfv-6.0.0 ENV_FILE=./admin.rc CARBON_DIR=./carbon/ docker-compose up -d
For 64 bit ARM based systems, use:
TAG=aarch64-opnfv-6.0.0 ENV_FILE=./admin.rc CARBON_DIR=./carbon/ docker-compose pull
TAG=aarch64-opnfv-6.0.0 ENV_FILE=./admin.rc CARBON_DIR=./carbon/ docker-compose up -d
This guide requires StorPerf to be running and have its ReST API accessible. If the ReST API is not running on port 5000, adjust the commands provided here as needed.
Once the StorPerf container has been started and the ReST API exposed, you can interact directly with it using the ReST API. StorPerf comes with a Swagger interface that is accessible through the exposed port at:
http://StorPerf:5000/swagger/index.html
The typical test execution follows this pattern:
The following pieces of information are required to prepare the environment:
Note: on ARM based platforms there exists a bug in the kernel which can prevent VMs from properly attaching Cinder volumes. There are two known workarounds:
have finished booting, modify the stack to have 1 or more Cinder volumes. See section on Changing Stack Parameters later in this guide.
volume to be mounted as a SCSI device, and therefore your target will be /dev/sdb, etc, instead of /dev/vdb. You will need to specify this in your warm up and workload jobs.
The ReST API is a POST to http://StorPerf:5000/api/v1.0/configurations and takes a JSON payload as follows.
{
  "agent_count": int,
  "agent_flavor": "string",
  "agent_image": "string",
  "availability_zone": "string",
  "password": "string",
  "public_network": "string",
  "username": "string",
  "volume_count": int,
  "volume_size": int,
  "volume_type": "string"
}
This call will block until the stack is created, at which point it will return the OpenStack heat stack id as well as the IP addresses of the slave agents.
Before executing a test run for the purpose of measuring performance, it is necessary to fill the volume or file with random data. Failure to execute this step can result in meaningless numbers, especially for read performance. Most Cinder drivers are smart enough to know what blocks contain data, and which do not. Uninitialized blocks return “0” immediately without actually reading from the volume.
Initiating the data fill behave similarly to a regular performance run, but will tag the data with a special workload name called “_warm_up”. It is designed to run to completion, filling 100% of the specified target with random data.
The ReST API is a POST to http://StorPerf:5000/api/v1.0/initializations and takes a JSON payload as follows. The body is optional unless your target is something other than /dev/vdb. For example, if you want to profile a glance ephemeral storage file, you could specify the target as “/filename.dat”, which is a file that then gets created on the root filesystem.
{
   "target": "/dev/vdb"
}
This will return a job ID as follows.
{
  "job_id": "edafa97e-457e-4d3d-9db4-1d6c0fc03f98"
}
This job ID can be used to query the state to determine when it has completed. See the section on querying jobs for more information.
Performance runs can execute either a single workload, or iterate over a matrix of workload types, block sizes and queue depths.
New in Gambia (7.0), you can specify custom workload parameters for StorPerf to pass on to FIO. This is available in the /api/v2.0/jobs API, and takes a different format than the default v1.0 API.
The format is as follows:
"workloads": {
  "name": {
     "fio argument": "fio value"
  }
}
The name is used the same way the ‘rr’, ‘rs’, ‘rw’, etc is used, but can be any arbitrary alphanumeric string. This is for you to identify the job later. Following the name is a series of arguments to pass on to FIO. The most important on of these is the actual I/O operation to perform. From the FIO manual, there are a number of different workloads:
This is an example of how the original ‘ws’ workload looks in the new format:
"workloads": {
  "ws": {
     "rw": "write"
  }
}
Using this format, it is now possible to initiate any combination of IO workload type. For example, a mix of 60% reads and 40% writes scattered randomly throughout the volume being profiled would be:
"workloads": {
  "6040randrw": {
      "rw": "randrw",
      "rwmixread": "60"
  }
}
Additional arguments can be added as needed. Here is an example of random writes, with 25% duplicated blocks, followed by a second run of 75/25% mixed reads and writes. This can be used to test the deduplication capabilities of the underlying storage driver.
"workloads": {
  "dupwrite": {
     "rw": "randwrite",
      "dedupe_percentage": "25"
  },
  "7525randrw": {
     "rw": "randrw",
      "rwmixread": "75",
      "dedupe_percentage": "25"
  }
}
There is no limit on the number of workloads and additional FIO arguments that can be specified.
Note that as in v1.0, the list of workloads will be iterated over with the block sizes and queue depths specified.
StorPerf will also do a verification of the arguments given prior to returning a Job ID from the ReST call. If an argument fails validation, the error will be returned in the payload of the response.
A comma delimited list of the different block sizes to use when reading and writing data. Note: Some Cinder drivers (such as Ceph) cannot support block sizes larger than 16k (16384).
A comma delimited list of the different queue depths to use when reading and writing data. The queue depth parameter causes FIO to keep this many I/O requests outstanding at one time. It is used to simulate traffic patterns on the system. For example, a queue depth of 4 would simulate 4 processes constantly creating I/O requests.
The deadline is the maximum amount of time in minutes for a workload to run. If steady state has not been reached by the deadline, the workload will terminate and that particular run will be marked as not having reached steady state. Any remaining workloads will continue to execute in order.
{
   "block_sizes": "2048,16384",
   "deadline": 20,
   "queue_depths": "2,4",
   "workload": "wr,rr,rw"
}
A job can have metadata associated with it for tagging. The following metadata is required in order to push results to the OPNFV Test Results DB:
"metadata": {
    "disk_type": "HDD or SDD",
    "pod_name": "OPNFV Pod Name",
    "scenario_name": string,
    "storage_node_count": int,
    "version": string,
    "build_tag": string,
    "test_case": "snia_steady_state"
}
While StorPerf currently does not support changing the parameters of the stack directly, it is possible to change the stack using the OpenStack client library. The following parameters can be changed:
Increasing the number of agents or volumes, or increasing the size of the volumes will require you to kick off a new _warm_up job to initialize the newly allocated volumes.
The following is an example of how to change the stack using the heat client:
By issuing a GET to the job API http://StorPerf:5000/api/v1.0/jobs?job_id=<ID>, you can fetch information about the job as follows:
The Status field can be: - Running to indicate the job is still in progress, or - Completed to indicate the job is done. This could be either normal completion
or manually terminated via HTTP DELETE call.
Workloads can have a value of: - Pending to indicate the workload has not yet started, - Running to indicate this is the active workload, or - Completed to indicate this workload has completed.
This is an example of a type=status call.
{
  "Status": "Running",
  "TestResultURL": null,
  "Workloads": {
    "eeb2e587-5274-4d2f-ad95-5c85102d055e.ws.queue-depth.1.block-size.16384": "Pending",
    "eeb2e587-5274-4d2f-ad95-5c85102d055e.ws.queue-depth.1.block-size.4096": "Pending",
    "eeb2e587-5274-4d2f-ad95-5c85102d055e.ws.queue-depth.1.block-size.512": "Pending",
    "eeb2e587-5274-4d2f-ad95-5c85102d055e.ws.queue-depth.4.block-size.16384": "Running",
    "eeb2e587-5274-4d2f-ad95-5c85102d055e.ws.queue-depth.4.block-size.4096": "Pending",
    "eeb2e587-5274-4d2f-ad95-5c85102d055e.ws.queue-depth.4.block-size.512": "Pending",
    "eeb2e587-5274-4d2f-ad95-5c85102d055e.ws.queue-depth.8.block-size.16384": "Completed",
    "eeb2e587-5274-4d2f-ad95-5c85102d055e.ws.queue-depth.8.block-size.4096": "Pending",
    "eeb2e587-5274-4d2f-ad95-5c85102d055e.ws.queue-depth.8.block-size.512": "Pending"
  }
}
If the job_id is not provided along with type status, then all jobs are returned along with their status. Metrics ~~~~~~~ Metrics can be queried at any time during or after the completion of a run. Note that the metrics show up only after the first interval has passed, and are subject to change until the job completes.
This is a sample of a type=metrics call.
{
  "rw.queue-depth.1.block-size.512.read.bw": 52.8,
  "rw.queue-depth.1.block-size.512.read.iops": 106.76199999999999,
  "rw.queue-depth.1.block-size.512.read.lat_ns.mean": 93.176,
  "rw.queue-depth.1.block-size.512.write.bw": 22.5,
  "rw.queue-depth.1.block-size.512.write.iops": 45.760000000000005,
  "rw.queue-depth.1.block-size.512.write.lat_ns.mean": 21764.184999999998
}
Issuing an HTTP DELETE to the job api http://StorPerf:5000/api/v1.0/jobs will force the termination of the whole job, regardless of how many workloads remain to be executed.
curl -X DELETE --header 'Accept: application/json' http://StorPerf:5000/api/v1.0/jobs
A list of all Jobs can also be queried. You just need to issue a GET request without any Job ID.
curl -X GET --header 'Accept: application/json' http://StorPerf/api/v1.0/jobs
After you are done testing, you can have StorPerf delete the Heat stack by issuing an HTTP DELETE to the configurations API.
curl -X DELETE --header 'Accept: application/json' http://StorPerf:5000/api/v1.0/configurations
You may also want to delete an environment, and then create a new one with a different number of VMs/Cinder volumes to test the impact of the number of VMs in your environment.
Logs are an integral part of any application as they help debugging the application. The user just needs to issue an HTTP request. To view the entire logs
curl -X GET --header 'Accept: application/json' http://StorPerf:5000/api/v1.0/logs?lines=all
Alternatively, one can also view a certain amount of lines by specifying the number in the request. If no lines are specified, then last 35 lines are returned
curl -X GET --header 'Accept: application/json' http://StorPerf:5000/api/v1.0/logs?lines=12
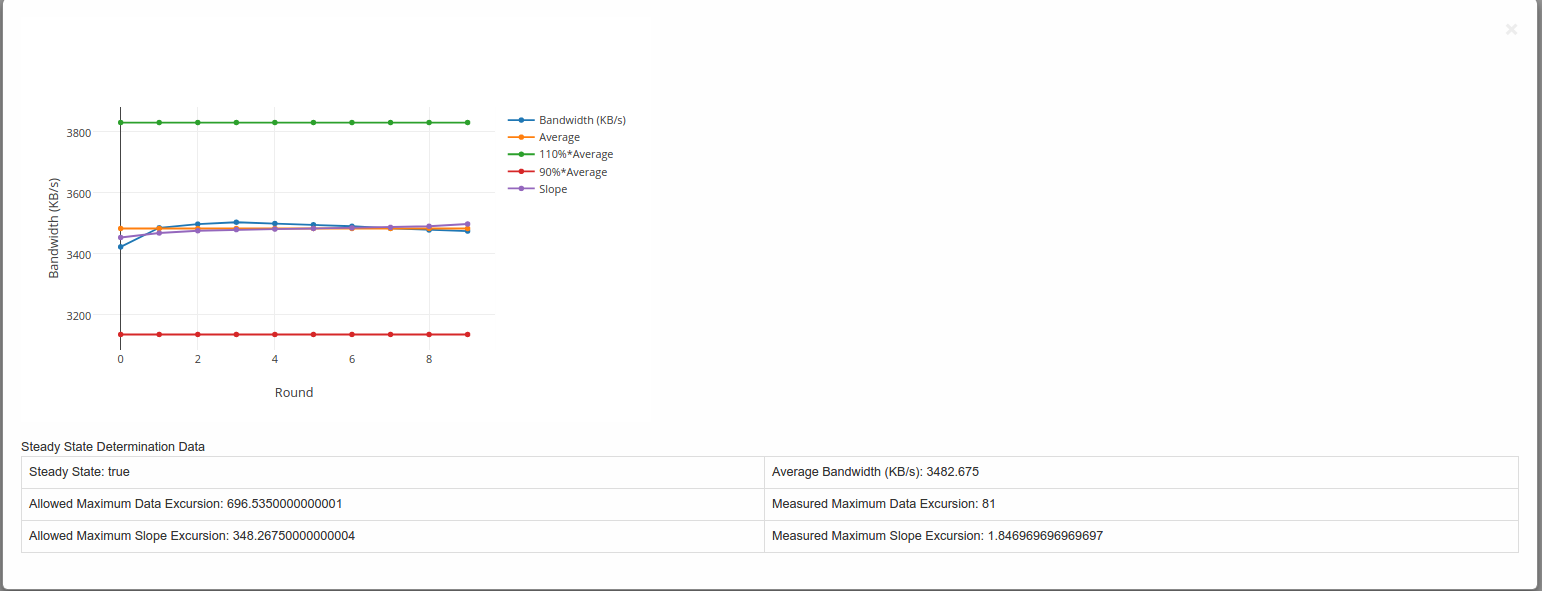
storperf-reporting/src/static/testdata. Instead of the URL enter the filename present in the testdata directory, eg. local-data.jsonExample of a graph generated is shown below:-
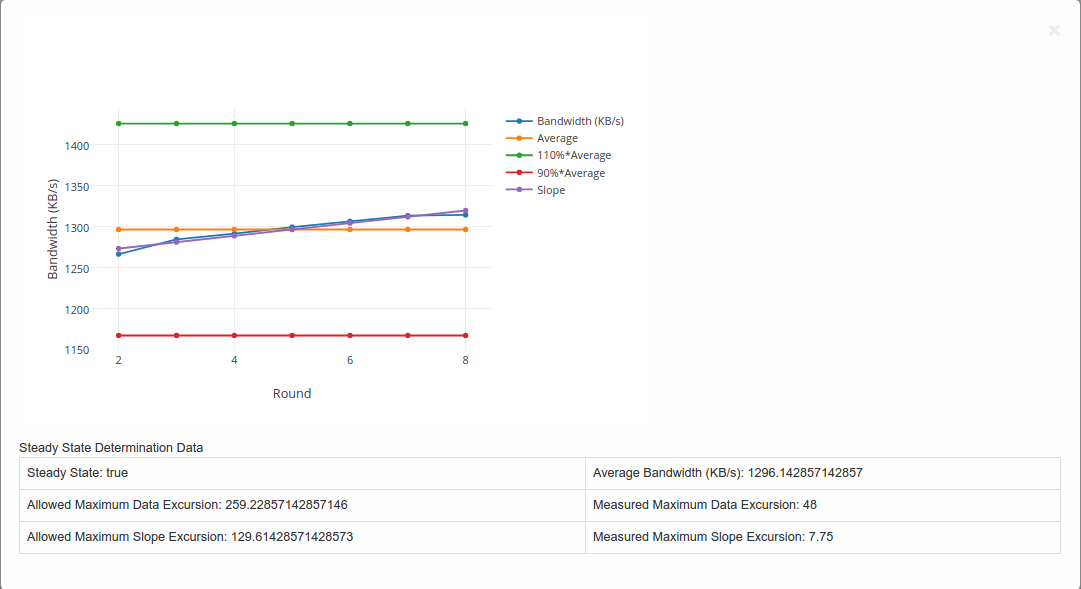
Steady State Convergence Graph
A Flask server is used to fetch the data and is sent to the client side for formation of the graphs (Using Javascript).
storperf/docker/storperf-reporting/ contains the code used for this project.
The file structure is as follows:-
storperf-reporting
|+-- Dockerfile                         # Dockerfile for the storperf-reporting container
|+-- requirements.txt                   # pip requirements for the container
+-- src                                 # Contains the code for the flask server
    |+-- app.py                         # Code to run the flask application
    |+-- static                         # Contains the static files (js,css)
    |   |+-- css                        # Contains css files
    |   |   `-- bootstrap.min.css
    |   |+-- images
    |   |+-- js                         # Contains the javascript files
    |   |   |-- bootstrap.min.js
    |   |   |-- Chart.min.js
    |   |   |-- jquery-2.1.3.min.js
    |   |   |-- jquery.bootpag.min.js
    |   |   `-- plotly-latest.min.js    # Used for plotting the graphs
    |   `-- testdata                    # Contains testing data for the module
    `-- templates
        |-- index.html
        |-- plot_jobs.html
        |-- plot_multi_data.html
        `-- plot_tables.html
VSPERF is an OPNFV testing project.
VSPERF provides an automated test-framework and comprehensive test suite based on Industry Test Specifications for measuring NFVI data-plane performance. The data-path includes switching technologies with physical and virtual network interfaces. The VSPERF architecture is switch and traffic generator agnostic and test cases can be easily customized. VSPERF was designed to be independent of OpenStack therefore OPNFV installer scenarios are not required. VSPERF can source, configure and deploy the device-under-test using specified software versions and network topology. VSPERF is used as a development tool for optimizing switching technologies, qualification of packet processing functions and for evaluation of data-path performance.
The Euphrates release adds new features and improvements that will help advance high performance packet processing on Telco NFV platforms. This includes new test cases, flexibility in customizing test-cases, new results display options, improved tool resiliency, additional traffic generator support and VPP support.
VSPERF provides a framework where the entire NFV Industry can learn about NFVI data-plane performance and try-out new techniques together. A new IETF benchmarking specification (RFC8204) is based on VSPERF work contributed since 2015. VSPERF is also contributing to development of ETSI NFV test specifications through the Test and Open Source Working Group.
The vswitchperf can be downloaded from its official git repository, which is
hosted by OPNFV. It is necessary to install a git at your DUT before downloading
vswitchperf. Installation of git is specific to the packaging system used by
Linux OS installed at DUT.
Example of installation of GIT package and its dependencies:
in case of OS based on RedHat Linux:
sudo yum install git
in case of Ubuntu or Debian:
sudo apt-get install git
After the git is successfully installed at DUT, then vswitchperf can be downloaded
as follows:
git clone http://git.opnfv.org/vswitchperf
The last command will create a directory vswitchperf with a local copy of vswitchperf
repository.
The vSwitch must support Open Flow 1.3 or greater.
In theory, it is possible to use any VNF image, which is compatible with supported hypervisor. However such VNF must ensure, that appropriate number of network interfaces is configured and that traffic is properly forwarded among them. For new vswitchperf users it is recommended to start with official vloop-vnf image, which is maintained by vswitchperf community.
The official VM image is called vloop-vnf and it is available for free download from OPNFV artifactory. This image is based on Linux Ubuntu distribution and it supports following applications for traffic forwarding:
The vloop-vnf can be downloaded to DUT, for example by wget:
wget http://artifacts.opnfv.org/vswitchperf/vnf/vloop-vnf-ubuntu-14.04_20160823.qcow2
NOTE: In case that wget is not installed at your DUT, you could install it at RPM
based system by sudo yum install wget or at DEB based system by sudo apt-get install
wget.
Changelog of vloop-vnf:
- vloop-vnf-ubuntu-14.04_20160823
- ethtool installed
- only 1 NIC is configured by default to speed up boot with 1 NIC setup
- security updates applied
- vloop-vnf-ubuntu-14.04_20160804
- Linux kernel 4.4.0 installed
- libnuma-dev installed
- security updates applied
- vloop-vnf-ubuntu-14.04_20160303
- snmpd service is disabled by default to avoid error messages during VM boot
- security updates applied
- vloop-vnf-ubuntu-14.04_20151216
- version with development tools required for build of DPDK and l2fwd
The test suite requires Python 3.3 or newer and relies on a number of other system and python packages. These need to be installed for the test suite to function.
Updated kernel and certain development packages are required by DPDK, OVS (especially Vanilla OVS) and QEMU. It is necessary to check if the versions of these packages are not being held-back and if the DNF/APT/YUM configuration does not prevent their modification, by enforcing settings such as “exclude-kernel”.
Installation of required packages, preparation of Python 3 virtual environment and compilation of OVS, DPDK and QEMU is performed by script systems/build_base_machine.sh. It should be executed under the user account, which will be used for vsperf execution.
NOTE: Password-less sudo access must be configured for given user account before the script is executed.
$ cd systems
$ ./build_base_machine.sh
NOTE: you don’t need to go into any of the systems subdirectories, simply run the top level build_base_machine.sh, your OS will be detected automatically.
Script build_base_machine.sh will install all the vsperf dependencies in terms of system packages, Python 3.x and required Python modules. In case of CentOS 7 or RHEL it will install Python 3.3 from an additional repository provided by Software Collections (a link). The installation script will also use virtualenv to create a vsperf virtual environment, which is isolated from the default Python environment, using the Python3 package located in /usr/bin/python3. This environment will reside in a directory called vsperfenv in $HOME. It will ensure, that system wide Python installation
is not modified or broken by VSPERF installation. The complete list of Python
packages installed inside virtualenv can be found in the file
requirements.txt, which is located at the vswitchperf repository.
NOTE: For RHEL 7.3 Enterprise and CentOS 7.3 OVS Vanilla is not built from upstream source due to kernel incompatibilities. Please see the instructions in the vswitchperf_design document for details on configuring OVS Vanilla for binary package usage.
NOTE: For RHEL 7.5 Enterprise DPDK and Openvswitch are not built from upstream sources due to kernel incompatibilities. Please use subscription channels to obtain binary equivalents of openvswitch and dpdk packages or build binaries using instructions from openvswitch.org and dpdk.org.
VPP installation is now included as part of the VSPerf installation scripts.
In case of an error message about a missing file such as “Couldn’t open file /etc/pki/rpm-gpg/RPM-GPG-KEY-EPEL-7” you can resolve this issue by simply downloading the file.
$ wget https://dl.fedoraproject.org/pub/epel/RPM-GPG-KEY-EPEL-7
You will need to activate the virtual environment every time you start a new shell session. Its activation is specific to your OS:
CentOS 7 and RHEL
$ scl enable rh-python34 bash
$ source $HOME/vsperfenv/bin/activate
Fedora and Ubuntu
$ source $HOME/vsperfenv/bin/activate
After the virtual environment is configued, then VSPERF can be used. For example:
(vsperfenv) $ cd vswitchperf
(vsperfenv) $ ./vsperf --help
In case you will see following error during environment activation:
$ source $HOME/vsperfenv/bin/activate
Badly placed ()'s.
then check what type of shell you are using:
$ echo $SHELL
/bin/tcsh
See what scripts are available in $HOME/vsperfenv/bin
$ ls $HOME/vsperfenv/bin/
activate          activate.csh      activate.fish     activate_this.py
source the appropriate script
$ source bin/activate.csh
If you’re behind a proxy, you’ll likely want to configure this before running any of the above. For example:
export http_proxy=proxy.mycompany.com:123
export https_proxy=proxy.mycompany.com:123
VSPerf supports the default DPDK bind tool, but also supports driverctl. The driverctl tool is a new tool being used that allows driver binding to be persistent across reboots. The driverctl tool is not provided by VSPerf, but can be downloaded from upstream sources. Once installed set the bind tool to driverctl to allow VSPERF to correctly bind cards for DPDK tests.
PATHS['dpdk']['src']['bind-tool'] = 'driverctl'
Systems running vsperf with either dpdk and/or tests with guests must configure hugepage amounts to support running these configurations. It is recommended to configure 1GB hugepages as the pagesize.
The amount of hugepages needed depends on your configuration files in vsperf.
Each guest image requires 2048 MB by default according to the default settings
in the 04_vnf.conf file.
GUEST_MEMORY = ['2048']
The dpdk startup parameters also require an amount of hugepages depending on
your configuration in the 02_vswitch.conf file.
DPDK_SOCKET_MEM = ['1024', '0']
NOTE: Option DPDK_SOCKET_MEM is used by all vSwitches with DPDK support.
It means Open vSwitch, VPP and TestPMD.
VSPerf will verify hugepage amounts are free before executing test environments. In case of hugepage amounts not being free, test initialization will fail and testing will stop.
NOTE: In some instances on a test failure dpdk resources may not release hugepages used in dpdk configuration. It is recommended to configure a few extra hugepages to prevent a false detection by VSPerf that not enough free hugepages are available to execute the test environment. Normally dpdk would use previously allocated hugepages upon initialization.
Depending on your OS selection configuration of hugepages may vary. Please refer to your OS documentation to set hugepages correctly. It is recommended to set the required amount of hugepages to be allocated by default on reboots.
Information on hugepage requirements for dpdk can be found at http://dpdk.org/doc/guides/linux_gsg/sys_reqs.html
You can review your hugepage amounts by executing the following command
cat /proc/meminfo | grep Huge
If no hugepages are available vsperf will try to automatically allocate some.
Allocation is controlled by HUGEPAGE_RAM_ALLOCATION configuration parameter in
02_vswitch.conf file. Default is 2GB, resulting in either 2 1GB hugepages
or 1024 2MB hugepages.
With the large amount of tuning guides available online on how to properly tune a DUT, it becomes difficult to achieve consistent numbers for DPDK testing. VSPerf recommends a simple approach that has been tested by different companies to achieve proper CPU isolation.
The idea behind CPU isolation when running DPDK based tests is to achieve as few interruptions to a PMD process as possible. There is now a utility available on most Linux Systems to achieve proper CPU isolation with very little effort and customization. The tool is called tuned-adm and is most likely installed by default on the Linux DUT
VSPerf recommends the latest tuned-adm package, which can be downloaded from the following location:
http://www.tuned-project.org/2017/04/27/tuned-2-8-0-released/
Follow the instructions to install the latest tuned-adm onto your system. For current RHEL customers you should already have the most current version. You just need to install the cpu-partitioning profile.
yum install -y tuned-profiles-cpu-partitioning.noarch
Proper CPU isolation starts with knowing what NUMA your NIC is installed onto. You can identify this by checking the output of the following command
cat /sys/class/net/<NIC NAME>/device/numa_node
You can then use utilities such as lscpu or cpu_layout.py which is located in the src dpdk area of VSPerf. These tools will show the CPU layout of which cores/hyperthreads are located on the same NUMA.
Determine which CPUS/Hyperthreads will be used for PMD threads and VCPUs for VNFs. Then modify the /etc/tuned/cpu-partitioning-variables.conf and add the CPUs into the isolated_cores variable in some form of x-y or x,y,z or x-y,z, etc. Then apply the profile.
tuned-adm profile cpu-partitioning
After applying the profile, reboot your system.
After rebooting the DUT, you can verify the profile is active by running
tuned-adm active
Now you should have proper CPU isolation active and can achieve consistent results with DPDK based tests.
The last consideration is when running TestPMD inside of a VNF, it may make sense to enable enough cores to run a PMD thread on separate core/HT. To achieve this, set the number of VCPUs to 3 and enable enough nb-cores in the TestPMD config. You can modify options in the conf files.
GUEST_SMP = ['3']
GUEST_TESTPMD_PARAMS = ['-l 0,1,2 -n 4 --socket-mem 512 -- '
                        '--burst=64 -i --txqflags=0xf00 '
                        '--disable-hw-vlan --nb-cores=2']
Verify you set the VCPU core locations appropriately on the same NUMA as with your PMD mask for OVS-DPDK.
In case, that VSPERF is cloned from git repository, then it is easy to upgrade it to the newest stable version or to the development version.
You could get a list of stable releases by git command. It is necessary
to update local git repository first.
NOTE: Git commands must be executed from directory, where VSPERF repository
was cloned, e.g. vswitchperf.
Update of local git repository:
$ git pull
List of stable releases:
$ git tag

brahmaputra.1.0
colorado.1.0
colorado.2.0
colorado.3.0
danube.1.0
euphrates.1.0
You could select which stable release should be used. For example, select danube.1.0:
$ git checkout danube.1.0
Development version of VSPERF can be selected by:
$ git checkout master
Support of vHost Cuse interface has been removed in Danube release. It means,
that it is not possible to select QemuDpdkVhostCuse as a VNF anymore. Option
QemuDpdkVhostUser should be used instead. Please check you configuration files
and definition of your testcases for any occurrence of:
VNF = "QemuDpdkVhostCuse"
or
"VNF" : "QemuDpdkVhostCuse"
In case that QemuDpdkVhostCuse is found, it must be modified to QemuDpdkVhostUser.
NOTE: In case that execution of VSPERF is automated by scripts (e.g. for CI purposes), then these scripts must be checked and updated too. It means, that any occurrence of:
./vsperf --vnf QemuDpdkVhostCuse
must be updated to:
./vsperf --vnf QemuDpdkVhostUser
Several configuration changes were introduced during Danube release. The most important changes are discussed below.
VSPERF uses external tools for proper testcase execution. Thus it is important
to properly configure paths to these tools. In case that tools are installed
by installation scripts and are located inside ./src directory inside
VSPERF home, then no changes are needed. On the other hand, if path settings
was changed by custom configuration file, then it is required to update configuration
accordingly. Please check your configuration files for following configuration
options:
OVS_DIR
OVS_DIR_VANILLA
OVS_DIR_USER
OVS_DIR_CUSE

RTE_SDK_USER
RTE_SDK_CUSE

QEMU_DIR
QEMU_DIR_USER
QEMU_DIR_CUSE
QEMU_BIN
In case that any of these options is defined, then configuration must be updated.
All paths to the tools are now stored inside PATHS dictionary. Please
refer to the Configuration of PATHS dictionary and update your configuration where necessary.
In previous releases it was possible to modify selected configuration options
(mostly VNF specific) via command line interface, i.e. by --test-params
argument. This concept has been generalized in Danube release and it is
possible to modify any configuration parameter via CLI or via Parameters
section of the testcase definition. Old configuration options were obsoleted
and it is required to specify configuration parameter name in the same form
as it is defined inside configuration file, i.e. in uppercase. Please
refer to the Overriding values defined in configuration files for additional details.
NOTE: In case that execution of VSPERF is automated by scripts (e.g. for CI purposes), then these scripts must be checked and updated too. It means, that any occurrence of
guest_loopback
vanilla_tgen_port1_ip
vanilla_tgen_port1_mac
vanilla_tgen_port2_ip
vanilla_tgen_port2_mac
tunnel_type
shall be changed to the uppercase form and data type of entered values must match to data types of original values from configuration files.
In case that guest_nic1_name or guest_nic2_name is changed,
then new dictionary GUEST_NICS must be modified accordingly.
Please see Configuration of GUEST options and conf/04_vnf.conf for additional
details.
In previous releases it was possible to modify selected attributes of generated
traffic via command line interface. This concept has been enhanced in Danube
release and it is now possible to modify all traffic specific options via
CLI or by TRAFFIC dictionary in configuration file. Detailed description
is available at Configuration of TRAFFIC dictionary section of documentation.
Please check your automated scripts for VSPERF execution for following CLI parameters and update them according to the documentation:
bidir
duration
frame_rate
iload
lossrate
multistream
pkt_sizes
pre-installed_flows
rfc2544_tests
stream_type
traffic_type
VSPERF supports the following traffic generators:
- Dummy (DEFAULT)
- Ixia
- Spirent TestCenter
- Xena Networks
- MoonGen
- Trex
To see the list of traffic gens from the cli:
$ ./vsperf --list-trafficgens
This guide provides the details of how to install and configure the various traffic generators.
The traffic default configuration can be found in conf/03_traffic.conf, and is configured as follows:
TRAFFIC = {
    'traffic_type' : 'rfc2544_throughput',
    'frame_rate' : 100,
    'burst_size' : 100,
    'bidir' : 'True',  # will be passed as string in title format to tgen
    'multistream' : 0,
    'stream_type' : 'L4',
    'pre_installed_flows' : 'No',           # used by vswitch implementation
    'flow_type' : 'port',                   # used by vswitch implementation
    'flow_control' : False,                 # supported only by IxNet
    'learning_frames' : True,               # supported only by IxNet
    'l2': {
        'framesize': 64,
        'srcmac': '00:00:00:00:00:00',
        'dstmac': '00:00:00:00:00:00',
    },
    'l3': {
        'enabled': True,
        'proto': 'udp',
        'srcip': '1.1.1.1',
        'dstip': '90.90.90.90',
    },
    'l4': {
        'enabled': True,
        'srcport': 3000,
        'dstport': 3001,
    },
    'vlan': {
        'enabled': False,
        'id': 0,
        'priority': 0,
        'cfi': 0,
    },
    'capture': {
        'enabled': False,
        'tx_ports' : [0],
        'rx_ports' : [1],
        'count': 1,
        'filter': '',
    },
    'scapy': {
        'enabled': False,
        '0' : 'Ether(src={Ether_src}, dst={Ether_dst})/'
              'Dot1Q(prio={Dot1Q_prio}, id={Dot1Q_id}, vlan={Dot1Q_vlan})/'
              'IP(proto={IP_proto}, src={IP_src}, dst={IP_dst})/'
              '{IP_PROTO}(sport={IP_PROTO_sport}, dport={IP_PROTO_dport})',
        '1' : 'Ether(src={Ether_dst}, dst={Ether_src})/'
              'Dot1Q(prio={Dot1Q_prio}, id={Dot1Q_id}, vlan={Dot1Q_vlan})/'
              'IP(proto={IP_proto}, src={IP_dst}, dst={IP_src})/'
              '{IP_PROTO}(sport={IP_PROTO_dport}, dport={IP_PROTO_sport})',
    }
}
A detailed description of the TRAFFIC dictionary can be found at
Configuration of TRAFFIC dictionary.
The framesize parameter can be overridden from the configuration
files by adding the following to your custom configuration file
10_custom.conf:
TRAFFICGEN_PKT_SIZES = (64, 128,)
OR from the commandline:
$ ./vsperf --test-params "TRAFFICGEN_PKT_SIZES=(x,y)" $TESTNAME
You can also modify the traffic transmission duration and the number of tests run by the traffic generator by extending the example commandline above to:
$ ./vsperf --test-params "TRAFFICGEN_PKT_SIZES=(x,y);TRAFFICGEN_DURATION=10;" \
                         "TRAFFICGEN_RFC2544_TESTS=1" $TESTNAME
The Dummy traffic generator can be used to test VSPERF installation or to demonstrate VSPERF functionality at DUT without connection to a real traffic generator.
You could also use the Dummy generator in case, that your external traffic generator is not supported by VSPERF. In such case you could use VSPERF to setup your test scenario and then transmit the traffic. After the transmission is completed you could specify values for all collected metrics and VSPERF will use them to generate final reports.
To select the Dummy generator please add the following to your
custom configuration file 10_custom.conf.
TRAFFICGEN = 'Dummy'
OR run vsperf with the --trafficgen argument
$ ./vsperf --trafficgen Dummy $TESTNAME
Where $TESTNAME is the name of the vsperf test you would like to run. This will setup the vSwitch and the VNF (if one is part of your test) print the traffic configuration and prompt you to transmit traffic when the setup is complete.
Please send 'continuous' traffic with the following stream config:
30mS, 90mpps, multistream False
and the following flow config:
{
    "flow_type": "port",
    "l3": {
        "enabled": True,
        "srcip": "1.1.1.1",
        "proto": "udp",
        "dstip": "90.90.90.90"
    },
    "traffic_type": "rfc2544_continuous",
    "multistream": 0,
    "bidir": "True",
    "vlan": {
        "cfi": 0,
        "priority": 0,
        "id": 0,
        "enabled": False
    },
    "l4": {
        "enabled": True,
        "srcport": 3000,
        "dstport": 3001,
    },
    "frame_rate": 90,
    "l2": {
        "dstmac": "00:00:00:00:00:00",
        "srcmac": "00:00:00:00:00:00",
        "framesize": 64
    }
}
What was the result for 'frames tx'?
When your traffic generator has completed traffic transmission and provided the results please input these at the VSPERF prompt. VSPERF will try to verify the input:
Is '$input_value' correct?
Please answer with y OR n.
VSPERF will ask you to provide a value for every of collected metrics. The list of metrics can be found at traffic-type-metrics. Finally vsperf will print out the results for your test and generate the appropriate logs and report files.
Below you could find a list of metrics collected by VSPERF for each of supported traffic types.
RFC2544 Throughput and Continuous:
- frames tx
- frames rx
- min latency
- max latency
- avg latency
- frameloss
RFC2544 Back2back:
- b2b frames
- b2b frame loss %
In case of a Dummy traffic generator it is possible to pre-configure the test results. This is useful for creation of demo testcases, which do not require a real traffic generator. Such testcase can be run by any user and it will still generate all reports and result files.
Result values can be specified within TRAFFICGEN_DUMMY_RESULTS dictionary,
where every of collected metrics must be properly defined. Please check the list
of traffic-type-metrics.
Dictionary with dummy results can be passed by CLI argument --test-params
or specified in Parameters section of testcase definition.
Example of testcase execution with dummy results defined by CLI argument:
$ ./vsperf back2back --trafficgen Dummy --test-params \
  "TRAFFICGEN_DUMMY_RESULTS={'b2b frames':'3000','b2b frame loss %':'0.0'}"
Example of testcase definition with pre-configured dummy results:
{
    "Name": "back2back",
    "Traffic Type": "rfc2544_back2back",
    "Deployment": "p2p",
    "biDirectional": "True",
    "Description": "LTD.Throughput.RFC2544.BackToBackFrames",
    "Parameters" : {
        'TRAFFICGEN_DUMMY_RESULTS' : {'b2b frames':'3000','b2b frame loss %':'0.0'}
    },
},
NOTE: Pre-configured results for the Dummy traffic generator will be used only
in case, that the Dummy traffic generator is used. Otherwise the option
TRAFFICGEN_DUMMY_RESULTS will be ignored.
VSPERF can use both IxNetwork and IxExplorer TCL servers to control Ixia chassis. However, usage of IxNetwork TCL server is a preferred option. The following sections will describe installation and configuration of IxNetwork components used by VSPERF.
On the system under the test you need to install IxNetworkTclClient$(VER_NUM)Linux.bin.tgz.
On the IXIA client software system you need to install IxNetwork TCL server. After its installation you should configure it as follows:
Find the IxNetwork TCL server app (start -> All Programs -> IXIA -> IxNetwork -> IxNetwork_$(VER_NUM) -> IxNetwork TCL Server)
Right click on IxNetwork TCL Server, select properties - Under shortcut tab in the Target dialogue box make sure there is the argument “-tclport xxxx” where xxxx is your port number (take note of this port number as you will need it for the 10_custom.conf file).
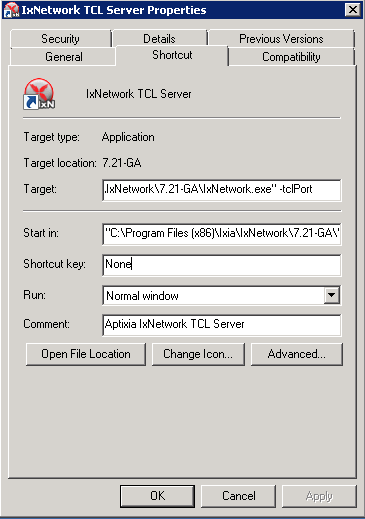
Hit Ok and start the TCL server application
There are several configuration options specific to the IxNetwork traffic generator from IXIA. It is essential to set them correctly, before the VSPERF is executed for the first time.
Detailed description of options follows:
TRAFFICGEN_IXNET_MACHINE- IP address of server, where IxNetwork TCL Server is runningTRAFFICGEN_IXNET_PORT- PORT, where IxNetwork TCL Server is accepting connections from TCL clientsTRAFFICGEN_IXNET_USER- username, which will be used during communication with IxNetwork TCL Server and IXIA chassisTRAFFICGEN_IXIA_HOST- IP address of IXIA traffic generator chassisTRAFFICGEN_IXIA_CARD- identification of card with dedicated ports at IXIA chassisTRAFFICGEN_IXIA_PORT1- identification of the first dedicated port atTRAFFICGEN_IXIA_CARDat IXIA chassis; VSPERF uses two separated ports for traffic generation. In case of unidirectional traffic, it is essential to correctly connect 1st IXIA port to the 1st NIC at DUT, i.e. to the first PCI handle fromWHITELIST_NICSlist. Otherwise traffic may not be able to pass through the vSwitch. NOTE: In case thatTRAFFICGEN_IXIA_PORT1andTRAFFICGEN_IXIA_PORT2are set to the same value, then VSPERF will assume, that there is only one port connection between IXIA and DUT. In this case it must be ensured, that chosen IXIA port is physically connected to the first NIC fromWHITELIST_NICSlist.TRAFFICGEN_IXIA_PORT2- identification of the second dedicated port atTRAFFICGEN_IXIA_CARDat IXIA chassis; VSPERF uses two separated ports for traffic generation. In case of unidirectional traffic, it is essential to correctly connect 2nd IXIA port to the 2nd NIC at DUT, i.e. to the second PCI handle fromWHITELIST_NICSlist. Otherwise traffic may not be able to pass through the vSwitch. NOTE: In case thatTRAFFICGEN_IXIA_PORT1andTRAFFICGEN_IXIA_PORT2are set to the same value, then VSPERF will assume, that there is only one port connection between IXIA and DUT. In this case it must be ensured, that chosen IXIA port is physically connected to the first NIC fromWHITELIST_NICSlist.TRAFFICGEN_IXNET_LIB_PATH- path to the DUT specific installation of IxNetwork TCL APITRAFFICGEN_IXNET_TCL_SCRIPT- name of the TCL script, which VSPERF will use for communication with IXIA TCL serverTRAFFICGEN_IXNET_TESTER_RESULT_DIR- folder accessible from IxNetwork TCL server, where test results are stored, e.g.c:/ixia_results; see test-results-shareTRAFFICGEN_IXNET_DUT_RESULT_DIR- directory accessible from the DUT, where test results from IxNetwork TCL server are stored, e.g./mnt/ixia_results; see test-results-share
Spirent installation files and instructions are available on the Spirent support website at:
Select a version of Spirent TestCenter software to utilize. This example will use Spirent TestCenter v4.57 as an example. Substitute the appropriate version in place of ‘v4.57’ in the examples, below.
Download and install the following:
Spirent TestCenter Application, v4.57 for 64-bit Linux Client
Spirent VDS is required for both TestCenter hardware and virtual chassis in the vsperf environment. For installation, select the version that matches the Spirent TestCenter Application version. For v4.57, the matching VDS version is 1.0.55. Download either the ova (VMware) or qcow2 (QEMU) image and create a VM with it. Initialize the VM according to Spirent installation instructions.
STCv is available in both ova (VMware) and qcow2 (QEMU) formats. For VMware, download:
Spirent TestCenter Virtual Machine for VMware, v4.57 for Hypervisor - VMware ESX.ESXi
Virtual test port performance is affected by the hypervisor configuration. For best practice results in deploying STCv, the following is suggested:
To get the highest performance and accuracy, Spirent TestCenter hardware is recommended. vsperf can run with either stype test ports.
The stcrestclient package provides the stchttp.py ReST API wrapper module. This allows simple function calls, nearly identical to those provided by StcPython.py, to be used to access TestCenter server sessions via the STC ReST API. Basic ReST functionality is provided by the resthttp module, and may be used for writing ReST clients independent of STC.
To use REST interface, follow the instructions in the Project page to install the package. Once installed, the scripts named with ‘rest’ keyword can be used. For example: testcenter-rfc2544-rest.py can be used to run RFC 2544 tests using the REST interface.
TRAFFICGEN_STC_LAB_SERVER_ADDR = " "
TRAFFICGEN_STC_LICENSE_SERVER_ADDR = " "
TRAFFICGEN_STC_PYTHON2_PATH = " "
TRAFFICGEN_STC_TESTCENTER_PATH = " "
TRAFFICGEN_STC_TEST_SESSION_NAME = " "
TRAFFICGEN_STC_CSV_RESULTS_FILE_PREFIX = " "
TRAFFICGEN_STC_EAST_CHASSIS_ADDR = " "
TRAFFICGEN_STC_EAST_SLOT_NUM = " "
TRAFFICGEN_STC_EAST_PORT_NUM = " "
TRAFFICGEN_STC_EAST_INTF_ADDR = " "
TRAFFICGEN_STC_EAST_INTF_GATEWAY_ADDR = " "
TRAFFICGEN_STC_WEST_CHASSIS_ADDR = ""
TRAFFICGEN_STC_WEST_SLOT_NUM = " "
TRAFFICGEN_STC_WEST_PORT_NUM = " "
TRAFFICGEN_STC_WEST_INTF_ADDR = " "
TRAFFICGEN_STC_WEST_INTF_GATEWAY_ADDR = " "
TRAFFICGEN_STC_RFC2544_TPUT_TEST_FILE_NAME
Example of testcase definition for RFC2889 tests:
{
    "Name": "phy2phy_forwarding",
    "Deployment": "p2p",
    "Description": "LTD.Forwarding.RFC2889.MaxForwardingRate",
    "Parameters" : {
        "TRAFFIC" : {
            "traffic_type" : "rfc2889_forwarding",
        },
    },
}
For RFC2889 tests, specifying the locations for the monitoring ports is mandatory. Necessary parameters are:
TRAFFICGEN_STC_RFC2889_TEST_FILE_NAME
TRAFFICGEN_STC_EAST_CHASSIS_ADDR = " "
TRAFFICGEN_STC_EAST_SLOT_NUM = " "
TRAFFICGEN_STC_EAST_PORT_NUM = " "
TRAFFICGEN_STC_EAST_INTF_ADDR = " "
TRAFFICGEN_STC_EAST_INTF_GATEWAY_ADDR = " "
TRAFFICGEN_STC_WEST_CHASSIS_ADDR = ""
TRAFFICGEN_STC_WEST_SLOT_NUM = " "
TRAFFICGEN_STC_WEST_PORT_NUM = " "
TRAFFICGEN_STC_WEST_INTF_ADDR = " "
TRAFFICGEN_STC_WEST_INTF_GATEWAY_ADDR = " "
TRAFFICGEN_STC_VERBOSE = "True"
TRAFFICGEN_STC_RFC2889_LOCATIONS="//10.1.1.1/1/1,//10.1.1.1/2/2"
Other Configurations are :
TRAFFICGEN_STC_RFC2889_MIN_LR = 1488
TRAFFICGEN_STC_RFC2889_MAX_LR = 14880
TRAFFICGEN_STC_RFC2889_MIN_ADDRS = 1000
TRAFFICGEN_STC_RFC2889_MAX_ADDRS = 65536
TRAFFICGEN_STC_RFC2889_AC_LR = 1000
The first 2 values are for address-learning test where as other 3 values are for the Address caching capacity test. LR: Learning Rate. AC: Address Caching. Maximum value for address is 16777216. Whereas, maximum for LR is 4294967295.
Results for RFC2889 Tests: Forwarding tests outputs following values:
TX_RATE_FPS : "Transmission Rate in Frames/sec"
THROUGHPUT_RX_FPS: "Received Throughput Frames/sec"
TX_RATE_MBPS : " Transmission rate in MBPS"
THROUGHPUT_RX_MBPS: "Received Throughput in MBPS"
TX_RATE_PERCENT: "Transmission Rate in Percentage"
FRAME_LOSS_PERCENT: "Frame loss in Percentage"
FORWARDING_RATE_FPS: " Maximum Forwarding Rate in FPS"
Whereas, the address caching test outputs following values,
CACHING_CAPACITY_ADDRS = 'Number of address it can cache'
ADDR_LEARNED_PERCENT = 'Percentage of address successfully learned'
and address learning test outputs just a single value:
OPTIMAL_LEARNING_RATE_FPS = 'Optimal learning rate in fps'
Note that ‘FORWARDING_RATE_FPS’, ‘CACHING_CAPACITY_ADDRS’, ‘ADDR_LEARNED_PERCENT’ and ‘OPTIMAL_LEARNING_RATE_FPS’ are the new result-constants added to support RFC2889 tests.
Xena Networks traffic generator requires specific files and packages to be installed. It is assumed the user has access to the Xena2544.exe file which must be placed in VSPerf installation location under the tools/pkt_gen/xena folder. Contact Xena Networks for the latest version of this file. The user can also visit www.xenanetworks/downloads to obtain the file with a valid support contract.
Note VSPerf has been fully tested with version v2.43 of Xena2544.exe
To execute the Xena2544.exe file under Linux distributions the mono-complete package must be installed. To install this package follow the instructions below. Further information can be obtained from http://www.mono-project.com/docs/getting-started/install/linux/
rpm --import "http://keyserver.ubuntu.com/pks/lookup?op=get&search=0x3FA7E0328081BFF6A14DA29AA6A19B38D3D831EF"
yum-config-manager --add-repo http://download.mono-project.com/repo/centos/
yum -y install mono-complete-5.8.0.127-0.xamarin.3.epel7.x86_64
To prevent gpg errors on future yum installation of packages the mono-project repo should be disabled once installed.
yum-config-manager --disable download.mono-project.com_repo_centos_
Connection information for your Xena Chassis must be supplied inside the
10_custom.conf or 03_custom.conf file. The following parameters must be
set to allow for proper connections to the chassis.
TRAFFICGEN_XENA_IP = ''
TRAFFICGEN_XENA_PORT1 = ''
TRAFFICGEN_XENA_PORT2 = ''
TRAFFICGEN_XENA_USER = ''
TRAFFICGEN_XENA_PASSWORD = ''
TRAFFICGEN_XENA_MODULE1 = ''
TRAFFICGEN_XENA_MODULE2 = ''
Xena traffic generator testing for rfc2544 throughput can be modified for different behaviors if needed. The default options for the following are optimized for best results.
TRAFFICGEN_XENA_2544_TPUT_INIT_VALUE = '10.0'
TRAFFICGEN_XENA_2544_TPUT_MIN_VALUE = '0.1'
TRAFFICGEN_XENA_2544_TPUT_MAX_VALUE = '100.0'
TRAFFICGEN_XENA_2544_TPUT_VALUE_RESOLUTION = '0.5'
TRAFFICGEN_XENA_2544_TPUT_USEPASS_THRESHHOLD = 'false'
TRAFFICGEN_XENA_2544_TPUT_PASS_THRESHHOLD = '0.0'
Each value modifies the behavior of rfc 2544 throughput testing. Refer to your Xena documentation to understand the behavior changes in modifying these values.
Xena RFC2544 testing inside VSPerf also includes a final verification option. This option allows for a faster binary search with a longer final verification of the binary search result. This feature can be enabled in the configuration files as well as the length of the final verification in seconds.
..code-block:: python
TRAFFICGEN_XENA_RFC2544_VERIFY = False TRAFFICGEN_XENA_RFC2544_VERIFY_DURATION = 120
If the final verification does not pass the test with the lossrate specified it will continue the binary search from its previous point. If the smart search option is enabled the search will continue by taking the current pass rate minus the minimum and divided by 2. The maximum is set to the last pass rate minus the threshold value set.
For example if the settings are as follows
..code-block:: python
TRAFFICGEN_XENA_RFC2544_BINARY_RESTART_SMART_SEARCH = True TRAFFICGEN_XENA_2544_TPUT_MIN_VALUE = ‘0.5’ TRAFFICGEN_XENA_2544_TPUT_VALUE_RESOLUTION = ‘0.5’
and the verification attempt was 64.5, smart search would take 64.5 - 0.5 / 2. This would continue the search at 32 but still have a maximum possible value of 64.
If smart is not enabled it will just resume at the last pass rate minus the threshold value.
Xena continuous traffic by default does a 3 second learning preemption to allow the DUT to receive learning packets before a continuous test is performed. If a custom test case requires this learning be disabled, you can disable the option or modify the length of the learning by modifying the following settings.
TRAFFICGEN_XENA_CONT_PORT_LEARNING_ENABLED = False
TRAFFICGEN_XENA_CONT_PORT_LEARNING_DURATION = 3
Xena has a modifier maximum value or 64k in size. For this reason when specifying Multistream values of greater than 64k for Layer 2 or Layer 3 it will use two modifiers that may be modified to a value that can be square rooted to create the two modifiers. You will see a log notification for the new value that was calculated.
MoonGen architecture overview and general installation instructions can be found here:
https://github.com/emmericp/MoonGen
For VSPERF use, MoonGen should be cloned from here (as opposed to the previously mentioned GitHub):
git clone https://github.com/atheurer/lua-trafficgen
and use the master branch:
git checkout master
VSPERF uses a particular Lua script with the MoonGen project:
trafficgen.lua
Follow MoonGen set up and execution instructions here:
https://github.com/atheurer/lua-trafficgen/blob/master/README.md
Note one will need to set up ssh login to not use passwords between the server running MoonGen and the device under test (running the VSPERF test infrastructure). This is because VSPERF on one server uses ‘ssh’ to configure and run MoonGen upon the other server.
One can set up this ssh access by doing the following on both servers:
ssh-keygen -b 2048 -t rsa
ssh-copy-id <other server>
Connection information for MoonGen must be supplied inside the
10_custom.conf or 03_custom.conf file. The following parameters must be
set to allow for proper connections to the host with MoonGen.
TRAFFICGEN_MOONGEN_HOST_IP_ADDR = ""
TRAFFICGEN_MOONGEN_USER = ""
TRAFFICGEN_MOONGEN_BASE_DIR = ""
TRAFFICGEN_MOONGEN_PORTS = ""
TRAFFICGEN_MOONGEN_LINE_SPEED_GBPS = ""
Trex architecture overview and general installation instructions can be found here:
https://trex-tgn.cisco.com/trex/doc/trex_stateless.html
You can directly download from GitHub:
git clone https://github.com/cisco-system-traffic-generator/trex-core
and use the same Trex version for both server and client API.
NOTE: The Trex API version used by VSPERF is defined by variable TREX_TAG
in file src/package-list.mk.
git checkout v2.38
or Trex latest release you can download from here:
wget --no-cache http://trex-tgn.cisco.com/trex/release/latest
After download, Trex repo has to be built:
cd trex-core/linux_dpdk
./b configure (run only once)
./b build
Next step is to create a minimum configuration file. It can be created by script dpdk_setup_ports.py.
The script with parameter -i will run in interactive mode and it will create file /etc/trex_cfg.yaml.
cd trex-core/scripts
sudo ./dpdk_setup_ports.py -i
Or example of configuration file can be found at location below, but it must be updated manually:
cp trex-core/scripts/cfg/simple_cfg /etc/trex_cfg.yaml
For additional information about configuration file see official documentation (chapter 3.1.2):
https://trex-tgn.cisco.com/trex/doc/trex_manual.html#_creating_minimum_configuration_file
After compilation and configuration it is possible to run trex server in stateless mode. It is neccesary for proper connection between Trex server and VSPERF.
cd trex-core/scripts/
./t-rex-64 -i
NOTE: Please check your firewall settings at both DUT and T-Rex server. Firewall must allow a connection from DUT (VSPERF) to the T-Rex server running at TCP port 4501.
NOTE: For high speed cards it may be advantageous to start T-Rex with more transmit queues/cores.
cd trex-cores/scripts/
./t-rex-64 -i -c 10
For additional information about Trex stateless mode see Trex stateless documentation:
https://trex-tgn.cisco.com/trex/doc/trex_stateless.html
NOTE: One will need to set up ssh login to not use passwords between the server running Trex and the device under test (running the VSPERF test infrastructure). This is because VSPERF on one server uses ‘ssh’ to configure and run Trex upon the other server.
One can set up this ssh access by doing the following on both servers:
ssh-keygen -b 2048 -t rsa
ssh-copy-id <other server>
Connection information for Trex must be supplied inside the custom configuration file. The following parameters must be set to allow for proper connections to the host with Trex. Example of this configuration is in conf/03_traffic.conf or conf/10_custom.conf.
TRAFFICGEN_TREX_HOST_IP_ADDR = ''
TRAFFICGEN_TREX_USER = ''
TRAFFICGEN_TREX_BASE_DIR = ''
TRAFFICGEN_TREX_USER has to have sudo permission and password-less access. TRAFFICGEN_TREX_BASE_DIR is the place, where is stored ‘t-rex-64’ file.
It is possible to specify the accuracy of RFC2544 Throughput measurement. Threshold below defines maximal difference between frame rate of successful (i.e. defined frameloss was reached) and unsuccessful (i.e. frameloss was exceeded) iterations.
Default value of this parameter is defined in conf/03_traffic.conf as follows:
TRAFFICGEN_TREX_RFC2544_TPUT_THRESHOLD = ''
T-Rex can have learning packets enabled. For certain tests it may be beneficial to send some packets before starting test traffic to allow switch learning to take place. This can be adjusted with the following configurations:
TRAFFICGEN_TREX_LEARNING_MODE=True
TRAFFICGEN_TREX_LEARNING_DURATION=5
Latency measurements have impact on T-Rex performance. Thus vswitchperf uses a separate
latency stream for each direction with limited speed. This workaround is used for RFC2544
Throughput and Continuous traffic types. In case of Burst traffic type,
the latency statistics are measured for all frames in the burst. Collection of latency
statistics is driven by configuration option TRAFFICGEN_TREX_LATENCY_PPS as follows:
value
0- disables latency measurements
- non zero integer value - enables latency measurements; In case of Throughput
and Continuous traffic types, it specifies a speed of latency specific stream in PPS. In case of burst traffic type, it enables latency measurements for all frames.
TRAFFICGEN_TREX_LATENCY_PPS = 1000
T-Rex by default only accepts packets on the receive side if the destination mac matches the MAC address specified in the /etc/trex-cfg.yaml on the server side. For SR-IOV this creates challenges with modifying the MAC address in the traffic profile to correctly flow packets through specified VFs. To remove this limitation enable promiscuous mode on T-Rex to allow all packets regardless of the destination mac to be accepted.
This also creates problems when doing multistream at layer 2 since the source macs will be modified. Enable Promiscuous mode when doing multistream at layer 2 testing with T-Rex.
TRAFFICGEN_TREX_PROMISCUOUS=True
T-Rex API will attempt to retrieve the highest possible speed from the card using internal calls to port information. If you are using two separate cards then it will take the lowest of the two cards as the max speed. If necessary you can try to force the API to use a specific maximum speed per port. The below configurations can be adjusted to enable this.
TRAFFICGEN_TREX_FORCE_PORT_SPEED = True
TRAFFICGEN_TREX_PORT_SPEED = 40000 # 40 gig
Note:: Setting higher than possible speeds will result in unpredictable behavior when running tests such as duration inaccuracy and/or complete test failure.
T-Rex can perform a verification run for a longer duration once the binary search of the RFC2544 trials have completed. This duration should be at least 60 seconds. This is similar to other traffic generator functionality where a more sustained time can be attempted to verify longer runs from the result of the search. This can be configured with the following params
TRAFFICGEN_TREX_VERIFICATION_MODE = False
TRAFFICGEN_TREX_VERIFICATION_DURATION = 60
TRAFFICGEN_TREX_MAXIMUM_VERIFICATION_TRIALS = 10
The duration and maximum number of attempted verification trials can be set to change the behavior of this step. If the verification step fails, it will resume the binary search with new values where the maximum output will be the last attempted frame rate minus the current set thresh hold.
It is possible to use a SCAPY frame definition to generate various network protocols by the T-Rex traffic generator. In case that particular network protocol layer is disabled by the TRAFFIC dictionary (e.g. TRAFFIC[‘vlan’][‘enabled’] = False), then disabled layer will be removed from the scapy format definition by VSPERF.
The scapy frame definition can refer to values defined by the TRAFFIC dictionary by following keywords. These keywords are used in next examples.
Ether_src - refers to TRAFFIC['l2']['srcmac']Ether_dst - refers to TRAFFIC['l2']['dstmac']IP_proto - refers to TRAFFIC['l3']['proto']IP_PROTO - refers to upper case version of TRAFFIC['l3']['proto']IP_src - refers to TRAFFIC['l3']['srcip']IP_dst - refers to TRAFFIC['l3']['dstip']IP_PROTO_sport - refers to TRAFFIC['l4']['srcport']IP_PROTO_dport - refers to TRAFFIC['l4']['dstport']Dot1Q_prio - refers to TRAFFIC['vlan']['priority']Dot1Q_id - refers to TRAFFIC['vlan']['cfi']Dot1Q_vlan - refers to TRAFFIC['vlan']['id']In following examples of SCAPY frame definition only relevant parts of TRAFFIC
dictionary are shown. The rest of the TRAFFIC dictionary is set to default values
as they are defined in conf/03_traffic.conf.
Please check official documentation of SCAPY project for details about SCAPY frame definition and supported network layers at: http://www.secdev.org/projects/scapy
Generate ICMP frames:
'scapy': {
'enabled': True,
'0' : 'Ether(src={Ether_src}, dst={Ether_dst})/IP(proto="icmp", src={IP_src}, dst={IP_dst})/ICMP()',
'1' : 'Ether(src={Ether_dst}, dst={Ether_src})/IP(proto="icmp", src={IP_dst}, dst={IP_src})/ICMP()',
}
Generate IPv6 ICMP Echo Request
'l3' : {
'srcip': 'feed::01',
'dstip': 'feed::02',
},
'scapy': {
'enabled': True,
'0' : 'Ether(src={Ether_src}, dst={Ether_dst})/IPv6(src={IP_src}, dst={IP_dst})/ICMPv6EchoRequest()',
'1' : 'Ether(src={Ether_dst}, dst={Ether_src})/IPv6(src={IP_dst}, dst={IP_src})/ICMPv6EchoRequest()',
}
Generate TCP frames:
Example uses default SCAPY frame definition, which can reflect TRAFFIC['l3']['proto'] settings.
'l3' : {
'proto' : 'tcp',
},
VSPERF supports the following categories additional tools:
Under each category, there are one or more tools supported by VSPERF. This guide provides the details of how to install (if required) and configure the above mentioned tools.
VSPERF supports following two tools for collecting and reporting the metrics:
pidstat is a command in linux systems, which is used for monitoring individual tasks currently being managed by Linux kernel. In VSPERF this command is used to monitor ovs-vswitchd, ovsdb-server and kvm processes.
collectd is linux application that collects, stores and transfers various system metrics. For every category of metrics, there is a separate plugin in collectd. For example, CPU plugin and Interface plugin provides all the cpu metrics and interface metrics, respectively. CPU metrics may include user-time, system-time, etc., whereas interface metrics may include received-packets, dropped-packets, etc.
No installation is required for pidstat, whereas, collectd has to be installed separately. For installation of collectd, we recommend to follow the process described in OPNFV-Barometer project, which can be found here Barometer-Euphrates or the most recent release.
VSPERF assumes that collectd is installed and configured to send metrics over localhost. The metrics sent should be for the following categories: CPU, Processes, Interface, OVS, DPDK, Intel-RDT.
The configuration file for the collectors can be found in conf/05_collector.conf. pidstat specific configuration includes:
PIDSTAT_MONITOR - processes to be monitored by pidstatPIDSTAT_OPTIONS - options which will be passed to pidstat commandPIDSTAT_SAMPLE_INTERVAL - sampling interval used by pidstat to collect statisticsLOG_FILE_PIDSTAT - prefix of pidstat’s log fileThe collectd configuration option includes:
COLLECTD_IP - IP address where collectd is runningCOLLECTD_PORT - Port number over which collectd is sending the metricsCOLLECTD_SECURITY_LEVEL - Security level for receiving metricsCOLLECTD_AUTH_FILE - Authentication file for receiving metricsLOG_FILE_COLLECTD - Prefix for collectd’s log file.COLLECTD_CPU_KEYS - Interesting metrics from CPUCOLLECTD_PROCESSES_KEYS - Interesting metrics from processesCOLLECTD_INTERFACE_KEYS - Interesting metrics from interfaceCOLLECTD_OVSSTAT_KEYS - Interesting metrics from OVSCOLLECTD_DPDKSTAT_KEYS - Interesting metrics from DPDK.COLLECTD_INTELRDT_KEYS - Interesting metrics from Intel-RDTCOLLECTD_INTERFACE_XKEYS - Metrics to exclude from InterfaceCOLLECTD_INTELRDT_XKEYS - Metrics to exclude from Intel-RDTIn VSPERF, load generation refers to creating background cpu and memory loads to study the impact of these loads on system under test. There are two options to create loads in VSPERF. These options are used for different use-cases. The options are:
stress and stress-ng are linux tools to stress the system in various ways. It can stress different subsystems such as CPU and memory. stress-ng is the improvised version of stress. StressorVMs are custom build virtual-machines for the noisy-neighbor use-cases.
stress and stress-ng can be installed through standard linux installation process. Information about stress-ng, including the steps for installing can be found here: stress-ng
There are two options for StressorVMs - one is VMs based on stress-ng and second is VM based on Spirent’s cloudstress. VMs based on stress-ng can be found in this link . Spirent’s cloudstress based VM can be downloaded from this site
These stressorVMs are of OSV based VMs, which are very small in size. Download these VMs and place it in appropriate location, and this location will used in the configuration - as mentioned below.
The configuration file for loadgens can be found in conf/07_loadgen.conf. There are no specific configurations for stress and stress-ng commands based load-generation. However, for StressorVMs, following configurations apply:
NN_COUNT - Number of stressor VMs required.NN_MEMORY - Comma separated memory configuration for each VMNN_SMP - Comma separated configuration for each VMNN_IMAGE - Comma separated list of Paths for each VM imageNN_SHARED_DRIVE_TYPE - Comma separated list of shaed drive type for each VMNN_BOOT_DRIVE_TYPE - Comma separated list of boot drive type for each VMNN_CORE_BINDING - Comma separated lists of list specifying the cores associated with each VM.NN_NICS_NR - Comma seprated list of number of NICS for each VMNN_BASE_VNC_PORT - Base VNC port Index.NN_LOG_FILE - Name of the log fileVSPERF support last-level cache management using Intel’s RDT tool(s) - the relavant ones are Intel CAT-CMT and Intel RMD. RMD is a linux daemon that runs on individual hosts, and provides a REST API for control/orchestration layer to request LLC for the VMs/Containers/Applications. RDT receives resource policy form orchestration layer - in this case, from VSPERF - and enforce it on the host. It achieves this enforcement via kernel interfaces such as resctrlfs and libpqos. The resource here refer to the last-level cache. User can configure policies to define how much of cache a CPU can get. The policy configuration is described below.
For installation of RMD tool, please install CAT-CMT first and then install RMD. The details of installation can be found here: Intel CAT-CMT and Intel RMD
The configuration file for cache management can be found in conf/08_llcmanagement.conf.
VSPERF provides following configuration options, for user to define and enforce policies via RMD.
LLC_ALLOCATION - Enable or Disable LLC management.RMD_PORT - RMD port (port number on which API server is listening)RMD_SERVER_IP - IP address where RMD is running. Currently only localhost.RMD_API_VERSION - RMD version. Currently it is ‘v1’POLICY_TYPE - Specify how the policy is defined - either COS or CUSTOMVSWITCH_COS - Class of service (CoS for Vswitch. CoS can be gold, silver-bf or bronze-shared.VNF_COS - Class of service for VNFPMD_COS - Class of service for PMDNOISEVM_COS - Class of service of Noisy VM.VSWITCH_CA - [min-cache-value, maxi-cache-value] for vswitchVNF_CA - [min-cache-value, max-cache-value] for VNFPMD_CA - [min-cache-value, max-cache-value] for PMDNOISEVM_CA - [min-cache-value, max-cache-value] for Noisy VMVSPERF requires a traffic generators to run tests, automated traffic gen support in VSPERF includes:
If you want to use another traffic generator, please select the Dummy generator.
To see the supported Operating Systems, vSwitches and system requirements, please follow the installation instructions <vsperf-installation>.
Follow the Traffic generator instructions <trafficgen-installation> to install and configure a suitable traffic generator.
In order to run VSPERF, you will need to download DPDK and OVS. You can do this manually and build them in a preferred location, OR you could use vswitchperf/src. The vswitchperf/src directory contains makefiles that will allow you to clone and build the libraries that VSPERF depends on, such as DPDK and OVS. To clone and build simply:
$ cd src
$ make
VSPERF can be used with stock OVS (without DPDK support). When build is finished, the libraries are stored in src_vanilla directory.
The ‘make’ builds all options in src:
The vhost_user build will reside in src/ovs/ The Vanilla OVS build will reside in vswitchperf/src_vanilla
To delete a src subdirectory and its contents to allow you to re-clone simply use:
$ make clobber
./conf/10_custom.conf file¶The 10_custom.conf file is the configuration file that overrides
default configurations in all the other configuration files in ./conf
The supplied 10_custom.conf file MUST be modified, as it contains
configuration items for which there are no reasonable default values.
The configuration items that can be added is not limited to the initial
contents. Any configuration item mentioned in any .conf file in
./conf directory can be added and that item will be overridden by
the custom configuration value.
Further details about configuration files evaluation and special behaviour
of options with GUEST_ prefix could be found at design document.
If your 10_custom.conf doesn’t reside in the ./conf directory
or if you want to use an alternative configuration file, the file can
be passed to vsperf via the --conf-file argument.
$ ./vsperf --conf-file <path_to_custom_conf> ...
The value of configuration parameter can be specified at various places, e.g. at the test case definition, inside configuration files, by the command line argument, etc. Thus it is important to understand the order of configuration parameter evaluation. This “priority hierarchy” can be described like so (1 = max priority):
vSwitch, Trafficgen, VNF and Tunnel TypeParameters--test-params, --vswitch, --trafficgen, etc.)--load-env argument)--conf-file argumentFor example, if the same configuration parameter is defined in custom configuration
file (specified via --conf-file argument), via --test-params argument
and also inside Parameters section of the testcase definition, then parameter
value from the Parameters section will be used.
Further details about order of configuration files evaluation and special behaviour
of options with GUEST_ prefix could be found at design document.
The configuration items can be overridden by command line argument
--test-params. In this case, the configuration items and
their values should be passed in form of item=value and separated
by semicolon.
Example:
$ ./vsperf --test-params "TRAFFICGEN_DURATION=10;TRAFFICGEN_PKT_SIZES=(128,);" \
"GUEST_LOOPBACK=['testpmd','l2fwd']" pvvp_tput
The --test-params command line argument can also be used to override default
configuration values for multiple tests. Providing a list of parameters will apply each
element of the list to the test with the same index. If more tests are run than
parameters provided the last element of the list will repeat.
$ ./vsperf --test-params "['TRAFFICGEN_DURATION=10;TRAFFICGEN_PKT_SIZES=(128,)',"
"'TRAFFICGEN_DURATION=10;TRAFFICGEN_PKT_SIZES=(64,)']" \
pvvp_tput pvvp_tput
The second option is to override configuration items by Parameters section
of the test case definition. The configuration items can be added into Parameters
dictionary with their new values. These values will override values defined in
configuration files or specified by --test-params command line argument.
Example:
"Parameters" : {'TRAFFICGEN_PKT_SIZES' : (128,),
'TRAFFICGEN_DURATION' : 10,
'GUEST_LOOPBACK' : ['testpmd','l2fwd'],
}
NOTE: In both cases, configuration item names and their values must be specified
in the same form as they are defined inside configuration files. Parameter names
must be specified in uppercase and data types of original and new value must match.
Python syntax rules related to data types and structures must be followed.
For example, parameter TRAFFICGEN_PKT_SIZES above is defined as a tuple
with a single value 128. In this case trailing comma is mandatory, otherwise
value can be wrongly interpreted as a number instead of a tuple and vsperf
execution would fail. Please check configuration files for default values and their
types and use them as a basis for any customized values. In case of any doubt, please
check official python documentation related to data structures like tuples, lists
and dictionaries.
NOTE: Vsperf execution will terminate with runtime error in case, that unknown
parameter name is passed via --test-params CLI argument or defined in Parameters
section of test case definition. It is also forbidden to redefine a value of
TEST_PARAMS configuration item via CLI or Parameters section.
NOTE: The new definition of the dictionary parameter, specified via --test-params
or inside Parameters section, will not override original dictionary values. Instead
the original dictionary will be updated with values from the new dictionary definition.
It is possible to use a special macro #PARAM() to refer to the value of
another configuration parameter. This reference is evaluated during
access of the parameter value (by settings.getValue() call), so it
can refer to parameters created during VSPERF runtime, e.g. NICS dictionary.
It can be used to reflect DUT HW details in the testcase definition.
Example:
{
...
"Name": "testcase",
"Parameters" : {
"TRAFFIC" : {
'l2': {
# set destination MAC to the MAC of the first
# interface from WHITELIST_NICS list
'dstmac' : '#PARAM(NICS[0]["mac"])',
},
},
...
VSPERF uses a VM image called vloop_vnf for looping traffic in the deployment scenarios involving VMs. The image can be downloaded from http://artifacts.opnfv.org/.
Please see the installation instructions for information on vloop-vnf images.
A Kernel Module that provides OSI Layer 2 Ipv4 termination or forwarding with support for Destination Network Address Translation (DNAT) for both the MAC and IP addresses. l2fwd can be found in <vswitchperf_dir>/src/l2fwd
Follow the Additional tools instructions <additional-tools-configuration> to install and configure additional tools such as collectors and loadgens.
All examples inside these docs assume, that user is inside the VSPERF directory. VSPERF can be executed from any directory.
Before running any tests make sure you have root permissions by adding the following line to /etc/sudoers:
username ALL=(ALL) NOPASSWD: ALL
username in the example above should be replaced with a real username.
To list the available tests:
$ ./vsperf --list
To run a single test:
$ ./vsperf $TESTNAME
Where $TESTNAME is the name of the vsperf test you would like to run.
To run a test multiple times, repeat it:
$ ./vsperf $TESTNAME $TESTNAME $TESTNAME
To run a group of tests, for example all tests with a name containing ‘RFC2544’:
$ ./vsperf --conf-file=<path_to_custom_conf>/10_custom.conf --tests="RFC2544"
To run all tests:
$ ./vsperf --conf-file=<path_to_custom_conf>/10_custom.conf
Some tests allow for configurable parameters, including test duration (in seconds) as well as packet sizes (in bytes).
$ ./vsperf --conf-file user_settings.py \
--tests RFC2544Tput \
--test-params "TRAFFICGEN_DURATION=10;TRAFFICGEN_PKT_SIZES=(128,)"
To specify configurable parameters for multiple tests, use a list of parameters. One element for each test.
$ ./vsperf --conf-file user_settings.py \
--test-params "['TRAFFICGEN_DURATION=10;TRAFFICGEN_PKT_SIZES=(128,)',"\
"'TRAFFICGEN_DURATION=10;TRAFFICGEN_PKT_SIZES=(64,)']" \
phy2phy_cont phy2phy_cont
If the CUMULATIVE_PARAMS setting is set to True and there are different parameters
provided for each test using --test-params, each test will take the parameters of
the previous test before appyling it’s own.
With CUMULATIVE_PARAMS set to True the following command will be equivalent to the
previous example:
$ ./vsperf --conf-file user_settings.py \
--test-params "['TRAFFICGEN_DURATION=10;TRAFFICGEN_PKT_SIZES=(128,)',"\
"'TRAFFICGEN_PKT_SIZES=(64,)']" \
phy2phy_cont phy2phy_cont
"
For all available options, check out the help dialog:
$ ./vsperf --help
If needed, recompile src for all OVS variants
$ cd src
$ make distclean
$ make
Update your 10_custom.conf file to use Vanilla OVS:
VSWITCH = 'OvsVanilla'
Run test:
$ ./vsperf --conf-file=<path_to_custom_conf>
Please note if you don’t want to configure Vanilla OVS through the configuration file, you can pass it as a CLI argument.
$ ./vsperf --vswitch OvsVanilla
To run tests using vhost-user as guest access method:
Set VSWITCH and VNF of your settings file to:
VSWITCH = 'OvsDpdkVhost'
VNF = 'QemuDpdkVhost'
If needed, recompile src for all OVS variants
$ cd src
$ make distclean
$ make
Run test:
$ ./vsperf --conf-file=<path_to_custom_conf>/10_custom.conf
NOTE: By default vSwitch is acting as a server for dpdk vhost-user sockets.
In case, that QEMU should be a server for vhost-user sockets, then parameter
VSWITCH_VHOSTUSER_SERVER_MODE should be set to False.
To run tests using Vanilla OVS:
Set the following variables:
VSWITCH = 'OvsVanilla'
VNF = 'QemuVirtioNet'
VANILLA_TGEN_PORT1_IP = n.n.n.n
VANILLA_TGEN_PORT1_MAC = nn:nn:nn:nn:nn:nn
VANILLA_TGEN_PORT2_IP = n.n.n.n
VANILLA_TGEN_PORT2_MAC = nn:nn:nn:nn:nn:nn
VANILLA_BRIDGE_IP = n.n.n.n
or use --test-params option
$ ./vsperf --conf-file=<path_to_custom_conf>/10_custom.conf \
--test-params "VANILLA_TGEN_PORT1_IP=n.n.n.n;" \
"VANILLA_TGEN_PORT1_MAC=nn:nn:nn:nn:nn:nn;" \
"VANILLA_TGEN_PORT2_IP=n.n.n.n;" \
"VANILLA_TGEN_PORT2_MAC=nn:nn:nn:nn:nn:nn"
If needed, recompile src for all OVS variants
$ cd src
$ make distclean
$ make
Run test:
$ ./vsperf --conf-file<path_to_custom_conf>/10_custom.conf
Currently it is not possible to use standard scenario deployments for execution of
tests with VPP. It means, that deployments p2p, pvp, pvvp and in general any
PXP Deployment won’t work with VPP. However it is possible to use VPP in
Step driven tests. A basic set of VPP testcases covering phy2phy, pvp
and pvvp tests are already prepared.
List of performance tests with VPP support follows:
In order to execute testcases with VPP it is required to:
WHITELIST_NICS, with two physical NICs connected to the traffic generatorAfter that it is possible to execute VPP testcases listed above.
For example:
$ ./vsperf --conf-file=<path_to_custom_conf> phy2phy_tput_vpp
To use vfio with DPDK instead of igb_uio add into your custom configuration file the following parameter:
PATHS['dpdk']['src']['modules'] = ['uio', 'vfio-pci']
NOTE: In case, that DPDK is installed from binary package, then please
set PATHS['dpdk']['bin']['modules'] instead.
NOTE: Please ensure that Intel VT-d is enabled in BIOS.
NOTE: Please ensure your boot/grub parameters include the following:
iommu=pt intel_iommu=on
To check that IOMMU is enabled on your platform:
$ dmesg | grep IOMMU
[ 0.000000] Intel-IOMMU: enabled
[ 0.139882] dmar: IOMMU 0: reg_base_addr fbffe000 ver 1:0 cap d2078c106f0466 ecap f020de
[ 0.139888] dmar: IOMMU 1: reg_base_addr ebffc000 ver 1:0 cap d2078c106f0466 ecap f020de
[ 0.139893] IOAPIC id 2 under DRHD base 0xfbffe000 IOMMU 0
[ 0.139894] IOAPIC id 0 under DRHD base 0xebffc000 IOMMU 1
[ 0.139895] IOAPIC id 1 under DRHD base 0xebffc000 IOMMU 1
[ 3.335744] IOMMU: dmar0 using Queued invalidation
[ 3.335746] IOMMU: dmar1 using Queued invalidation
....
NOTE: In case of VPP, it is required to explicitly define, that vfio-pci DPDK driver should be used. It means to update dpdk part of VSWITCH_VPP_ARGS dictionary with uio-driver section, e.g. VSWITCH_VPP_ARGS[‘dpdk’] = ‘uio-driver vfio-pci’
To use virtual functions of NIC with SRIOV support, use extended form of NIC PCI slot definition:
WHITELIST_NICS = ['0000:05:00.0|vf0', '0000:05:00.1|vf3']
Where ‘vf’ is an indication of virtual function usage and following number defines a VF to be used. In case that VF usage is detected, then vswitchperf will enable SRIOV support for given card and it will detect PCI slot numbers of selected VFs.
So in example above, one VF will be configured for NIC ‘0000:05:00.0’ and four VFs will be configured for NIC ‘0000:05:00.1’. Vswitchperf will detect PCI addresses of selected VFs and it will use them during test execution.
At the end of vswitchperf execution, SRIOV support will be disabled.
SRIOV support is generic and it can be used in different testing scenarios. For example:
Raw virtual machine throughput performance can be measured by execution of PVP test with direct access to NICs by PCI pass-through. To execute VM with direct access to PCI devices, enable vfio-pci. In order to use virtual functions, SRIOV-support must be enabled.
Execution of test with PCI pass-through with vswitch disabled:
$ ./vsperf --conf-file=<path_to_custom_conf>/10_custom.conf \
--vswitch none --vnf QemuPciPassthrough pvp_tput
Any of supported guest-loopback-application can be used inside VM with PCI pass-through support.
Note: Qemu with PCI pass-through support can be used only with PVP test deployment.
To select the loopback applications which will forward packets inside VMs, the following parameter should be configured:
GUEST_LOOPBACK = ['testpmd']
or use --test-params CLI argument:
$ ./vsperf --conf-file=<path_to_custom_conf>/10_custom.conf \
--test-params "GUEST_LOOPBACK=['testpmd']"
Supported loopback applications are:
'testpmd' - testpmd from dpdk will be built and used
'l2fwd' - l2fwd module provided by Huawei will be built and used
'linux_bridge' - linux bridge will be configured
'buildin' - nothing will be configured by vsperf; VM image must
ensure traffic forwarding between its interfaces
Guest loopback application must be configured, otherwise traffic will not be forwarded by VM and testcases with VM related deployments will fail. Guest loopback application is set to ‘testpmd’ by default.
NOTE: In case that only 1 or more than 2 NICs are configured for VM, then ‘testpmd’ should be used. As it is able to forward traffic between multiple VM NIC pairs.
NOTE: In case of linux_bridge, all guest NICs are connected to the same bridge inside the guest.
Mergable buffers can be disabled with VSPerf within QEMU. This option can increase performance significantly when not using jumbo frame sized packets. By default VSPerf disables mergable buffers. If you wish to enable it you can modify the setting in the a custom conf file.
GUEST_NIC_MERGE_BUFFERS_DISABLE = [False]
Then execute using the custom conf file.
$ ./vsperf --conf-file=<path_to_custom_conf>/10_custom.conf
Alternatively you can just pass the param during execution.
$ ./vsperf --test-params "GUEST_NIC_MERGE_BUFFERS_DISABLE=[False]"
To select dpdk binding driver, which will specify which driver the vm NICs will use for dpdk bind, the following configuration parameter should be configured:
GUEST_DPDK_BIND_DRIVER = ['igb_uio_from_src']
The supported dpdk guest bind drivers are:
'uio_pci_generic' - Use uio_pci_generic driver
'igb_uio_from_src' - Build and use the igb_uio driver from the dpdk src
files
'vfio_no_iommu' - Use vfio with no iommu option. This requires custom
guest images that support this option. The default
vloop image does not support this driver.
Note: uio_pci_generic does not support sr-iov testcases with guests attached. This is because uio_pci_generic only supports legacy interrupts. In case uio_pci_generic is selected with the vnf as QemuPciPassthrough it will be modified to use igb_uio_from_src instead.
Note: vfio_no_iommu requires kernels equal to or greater than 4.5 and dpdk 16.04 or greater. Using this option will also taint the kernel.
Please refer to the dpdk documents at http://dpdk.org/doc/guides for more information on these drivers.
VSPERF provides options to achieve better performance by guest core binding and guest vCPU thread binding as well. Core binding is to bind all the qemu threads. Thread binding is to bind the house keeping threads to some CPU and vCPU thread to some other CPU, this helps to reduce the noise from qemu house keeping threads.
GUEST_CORE_BINDING = [('#EVAL(6+2*#VMINDEX)', '#EVAL(7+2*#VMINDEX)')]
NOTE By default the GUEST_THREAD_BINDING will be none, which means same as the GUEST_CORE_BINDING, i.e. the vcpu threads are sharing the physical CPUs with the house keeping threads. Better performance using vCPU thread binding can be achieved by enabling affinity in the custom configuration file.
For example, if an environment requires 32,33 to be core binded and 29,30&31 for guest thread binding to achieve better performance.
VNF_AFFINITIZATION_ON = True
GUEST_CORE_BINDING = [('32','33')]
GUEST_THREAD_BINDING = [('29', '30', '31')]
QEMU default to a compatible subset of performance enhancing cpu features. To pass all available host processor features to the guest.
GUEST_CPU_OPTIONS = ['host,migratable=off']
NOTE To enhance the performance, cpu features tsc deadline timer for guest, the guest PMU, the invariant TSC can be provided in the custom configuration file.
VSPerf currently supports multi-queue with the following limitations:
Requires QEMU 2.5 or greater and any OVS version higher than 2.5. The default upstream package versions installed by VSPerf satisfies this requirement.
Guest image must have ethtool utility installed if using l2fwd or linux bridge inside guest for loopback.
If using OVS versions 2.5.0 or less enable old style multi-queue as shown in the ‘‘02_vswitch.conf’’ file.
OVS_OLD_STYLE_MQ = True
To enable multi-queue for dpdk modify the ‘‘02_vswitch.conf’’ file.
VSWITCH_DPDK_MULTI_QUEUES = 2
NOTE: you should consider using the switch affinity to set a pmd cpu mask that can optimize your performance. Consider the numa of the NIC in use if this applies by checking /sys/class/net/<eth_name>/device/numa_node and setting an appropriate mask to create PMD threads on the same numa node.
When multi-queue is enabled, each dpdk or dpdkvhostuser port that is created on the switch will set the option for multiple queues. If old style multi queue has been enabled a global option for multi queue will be used instead of the port by port option.
To enable multi-queue on the guest modify the ‘‘04_vnf.conf’’ file.
GUEST_NIC_QUEUES = [2]
Enabling multi-queue at the guest will add multiple queues to each NIC port when qemu launches the guest.
In case of Vanilla OVS, multi-queue is enabled on the tuntap ports and nic queues will be enabled inside the guest with ethtool. Simply enabling the multi-queue on the guest is sufficient for Vanilla OVS multi-queue.
Testpmd should be configured to take advantage of multi-queue on the guest if using DPDKVhostUser. This can be done by modifying the ‘‘04_vnf.conf’’ file.
GUEST_TESTPMD_PARAMS = ['-l 0,1,2,3,4 -n 4 --socket-mem 512 -- '
'--burst=64 -i --txqflags=0xf00 '
'--nb-cores=4 --rxq=2 --txq=2 '
'--disable-hw-vlan']
NOTE: The guest SMP cores must be configured to allow for testpmd to use the optimal number of cores to take advantage of the multiple guest queues.
In case of using Vanilla OVS and qemu virtio-net you can increase performance by binding vhost-net threads to cpus. This can be done by enabling the affinity in the ‘‘04_vnf.conf’’ file. This can be done to non multi-queue enabled configurations as well as there will be 2 vhost-net threads.
VSWITCH_VHOST_NET_AFFINITIZATION = True
VSWITCH_VHOST_CPU_MAP = [4,5,8,11]
NOTE: This method of binding would require a custom script in a real environment.
NOTE: For optimal performance guest SMPs and/or vhost-net threads should be on the same numa as the NIC in use if possible/applicable. Testpmd should be assigned at least (nb_cores +1) total cores with the cpu mask.
VSPERF provides options to support jumbo frame testing with a jumbo frame supported NIC and traffic generator for the following vswitches:
NOTE: There is currently no support for SR-IOV or VPP at this time with jumbo frames.
All packet forwarding applications for pxp testing is supported.
To enable jumbo frame testing simply enable the option in the conf files and set the maximum size that will be used.
VSWITCH_JUMBO_FRAMES_ENABLED = True
VSWITCH_JUMBO_FRAMES_SIZE = 9000
To enable jumbo frame testing with OVSVanilla the NIC in test on the host must have its mtu size changed manually using ifconfig or applicable tools:
ifconfig eth1 mtu 9000 up
NOTE: To make the setting consistent across reboots you should reference the OS documents as it differs from distribution to distribution.
To start a test for jumbo frames modify the conf file packet sizes or pass the option through the VSPERF command line.
TEST_PARAMS = {'TRAFFICGEN_PKT_SIZES':(2000,9000)}
./vsperf --test-params "TRAFFICGEN_PKT_SIZES=2000,9000"
It is recommended to increase the memory size for OvsDpdkVhostUser testing from the default 1024. Your size required may vary depending on the number of guests in your testing. 4096 appears to work well for most typical testing scenarios.
DPDK_SOCKET_MEM = ['4096', '0']
NOTE: For Jumbo frames to work with DpdkVhostUser, mergable buffers will be enabled by default. If testing with mergable buffers in QEMU is desired, disable Jumbo Frames and only test non jumbo frame sizes. Test Jumbo Frames sizes separately to avoid this collision.
To select the applications which will forward packets, the following parameters should be configured:
VSWITCH = 'none'
PKTFWD = 'TestPMD'
or use --vswitch and --fwdapp CLI arguments:
$ ./vsperf phy2phy_cont --conf-file user_settings.py \
--vswitch none \
--fwdapp TestPMD
Supported Packet Forwarding applications are:
'testpmd' - testpmd from dpdk
Update your ‘‘10_custom.conf’’ file to use the appropriate variables for selected Packet Forwarder:
# testpmd configuration
TESTPMD_ARGS = []
# packet forwarding mode supported by testpmd; Please see DPDK documentation
# for comprehensive list of modes supported by your version.
# e.g. io|mac|mac_retry|macswap|flowgen|rxonly|txonly|csum|icmpecho|...
# Note: Option "mac_retry" has been changed to "mac retry" since DPDK v16.07
TESTPMD_FWD_MODE = 'csum'
# checksum calculation layer: ip|udp|tcp|sctp|outer-ip
TESTPMD_CSUM_LAYER = 'ip'
# checksum calculation place: hw (hardware) | sw (software)
TESTPMD_CSUM_CALC = 'sw'
# recognize tunnel headers: on|off
TESTPMD_CSUM_PARSE_TUNNEL = 'off'
Run test:
$ ./vsperf phy2phy_tput --conf-file <path_to_settings_py>
TestPMD with DPDK 16.11 or greater can be used to forward packets as a switch to a single guest using TestPMD vdev option. To set this configuration the following parameters should be used.
VSWITCH = 'none' PKTFWD = 'TestPMD'
or use --vswitch and --fwdapp CLI arguments:
$ ./vsperf pvp_tput --conf-file user_settings.py \ --vswitch none \ --fwdapp TestPMD
Guest forwarding application only supports TestPMD in this configuration.
GUEST_LOOPBACK = ['testpmd']
For optimal performance one cpu per port +1 should be used for TestPMD. Also set additional params for packet forwarding application to use the correct number of nb-cores.
DPDK_SOCKET_MEM = ['1024', '0'] VSWITCHD_DPDK_ARGS = ['-l', '46,44,42,40,38', '-n', '4'] TESTPMD_ARGS = ['--nb-cores=4', '--txq=1', '--rxq=1']
For guest TestPMD 3 VCpus should be assigned with the following TestPMD params.
GUEST_TESTPMD_PARAMS = ['-l 0,1,2 -n 4 --socket-mem 1024 -- ' '--burst=64 -i --txqflags=0xf00 ' '--disable-hw-vlan --nb-cores=2 --txq=1 --rxq=1']
Execution of TestPMD can be run with the following command line
./vsperf pvp_tput --vswitch=none --fwdapp=TestPMD --conf-file <path_to_settings_py>
NOTE: To achieve the best 0% loss numbers with rfc2544 throughput testing, other tunings should be applied to host and guest such as tuned profiles and CPU tunings to prevent possible interrupts to worker threads.
VSPERF can be run in different modes. By default it will configure vSwitch, traffic generator and VNF. However it can be used just for configuration and execution of traffic generator. Another option is execution of all components except traffic generator itself.
Mode of operation is driven by configuration parameter -m or –mode
-m MODE, --mode MODE vsperf mode of operation;
Values:
"normal" - execute vSwitch, VNF and traffic generator
"trafficgen" - execute only traffic generator
"trafficgen-off" - execute vSwitch and VNF
"trafficgen-pause" - execute vSwitch and VNF but wait before traffic transmission
In case, that VSPERF is executed in “trafficgen” mode, then configuration
of traffic generator can be modified through TRAFFIC dictionary passed to the
--test-params option. It is not needed to specify all values of TRAFFIC
dictionary. It is sufficient to specify only values, which should be changed.
Detailed description of TRAFFIC dictionary can be found at
Configuration of TRAFFIC dictionary.
Example of execution of VSPERF in “trafficgen” mode:
$ ./vsperf -m trafficgen --trafficgen IxNet --conf-file vsperf.conf \
--test-params "TRAFFIC={'traffic_type':'rfc2544_continuous','bidir':'False','framerate':60}"
The --matrix command line argument analyses and displays the performance of
all the tests run. Using the metric specified by MATRIX_METRIC in the conf-file,
the first test is set as the baseline and all the other tests are compared to it.
The MATRIX_METRIC must always refer to a numeric value to enable comparision.
A table, with the test ID, metric value, the change of the metric in %, testname
and the test parameters used for each test, is printed out as well as saved into the
results directory.
Example of 2 tests being compared using Performance Matrix:
$ ./vsperf --conf-file user_settings.py \
--test-params "['TRAFFICGEN_PKT_SIZES=(64,)',"\
"'TRAFFICGEN_PKT_SIZES=(128,)']" \
phy2phy_cont phy2phy_cont --matrix
Example output:
+------+--------------+---------------------+----------+---------------------------------------+
| ID | Name | throughput_rx_fps | Change | Parameters, CUMULATIVE_PARAMS = False |
+======+==============+=====================+==========+=======================================+
| 0 | phy2phy_cont | 23749000.000 | 0 | 'TRAFFICGEN_PKT_SIZES': [64] |
+------+--------------+---------------------+----------+---------------------------------------+
| 1 | phy2phy_cont | 16850500.000 | -29.048 | 'TRAFFICGEN_PKT_SIZES': [128] |
+------+--------------+---------------------+----------+---------------------------------------+
Every developer participating in VSPERF project should run pylint before his python code is submitted for review. Project specific configuration for pylint is available at ‘pylint.rc’.
Example of manual pylint invocation:
$ pylint --rcfile ./pylintrc ./vsperf
Using custom VM images may not boot within VSPerf pxp testing because of the drive boot and shared type which could be caused by a missing scsi driver inside the image. In case of issues you can try changing the drive boot type to ide.
GUEST_BOOT_DRIVE_TYPE = ['ide']
GUEST_SHARED_DRIVE_TYPE = ['ide']
If you encounter the following error: “before (last 100 chars): ‘-path=/dev/hugepages,share=on: unable to map backing store for hugepages: Cannot allocate memoryrnrn” during qemu initialization, check the amount of hugepages on your system:
$ cat /proc/meminfo | grep HugePages
By default the vswitchd is launched with 1Gb of memory, to change this, modify –socket-mem parameter in conf/02_vswitch.conf to allocate an appropriate amount of memory:
DPDK_SOCKET_MEM = ['1024', '0']
VSWITCHD_DPDK_ARGS = ['-c', '0x4', '-n', '4']
VSWITCHD_DPDK_CONFIG = {
'dpdk-init' : 'true',
'dpdk-lcore-mask' : '0x4',
'dpdk-socket-mem' : '1024,0',
}
Note: Option VSWITCHD_DPDK_ARGS is used for vswitchd, which supports --dpdk
parameter. In recent vswitchd versions, option VSWITCHD_DPDK_CONFIG will be
used to configure vswitchd via ovs-vsctl calls.
For more information and details refer to the rest of vSwitchPerfuser documentation.
In general, test scenarios are defined by a deployment used in the particular
test case definition. The chosen deployment scenario will take care of the vSwitch
configuration, deployment of VNFs and it can also affect configuration of a traffic
generator. In order to allow a more flexible way of testcase scripting, VSPERF supports
a detailed step driven testcase definition. It can be used to configure and
program vSwitch, deploy and terminate VNFs, execute a traffic generator,
modify a VSPERF configuration, execute external commands, etc.
Execution of step driven tests is done on a step by step work flow starting with step 0 as defined inside the test case. Each step of the test increments the step number by one which is indicated in the log.
(testcases.integration) - Step 0 'vswitch add_vport ['br0']' start
Test steps are defined as a list of steps within a TestSteps item of test
case definition. Each step is a list with following structure:
'[' [ optional-alias ',' ] test-object ',' test-function [ ',' optional-function-params ] '],'
Step driven tests can be used for both performance and integration testing. In case of integration test, each step in the test case is validated. If a step does not pass validation the test will fail and terminate. The test will continue until a failure is detected or all steps pass. A csv report file is generated after a test completes with an OK or FAIL result.
NOTE: It is possible to suppress validation process of given step by prefixing
it by ! (exclamation mark).
In following example test execution won’t fail if all traffic is dropped:
['!trafficgen', 'send_traffic', {}]
In case of performance test, the validation of steps is not performed and standard output files with results from traffic generator and underlying OS details are generated by vsperf.
Step driven testcases can be used in two different ways:
- # description of full testcase - in this case
cleandeployment is used- to indicate that vsperf should neither configure vSwitch nor deploy any VNF. Test shall perform all required vSwitch configuration and programming and deploy required number of VNFs.
- # modification of existing deployment - in this case, any of supported
- deployments can be used to perform initial vSwitch configuration and deployment of VNFs. Additional actions defined by TestSteps can be used to alter vSwitch configuration or deploy additional VNFs. After the last step is processed, the test execution will continue with traffic execution.
Every test step can call a function of one of the supported test objects. In general
any existing function of supported test object can be called by test step. In case
that step validation is required (valid for integration test steps, which are not
suppressed), then appropriate validate_ method must be implemented.
The list of supported objects and their most common functions is listed below. Please check implementation of test objects for full list of implemented functions and their parameters.
vswitch- provides functions for vSwitch configurationList of supported functions:
add_switch br_name- creates a new switch (bridge) with givenbr_namedel_switch br_name- deletes switch (bridge) with givenbr_nameadd_phy_port br_name- adds a physical port into bridge specified bybr_nameadd_vport br_name- adds a virtual port into bridge specified bybr_namedel_port br_name port_name- removes physical or virtual port specified byport_namefrom bridgebr_nameadd_flow br_name flow- adds flow specified byflowdictionary into the bridgebr_name; Content of flow dictionary will be passed to the vSwitch. In case of Open vSwitch it will be passed to theovs-ofctl add-flowcommand. Please see Open vSwitch documentation for the list of supported flow parameters.del_flow br_name [flow]- deletes flow specified byflowdictionary from bridgebr_name; In case that optional parameterflowis not specified or set to an empty dictionary{}, then all flows from bridgebr_namewill be deleted.dump_flows br_name- dumps all flows from bridge specified bybr_nameenable_stp br_name- enables Spanning Tree Protocol for bridgebr_namedisable_stp br_name- disables Spanning Tree Protocol for bridgebr_nameenable_rstp br_name- enables Rapid Spanning Tree Protocol for bridgebr_namedisable_rstp br_name- disables Rapid Spanning Tree Protocol for bridgebr_namerestart- restarts switch, which is useful for failover testcasesExamples:
['vswitch', 'add_switch', 'int_br0'] ['vswitch', 'del_switch', 'int_br0'] ['vswitch', 'add_phy_port', 'int_br0'] ['vswitch', 'del_port', 'int_br0', '#STEP[2][0]'] ['vswitch', 'add_flow', 'int_br0', {'in_port': '1', 'actions': ['output:2'], 'idle_timeout': '0'}], ['vswitch', 'enable_rstp', 'int_br0']
vnf[ID]- provides functions for deployment and termination of VNFs; Optional alfanumericalIDis used for VNF identification in case that testcase deploys multiple VNFs.List of supported functions:
start- starts a VNF based on VSPERF configurationstop- gracefully terminates given VNFexecute command [delay]- executes command cmd inside VNF; Optional delay defines number of seconds to wait before next step is executed. Method returns command output as a string.execute_and_wait command [timeout] [prompt]- executes command cmd inside VNF; Optional timeout defines number of seconds to wait untilpromptis detected. Optionalpromptdefines a string, which is used as detection of successful command execution. In case that prompt is not defined, then content ofGUEST_PROMPT_LOGINparameter will be used. Method returns command output as a string.Examples:
['vnf1', 'start'], ['vnf2', 'start'], ['vnf1', 'execute_and_wait', 'ifconfig eth0 5.5.5.1/24 up'], ['vnf2', 'execute_and_wait', 'ifconfig eth0 5.5.5.2/24 up', 120, 'root.*#'], ['vnf2', 'execute_and_wait', 'ping -c1 5.5.5.1'], ['vnf2', 'stop'], ['vnf1', 'stop'],
VNF[ID]- provides access to VNFs deployed automatically by testcase deployment scenario. For Examplepvvpdeployment automatically starts two VNFs before any TestStep is executed. It is possible to access these VNFs by VNF0 and VNF1 labels.List of supported functions is identical to
vnf[ID]option above except functionsstartandstop.Examples:
['VNF0', 'execute_and_wait', 'ifconfig eth2 5.5.5.1/24 up'], ['VNF1', 'execute_and_wait', 'ifconfig eth2 5.5.5.2/24 up', 120, 'root.*#'], ['VNF2', 'execute_and_wait', 'ping -c1 5.5.5.1'],
trafficgen- triggers traffic generationList of supported functions:
send_traffic traffic- starts a traffic based on the vsperf configuration and giventrafficdictionary. More details abouttrafficdictionary and its possible values are available at Traffic Generator Integration Guideget_results- returns dictionary with results collected from previous execution ofsend_trafficExamples:
['trafficgen', 'send_traffic', {'traffic_type' : 'rfc2544_throughput'}] ['trafficgen', 'send_traffic', {'traffic_type' : 'rfc2544_back2back', 'bidir' : 'True'}], ['trafficgen', 'get_results'], ['tools', 'assert', '#STEP[-1][0]["frame_loss_percent"] < 0.05'],
settings- reads or modifies VSPERF configurationList of supported functions:
getValue param- returns value of givenparamsetValue param value- sets value ofparamto givenvalueresetValue param- ifparamwas overridden byTEST_PARAMS(e.g. by “Parameters” section of the test case definition), then it will be set to its original value.Examples:
['settings', 'getValue', 'TOOLS'] ['settings', 'setValue', 'GUEST_USERNAME', ['root']] ['settings', 'resetValue', 'WHITELIST_NICS'],It is possible and more convenient to access any VSPERF configuration option directly via
$NAMEnotation. Option evaluation is done during runtime and vsperf will automatically translate it to the appropriate call ofsettings.getValue. If the referred parameter does not exist, then vsperf will keep$NAMEstring untouched and it will continue with testcase execution. The reason is to avoid test execution failure in case that$sign has been used from different reason than vsperf parameter evaluation.NOTE: It is recommended to use
${NAME}notation for any shell parameters used withinExec_Shellcall to avoid a clash with configuration parameter evaluation.NOTE: It is possible to refer to vsperf parameter value by
#PARAM()macro (see Overriding values defined in configuration files. However#PARAM()macro is evaluated at the beginning of vsperf execution and it will not reflect any changes made to the vsperf configuration during runtime. On the other hand$NAMEnotation is evaluated during test execution and thus it contains any modifications to the configuration parameter made by vsperf (e.g.TOOLSandNICSdictionaries) or by testcase definition (e.g.TRAFFICdictionary).Examples:
['tools', 'exec_shell', "$TOOLS['ovs-vsctl'] show"] ['settings', 'setValue', 'TRAFFICGEN_IXIA_PORT2', '$TRAFFICGEN_IXIA_PORT1'], ['vswitch', 'add_flow', 'int_br0', {'in_port': '#STEP[1][1]', 'dl_type': '0x800', 'nw_proto': '17', 'nw_dst': '$TRAFFIC["l3"]["dstip"]/8', 'actions': ['output:#STEP[2][1]'] } ]
namespace- creates or modifies network namespacesList of supported functions:
create_namespace name- creates new namespace with givennamedelete_namespace name- deletes namespace specified by itsnameassign_port_to_namespace port name [port_up]- assigns NIC specified byportinto given namespacename; If optional parameterport_upis set toTrue, then port will be brought up.add_ip_to_namespace_eth port name addr cidr- assigns an IP addressaddr/cidrto the NIC specified byportwithin namespacenamereset_port_to_root port name- returns givenportfrom namespacenameback to the root namespaceExamples:
['namespace', 'create_namespace', 'testns'] ['namespace', 'assign_port_to_namespace', 'eth0', 'testns']
veth- manipulates with eth and veth devicesList of supported functions:
add_veth_port port peer_port- adds a pair of veth ports namedportandpeer_portdel_veth_port port peer_port- deletes a veth port pair specified byportandpeer_portbring_up_eth_port eth_port [namespace]- brings upeth_portin (optional)namespaceExamples:
['veth', 'add_veth_port', 'veth', 'veth1'] ['veth', 'bring_up_eth_port', 'eth1']
tools- provides a set of helper functionsList of supported functions:
Assert condition- evaluates givenconditionand raisesAssertionErrorin case that condition is notTrueEval expression- evaluates given expression as a python code and returns its resultExec_Shell command- executes a shell command and wait until it finishesExec_Shell_Background command- executes a shell command at background; Command will be automatically terminated at the end of testcase execution.Exec_Python code- executes a python codeExamples:
['tools', 'exec_shell', 'numactl -H', 'available: ([0-9]+)'] ['tools', 'assert', '#STEP[-1][0]>1']
wait- is used for test case interruption. This object doesn’t have any functions. Once reached, vsperf will pause test execution and waits for press ofEnter key. It can be used during testcase design for debugging purposes.Examples:
['wait']
sleep- is used to pause testcase execution for defined number of seconds.Examples:
['sleep', '60']
log level message- is used to logmessageof givenlevelinto vsperf output. Level is one of info, debug, warning or error.Examples:
['log', 'error', 'tools $TOOLS']
pdb- executes python debuggerExamples:
['pdb']
Test profiles can include macros as part of the test step. Each step in the profile may return a value such as a port name. Recall macros use #STEP to indicate the recalled value inside the return structure. If the method the test step calls returns a value it can be later recalled, for example:
{
"Name": "vswitch_add_del_vport",
"Deployment": "clean",
"Description": "vSwitch - add and delete virtual port",
"TestSteps": [
['vswitch', 'add_switch', 'int_br0'], # STEP 0
['vswitch', 'add_vport', 'int_br0'], # STEP 1
['vswitch', 'del_port', 'int_br0', '#STEP[1][0]'], # STEP 2
['vswitch', 'del_switch', 'int_br0'], # STEP 3
]
}
This test profile uses the vswitch add_vport method which returns a string value of the port added. This is later called by the del_port method using the name from step 1.
It is also possible to use negative indexes in step macros. In that case
#STEP[-1] will refer to the result from previous step, #STEP[-2]
will refer to result of step called before previous step, etc. It means,
that you could change STEP 2 from previous example to achieve the same
functionality:
['vswitch', 'del_port', 'int_br0', '#STEP[-1][0]'], # STEP 2
Another option to refer to previous values, is to define an alias for given step by its first argument with ‘#’ prefix. Alias must be unique and it can’t be a number. Example of step alias usage:
['#port1', 'vswitch', 'add_vport', 'int_br0'],
['vswitch', 'del_port', 'int_br0', '#STEP[port1][0]'],
Also commonly used steps can be created as a separate profile.
STEP_VSWITCH_PVP_INIT = [
['vswitch', 'add_switch', 'int_br0'], # STEP 0
['vswitch', 'add_phy_port', 'int_br0'], # STEP 1
['vswitch', 'add_phy_port', 'int_br0'], # STEP 2
['vswitch', 'add_vport', 'int_br0'], # STEP 3
['vswitch', 'add_vport', 'int_br0'], # STEP 4
]
This profile can then be used inside other testcases
{
"Name": "vswitch_pvp",
"Deployment": "clean",
"Description": "vSwitch - configure switch and one vnf",
"TestSteps": STEP_VSWITCH_PVP_INIT +
[
['vnf', 'start'],
['vnf', 'stop'],
] +
STEP_VSWITCH_PVP_FINIT
}
It is possible to refer to vsperf configuration parameters within step macros. Please see step-driven-tests-variable-usage for more details.
In case that step returns a string or list of strings, then it is possible to
filter such output by regular expression. This optional filter can be specified
as a last step parameter with prefix ‘|’. Output will be split into separate lines
and only matching records will be returned. It is also possible to return a specified
group of characters from the matching lines, e.g. by regex |ID (\d+).
Examples:
['tools', 'exec_shell', "sudo $TOOLS['ovs-appctl'] dpif-netdev/pmd-rxq-show",
'|dpdkvhostuser0\s+queue-id: \d'],
['tools', 'assert', 'len(#STEP[-1])==1'],
['vnf', 'execute_and_wait', 'ethtool -L eth0 combined 2'],
['vnf', 'execute_and_wait', 'ethtool -l eth0', '|Combined:\s+2'],
['tools', 'assert', 'len(#STEP[-1])==2']
The following examples are for demonstration purposes. You can run them by copying and pasting into the conf/integration/01_testcases.conf file. A command-line instruction is shown at the end of each example.
The first example is a HelloWorld testcase. It simply creates a bridge with 2 physical ports, then sets up a flow to drop incoming packets from the port that was instantiated at the STEP #1. There’s no interaction with the traffic generator. Then the flow, the 2 ports and the bridge are deleted. ‘add_phy_port’ method creates a ‘dpdk’ type interface that will manage the physical port. The string value returned is the port name that will be referred by ‘del_port’ later on.
{
"Name": "HelloWorld",
"Description": "My first testcase",
"Deployment": "clean",
"TestSteps": [
['vswitch', 'add_switch', 'int_br0'], # STEP 0
['vswitch', 'add_phy_port', 'int_br0'], # STEP 1
['vswitch', 'add_phy_port', 'int_br0'], # STEP 2
['vswitch', 'add_flow', 'int_br0', {'in_port': '#STEP[1][1]', \
'actions': ['drop'], 'idle_timeout': '0'}],
['vswitch', 'del_flow', 'int_br0'],
['vswitch', 'del_port', 'int_br0', '#STEP[1][0]'],
['vswitch', 'del_port', 'int_br0', '#STEP[2][0]'],
['vswitch', 'del_switch', 'int_br0'],
]
},
To run HelloWorld test:
./vsperf --conf-file user_settings.py --integration HelloWorld
The next example shows how to explicitly set up a flow by specifying a destination IP address. All packets received from the port created at STEP #1 that have a destination IP address = 90.90.90.90 will be forwarded to the port created at the STEP #2.
{
"Name": "p2p_rule_l3da",
"Description": "Phy2Phy with rule on L3 Dest Addr",
"Deployment": "clean",
"biDirectional": "False",
"TestSteps": [
['vswitch', 'add_switch', 'int_br0'], # STEP 0
['vswitch', 'add_phy_port', 'int_br0'], # STEP 1
['vswitch', 'add_phy_port', 'int_br0'], # STEP 2
['vswitch', 'add_flow', 'int_br0', {'in_port': '#STEP[1][1]', \
'dl_type': '0x0800', 'nw_dst': '90.90.90.90', \
'actions': ['output:#STEP[2][1]'], 'idle_timeout': '0'}],
['trafficgen', 'send_traffic', \
{'traffic_type' : 'rfc2544_continuous'}],
['vswitch', 'dump_flows', 'int_br0'], # STEP 5
['vswitch', 'del_flow', 'int_br0'], # STEP 7 == del-flows
['vswitch', 'del_port', 'int_br0', '#STEP[1][0]'],
['vswitch', 'del_port', 'int_br0', '#STEP[2][0]'],
['vswitch', 'del_switch', 'int_br0'],
]
},
To run the test:
./vsperf --conf-file user_settings.py --integration p2p_rule_l3da
The next testcase uses the multistream feature. The traffic generator will send packets with different UDP ports. That is accomplished by using “Stream Type” and “MultiStream” keywords. 4 different flows are set to forward all incoming packets.
{
"Name": "multistream_l4",
"Description": "Multistream on UDP ports",
"Deployment": "clean",
"Parameters": {
'TRAFFIC' : {
"multistream": 4,
"stream_type": "L4",
},
},
"TestSteps": [
['vswitch', 'add_switch', 'int_br0'], # STEP 0
['vswitch', 'add_phy_port', 'int_br0'], # STEP 1
['vswitch', 'add_phy_port', 'int_br0'], # STEP 2
# Setup Flows
['vswitch', 'add_flow', 'int_br0', {'in_port': '#STEP[1][1]', \
'dl_type': '0x0800', 'nw_proto': '17', 'udp_dst': '0', \
'actions': ['output:#STEP[2][1]'], 'idle_timeout': '0'}],
['vswitch', 'add_flow', 'int_br0', {'in_port': '#STEP[1][1]', \
'dl_type': '0x0800', 'nw_proto': '17', 'udp_dst': '1', \
'actions': ['output:#STEP[2][1]'], 'idle_timeout': '0'}],
['vswitch', 'add_flow', 'int_br0', {'in_port': '#STEP[1][1]', \
'dl_type': '0x0800', 'nw_proto': '17', 'udp_dst': '2', \
'actions': ['output:#STEP[2][1]'], 'idle_timeout': '0'}],
['vswitch', 'add_flow', 'int_br0', {'in_port': '#STEP[1][1]', \
'dl_type': '0x0800', 'nw_proto': '17', 'udp_dst': '3', \
'actions': ['output:#STEP[2][1]'], 'idle_timeout': '0'}],
# Send mono-dir traffic
['trafficgen', 'send_traffic', \
{'traffic_type' : 'rfc2544_continuous', \
'bidir' : 'False'}],
# Clean up
['vswitch', 'del_flow', 'int_br0'],
['vswitch', 'del_port', 'int_br0', '#STEP[1][0]'],
['vswitch', 'del_port', 'int_br0', '#STEP[2][0]'],
['vswitch', 'del_switch', 'int_br0'],
]
},
To run the test:
./vsperf --conf-file user_settings.py --integration multistream_l4
This example launches a 1st VM in a PVP topology, then the VM is replaced by another VM. When VNF setup parameter in ./conf/04_vnf.conf is “QemuDpdkVhostUser” ‘add_vport’ method creates a ‘dpdkvhostuser’ type port to connect a VM.
{
"Name": "ex_replace_vm",
"Description": "PVP with VM replacement",
"Deployment": "clean",
"TestSteps": [
['vswitch', 'add_switch', 'int_br0'], # STEP 0
['vswitch', 'add_phy_port', 'int_br0'], # STEP 1
['vswitch', 'add_phy_port', 'int_br0'], # STEP 2
['vswitch', 'add_vport', 'int_br0'], # STEP 3 vm1
['vswitch', 'add_vport', 'int_br0'], # STEP 4
# Setup Flows
['vswitch', 'add_flow', 'int_br0', {'in_port': '#STEP[1][1]', \
'actions': ['output:#STEP[3][1]'], 'idle_timeout': '0'}],
['vswitch', 'add_flow', 'int_br0', {'in_port': '#STEP[4][1]', \
'actions': ['output:#STEP[2][1]'], 'idle_timeout': '0'}],
['vswitch', 'add_flow', 'int_br0', {'in_port': '#STEP[2][1]', \
'actions': ['output:#STEP[4][1]'], 'idle_timeout': '0'}],
['vswitch', 'add_flow', 'int_br0', {'in_port': '#STEP[3][1]', \
'actions': ['output:#STEP[1][1]'], 'idle_timeout': '0'}],
# Start VM 1
['vnf1', 'start'],
# Now we want to replace VM 1 with another VM
['vnf1', 'stop'],
['vswitch', 'add_vport', 'int_br0'], # STEP 11 vm2
['vswitch', 'add_vport', 'int_br0'], # STEP 12
['vswitch', 'del_flow', 'int_br0'],
['vswitch', 'add_flow', 'int_br0', {'in_port': '#STEP[1][1]', \
'actions': ['output:#STEP[11][1]'], 'idle_timeout': '0'}],
['vswitch', 'add_flow', 'int_br0', {'in_port': '#STEP[12][1]', \
'actions': ['output:#STEP[2][1]'], 'idle_timeout': '0'}],
# Start VM 2
['vnf2', 'start'],
['vnf2', 'stop'],
['vswitch', 'dump_flows', 'int_br0'],
# Clean up
['vswitch', 'del_flow', 'int_br0'],
['vswitch', 'del_port', 'int_br0', '#STEP[1][0]'],
['vswitch', 'del_port', 'int_br0', '#STEP[2][0]'],
['vswitch', 'del_port', 'int_br0', '#STEP[3][0]'], # vm1
['vswitch', 'del_port', 'int_br0', '#STEP[4][0]'],
['vswitch', 'del_port', 'int_br0', '#STEP[11][0]'], # vm2
['vswitch', 'del_port', 'int_br0', '#STEP[12][0]'],
['vswitch', 'del_switch', 'int_br0'],
]
},
To run the test:
./vsperf --conf-file user_settings.py --integration ex_replace_vm
This example setups a PVP topology and routes traffic to the VM based on
the destination IP address. A command-line parameter is used to select a Linux
bridge as a guest loopback application. It is also possible to select a guest
loopback application by a configuration option GUEST_LOOPBACK.
{
"Name": "ex_pvp_rule_l3da",
"Description": "PVP with flow on L3 Dest Addr",
"Deployment": "clean",
"TestSteps": [
['vswitch', 'add_switch', 'int_br0'], # STEP 0
['vswitch', 'add_phy_port', 'int_br0'], # STEP 1
['vswitch', 'add_phy_port', 'int_br0'], # STEP 2
['vswitch', 'add_vport', 'int_br0'], # STEP 3 vm1
['vswitch', 'add_vport', 'int_br0'], # STEP 4
# Setup Flows
['vswitch', 'add_flow', 'int_br0', {'in_port': '#STEP[1][1]', \
'dl_type': '0x0800', 'nw_dst': '90.90.90.90', \
'actions': ['output:#STEP[3][1]'], 'idle_timeout': '0'}],
# Each pkt from the VM is forwarded to the 2nd dpdk port
['vswitch', 'add_flow', 'int_br0', {'in_port': '#STEP[4][1]', \
'actions': ['output:#STEP[2][1]'], 'idle_timeout': '0'}],
# Start VMs
['vnf1', 'start'],
['trafficgen', 'send_traffic', \
{'traffic_type' : 'rfc2544_continuous', \
'bidir' : 'False'}],
['vnf1', 'stop'],
# Clean up
['vswitch', 'dump_flows', 'int_br0'], # STEP 10
['vswitch', 'del_flow', 'int_br0'], # STEP 11
['vswitch', 'del_port', 'int_br0', '#STEP[1][0]'],
['vswitch', 'del_port', 'int_br0', '#STEP[2][0]'],
['vswitch', 'del_port', 'int_br0', '#STEP[3][0]'], # vm1 ports
['vswitch', 'del_port', 'int_br0', '#STEP[4][0]'],
['vswitch', 'del_switch', 'int_br0'],
]
},
To run the test:
./vsperf --conf-file user_settings.py --test-params \ "GUEST_LOOPBACK=['linux_bridge']" --integration ex_pvp_rule_l3da
This examples launches 2 VMs connected in parallel. Incoming packets will be forwarded to one specific VM depending on the destination UDP port.
{
"Name": "ex_2pvp_rule_l4dp",
"Description": "2 PVP with flows on L4 Dest Port",
"Deployment": "clean",
"Parameters": {
'TRAFFIC' : {
"multistream": 2,
"stream_type": "L4",
},
},
"TestSteps": [
['vswitch', 'add_switch', 'int_br0'], # STEP 0
['vswitch', 'add_phy_port', 'int_br0'], # STEP 1
['vswitch', 'add_phy_port', 'int_br0'], # STEP 2
['vswitch', 'add_vport', 'int_br0'], # STEP 3 vm1
['vswitch', 'add_vport', 'int_br0'], # STEP 4
['vswitch', 'add_vport', 'int_br0'], # STEP 5 vm2
['vswitch', 'add_vport', 'int_br0'], # STEP 6
# Setup Flows to reply ICMPv6 and similar packets, so to
# avoid flooding internal port with their re-transmissions
['vswitch', 'add_flow', 'int_br0', \
{'priority': '1', 'dl_src': '00:00:00:00:00:01', \
'actions': ['output:#STEP[3][1]'], 'idle_timeout': '0'}],
['vswitch', 'add_flow', 'int_br0', \
{'priority': '1', 'dl_src': '00:00:00:00:00:02', \
'actions': ['output:#STEP[4][1]'], 'idle_timeout': '0'}],
['vswitch', 'add_flow', 'int_br0', \
{'priority': '1', 'dl_src': '00:00:00:00:00:03', \
'actions': ['output:#STEP[5][1]'], 'idle_timeout': '0'}],
['vswitch', 'add_flow', 'int_br0', \
{'priority': '1', 'dl_src': '00:00:00:00:00:04', \
'actions': ['output:#STEP[6][1]'], 'idle_timeout': '0'}],
# Forward UDP packets depending on dest port
['vswitch', 'add_flow', 'int_br0', {'in_port': '#STEP[1][1]', \
'dl_type': '0x0800', 'nw_proto': '17', 'udp_dst': '0', \
'actions': ['output:#STEP[3][1]'], 'idle_timeout': '0'}],
['vswitch', 'add_flow', 'int_br0', {'in_port': '#STEP[1][1]', \
'dl_type': '0x0800', 'nw_proto': '17', 'udp_dst': '1', \
'actions': ['output:#STEP[5][1]'], 'idle_timeout': '0'}],
# Send VM output to phy port #2
['vswitch', 'add_flow', 'int_br0', {'in_port': '#STEP[4][1]', \
'actions': ['output:#STEP[2][1]'], 'idle_timeout': '0'}],
['vswitch', 'add_flow', 'int_br0', {'in_port': '#STEP[6][1]', \
'actions': ['output:#STEP[2][1]'], 'idle_timeout': '0'}],
# Start VMs
['vnf1', 'start'], # STEP 16
['vnf2', 'start'], # STEP 17
['trafficgen', 'send_traffic', \
{'traffic_type' : 'rfc2544_continuous', \
'bidir' : 'False'}],
['vnf1', 'stop'],
['vnf2', 'stop'],
['vswitch', 'dump_flows', 'int_br0'],
# Clean up
['vswitch', 'del_flow', 'int_br0'],
['vswitch', 'del_port', 'int_br0', '#STEP[1][0]'],
['vswitch', 'del_port', 'int_br0', '#STEP[2][0]'],
['vswitch', 'del_port', 'int_br0', '#STEP[3][0]'], # vm1 ports
['vswitch', 'del_port', 'int_br0', '#STEP[4][0]'],
['vswitch', 'del_port', 'int_br0', '#STEP[5][0]'], # vm2 ports
['vswitch', 'del_port', 'int_br0', '#STEP[6][0]'],
['vswitch', 'del_switch', 'int_br0'],
]
},
The same test can be written in a shorter form using “Deployment” : “pvpv”.
To run the test:
./vsperf --conf-file user_settings.py --integration ex_2pvp_rule_l4dp
This is an example of modification of a standard deployment scenario with additional TestSteps. Standard PVVP scenario is used to configure a vSwitch and to deploy two VNFs connected in series. Additional TestSteps will deploy a 3rd VNF and connect it in parallel to already configured VNFs. Traffic generator is instructed (by Multistream feature) to send two separate traffic streams. One stream will be sent to the standalone VNF and second to two chained VNFs.
In case, that test is defined as a performance test, then traffic results will be collected and available in both csv and rst report files.
{
"Name": "pvvp_pvp_cont",
"Deployment": "pvvp",
"Description": "PVVP and PVP in parallel with Continuous Stream",
"Parameters" : {
"TRAFFIC" : {
"traffic_type" : "rfc2544_continuous",
"multistream": 2,
},
},
"TestSteps": [
['vswitch', 'add_vport', '$VSWITCH_BRIDGE_NAME'],
['vswitch', 'add_vport', '$VSWITCH_BRIDGE_NAME'],
# priority must be higher than default 32768, otherwise flows won't match
['vswitch', 'add_flow', '$VSWITCH_BRIDGE_NAME',
{'in_port': '1', 'actions': ['output:#STEP[-2][1]'], 'idle_timeout': '0', 'dl_type':'0x0800',
'nw_proto':'17', 'tp_dst':'0', 'priority': '33000'}],
['vswitch', 'add_flow', '$VSWITCH_BRIDGE_NAME',
{'in_port': '2', 'actions': ['output:#STEP[-2][1]'], 'idle_timeout': '0', 'dl_type':'0x0800',
'nw_proto':'17', 'tp_dst':'0', 'priority': '33000'}],
['vswitch', 'add_flow', '$VSWITCH_BRIDGE_NAME', {'in_port': '#STEP[-4][1]', 'actions': ['output:1'],
'idle_timeout': '0'}],
['vswitch', 'add_flow', '$VSWITCH_BRIDGE_NAME', {'in_port': '#STEP[-4][1]', 'actions': ['output:2'],
'idle_timeout': '0'}],
['vswitch', 'dump_flows', '$VSWITCH_BRIDGE_NAME'],
['vnf1', 'start'],
]
},
To run the test:
./vsperf --conf-file user_settings.py pvvp_pvp_cont
VSPERF includes a set of integration tests defined in conf/integration. These tests can be run by specifying –integration as a parameter to vsperf. Current tests in conf/integration include switch functionality and Overlay tests.
Tests in the conf/integration can be used to test scaling of different switch configurations by adding steps into the test case.
For the overlay tests VSPERF supports VXLAN, GRE and GENEVE tunneling protocols. Testing of these protocols is limited to unidirectional traffic and P2P (Physical to Physical scenarios).
NOTE: The configuration for overlay tests provided in this guide is for unidirectional traffic only.
NOTE: The overlay tests require an IxNet traffic generator. The tunneled traffic
is configured by ixnetrfc2544v2.tcl script. This script can be used
with all supported deployment scenarios for generation of frames with VXLAN, GRE
or GENEVE protocols. In that case options “Tunnel Operation” and
“TRAFFICGEN_IXNET_TCL_SCRIPT” must be properly configured at testcase definition.
To execute integration tests VSPERF is run with the integration parameter. To view the current test list simply execute the following command:
./vsperf --integration --list
The standard tests included are defined inside the
conf/integration/01_testcases.conf file.
The VXLAN OVS DPDK encapsulation tests requires IPs, MAC addresses, bridge names and WHITELIST_NICS for DPDK.
NOTE: Only Ixia traffic generators currently support the execution of the tunnel encapsulation tests. Support for other traffic generators may come in a future release.
Default values are already provided. To customize for your environment, override the following variables in you user_settings.py file:
# Variables defined in conf/integration/02_vswitch.conf # Tunnel endpoint for Overlay P2P deployment scenario # used for br0 VTEP_IP1 = '192.168.0.1/24' # Used as remote_ip in adding OVS tunnel port and # to set ARP entry in OVS (e.g. tnl/arp/set br-ext 192.168.240.10 02:00:00:00:00:02 VTEP_IP2 = '192.168.240.10' # Network to use when adding a route for inner frame data VTEP_IP2_SUBNET = '192.168.240.0/24' # Bridge names TUNNEL_INTEGRATION_BRIDGE = 'vsperf-br0' TUNNEL_EXTERNAL_BRIDGE = 'vsperf-br-ext' # IP of br-ext TUNNEL_EXTERNAL_BRIDGE_IP = '192.168.240.1/24' # vxlan|gre|geneve TUNNEL_TYPE = 'vxlan' # Variables defined conf/integration/03_traffic.conf # For OP2P deployment scenario TRAFFICGEN_PORT1_MAC = '02:00:00:00:00:01' TRAFFICGEN_PORT2_MAC = '02:00:00:00:00:02' TRAFFICGEN_PORT1_IP = '1.1.1.1' TRAFFICGEN_PORT2_IP = '192.168.240.10'
To run VXLAN encapsulation tests:
./vsperf --conf-file user_settings.py --integration \ --test-params 'TUNNEL_TYPE=vxlan' overlay_p2p_tput
To run GRE encapsulation tests:
./vsperf --conf-file user_settings.py --integration \ --test-params 'TUNNEL_TYPE=gre' overlay_p2p_tput
To run GENEVE encapsulation tests:
./vsperf --conf-file user_settings.py --integration \ --test-params 'TUNNEL_TYPE=geneve' overlay_p2p_tput
To run OVS NATIVE tunnel tests (VXLAN/GRE/GENEVE):
cd src/ovs/ovs sudo -E make modules_install
VSWITCH = 'OvsVanilla' # Specify vport_* kernel module to test. PATHS['vswitch']['OvsVanilla']['src']['modules'] = [ 'vport_vxlan', 'vport_gre', 'vport_geneve', 'datapath/linux/openvswitch.ko', ]NOTE: In case, that Vanilla OVS is installed from binary package, then please set
PATHS['vswitch']['OvsVanilla']['bin']['modules']instead.
./vsperf --conf-file user_settings.py --integration \ --test-params 'TUNNEL_TYPE=vxlan' overlay_p2p_tput
To run VXLAN decapsulation tests:
./vsperf --conf-file user_settings.py --integration overlay_p2p_decap_cont
If you want to use different values for your VXLAN frame, you may set:
VXLAN_FRAME_L3 = {'proto': 'udp', 'packetsize': 64, 'srcip': TRAFFICGEN_PORT1_IP, 'dstip': '192.168.240.1', } VXLAN_FRAME_L4 = {'srcport': 4789, 'dstport': 4789, 'vni': VXLAN_VNI, 'inner_srcmac': '01:02:03:04:05:06', 'inner_dstmac': '06:05:04:03:02:01', 'inner_srcip': '192.168.0.10', 'inner_dstip': '192.168.240.9', 'inner_proto': 'udp', 'inner_srcport': 3000, 'inner_dstport': 3001, }
To run GRE decapsulation tests:
./vsperf --conf-file user_settings.py --test-params 'TUNNEL_TYPE=gre' \ --integration overlay_p2p_decap_cont
If you want to use different values for your GRE frame, you may set:
GRE_FRAME_L3 = {'proto': 'gre', 'packetsize': 64, 'srcip': TRAFFICGEN_PORT1_IP, 'dstip': '192.168.240.1', } GRE_FRAME_L4 = {'srcport': 0, 'dstport': 0 'inner_srcmac': '01:02:03:04:05:06', 'inner_dstmac': '06:05:04:03:02:01', 'inner_srcip': '192.168.0.10', 'inner_dstip': '192.168.240.9', 'inner_proto': 'udp', 'inner_srcport': 3000, 'inner_dstport': 3001, }
IxNet 7.3X does not have native support of GENEVE protocol. The template, GeneveIxNetTemplate.xml_ClearText.xml, should be imported into IxNET for this testcase to work.
To import the template do:
3rd_party/ixia/GeneveIxNetTemplate.xml_ClearText.xml
and click import.To run GENEVE decapsulation tests:
./vsperf --conf-file user_settings.py --test-params 'tunnel_type=geneve' \ --integration overlay_p2p_decap_cont
If you want to use different values for your GENEVE frame, you may set:
GENEVE_FRAME_L3 = {'proto': 'udp', 'packetsize': 64, 'srcip': TRAFFICGEN_PORT1_IP, 'dstip': '192.168.240.1', } GENEVE_FRAME_L4 = {'srcport': 6081, 'dstport': 6081, 'geneve_vni': 0, 'inner_srcmac': '01:02:03:04:05:06', 'inner_dstmac': '06:05:04:03:02:01', 'inner_srcip': '192.168.0.10', 'inner_dstip': '192.168.240.9', 'inner_proto': 'udp', 'inner_srcport': 3000, 'inner_dstport': 3001, }
To run VXLAN decapsulation tests:
PATHS['vswitch']['OvsVanilla']['src']['modules'] = [ 'vport_vxlan', 'datapath/linux/openvswitch.ko', ] TRAFFICGEN_PORT1_IP = '172.16.1.2' TRAFFICGEN_PORT2_IP = '192.168.1.11' VTEP_IP1 = '172.16.1.2/24' VTEP_IP2 = '192.168.1.1' VTEP_IP2_SUBNET = '192.168.1.0/24' TUNNEL_EXTERNAL_BRIDGE_IP = '172.16.1.1/24' TUNNEL_INT_BRIDGE_IP = '192.168.1.1' VXLAN_FRAME_L2 = {'srcmac': '01:02:03:04:05:06', 'dstmac': '06:05:04:03:02:01', } VXLAN_FRAME_L3 = {'proto': 'udp', 'packetsize': 64, 'srcip': TRAFFICGEN_PORT1_IP, 'dstip': '172.16.1.1', } VXLAN_FRAME_L4 = { 'srcport': 4789, 'dstport': 4789, 'protocolpad': 'true', 'vni': 99, 'inner_srcmac': '01:02:03:04:05:06', 'inner_dstmac': '06:05:04:03:02:01', 'inner_srcip': '192.168.1.2', 'inner_dstip': TRAFFICGEN_PORT2_IP, 'inner_proto': 'udp', 'inner_srcport': 3000, 'inner_dstport': 3001, }NOTE: In case, that Vanilla OVS is installed from binary package, then please set
PATHS['vswitch']['OvsVanilla']['bin']['modules']instead.
./vsperf --conf-file user_settings.py --integration \ --test-params 'tunnel_type=vxlan' overlay_p2p_decap_cont
To run GRE decapsulation tests:
PATHS['vswitch']['OvsVanilla']['src']['modules'] = [ 'vport_gre', 'datapath/linux/openvswitch.ko', ] TRAFFICGEN_PORT1_IP = '172.16.1.2' TRAFFICGEN_PORT2_IP = '192.168.1.11' VTEP_IP1 = '172.16.1.2/24' VTEP_IP2 = '192.168.1.1' VTEP_IP2_SUBNET = '192.168.1.0/24' TUNNEL_EXTERNAL_BRIDGE_IP = '172.16.1.1/24' TUNNEL_INT_BRIDGE_IP = '192.168.1.1' GRE_FRAME_L2 = {'srcmac': '01:02:03:04:05:06', 'dstmac': '06:05:04:03:02:01', } GRE_FRAME_L3 = {'proto': 'udp', 'packetsize': 64, 'srcip': TRAFFICGEN_PORT1_IP, 'dstip': '172.16.1.1', } GRE_FRAME_L4 = { 'srcport': 4789, 'dstport': 4789, 'protocolpad': 'true', 'inner_srcmac': '01:02:03:04:05:06', 'inner_dstmac': '06:05:04:03:02:01', 'inner_srcip': '192.168.1.2', 'inner_dstip': TRAFFICGEN_PORT2_IP, 'inner_proto': 'udp', 'inner_srcport': 3000, 'inner_dstport': 3001, }NOTE: In case, that Vanilla OVS is installed from binary package, then please set
PATHS['vswitch']['OvsVanilla']['bin']['modules']instead.
./vsperf --conf-file user_settings.py --integration \ --test-params 'tunnel_type=gre' overlay_p2p_decap_cont
To run GENEVE decapsulation tests:
PATHS['vswitch']['OvsVanilla']['src']['modules'] = [ 'vport_geneve', 'datapath/linux/openvswitch.ko', ] TRAFFICGEN_PORT1_IP = '172.16.1.2' TRAFFICGEN_PORT2_IP = '192.168.1.11' VTEP_IP1 = '172.16.1.2/24' VTEP_IP2 = '192.168.1.1' VTEP_IP2_SUBNET = '192.168.1.0/24' TUNNEL_EXTERNAL_BRIDGE_IP = '172.16.1.1/24' TUNNEL_INT_BRIDGE_IP = '192.168.1.1' GENEVE_FRAME_L2 = {'srcmac': '01:02:03:04:05:06', 'dstmac': '06:05:04:03:02:01', } GENEVE_FRAME_L3 = {'proto': 'udp', 'packetsize': 64, 'srcip': TRAFFICGEN_PORT1_IP, 'dstip': '172.16.1.1', } GENEVE_FRAME_L4 = {'srcport': 6081, 'dstport': 6081, 'protocolpad': 'true', 'geneve_vni': 0, 'inner_srcmac': '01:02:03:04:05:06', 'inner_dstmac': '06:05:04:03:02:01', 'inner_srcip': '192.168.1.2', 'inner_dstip': TRAFFICGEN_PORT2_IP, 'inner_proto': 'udp', 'inner_srcport': 3000, 'inner_dstport': 3001, }NOTE: In case, that Vanilla OVS is installed from binary package, then please set
PATHS['vswitch']['OvsVanilla']['bin']['modules']instead.
./vsperf --conf-file user_settings.py --integration \ --test-params 'tunnel_type=geneve' overlay_p2p_decap_cont
The OVS DPDK encapsulation/decapsulation tests requires IPs, MAC addresses, bridge names and WHITELIST_NICS for DPDK.
The test cases can test the tunneling encap and decap without using any ingress overlay traffic as compared to above test cases. To achieve this the OVS is configured to perform encap and decap in a series on the same traffic stream as given below.
TRAFFIC-IN –> [ENCAP] –> [MOD-PKT] –> [DECAP] –> TRAFFIC-OUT
Default values are already provided. To customize for your environment, override the following variables in you user_settings.py file:
# Variables defined in conf/integration/02_vswitch.conf # Bridge names TUNNEL_EXTERNAL_BRIDGE1 = 'br-phy1' TUNNEL_EXTERNAL_BRIDGE2 = 'br-phy2' TUNNEL_MODIFY_BRIDGE1 = 'br-mod1' TUNNEL_MODIFY_BRIDGE2 = 'br-mod2' # IP of br-mod1 TUNNEL_MODIFY_BRIDGE_IP1 = '10.0.0.1/24' # Mac of br-mod1 TUNNEL_MODIFY_BRIDGE_MAC1 = '00:00:10:00:00:01' # IP of br-mod2 TUNNEL_MODIFY_BRIDGE_IP2 = '20.0.0.1/24' #Mac of br-mod2 TUNNEL_MODIFY_BRIDGE_MAC2 = '00:00:20:00:00:01' # vxlan|gre|geneve, Only VXLAN is supported for now. TUNNEL_TYPE = 'vxlan'
To run VXLAN encapsulation+decapsulation tests:
./vsperf --conf-file user_settings.py --integration \ overlay_p2p_mod_tput
Yardstick is a generic framework for a test execution, which is used for validation of installation of OPNFV platform. In the future, Yardstick will support two options of vswitchperf testcase execution:
In Colorado release only the traffic generator mode is supported.
In order to run Yardstick testcases, you will need to prepare your test environment. Please follow the installation instructions to install the yardstick.
Please note, that yardstick uses OpenStack for execution of testcases. OpenStack must be installed with Heat and Neutron services. Otherwise vswitchperf testcases cannot be executed.
A special VM image is required for execution of vswitchperf specific testcases by yardstick. It is possible to use a sample VM image available at OPNFV artifactory or to build customized image.
Sample VM image is available at vswitchperf section of OPNFV artifactory for free download:
$ wget http://artifacts.opnfv.org/vswitchperf/vnf/vsperf-yardstick-image.qcow2
This image can be used for execution of sample testcases with dummy traffic generator.
NOTE: Traffic generators might require an installation of client software. This software is not included in the sample image and must be installed by user.
NOTE: This image will be updated only in case, that new features related to yardstick integration will be added to the vswitchperf.
In general, any Linux distribution supported by vswitchperf can be used as a base image for vswitchperf. One of the possibilities is to modify vloop-vnf image, which can be downloaded from http://artifacts.opnfv.org/vswitchperf.html/ (see vloop-vnf).
Please follow the Installing vswitchperf to install vswitchperf inside vloop-vnf image. As vswitchperf will be run in trafficgen mode, it is possible to skip installation and compilation of OVS, QEMU and DPDK to keep image size smaller.
In case, that selected traffic generator requires installation of additional client software, please follow appropriate documentation. For example in case of IXIA, you would need to install IxOS and IxNetowrk TCL API.
Image with vswitchperf must be uploaded into the glance service and vswitchperf specific flavor configured, e.g.:
$ glance --os-username admin --os-image-api-version 1 image-create --name \
vsperf --is-public true --disk-format qcow2 --container-format bare --file \
vsperf-yardstick-image.qcow2
$ nova --os-username admin flavor-create vsperf-flavor 100 2048 25 1
After installation, yardstick is available as python package within yardstick specific virtual environment. It means, that yardstick environment must be enabled before the test execution, e.g.:
source ~/yardstick_venv/bin/activate
Next step is configuration of OpenStack environment, e.g. in case of devstack:
source /opt/openstack/devstack/openrc
export EXTERNAL_NETWORK=public
Vswitchperf testcases executable by yardstick are located at vswitchperf
repository inside yardstick/tests directory. Example of their download
and execution follows:
git clone https://gerrit.opnfv.org/gerrit/vswitchperf
cd vswitchperf
yardstick -d task start yardstick/tests/rfc2544_throughput_dummy.yaml
NOTE: Optional argument -d shows debug output.
Yardstick testcases are described by YAML files. vswitchperf specific testcases
are part of the vswitchperf repository and their yaml files can be found at
yardstick/tests directory. For detailed description of yaml file structure,
please see yardstick documentation and testcase samples. Only vswitchperf specific
parts will be discussed here.
Example of yaml file:
...
scenarios:
-
type: Vsperf
options:
testname: 'p2p_rfc2544_throughput'
trafficgen_port1: 'eth1'
trafficgen_port2: 'eth3'
external_bridge: 'br-ex'
test_params: 'TRAFFICGEN_DURATION=30;TRAFFIC={'traffic_type':'rfc2544_throughput}'
conf_file: '~/vsperf-yardstick.conf'
host: vsperf.demo
runner:
type: Sequence
scenario_option_name: frame_size
sequence:
- 64
- 128
- 512
- 1024
- 1518
sla:
metrics: 'throughput_rx_fps'
throughput_rx_fps: 500000
action: monitor
context:
...
Section option defines details of vswitchperf test scenario. Lot of options
are identical to the vswitchperf parameters passed through --test-params
argument. Following options are supported:
--test-params CLI argument;
Parameters should be stated in the form of param=value and separated
by a semicolon. Configuration of traffic generator is driven by TRAFFIC
dictionary, which can be also updated by values defined by test_params.
Please check VSPERF documentation for details about available configuration
parameters and their data types.
In case that both test_params and conf_file are specified,
then values from test_params will override values defined
in the configuration file.In case that trafficgen_port1 and/or trafficgen_port2 are defined, then these interfaces will be inserted into the external_bridge of OVS. It is expected, that OVS runs at the same node, where the testcase is executed. In case of more complex OpenStack installation or a need of additional OVS configuration, setup_script can be used.
NOTE It is essential to specify a configuration for selected traffic generator. In case, that standalone testcase is created, then traffic generator can be selected and configured directly in YAML file by test_params. On the other hand, if multiple testcases should be executed with the same traffic generator settings, then a customized configuration file should be prepared and its name passed by conf_file option.
Yardstick supports several runner types. In case of vswitchperf specific TCs, Sequence runner type can be used to execute the testcase for given list of frame sizes.
In case that sla section is not defined, then testcase will be always considered as successful. On the other hand, it is possible to define a set of test metrics and their minimal values to evaluate test success. Any numeric value, reported by vswitchperf inside CSV result file, can be used. Multiple metrics can be defined as a coma separated list of items. Minimal value must be set separately for each metric.
e.g.:
sla:
metrics: 'throughput_rx_fps,throughput_rx_mbps'
throughput_rx_fps: 500000
throughput_rx_mbps: 1000
In case that any of defined metrics will be lower than defined value, then
testcase will be marked as failed. Based on action policy, yardstick
will either stop test execution (value assert) or it will run next test
(value monitor).
NOTE The throughput SLA (or any other SLA) cannot be set to a meaningful value without knowledge of the server and networking environment, possibly including prior testing in that environment to establish a baseline SLA level under well-understood circumstances.
| Testcase Name | Description |
|---|---|
| phy2phy_tput | LTD.Throughput.RFC2544.PacketLossRatio |
| phy2phy_forwarding | LTD.Forwarding.RFC2889.MaxForwardingRate |
| phy2phy_learning | LTD.AddrLearning.RFC2889.AddrLearningRate |
| phy2phy_caching | LTD.AddrCaching.RFC2889.AddrCachingCapacity |
| back2back | LTD.Throughput.RFC2544.BackToBackFrames |
| phy2phy_tput_mod_vlan | LTD.Throughput.RFC2544.PacketLossRatioFrameModification |
| phy2phy_cont | Phy2Phy Continuous Stream |
| pvp_cont | PVP Continuous Stream |
| pvvp_cont | PVVP Continuous Stream |
| pvpv_cont | Two VMs in parallel with Continuous Stream |
| phy2phy_scalability | LTD.Scalability.Flows.RFC2544.0PacketLoss |
| pvp_tput | LTD.Throughput.RFC2544.PacketLossRatio |
| pvp_back2back | LTD.Throughput.RFC2544.BackToBackFrames |
| pvvp_tput | LTD.Throughput.RFC2544.PacketLossRatio |
| pvvp_back2back | LTD.Throughput.RFC2544.BackToBackFrames |
| phy2phy_cpu_load | LTD.CPU.RFC2544.0PacketLoss |
| phy2phy_mem_load | LTD.Memory.RFC2544.0PacketLoss |
| phy2phy_tput_vpp | VPP: LTD.Throughput.RFC2544.PacketLossRatio |
| phy2phy_cont_vpp | VPP: Phy2Phy Continuous Stream |
| phy2phy_back2back_vpp | VPP: LTD.Throughput.RFC2544.BackToBackFrames |
| pvp_tput_vpp | VPP: LTD.Throughput.RFC2544.PacketLossRatio |
| pvp_cont_vpp | VPP: PVP Continuous Stream |
| pvp_back2back_vpp | VPP: LTD.Throughput.RFC2544.BackToBackFrames |
| pvvp_tput_vpp | VPP: LTD.Throughput.RFC2544.PacketLossRatio |
| pvvp_cont_vpp | VPP: PVP Continuous Stream |
| pvvp_back2back_vpp | VPP: LTD.Throughput.RFC2544.BackToBackFrames |
List of performance testcases above can be obtained by execution of:
$ ./vsperf --list
| Testcase Name | Description |
|---|---|
| vswitch_vports_add_del_flow | vSwitch - configure switch with vports, add and delete flow |
| vswitch_add_del_flows | vSwitch - add and delete flows |
| vswitch_p2p_tput | vSwitch - configure switch and execute RFC2544 throughput test |
| vswitch_p2p_back2back | vSwitch - configure switch and execute RFC2544 back2back test |
| vswitch_p2p_cont | vSwitch - configure switch and execute RFC2544 continuous stream test |
| vswitch_pvp | vSwitch - configure switch and one vnf |
| vswitch_vports_pvp | vSwitch - configure switch with vports and one vnf |
| vswitch_pvp_tput | vSwitch - configure switch, vnf and execute RFC2544 throughput test |
| vswitch_pvp_back2back | vSwitch - configure switch, vnf and execute RFC2544 back2back test |
| vswitch_pvp_cont | vSwitch - configure switch, vnf and execute RFC2544 continuous stream test |
| vswitch_pvp_all | vSwitch - configure switch, vnf and execute all test types |
| vswitch_pvvp | vSwitch - configure switch and two vnfs |
| vswitch_pvvp_tput | vSwitch - configure switch, two chained vnfs and execute RFC2544 throughput test |
| vswitch_pvvp_back2back | vSwitch - configure switch, two chained vnfs and execute RFC2544 back2back test |
| vswitch_pvvp_cont | vSwitch - configure switch, two chained vnfs and execute RFC2544 continuous stream test |
| vswitch_pvvp_all | vSwitch - configure switch, two chained vnfs and execute all test types |
| vswitch_p4vp_tput | 4 chained vnfs, execute RFC2544 throughput test, deployment pvvp4 |
| vswitch_p4vp_back2back | 4 chained vnfs, execute RFC2544 back2back test, deployment pvvp4 |
| vswitch_p4vp_cont | 4 chained vnfs, execute RFC2544 continuous stream test, deployment pvvp4 |
| vswitch_p4vp_all | 4 chained vnfs, execute RFC2544 throughput tests, deployment pvvp4 |
| 2pvp_udp_dest_flows | RFC2544 Continuous TC with 2 Parallel VMs, flows on UDP Dest Port, deployment pvpv2 |
| 4pvp_udp_dest_flows | RFC2544 Continuous TC with 4 Parallel VMs, flows on UDP Dest Port, deployment pvpv4 |
| 6pvp_udp_dest_flows | RFC2544 Continuous TC with 6 Parallel VMs, flows on UDP Dest Port, deployment pvpv6 |
| vhost_numa_awareness | vSwitch DPDK - verify that PMD threads are served by the same NUMA slot as QEMU instances |
| ixnet_pvp_tput_1nic | PVP Scenario with 1 port towards IXIA |
| vswitch_vports_add_del_connection_vpp | VPP: vSwitch - configure switch with vports, add and delete connection |
| p2p_l3_multi_IP_ovs | OVS: P2P L3 multistream with unique flow for each IP stream |
| p2p_l3_multi_IP_mask_ovs | OVS: P2P L3 multistream with 1 flow for /8 net mask |
| pvp_l3_multi_IP_mask_ovs | OVS: PVP L3 multistream with 1 flow for /8 net mask |
| pvvp_l3_multi_IP_mask_ovs | OVS: PVVP L3 multistream with 1 flow for /8 net mask |
| p2p_l4_multi_PORT_ovs | OVS: P2P L4 multistream with unique flow for each IP stream |
| p2p_l4_multi_PORT_mask_ovs | OVS: P2P L4 multistream with 1 flow for /8 net and port mask |
| pvp_l4_multi_PORT_mask_ovs | OVS: PVP L4 multistream flows for /8 net and port mask |
| pvvp_l4_multi_PORT_mask_ovs | OVS: PVVP L4 multistream with flows for /8 net and port mask |
| p2p_l3_multi_IP_arp_vpp | VPP: P2P L3 multistream with unique ARP entry for each IP stream |
| p2p_l3_multi_IP_mask_vpp | VPP: P2P L3 multistream with 1 route for /8 net mask |
| p2p_l3_multi_IP_routes_vpp | VPP: P2P L3 multistream with unique route for each IP stream |
| pvp_l3_multi_IP_mask_vpp | VPP: PVP L3 multistream with route for /8 netmask |
| pvvp_l3_multi_IP_mask_vpp | VPP: PVVP L3 multistream with route for /8 netmask |
| p2p_l4_multi_PORT_arp_vpp | VPP: P2P L4 multistream with unique ARP entry for each IP stream and port check |
| p2p_l4_multi_PORT_mask_vpp | VPP: P2P L4 multistream with 1 route for /8 net mask and port check |
| p2p_l4_multi_PORT_routes_vpp | VPP: P2P L4 multistream with unique route for each IP stream and port check |
| pvp_l4_multi_PORT_mask_vpp | VPP: PVP L4 multistream with route for /8 net and port mask |
| pvvp_l4_multi_PORT_mask_vpp | VPP: PVVP L4 multistream with route for /8 net and port mask |
| vxlan_multi_IP_mask_ovs | OVS: VxLAN L3 multistream |
| vxlan_multi_IP_arp_vpp | VPP: VxLAN L3 multistream with unique ARP entry for each IP stream |
| vxlan_multi_IP_mask_vpp | VPP: VxLAN L3 multistream with 1 route for /8 netmask |
List of integration testcases above can be obtained by execution of:
$ ./vsperf --integration --list
These regression tests verify several DPDK features used internally by Open vSwitch. Tests can be used for verification of performance and correct functionality of upcoming DPDK and OVS releases and release candidates.
These tests are part of integration testcases and they must be executed with
--integration CLI parameter.
Example of execution of all OVS/DPDK regression tests:
$ ./vsperf --integration --tests ovsdpdk_
Testcases are defined in the file conf/integration/01b_dpdk_regression_tests.conf. This file
contains a set of configuration options with prefix OVSDPDK_. These parameters can be used
for customization of regression tests and they will override some of standard VSPERF configuration
options. It is recommended to check OVSDPDK configuration parameters and modify them in accordance
with VSPERF configuration.
At least following parameters should be examined. Their values shall ensure, that DPDK and QEMU threads are pinned to cpu cores of the same NUMA slot, where tested NICs are connected.
_OVSDPDK_1st_PMD_CORE
_OVSDPDK_2nd_PMD_CORE
_OVSDPDK_GUEST_5_CORES
A set of performance tests to verify support of DPDK accelerated network interface cards. Testcases use standard physical to physical network scenario with several vSwitch and traffic configurations, which includes one and two PMD threads, uni and bidirectional traffic and RFC2544 Continuous or RFC2544 Throughput with 0% packet loss traffic types.
| Testcase Name | Description |
|---|---|
| ovsdpdk_nic_p2p_single_pmd_unidir_cont | P2P with single PMD in OVS and unidirectional traffic. |
| ovsdpdk_nic_p2p_single_pmd_bidir_cont | P2P with single PMD in OVS and bidirectional traffic. |
| ovsdpdk_nic_p2p_two_pmd_bidir_cont | P2P with two PMDs in OVS and bidirectional traffic. |
| ovsdpdk_nic_p2p_single_pmd_unidir_tput | P2P with single PMD in OVS and unidirectional traffic. |
| ovsdpdk_nic_p2p_single_pmd_bidir_tput | P2P with single PMD in OVS and bidirectional traffic. |
| ovsdpdk_nic_p2p_two_pmd_bidir_tput | P2P with two PMDs in OVS and bidirectional traffic. |
A set of functional tests to verify DPDK hotplug support. Tests verify, that it is possible to use port, which was not bound to DPDK driver during vSwitch startup. There is also a test which verifies a possibility to detach port from DPDK driver. However support for manual detachment of a port from DPDK has been removed from recent OVS versions and thus this testcase is expected to fail.
| Testcase Name | Description |
|---|---|
| ovsdpdk_hotplug_attach | Ensure successful port-add after binding a device to igb_uio after ovs-vswitchd is launched. |
| ovsdpdk_hotplug_detach | Same as ovsdpdk_hotplug_attach, but delete and detach the device after the hotplug. Note Support of netdev-dpdk/detach has been removed from OVS, so testcase will fail with recent OVS/DPDK versions. |
A set of functional tests for verification of RX checksum calculation for tunneled traffic. Open vSwitch enables RX checksum offloading by default if NIC supports it. It is to note, that it is not possible to disable or enable RX checksum offloading. In order to verify correct RX checksum calculation in software, user has to execute these testcases at NIC without HW offloading capabilities.
Testcases utilize existing overlay physical to physical (op2p) network deployment implemented in vsperf. This deployment expects, that traffic generator sends unidirectional tunneled traffic (e.g. vxlan) and Open vSwitch performs data decapsulation and sends them back to the traffic generator via second port.
| Testcase Name | Description |
|---|---|
| ovsdpdk_checksum_l3 | Test verifies RX IP header checksum (offloading) validation for tunneling protocols. |
| ovsdpdk_checksum_l4 | Test verifies RX UDP header checksum (offloading) validation for tunneling protocols. |
A set of functional testcases for the validation of flow control support in Open vSwitch with DPDK support. If flow control is enabled in both OVS and Traffic Generator, the network endpoint (OVS or TGEN) is not able to process incoming data and thus it detects a RX buffer overflow. It then sends an ethernet pause frame (as defined at 802.3x) to the TX side. This mechanism will ensure, that the TX side will slow down traffic transmission and thus no data is lost at RX side.
Introduced testcases use physical to physical scenario to forward data between traffic generator ports. It is expected that the processing of small frames in OVS is slower than line rate. It means that with flow control disabled, traffic generator will report a frame loss. On the other hand with flow control enabled, there should be 0% frame loss reported by traffic generator.
| Testcase Name | Description |
|---|---|
| ovsdpdk_flow_ctrl_rx | Test the rx flow control functionality of DPDK PHY ports. |
| ovsdpdk_flow_ctrl_rx_dynamic | Change the rx flow control support at run time and ensure the system honored the changes. |
A set of functional testcases for validation of multiqueue support for both physical and vHost User DPDK ports. Testcases utilize P2P and PVP network deployments and native support of multiqueue configuration available in VSPERF.
| Testcase Name | Description |
|---|---|
| ovsdpdk_mq_p2p_rxqs | Setup rxqs on NIC port. |
| ovsdpdk_mq_p2p_rxqs_same_core_affinity | Affinitize rxqs to the same core. |
| ovsdpdk_mq_p2p_rxqs_multi_core_affinity | Affinitize rxqs to separate cores. |
| ovsdpdk_mq_pvp_rxqs | Setup rxqs on vhost user port. |
| ovsdpdk_mq_pvp_rxqs_linux_bridge | Confirm traffic received over vhost RXQs with Linux virtio device in guest. |
| ovsdpdk_mq_pvp_rxqs_testpmd | Confirm traffic received over vhost RXQs with DPDK device in guest. |
A set of functional testcases for validation of vHost User Client and vHost User Server modes in OVS.
NOTE: Vhost User Server mode is deprecated and it will be removed from OVS in the future.
| Testcase Name | Description |
|---|---|
| ovsdpdk_vhostuser_client | Test vhost-user client mode |
| ovsdpdk_vhostuser_client_reconnect | Test vhost-user client mode reconnect feature |
| ovsdpdk_vhostuser_server | Test vhost-user server mode |
| ovsdpdk_vhostuser_sock_dir | Verify functionality of vhost-sock-dir flag |
A set of functional testcases for verification of correct functionality of virtual device PMD drivers.
| Testcase Name | Description |
|---|---|
| ovsdpdk_vdev_add_null_pmd | Test addition of port using the null DPDK PMD driver. |
| ovsdpdk_vdev_del_null_pmd | Test deletion of port using the null DPDK PMD driver. |
| ovsdpdk_vdev_add_af_packet_pmd | Test addition of port using the af_packet DPDK PMD driver. |
| ovsdpdk_vdev_del_af_packet_pmd | Test deletion of port using the af_packet DPDK PMD driver. |
A functional testcase for validation of NUMA awareness feature in OVS.
| Testcase Name | Description |
|---|---|
| ovsdpdk_numa | Test vhost-user NUMA support. Vhostuser PMD threads should migrate to the same numa slot, where QEMU is executed. |
A set of functional testcases for verification of jumbo frame support in OVS. Testcases utilize P2P and PVP network deployments and native support of jumbo frames available in VSPERF.
| Testcase Name | Description |
|---|---|
| ovsdpdk_jumbo_increase_mtu_phy_port_ovsdb | Ensure that the increased MTU for a DPDK physical port is updated in OVSDB. |
| ovsdpdk_jumbo_increase_mtu_vport_ovsdb | Ensure that the increased MTU for a DPDK vhost-user port is updated in OVSDB. |
| ovsdpdk_jumbo_reduce_mtu_phy_port_ovsdb | Ensure that the reduced MTU for a DPDK physical port is updated in OVSDB. |
| ovsdpdk_jumbo_reduce_mtu_vport_ovsdb | Ensure that the reduced MTU for a DPDK vhost-user port is updated in OVSDB. |
| ovsdpdk_jumbo_increase_mtu_phy_port_datapath | Ensure that the MTU for a DPDK physical port is updated in the datapath itself when increased to a valid value. |
| ovsdpdk_jumbo_increase_mtu_vport_datapath | Ensure that the MTU for a DPDK vhost-user port is updated in the datapath itself when increased to a valid value. |
| ovsdpdk_jumbo_reduce_mtu_phy_port_datapath | Ensure that the MTU for a DPDK physical port is updated in the datapath itself when decreased to a valid value. |
| ovsdpdk_jumbo_reduce_mtu_vport_datapath | Ensure that the MTU for a DPDK vhost-user port is updated in the datapath itself when decreased to a valid value. |
| ovsdpdk_jumbo_mtu_upper_bound_phy_port | Verify that the upper bound limit is enforced for OvS DPDK Phy ports. |
| ovsdpdk_jumbo_mtu_upper_bound_vport | Verify that the upper bound limit is enforced for OvS DPDK vhost-user ports. |
| ovsdpdk_jumbo_mtu_lower_bound_phy_port | Verify that the lower bound limit is enforced for OvS DPDK Phy ports. |
| ovsdpdk_jumbo_mtu_lower_bound_vport | Verify that the lower bound limit is enforced for OvS DPDK vhost-user ports. |
| ovsdpdk_jumbo_p2p | Ensure that jumbo frames are received, processed and forwarded correctly by DPDK physical ports. |
| ovsdpdk_jumbo_pvp | Ensure that jumbo frames are received, processed and forwarded correctly by DPDK vhost-user ports. |
| ovsdpdk_jumbo_p2p_upper_bound | Ensure that jumbo frames above the configured Rx port’s MTU are not accepted |
A set of functional testcases for validation of rate limiting support. This feature allows to configure an ingress policing for both physical and vHost User DPDK ports.
NOTE: Desired maximum rate is specified in kilo bits per second and it defines the rate of payload only.
| Testcase Name | Description |
|---|---|
| ovsdpdk_rate_create_phy_port | Ensure a rate limiting interface can be created on a physical DPDK port. |
| ovsdpdk_rate_delete_phy_port | Ensure a rate limiting interface can be destroyed on a physical DPDK port. |
| ovsdpdk_rate_create_vport | Ensure a rate limiting interface can be created on a vhost-user port. |
| ovsdpdk_rate_delete_vport | Ensure a rate limiting interface can be destroyed on a vhost-user port. |
| ovsdpdk_rate_no_policing | Ensure when a user attempts to create a rate limiting interface but is missing policing rate argument, no rate limitiner is created. |
| ovsdpdk_rate_no_burst | Ensure when a user attempts to create a rate limiting interface but is missing policing burst argument, rate limitiner is created. |
| ovsdpdk_rate_p2p | Ensure when a user creates a rate limiting physical interface that the traffic is limited to the specified policer rate in a p2p setup. |
| ovsdpdk_rate_pvp | Ensure when a user creates a rate limiting vHost User interface that the traffic is limited to the specified policer rate in a pvp setup. |
| ovsdpdk_rate_p2p_multi_pkt_sizes | Ensure that rate limiting works for various frame sizes. |
A set of functional testcases for validation of QoS support. This feature allows to configure an egress policing for both physical and vHost User DPDK ports.
NOTE: Desired maximum rate is specified in bytes per second and it defines the rate of payload only.
| Testcase Name | Description |
|---|---|
| ovsdpdk_qos_create_phy_port | Ensure a QoS policy can be created on a physical DPDK port |
| ovsdpdk_qos_delete_phy_port | Ensure an existing QoS policy can be destroyed on a physical DPDK port. |
| ovsdpdk_qos_create_vport | Ensure a QoS policy can be created on a virtual vhost user port. |
| ovsdpdk_qos_delete_vport | Ensure an existing QoS policy can be destroyed on a vhost user port. |
| ovsdpdk_qos_create_no_cir | Ensure that a QoS policy cannot be created if the egress policer cir argument is missing. |
| ovsdpdk_qos_create_no_cbs | Ensure that a QoS policy cannot be created if the egress policer cbs argument is missing. |
| ovsdpdk_qos_p2p | In a p2p setup, ensure when a QoS egress policer is created that the traffic is limited to the specified rate. |
| ovsdpdk_qos_pvp | In a pvp setup, ensure when a QoS egress policer is created that the traffic is limited to the specified rate. |
A set of functional testcases for validation of Custom Statistics support by OVS. This feature allows Custom Statistics to be accessed by VSPERF.
These testcases require DPDK v17.11, the latest Open vSwitch(v2.9.90) and the IxNet traffic-generator.
| ovsdpdk_custstat_check | Test if custom statistics are supported. |
| ovsdpdk_custstat_rx_error | Test bad ethernet CRC counter ‘rx_crc_errors’ exposed by custom statistics. |
A set of functional testcases, which use T-Rex running in VM as a traffic generator. These testcases require a VM image with T-Rex server installed. An example of such image is a vloop-vnf image with T-Rex available for download at:
http://artifacts.opnfv.org/vswitchperf/vnf/vloop-vnf-ubuntu-16.04_trex_20180209.qcow2
This image can be used for both T-Rex VM and loopback VM in vm2vm testcases.
NOTE: The performance of T-Rex running inside the VM is lower if compared to T-Rex execution on bare-metal. The user should perform a calibration of the VM maximum FPS capability, to ensure this limitation is understood.
| trex_vm_cont | T-Rex VM - execute RFC2544 Continuous Stream from T-Rex VM and loop it back through Open vSwitch. |
| trex_vm_tput | T-Rex VM - execute RFC2544 Throughput from T-Rex VM and loop it back through Open vSwitch. |
| trex_vm2vm_cont | T-Rex VM2VM - execute RFC2544 Continuous Stream from T-Rex VM and loop it back through 2nd VM. |
| trex_vm2vm_tput | T-Rex VM2VM - execute RFC2544 Throughput from T-Rex VM and loop it back through 2nd VM. |
Tha ability to capture traffic at multiple points of the system is crucial to many of the functional tests. It allows the verification of functionality for both the vSwitch and the NICs using hardware acceleration for packet manipulation and modification.
There are three different methods of traffic capture supported by VSPERF. Detailed descriptions of these methods as well as their pros and cons can be found in the following chapters.
This method uses the standard PVP scenario, in which vSwitch first processes and modifies the packet before forwarding it to the VM. Inside of the VM we capture the traffic using tcpdump or a similiar technique. The capture information is the used to verify the expected modifications to the packet done by vSwitch.
_
+--------------------------------------------------+ |
| | |
| +------------------------------------------+ | |
| | Traffic capture and Packet Forwarding | | |
| +------------------------------------------+ | |
| ^ : | |
| | | | | Guest
| : v | |
| +---------------+ +---------------+ | |
| | logical port 0| | logical port 1| | |
+---+---------------+----------+---------------+---+ _|
^ :
| |
: v _
+---+---------------+----------+---------------+---+ |
| | logical port 0| | logical port 1| | |
| +---------------+ +---------------+ | |
| ^ : | |
| | | | | Host
| : v | |
| +--------------+ +--------------+ | |
| | phy port | vSwitch | phy port | | |
+---+--------------+------------+--------------+---+ _|
^ :
| |
: v
+--------------------------------------------------+
| |
| traffic generator |
| |
+--------------------------------------------------+
PROS:
CONS:
An example of Traffic Capture in VM test:
# Capture Example 1 - Traffic capture inside VM (PVP scenario)
# This TestCase will modify VLAN ID set by the traffic generator to the new value.
# Correct VLAN ID settings is verified by inspection of captured frames.
{
Name: capture_pvp_modify_vid,
Deployment: pvp,
Description: Test and verify VLAN ID modification by Open vSwitch,
Parameters : {
VSWITCH : OvsDpdkVhost, # works also for Vanilla OVS
TRAFFICGEN_DURATION : 5,
TRAFFIC : {
traffic_type : rfc2544_continuous,
frame_rate : 100,
'vlan': {
'enabled': True,
'id': 8,
'priority': 1,
'cfi': 0,
},
},
GUEST_LOOPBACK : ['linux_bridge'],
},
TestSteps: [
# replace original flows with vlan ID modification
['!vswitch', 'add_flow', '$VSWITCH_BRIDGE_NAME', {'in_port': '1', 'actions': ['mod_vlan_vid:4','output:3']}],
['!vswitch', 'add_flow', '$VSWITCH_BRIDGE_NAME', {'in_port': '2', 'actions': ['mod_vlan_vid:4','output:4']}],
['vswitch', 'dump_flows', '$VSWITCH_BRIDGE_NAME'],
# verify that received frames have modified vlan ID
['VNF0', 'execute_and_wait', 'tcpdump -i eth0 -c 5 -w dump.pcap vlan 4 &'],
['trafficgen', 'send_traffic',{}],
['!VNF0', 'execute_and_wait', 'tcpdump -qer dump.pcap vlan 4 2>/dev/null | wc -l','|^(\d+)$'],
['tools', 'assert', '#STEP[-1][0] == 5'],
],
},
The NIC with hardware acceleration/offloading is inserted as an additional card into the server. Two ports on this card are then connected together using a patch cable as shown in the diagram. Only a single port of the tested NIC is setup with DPDK acceleration, while the other is handled by the Linux Ip stack allowing for traffic capture. The two NICs are then connected by vSwitch so the original card can forward the processed packets to the traffic generator. The ports handled by Linux IP stack allow for capturing packets, which are then analyzed for changes done by both the vSwitch and the NIC with hardware acceleration.
_
+------------------------------------------------+ |
| | |
| +----------------------------------------+ | |
| | vSwitch | | |
| | +----------------------------------+ | | |
| | | | | | |
| | | +------------------+ | | | |
| | | | | v | | |
| +----------------------------------------+ | | Device under Test
| ^ | ^ | | |
| | | | | | |
| | v | v | |
| +--------------+ +--------------+ | |
| | | | NIC w HW acc | | |
| | phy ports | | phy ports | | |
+---+--------------+----------+--------------+---+ _|
^ : ^ :
| | | |
| | +-------+
: v Patch Cable
+------------------------------------------------+
| |
| traffic generator |
| |
+------------------------------------------------+
PROS:
CONS:
An example of Traffic Capture for testing NICs with HW offloading test:
# Capture Example 2 - Setup with 2 NICs, where traffic is captured after it is
# processed by NIC under the test (2nd NIC). See documentation for further details.
# This TestCase will strip VLAN headers from traffic sent by the traffic generator.
# The removal of VLAN headers is verified by inspection of captured frames.
#
# NOTE: This setup expects a DUT with two NICs with two ports each. First NIC is
# connected to the traffic generator (standard VSPERF setup). Ports of a second NIC
# are interconnected by a patch cable. PCI addresses of all four ports have to be
# properly configured in the WHITELIST_NICS parameter.
{
Name: capture_p2p2p_strip_vlan_ovs,
Deployment: clean,
Description: P2P Continuous Stream,
Parameters : {
_CAPTURE_P2P2P_OVS_ACTION : 'strip_vlan',
TRAFFIC : {
bidir : False,
traffic_type : rfc2544_continuous,
frame_rate : 100,
'l2': {
'srcmac': ca:fe:00:00:00:00,
'dstmac': 00:00:00:00:00:01
},
'vlan': {
'enabled': True,
'id': 8,
'priority': 1,
'cfi': 0,
},
},
# suppress DPDK configuration, so physical interfaces are not bound to DPDK driver
'WHITELIST_NICS' : [],
'NICS' : [],
},
TestSteps: _CAPTURE_P2P2P_SETUP + [
# capture traffic after processing by NIC under the test (after possible egress HW offloading)
['tools', 'exec_shell_background', 'tcpdump -i [2][device] -c 5 -w capture.pcap '
'ether src [l2][srcmac]'],
['trafficgen', 'send_traffic', {}],
['vswitch', 'dump_flows', '$VSWITCH_BRIDGE_NAME'],
['vswitch', 'dump_flows', 'br1'],
# there must be 5 captured frames...
['tools', 'exec_shell', 'tcpdump -r capture.pcap | wc -l', '|^(\d+)$'],
['tools', 'assert', '#STEP[-1][0] == 5'],
# ...but no vlan headers
['tools', 'exec_shell', 'tcpdump -r capture.pcap vlan | wc -l', '|^(\d+)$'],
['tools', 'assert', '#STEP[-1][0] == 0'],
],
},
Using the functionality of the Traffic generator makes it possible to configure Traffic Capture on both it’s ports. With Traffic Capture enabled, VSPERF instructs the Traffic Generator to automatically export captured data into a pcap file. The captured packets are then sent to VSPERF for analysis and verification, monitoring any changes done by both vSwitch and the NICs.
Vsperf currently only supports this functionality with the T-Rex generator.
_
+--------------------------------------------------+ |
| | |
| +--------------------------+ | |
| | | | |
| | v | | Host
| +--------------+ +--------------+ | |
| | phy port | vSwitch | phy port | | |
+---+--------------+------------+--------------+---+ _|
^ :
| |
: v
+--------------------------------------------------+
| |
| traffic generator |
| |
+--------------------------------------------------+
PROS:
CONS:
An example Traffic Capture on the Traffic Generator test:
# Capture Example 3 - Traffic capture by traffic generator.
# This TestCase uses OVS flow to add VLAN tag with given ID into every
# frame send by traffic generator. Correct frame modificaiton is verified by
# inspection of packet capture received by T-Rex.
{
Name: capture_p2p_add_vlan_ovs_trex,
Deployment: clean,
Description: OVS: Test VLAN tag modification and verify it by traffic capture,
vSwitch : OvsDpdkVhost, # works also for Vanilla OVS
Parameters : {
TRAFFICGEN : Trex,
TRAFFICGEN_DURATION : 5,
TRAFFIC : {
traffic_type : rfc2544_continuous,
frame_rate : 100,
# enable capture of five RX frames
'capture': {
'enabled': True,
'tx_ports' : [],
'rx_ports' : [1],
'count' : 5,
},
},
},
TestSteps : STEP_VSWITCH_P2P_INIT + [
# replace standard L2 flows by flows, which will add VLAN tag with ID 3
['!vswitch', 'add_flow', 'int_br0', {'in_port': '1', 'actions': ['mod_vlan_vid:3','output:2']}],
['!vswitch', 'add_flow', 'int_br0', {'in_port': '2', 'actions': ['mod_vlan_vid:3','output:1']}],
['vswitch', 'dump_flows', 'int_br0'],
['trafficgen', 'send_traffic', {}],
['trafficgen', 'get_results'],
# verify that captured frames have vlan tag with ID 3
['tools', 'exec_shell', 'tcpdump -qer /#STEP[-1][0][capture_rx] vlan 3 '
'2>/dev/null | wc -l', '|^(\d+)$'],
# number of received frames with expected VLAN id must match the number of captured frames
['tools', 'assert', '#STEP[-1][0] == 5'],
] + STEP_VSWITCH_P2P_FINIT,
},
Welcome to Yardstick’s documentation !
Yardstick is an OPNFV Project.
The project’s goal is to verify infrastructure compliance, from the perspective of a Virtual Network Function (VNF).
The Project’s scope is the development of a test framework, Yardstick, test cases and test stimuli to enable Network Function Virtualization Infrastructure (NFVI) verification.
Yardstick is used in OPNFV for verifying the OPNFV infrastructure and some of the OPNFV features. The Yardstick framework is deployed in several OPNFV community labs. It is installer, infrastructure and application independent.
See also
Pharos for information on OPNFV community labs and this Presentation for an overview of Yardstick
This document consists of the following chapters:
Feedback? Contact us
This chapter describes the methodology implemented by the Yardstick project for verifying the NFVI from the perspective of a VNF.
The document ETSI GS NFV-TST001, “Pre-deployment Testing; Report on Validation of NFV Environments and Services”, recommends methods for pre-deployment testing of the functional components of an NFV environment.
The Yardstick project implements the methodology described in chapter 6, “Pre- deployment validation of NFV infrastructure”.
The methodology consists in decomposing the typical VNF work-load performance metrics into a number of characteristics/performance vectors, which each can be represented by distinct test-cases.
The methodology includes five steps:
configuration target for validation; the OPNFV infrastructure, in OPNFV community labs.
infrastructure is to be validated, and its requirements on the underlying infrastructure.
application for which the infrastruture is to be validated, the relevant test cases amongst the list of available Yardstick test cases.
selected test cases, tests runs are automated via OPNFV Jenkins Jobs.
Step5: Collect results - using the common API for result collection.
See also
Yardsticktst for material on alignment ETSI TST001 and Yardstick.
The metrics, as defined by ETSI GS NFV-TST001, are shown in Table1, Table2 and Table3.
In OPNFV Colorado release, generic test cases covering aspects of the listed metrics are available; further OPNFV releases will provide extended testing of these metrics. The view of available Yardstick test cases cross ETSI definitions in Table1, Table2 and Table3 is shown in Table4. It shall be noticed that the Yardstick test cases are examples, the test duration and number of iterations are configurable, as are the System Under Test (SUT) and the attributes (or, in Yardstick nomemclature, the scenario options).
Table 1 - Performance/Speed Metrics
| Category | Performance/Speed |
| Compute |
|
| Network |
|
| Storage |
|
Table 2 - Capacity/Scale Metrics
| Category | Capacity/Scale |
| Compute |
|
| Network |
|
| Storage |
|
Table 3 - Availability/Reliability Metrics
| Category | Availability/Reliability |
| Compute |
|
| Network |
|
| Storage |
|
Table 4 - Yardstick Generic Test Cases
| Category | Performance/Speed | Capacity/Scale | Availability/Reliability |
| Compute | TC003 [1] TC004 TC010 TC012 TC014 TC069 | TC003 [1] TC004 TC024 TC055 | TC013 [1] TC015 [1] |
| Network | TC001 TC002 TC009 TC011 TC042 TC043 | TC044 TC073 TC075 | TC016 [1] TC018 [1] |
| Storage | TC005 | TC063 | TC017 [1] |
Note
The description in this OPNFV document is intended as a reference for users to understand the scope of the Yardstick Project and the deliverables of the Yardstick framework. For complete description of the methodology, please refer to the ETSI document.
Footnotes
| [1] | (1, 2, 3, 4, 5, 6, 7) To be included in future deliveries. |
This chapter describes the yardstick framework software architecture. We will introduce it from Use-Case View, Logical View, Process View and Deployment View. More technical details will be introduced in this chapter.
Yardstick is mainly written in Python, and test configurations are made in YAML. Documentation is written in reStructuredText format, i.e. .rst files. Yardstick is inspired by Rally. Yardstick is intended to run on a computer with access and credentials to a cloud. The test case is described in a configuration file given as an argument.
How it works: the benchmark task configuration file is parsed and converted into an internal model. The context part of the model is converted into a Heat template and deployed into a stack. Each scenario is run using a runner, either serially or in parallel. Each runner runs in its own subprocess executing commands in a VM using SSH. The output of each scenario is written as json records to a file or influxdb or http server, we use influxdb as the backend, the test result will be shown with grafana.
Benchmark - assess the relative performance of something
Benchmark configuration file - describes a single test case in yaml format
Context - The set of Cloud resources used by a scenario, such as user names, image names, affinity rules and network configurations. A context is converted into a simplified Heat template, which is used to deploy onto the Openstack environment.
Data - Output produced by running a benchmark, written to a file in json format
Runner - Logic that determines how a test scenario is run and reported, for example the number of test iterations, input value stepping and test duration. Predefined runner types exist for re-usage, see Runner types.
Scenario - Type/class of measurement for example Ping, Pktgen, (Iperf, LmBench, ...)
SLA - Relates to what result boundary a test case must meet to pass. For example a latency limit, amount or ratio of lost packets and so on. Action based on SLA can be configured, either just to log (monitor) or to stop further testing (assert). The SLA criteria is set in the benchmark configuration file and evaluated by the runner.
There exists several predefined runner types to choose between when designing a test scenario:
Arithmetic: Every test run arithmetically steps the specified input value(s) in the test scenario, adding a value to the previous input value. It is also possible to combine several input values for the same test case in different combinations.
Snippet of an Arithmetic runner configuration:
runner:
type: Arithmetic
iterators:
-
name: stride
start: 64
stop: 128
step: 64
Duration: The test runs for a specific period of time before completed.
Snippet of a Duration runner configuration:
runner:
type: Duration
duration: 30
Sequence: The test changes a specified input value to the scenario. The input values to the sequence are specified in a list in the benchmark configuration file.
Snippet of a Sequence runner configuration:
runner:
type: Sequence
scenario_option_name: packetsize
sequence:
- 100
- 200
- 250
Iteration: Tests are run a specified number of times before completed.
Snippet of an Iteration runner configuration:
runner:
type: Iteration
iterations: 2
Yardstick Use-Case View shows two kinds of users. One is the Tester who will do testing in cloud, the other is the User who is more concerned with test result and result analyses.
For testers, they will run a single test case or test case suite to verify infrastructure compliance or bencnmark their own infrastructure performance. Test result will be stored by dispatcher module, three kinds of store method (file, influxdb and http) can be configured. The detail information of scenarios and runners can be queried with CLI by testers.
For users, they would check test result with four ways.
If dispatcher module is configured as file(default), there are two ways to check test result. One is to get result from yardstick.out ( default path: /tmp/yardstick.out), the other is to get plot of test result, it will be shown if users execute command “yardstick-plot”.
If dispatcher module is configured as influxdb, users will check test result on Grafana which is most commonly used for visualizing time series data.
If dispatcher module is configured as http, users will check test result on OPNFV testing dashboard which use MongoDB as backend.
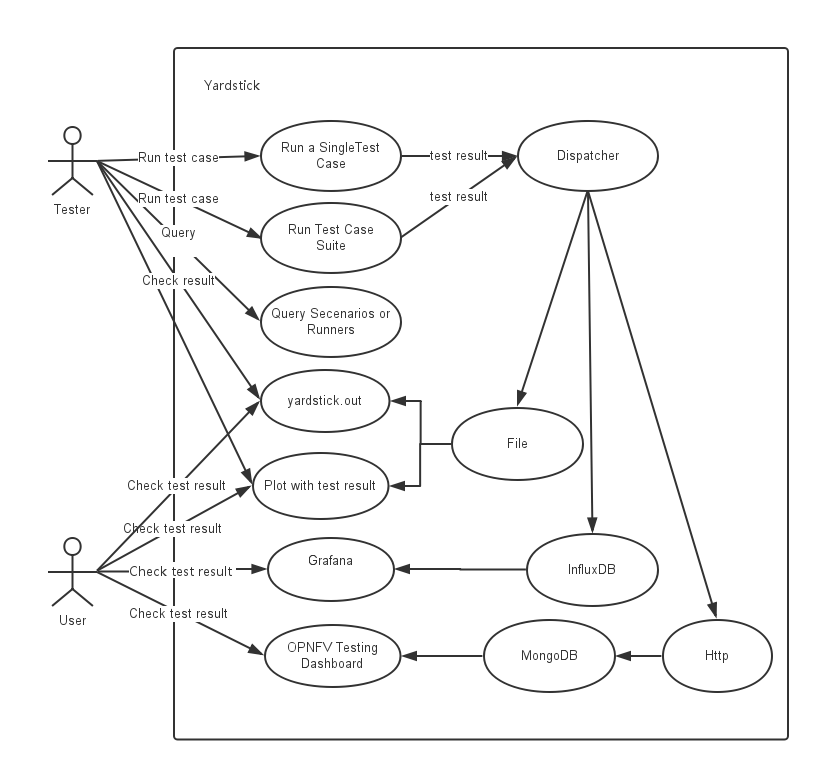
Yardstick Logical View describes the most important classes, their organization, and the most important use-case realizations.
Main classes:
TaskCommands - “yardstick task” subcommand handler.
HeatContext - Do test yaml file context section model convert to HOT, deploy and undeploy Openstack heat stack.
Runner - Logic that determines how a test scenario is run and reported.
TestScenario - Type/class of measurement for example Ping, Pktgen, (Iperf, LmBench, ...)
Dispatcher - Choose user defined way to store test results.
TaskCommands is the “yardstick task” subcommand’s main entry. It takes yaml file (e.g. test.yaml) as input, and uses HeatContext to convert the yaml file’s context section to HOT. After Openstack heat stack is deployed by HeatContext with the converted HOT, TaskCommands use Runner to run specified TestScenario. During first runner initialization, it will create output process. The output process use Dispatcher to push test results. The Runner will also create a process to execute TestScenario. And there is a multiprocessing queue between each runner process and output process, so the runner process can push the real-time test results to the storage media. TestScenario is commonly connected with VMs by using ssh. It sets up VMs and run test measurement scripts through the ssh tunnel. After all TestScenaio is finished, TaskCommands will undeploy the heat stack. Then the whole test is finished.
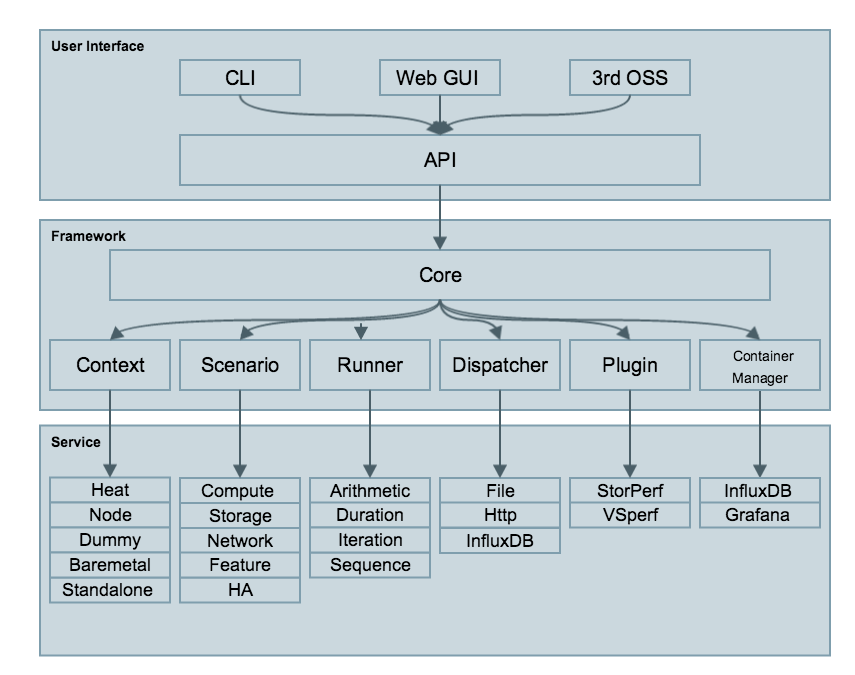
Yardstick process view shows how yardstick runs a test case. Below is the sequence graph about the test execution flow using heat context, and each object represents one module in yardstick:
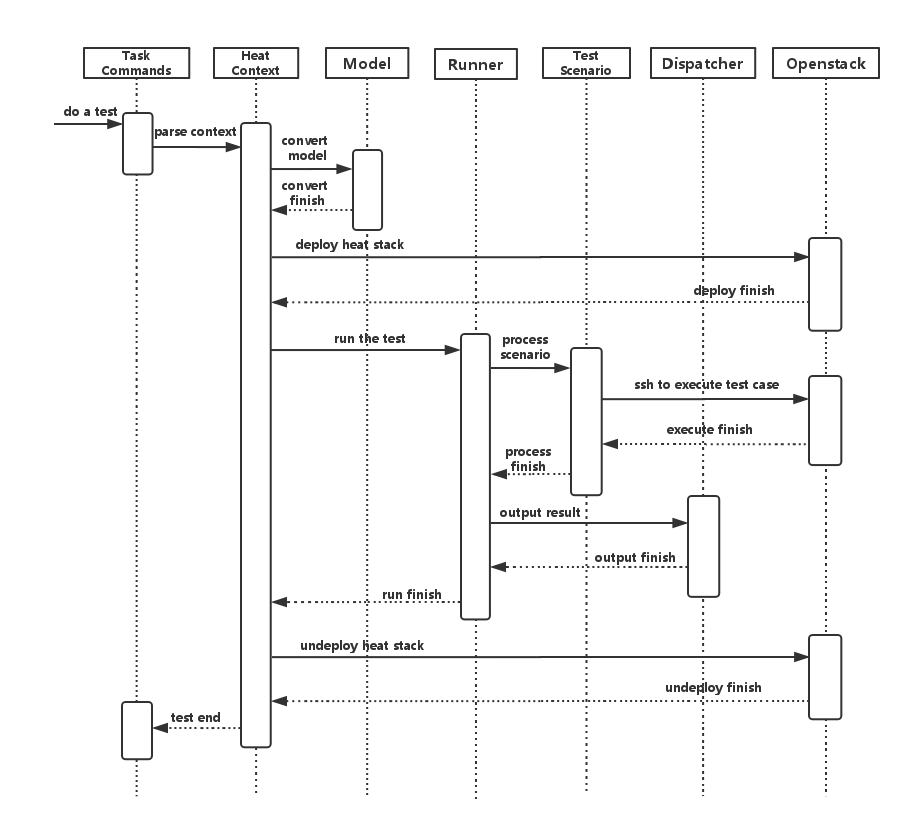
A user wants to do a test with yardstick. He can use the CLI to input the command to start a task. “TaskCommands” will receive the command and ask “HeatContext” to parse the context. “HeatContext” will then ask “Model” to convert the model. After the model is generated, “HeatContext” will inform “Openstack” to deploy the heat stack by heat template. After “Openstack” deploys the stack, “HeatContext” will inform “Runner” to run the specific test case.
Firstly, “Runner” would ask “TestScenario” to process the specific scenario. Then “TestScenario” will start to log on the openstack by ssh protocal and execute the test case on the specified VMs. After the script execution finishes, “TestScenario” will send a message to inform “Runner”. When the testing job is done, “Runner” will inform “Dispatcher” to output the test result via file, influxdb or http. After the result is output, “HeatContext” will call “Openstack” to undeploy the heat stack. Once the stack is undepoyed, the whole test ends.
Yardstick deployment view shows how the yardstick tool can be deployed into the underlying platform. Generally, yardstick tool is installed on JumpServer(see 07-installation for detail installation steps), and JumpServer is connected with other control/compute servers by networking. Based on this deployment, yardstick can run the test cases on these hosts, and get the test result for better showing.
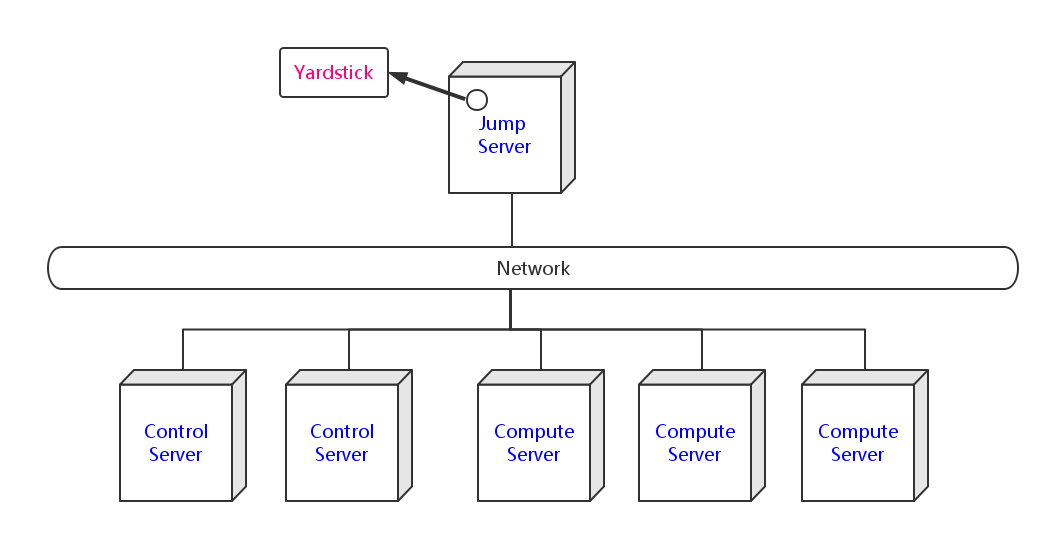
yardstick/ - Yardstick main directory.
etc/ - Used for test cases requiring specific POD configurations.
plugin/ - Plug-in configuration files are stored here.
Yardstick supports installation by Docker or directly in Ubuntu. The installation procedure for Docker and direct installation are detailed in the sections below.
To use Yardstick you should have access to an OpenStack environment, with at least Nova, Neutron, Glance, Keystone and Heat installed.
The steps needed to run Yardstick are:
.yaml file and run the test case/suite.The OPNFV deployment is out of the scope of this document and can be found in User Guide & Configuration Guide. The OPNFV platform is considered as the System Under Test (SUT) in this document.
Several prerequisites are needed for Yardstick:
Note
Jumphost refers to any server which meets the previous requirements. Normally it is the same server from where the OPNFV deployment has been triggered.
Warning
Connectivity from Jumphost is essential and it is of paramount importance to make sure it is working before even considering to install and run Yardstick. Make also sure you understand how your networking is designed to work.
Note
If your Jumphost is operating behind a company http proxy and/or Firewall, please first consult Proxy Support section which is towards the end of this document. That section details some tips/tricks which may be of help in a proxified environment.
Yardstick has a Docker image. It is recommended to use this Docker image to run Yardstick test.
Install docker on your guest system with the following command, if not done yet:
wget -qO- https://get.docker.com/ | sh
Pull the Yardstick Docker image (opnfv/yardstick) from the public dockerhub
registry under the OPNFV account in dockerhub, with the following docker
command:
sudo -EH docker pull opnfv/yardstick:stable
After pulling the Docker image, check that it is available with the following docker command:
[yardsticker@jumphost ~]$ docker images
REPOSITORY TAG IMAGE ID CREATED SIZE
opnfv/yardstick stable a4501714757a 1 day ago 915.4 MB
Run the Docker image to get a Yardstick container:
docker run -itd --privileged -v /var/run/docker.sock:/var/run/docker.sock \
-p 8888:5000 --name yardstick opnfv/yardstick:stable
Description of the parameters used with docker run command
Parameters Detail -itd -i: interactive, Keep STDIN open even if not attached -t: allocate a pseudo-TTY detached mode, in the background –privileged If you want to build yardstick-imagein Yardstick container, this parameter is needed-p 8888:5000 Redirect the a host port (8888) to a container port (5000) -v /var/run/docker.sock :/var/run/docker.sock If you want to use yardstick env grafana/influxdb to create a grafana/influxdb container out of Yardstick container –name yardstick The name for this container
The yardstick container must be started if the host is rebooted:
docker start yardstick
There are three ways to configure environments for running Yardstick, explained in the following sections. Before that, access the Yardstick container:
docker exec -it yardstick /bin/bash
and then configure Yardstick environments in the Yardstick container.
env prepare (first way) (recommended)¶In the Yardstick container, the Yardstick repository is located in the
/home/opnfv/repos directory. Yardstick provides a CLI to prepare OpenStack
environment variables and create Yardstick flavor and guest images
automatically:
yardstick env prepare
Note
Since Euphrates release, the above command will not be able to
automatically configure the /etc/yardstick/openstack.creds file. So before
running the above command, it is necessary to create the
/etc/yardstick/openstack.creds file and save OpenStack environment
variables into it manually. If you have the openstack credential file saved
outside the Yardstick Docker container, you can do this easily by mapping the
credential file into Yardstick container using:
'-v /path/to/credential_file:/etc/yardstick/openstack.creds'
when running the Yardstick container. For details of the required OpenStack environment variables please refer to section Export OpenStack environment variables.
The env prepare command may take up to 6-8 minutes to finish building
yardstick-image and other environment preparation. Meanwhile if you wish to
monitor the env prepare process, you can enter the Yardstick container in a new
terminal window and execute the following command:
tail -f /var/log/yardstick/uwsgi.log
Before running Yardstick it is necessary to export OpenStack environment variables:
source openrc
Environment variables in the openrc file have to include at least:
OS_AUTH_URL
OS_USERNAME
OS_PASSWORD
OS_PROJECT_NAME
EXTERNAL_NETWORK
A sample openrc file may look like this:
export OS_PASSWORD=console
export OS_PROJECT_NAME=admin
export OS_AUTH_URL=http://172.16.1.222:35357/v2.0
export OS_USERNAME=admin
export OS_VOLUME_API_VERSION=2
export EXTERNAL_NETWORK=net04_ext
Before executing Yardstick test cases, make sure that Yardstick flavor and guest image are available in OpenStack. Detailed steps about creating the Yardstick flavor and building the Yardstick guest image can be found below.
Most of the sample test cases in Yardstick are using an OpenStack flavor called
yardstick-flavor which deviates from the OpenStack standard m1.tiny
flavor by the disk size; instead of 1GB it has 3GB. Other parameters are the
same as in m1.tiny.
Create yardstick-flavor:
openstack flavor create --disk 3 --vcpus 1 --ram 512 --swap 100 \
yardstick-flavor
Most of the sample test cases in Yardstick are using a guest image called
yardstick-image which deviates from an Ubuntu Cloud Server image
containing all the required tools to run test cases supported by Yardstick.
Yardstick has a tool for building this custom image. It is necessary to have
sudo rights to use this tool.
Also you may need install several additional packages to use this tool, by follwing the commands below:
sudo -EH apt-get update && sudo -EH apt-get install -y qemu-utils kpartx
This image can be built using the following command in the directory where Yardstick is installed:
export YARD_IMG_ARCH='amd64'
echo "Defaults env_keep += \'YARD_IMG_ARCH\'" | sudo tee --append \
/etc/sudoers > /dev/null
sudo -EH tools/yardstick-img-modify tools/ubuntu-server-cloudimg-modify.sh
Warning
Before building the guest image inside the Yardstick container,
make sure the container is granted with privilege. The script will create files
by default in /tmp/workspace/yardstick and the files will be owned by root.
The created image can be added to OpenStack using the OpenStack client or via the OpenStack Dashboard:
openstack image create --disk-format qcow2 --container-format bare \
--public --file /tmp/workspace/yardstick/yardstick-image.img \
yardstick-image
Some Yardstick test cases use a Cirros 0.3.5 image and/or a Ubuntu 16.04 image. Add Cirros and Ubuntu images to OpenStack:
openstack image create --disk-format qcow2 --container-format bare \
--public --file $cirros_image_file cirros-0.3.5
openstack image create --disk-format qcow2 --container-format bare \
--file $ubuntu_image_file Ubuntu-16.04
Similar to the second way, the first step is also to Export OpenStack environment variables. Then the following steps should be done.
Yardstick has a script for automatically creating Yardstick flavor and building Yardstick guest images. This script is mainly used for CI and can be also used in the local environment:
source $YARDSTICK_REPO_DIR/tests/ci/load_images.sh
In Euphrates release, Yardstick implemented a GUI for Yardstick Docker
container. After booting up Yardstick container, you can visit the GUI at
<container_host_ip>:8888/gui/index.html.
For usage of Yardstick GUI, please watch our demo video at Yardstick GUI demo.
Note
The Yardstick GUI is still in development, the GUI layout and features may change.
If you want to uninstall Yardstick, just delete the Yardstick container:
sudo docker stop yardstick && docker rm yardstick
Alternatively you can install Yardstick framework directly in Ubuntu or in an Ubuntu Docker image. No matter which way you choose to install Yardstick, the following installation steps are identical.
If you choose to use the Ubuntu Docker image, you can pull the Ubuntu Docker image from Docker hub:
sudo -EH docker pull ubuntu:16.04
Prerequisite preparation:
sudo -EH apt-get update && sudo -EH apt-get install -y \
git python-setuptools python-pip
sudo -EH easy_install -U setuptools==30.0.0
sudo -EH pip install appdirs==1.4.0
sudo -EH pip install virtualenv
Download the source code and install Yardstick from it:
git clone https://gerrit.opnfv.org/gerrit/yardstick
export YARDSTICK_REPO_DIR=~/yardstick
cd ~/yardstick
sudo -EH ./install.sh
If the host is ever restarted, nginx and uwsgi need to be restarted:
service nginx restart
uwsgi -i /etc/yardstick/yardstick.ini
For installing Yardstick directly in Ubuntu, the yardstick env command is
not available. You need to prepare OpenStack environment variables and create
Yardstick flavor and guest images manually.
For uninstalling Yardstick, just delete the virtual environment:
rm -rf ~/yardstick_venv
You can install Yardstick framework directly in OpenSUSE.
Prerequisite preparation:
sudo -EH zypper -n install -y gcc \
wget \
git \
sshpass \
qemu-tools \
kpartx \
libffi-devel \
libopenssl-devel \
python \
python-devel \
python-virtualenv \
libxml2-devel \
libxslt-devel \
python-setuptools-git
Create a virtual environment:
virtualenv ~/yardstick_venv
export YARDSTICK_VENV=~/yardstick_venv
source ~/yardstick_venv/bin/activate
sudo -EH easy_install -U setuptools
Download the source code and install Yardstick from it:
git clone https://gerrit.opnfv.org/gerrit/yardstick
export YARDSTICK_REPO_DIR=~/yardstick
cd yardstick
sudo -EH python setup.py install
sudo -EH pip install -r requirements.txt
Install missing python modules:
sudo -EH pip install pyyaml \
oslo_utils \
oslo_serialization \
oslo_config \
paramiko \
python.heatclient \
python.novaclient \
python.glanceclient \
python.neutronclient \
scp \
jinja2
Source the OpenStack environment variables:
source DEVSTACK_DIRECTORY/openrc
Export the Openstack external network. The default installation of Devstack names the external network public:
export EXTERNAL_NETWORK=public
export OS_USERNAME=demo
Change the API version used by Yardstick to v2.0 (the devstack openrc sets it to v3):
export OS_AUTH_URL=http://PUBLIC_IP_ADDRESS:5000/v2.0
For unistalling Yardstick, just delete the virtual environment:
rm -rf ~/yardstick_venv
It is recommended to verify that Yardstick was installed successfully
by executing some simple commands and test samples. Before executing Yardstick
test cases make sure yardstick-flavor and yardstick-image can be found
in OpenStack and the openrc file is sourced. Below is an example invocation
of Yardstick help command and ping.py test sample:
yardstick -h
yardstick task start samples/ping.yaml
Note
The above commands could be run in both the Yardstick container and the Ubuntu directly.
Each testing tool supported by Yardstick has a sample configuration file.
These configuration files can be found in the samples directory.
Default location for the output is /tmp/yardstick.out.
Without InfluxDB, Yardstick stores results for running test case in the file
/tmp/yardstick.out. However, it’s inconvenient to retrieve and display
test results. So we will show how to use InfluxDB to store data and use
Grafana to display data in the following sections.
Firstly, enter the Yardstick container:
sudo -EH docker exec -it yardstick /bin/bash
Secondly, create InfluxDB container and configure with the following command:
yardstick env influxdb
Thirdly, create and configure Grafana container:
yardstick env grafana
Then you can run a test case and visit http://host_ip:1948
(admin/admin) to see the results.
Note
Executing yardstick env command to deploy InfluxDB and Grafana
requires Jumphost’s docker API version => 1.24. Run the following command to
check the docker API version on the Jumphost:
docker version
You can also deploy influxDB and Grafana containers manually on the Jumphost. The following sections show how to do.
Pull docker images:
sudo -EH docker pull tutum/influxdb
sudo -EH docker pull grafana/grafana
Run influxDB:
sudo -EH docker run -d --name influxdb \
-p 8083:8083 -p 8086:8086 --expose 8090 --expose 8099 \
tutum/influxdb
docker exec -it influxdb bash
Configure influxDB:
influx
>CREATE USER root WITH PASSWORD 'root' WITH ALL PRIVILEGES
>CREATE DATABASE yardstick;
>use yardstick;
>show MEASUREMENTS;
Run Grafana:
sudo -EH docker run -d --name grafana -p 1948:3000 grafana/grafana
Log on http://{YOUR_IP_HERE}:1948 using admin/admin and configure
database resource to be {YOUR_IP_HERE}:8086.
Configure yardstick.conf:
sudo -EH docker exec -it yardstick /bin/bash
sudo cp etc/yardstick/yardstick.conf.sample /etc/yardstick/yardstick.conf
sudo vi /etc/yardstick/yardstick.conf
Modify yardstick.conf:
[DEFAULT]
debug = True
dispatcher = influxdb
[dispatcher_influxdb]
timeout = 5
target = http://{YOUR_IP_HERE}:8086
db_name = yardstick
username = root
password = root
Now you can run Yardstick test cases and store the results in influxDB.
To configure the Jumphost to access Internet through a proxy its necessary to export several variables to the environment, contained in the following script:
#!/bin/sh
_proxy=<proxy_address>
_proxyport=<proxy_port>
_ip=$(hostname -I | awk '{print $1}')
export ftp_proxy=http://$_proxy:$_proxyport
export FTP_PROXY=http://$_proxy:$_proxyport
export http_proxy=http://$_proxy:$_proxyport
export HTTP_PROXY=http://$_proxy:$_proxyport
export https_proxy=http://$_proxy:$_proxyport
export HTTPS_PROXY=http://$_proxy:$_proxyport
export no_proxy=127.0.0.1,localhost,$_ip,$(hostname),<.localdomain>
export NO_PROXY=127.0.0.1,localhost,$_ip,$(hostname),<.localdomain>
To enable Internet access from a container using docker, depends on the OS
version. On Ubuntu 14.04 LTS, which uses SysVinit, /etc/default/docker must
be modified:
.......
# If you need Docker to use an HTTP proxy, it can also be specified here.
export http_proxy="http://<proxy_address>:<proxy_port>/"
export https_proxy="https://<proxy_address>:<proxy_port>/"
Then its necessary to restart the docker service:
sudo -EH service docker restart
In Ubuntu 16.04 LTS, which uses Systemd, its necessary to create a drop-in directory:
sudo mkdir /etc/systemd/system/docker.service.d
Then, the proxy configuration will be stored in the following file:
# cat /etc/systemd/system/docker.service.d/http-proxy.conf
[Service]
Environment="HTTP_PROXY=https://<proxy_address>:<proxy_port>/"
Environment="HTTPS_PROXY=https://<proxy_address>:<proxy_port>/"
Environment="NO_PROXY=localhost,127.0.0.1,<localaddress>,<.localdomain>"
The changes need to be flushed and the docker service restarted:
sudo systemctl daemon-reload
sudo systemctl restart docker
Any container is already created won’t contain these modifications. If needed, stop and delete the container:
sudo docker stop yardstick
sudo docker rm yardstick
Warning
Be careful, the above rm command will delete the container
completely. Everything on this container will be lost.
Then follow the previous instructions Prepare the Yardstick container to rebuild the Yardstick container.
Once you have yardstick installed, you can start using it to run testcases immediately, through the CLI. You can also define and run new testcases and test suites. This chapter details basic usage (running testcases), as well as more advanced usage (creating your own testcases).
yardstick testcase list: This command line would list all test cases in
Yardstick. It would show like below:
+---------------------------------------------------------------------------------------
| Testcase Name | Description
+---------------------------------------------------------------------------------------
| opnfv_yardstick_tc001 | Measure network throughput using pktgen
| opnfv_yardstick_tc002 | measure network latency using ping
| opnfv_yardstick_tc005 | Measure Storage IOPS, throughput and latency using fio.
...
+---------------------------------------------------------------------------------------
Take opnfv_yardstick_tc002 for an example. This test case measure network
latency. You just need to type in yardstick testcase show
opnfv_yardstick_tc002, and the console would show the config yaml of this
test case:
---
schema: "yardstick:task:0.1"
description: >
Yardstick TC002 config file;
measure network latency using ping;
{% set image = image or "cirros-0.3.5" %}
{% set provider = provider or none %}
{% set physical_network = physical_network or 'physnet1' %}
{% set segmentation_id = segmentation_id or none %}
{% set packetsize = packetsize or 100 %}
scenarios:
{% for i in range(2) %}
-
type: Ping
options:
packetsize: {{packetsize}}
host: athena.demo
target: ares.demo
runner:
type: Duration
duration: 60
interval: 10
sla:
max_rtt: 10
action: monitor
{% endfor %}
context:
name: demo
image: {{image}}
flavor: yardstick-flavor
user: cirros
placement_groups:
pgrp1:
policy: "availability"
servers:
athena:
floating_ip: true
placement: "pgrp1"
ares:
placement: "pgrp1"
networks:
test:
cidr: '10.0.1.0/24'
{% if provider == "vlan" or provider == "sriov" %}
provider: {{provider}}
physical_network: {{physical_network}}
{% if segmentation_id %}
segmentation_id: {{segmentation_id}}
{% endif %}
{% endif %}
If you want run a test case, then you need to use yardstick task start
<test_case_path> this command support some parameters as below:
Parameters Detail -d show debug log of yardstick running –task-args If you want to customize test case parameters, use “–task-args” to pass the value. The format is a json string with parameter key-value pair. –task-args-file If you want to use yardstick env prepare command(or related API) to load the –parse-only –output-file OUTPUT_FILE_PATH Specify where to output the log. if not pass, the default value is “/tmp/yardstick/yardstick.log” –suite TEST_SUITE_PATH run a test suite, TEST_SUITE_PATH specify where the test suite locates
We also have a guide about How to run Yardstick in a local environment. This work is contributed by Tapio Tallgren.
As a user, you may want to define a new testcase in addition to the ones already available in Yardstick. This section will show you how to do this.
Each testcase consists of two sections:
scenarios describes what will be done by the testcontext describes the environment in which the test will be run.TODO
Each testcase consists of one or more contexts, which describe the environment in which the testcase will be run. Current available contexts are:
Dummy: this is a no-op context, and is used when there is no environment
to set up e.g. when testing whether OpenStack services are availableNode: this context is used to perform operations on baremetal serversHeat: uses OpenStack to provision the required hosts, networks, etc.Kubernetes: uses Kubernetes to provision the resources required for the
test.Regardless of the context type, the context section of the testcase will
consist of the following:
context:
name: demo
type: Dummy|Node|Heat|Kubernetes
The content of the context section will vary based on the context type.
No additional information is required for the Dummy context:
context:
name: my_context
type: Dummy
TODO
In addition to name and type, a Heat context requires the following
arguments:
image: the image to be used to boot VMsflavor: the flavor to be used for VMs in the contextuser: the username for connecting into the VMsnetworks: The networks to be created, networks are identified by namename: network name (required)servers: The servers to be createdname: server nameIn addition to the required arguments, the following optional arguments can be passed to the Heat context:
placement_groups:name: the name of the placement group to be createdpolicy: either affinity or availabilityserver_groups:name: the name of the server grouppolicy: either affinity or anti-affinityCombining these elements together, a sample Heat context config looks like:
TODO
TODO
When using multiple contexts in a testcase, the context section is replaced
by a contexts section, and each context is separated with a - line:
contexts:
-
name: context1
type: Heat
...
-
name: context2
type: Node
...
Typically, a context is torn down after a testcase is run, however, the user may wish to keep an context intact after a testcase is complete.
Note
This feature has been implemented for the Heat context only
To keep or reuse a context, the flags option must be specified:
no_setup: skip the deploy stage, and fetch the details of a deployedcontext/Heat stack.
no_teardown: skip the undeploy stage, thus keeping the stack intact forthe next test
If either of these flags are True, the context information must still
be given. By default, these flags are disabled:
context:
name: mycontext
type: Heat
flags:
no_setup: True
no_teardown: True
...
A test suite in Yardstick is a .yaml file which includes one or more test cases. Yardstick is able to support running test suite task, so you can customize your own test suite and run it in one task.
tests/opnfv/test_suites is the folder where Yardstick puts CI test suite.
A typical test suite is like below (the fuel_test_suite.yaml example):
---
# Fuel integration test task suite
schema: "yardstick:suite:0.1"
name: "fuel_test_suite"
test_cases_dir: "samples/"
test_cases:
-
file_name: ping.yaml
-
file_name: iperf3.yaml
As you can see, there are two test cases in the fuel_test_suite.yaml. The
schema and the name must be specified. The test cases should be listed
via the tag test_cases and their relative path is also marked via the tag
test_cases_dir.
Yardstick test suite also supports constraints and task args for each test
case. Here is another sample (the os-nosdn-nofeature-ha.yaml example) to
show this, which is digested from one big test suite:
---
schema: "yardstick:suite:0.1"
name: "os-nosdn-nofeature-ha"
test_cases_dir: "tests/opnfv/test_cases/"
test_cases:
-
file_name: opnfv_yardstick_tc002.yaml
-
file_name: opnfv_yardstick_tc005.yaml
-
file_name: opnfv_yardstick_tc043.yaml
constraint:
installer: compass
pod: huawei-pod1
task_args:
huawei-pod1: '{"pod_info": "etc/yardstick/.../pod.yaml",
"host": "node4.LF","target": "node5.LF"}'
As you can see in test case opnfv_yardstick_tc043.yaml, there are two
tags, constraint and task_args. constraint is to specify which
installer or pod it can be run in the CI environment. task_args is to
specify the task arguments for each pod.
All in all, to create a test suite in Yardstick, you just need to create a yaml file and add test cases, constraint or task arguments if necessary.
Yardstick provides a plugin CLI command to support integration with other
OPNFV testing projects. Below is an example invocation of Yardstick plugin
command and Storperf plug-in sample.
Storperf is delivered as a Docker container from https://hub.docker.com/r/opnfv/storperf/tags/.
There are two possible methods for installation in your environment:
In this introduction we will install Storperf on Jump Host.
Running Storperf on Jump Host Requirements:
Before installing Storperf into yardstick you need to check your openstack environment and other dependencies:
Yardstick has a prepare_storperf_admin-rc.sh script which can be used to
generate the storperf_admin-rc file, this script is located at
test/ci/prepare_storperf_admin-rc.sh
#!/bin/bash
# Prepare storperf_admin-rc for StorPerf.
AUTH_URL=${OS_AUTH_URL}
USERNAME=${OS_USERNAME:-admin}
PASSWORD=${OS_PASSWORD:-console}
# OS_TENANT_NAME is still present to keep backward compatibility with legacy
# deployments, but should be replaced by OS_PROJECT_NAME.
TENANT_NAME=${OS_TENANT_NAME:-admin}
PROJECT_NAME=${OS_PROJECT_NAME:-$TENANT_NAME}
PROJECT_ID=`openstack project show admin|grep '\bid\b' |awk -F '|' '{print $3}'|sed -e 's/^[[:space:]]*//'`
USER_DOMAIN_ID=${OS_USER_DOMAIN_ID:-default}
rm -f ~/storperf_admin-rc
touch ~/storperf_admin-rc
echo "OS_AUTH_URL="$AUTH_URL >> ~/storperf_admin-rc
echo "OS_USERNAME="$USERNAME >> ~/storperf_admin-rc
echo "OS_PASSWORD="$PASSWORD >> ~/storperf_admin-rc
echo "OS_PROJECT_NAME="$PROJECT_NAME >> ~/storperf_admin-rc
echo "OS_PROJECT_ID="$PROJECT_ID >> ~/storperf_admin-rc
echo "OS_USER_DOMAIN_ID="$USER_DOMAIN_ID >> ~/storperf_admin-rc
The generated storperf_admin-rc file will be stored in the root directory.
If you installed Yardstick using Docker, this file will be located in the
container. You may need to copy it to the root directory of the Storperf
deployed host.
To install a plug-in, first you need to prepare a plug-in configuration file in YAML format and store it in the “plugin” directory. The plugin configration file work as the input of yardstick “plugin” command. Below is the Storperf plug-in configuration file sample:
---
# StorPerf plugin configuration file
# Used for integration StorPerf into Yardstick as a plugin
schema: "yardstick:plugin:0.1"
plugins:
name: storperf
deployment:
ip: 192.168.23.2
user: root
password: root
In the plug-in configuration file, you need to specify the plug-in name and the plug-in deployment info, including node ip, node login username and password. Here the Storperf will be installed on IP 192.168.23.2 which is the Jump Host in my local environment.
In yardstick/resource/scripts directory, there are two folders: an
install folder and a remove folder. You need to store the plug-in
install/remove scripts in these two folders respectively.
The detailed installation or remove operation should de defined in these two scripts. The name of both install and remove scripts should match the plugin-in name that you specified in the plug-in configuration file.
For example, the install and remove scripts for Storperf are both named
storperf.bash.
To install Storperf, simply execute the following command:
# Install Storperf
yardstick plugin install plugin/storperf.yaml
To remove Storperf, simply execute the following command:
# Remove Storperf
yardstick plugin remove plugin/storperf.yaml
What yardstick plugin command does is using the username and password to log into the deployment target and then execute the corresponding install or remove script.
This chapter illustrates how to run plug-in test cases and store test results into community’s InfluxDB. The framework is shown in Framework.
As shown in Framework, there are two ways to store Storperf test results into community’s InfluxDB:
Our plan is to support rest-api in D release so that other testing projects can call the rest-api to use yardstick dispatcher service to push data to Yardstick’s InfluxDB database.
For now, InfluxDB only supports line protocol, and the json protocol is deprecated.
Take ping test case for example, the raw_result is json format like this:
"benchmark": {
"timestamp": 1470315409.868095,
"errors": "",
"data": {
"rtt": {
"ares": 1.125
}
},
"sequence": 1
},
"runner_id": 2625
}
With the help of “influxdb_line_protocol”, the json is transform to like below as a line string:
'ping,deploy_scenario=unknown,host=athena.demo,installer=unknown,pod_name=unknown,
runner_id=2625,scenarios=Ping,target=ares.demo,task_id=77755f38-1f6a-4667-a7f3-
301c99963656,version=unknown rtt.ares=1.125 1470315409868094976'
So, for data output of json format, you just need to transform json into line format and call influxdb api to post the data into the database. All this function has been implemented in Influxdb. If you need support on this, please contact Mingjiang.
curl -i -XPOST 'http://104.197.68.199:8086/write?db=yardstick' --
data-binary 'ping,deploy_scenario=unknown,host=athena.demo,installer=unknown, ...'
Grafana will be used for visualizing the collected test data, which is shown in Visual. Grafana can be accessed by Login.
This chapter describes the Yardstick grafana dashboard. The Yardstick grafana dashboard can be found here: http://testresults.opnfv.org/grafana/
Yardstick provids a public account for accessing to the dashboard. The username and password are both set to ‘opnfv’.
For each test case, there is a dedicated dashboard. Shown here is the dashboard of TC002.
For each test case dashboard. On the top left, we have a dashboard selection, you can switch to different test cases using this pull-down menu.
Underneath, we have a pod and scenario selection. All the pods and scenarios that have ever published test data to the InfluxDB will be shown here.
You can check multiple pods or scenarios.
For each test case, we have a short description and a link to detailed test case information in Yardstick user guide.
Underneath, it is the result presentation section. You can use the time period selection on the top right corner to zoom in or zoom out the chart.
For a user with administration rights it is easy to update and save any dashboard configuration. Saved updates immediately take effect and become live. This may cause issues like:
Any change made by administrator should be careful.
Due to security concern, users that using the public opnfv account are not able to edit the yardstick grafana directly.It takes a few more steps for a non-yardstick user to add a custom dashboard into yardstick grafana.
There are 6 steps to go.
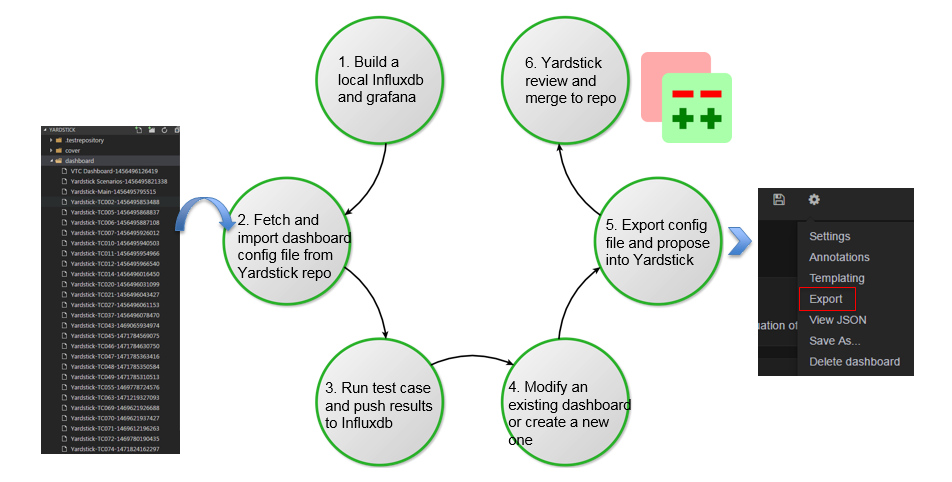
/yardstick/dashboard/Yardstick-TCxxx-yyyyyyyyyyyyy.
For instance a typical default name of the file would be
Yardstick-TC001 Copy-1234567891234.Yardstick support restful API since Danube.
Description: This API is used to prepare Yardstick test environment. For Euphrates, it supports:
EXTERNAL_NETWORK environment variable, load Yardstick VM images and
create flavors;Which API to call will depend on the parameters.
Method: POST
Prepare Yardstick test environment Example:
{
'action': 'prepare_env'
}
This is an asynchronous API. You need to call /yardstick/asynctask API to
get the task result.
Start and config an InfluxDB docker container Example:
{
'action': 'create_influxdb'
}
This is an asynchronous API. You need to call /yardstick/asynctask API to
get the task result.
Start and config a Grafana docker container Example:
{
'action': 'create_grafana'
}
This is an asynchronous API. You need to call /yardstick/asynctask API to
get the task result.
Description: This API is used to get the status of asynchronous tasks
Method: GET
Get the status of asynchronous tasks Example:
http://<SERVER IP>:<PORT>/yardstick/asynctask?task_id=3f3f5e03-972a-4847-a5f8-154f1b31db8c
The returned status will be 0(running), 1(finished) and 2(failed).
NOTE:
<SERVER IP>: The ip of the host where you start your yardstick container
<PORT>: The outside port of port mapping which set when you start start yardstick container
Description: This API is used to list all released Yardstick test cases.
Method: GET
Get a list of released test cases Example:
http://<SERVER IP>:<PORT>/yardstick/testcases
Description: This API is used to run a Yardstick released test case.
Method: POST
Run a released test case Example:
{
'action': 'run_test_case',
'args': {
'opts': {},
'testcase': 'opnfv_yardstick_tc002'
}
}
This is an asynchronous API. You need to call /yardstick/results to get the
result.
Description: This API is used to run a Yardstick sample test case.
Method: POST
Run a sample test case Example:
{
'action': 'run_test_case',
'args': {
'opts': {},
'testcase': 'ping'
}
}
This is an asynchronous API. You need to call /yardstick/results to get
the result.
Description: This API is used to the documentation of a certain released test case.
Method: GET
Get the documentation of a certain test case Example:
http://<SERVER IP>:<PORT>/yardstick/taskcases/opnfv_yardstick_tc002/docs
Description: This API is used to run a Yardstick test suite.
Method: POST
Run a test suite Example:
{
'action': 'run_test_suite',
'args': {
'opts': {},
'testsuite': 'opnfv_smoke'
}
}
This is an asynchronous API. You need to call /yardstick/results to get the result.
Description: This API is used to get the real time log of test case execution.
Method: GET
Get real time of test case execution Example:
http://<SERVER IP>:<PORT>/yardstick/tasks/14795be8-f144-4f54-81ce-43f4e3eab33f/log?index=0
Description: This API is used to get the test results of tasks. If you call /yardstick/testcases/samples/action API, it will return a task id. You can use the returned task id to get the results by using this API.
Method: GET
Get test results of one task Example:
http://<SERVER IP>:<PORT>/yardstick/results?task_id=3f3f5e03-972a-4847-a5f8-154f1b31db8c
This API will return a list of test case result
Description: This API provides functionality of handling OpenStack credential file (openrc). For Euphrates, it supports:
Which API to call will depend on the parameters.
METHOD: POST
Upload an openrc file for an OpenStack environment Example:
{
'action': 'upload_openrc',
'args': {
'file': file,
'environment_id': environment_id
}
}
METHOD: POST
Update an openrc file Example:
{
'action': 'update_openrc',
'args': {
'openrc': {
"EXTERNAL_NETWORK": "ext-net",
"OS_AUTH_URL": "http://192.168.23.51:5000/v3",
"OS_IDENTITY_API_VERSION": "3",
"OS_IMAGE_API_VERSION": "2",
"OS_PASSWORD": "console",
"OS_PROJECT_DOMAIN_NAME": "default",
"OS_PROJECT_NAME": "admin",
"OS_USERNAME": "admin",
"OS_USER_DOMAIN_NAME": "default"
},
'environment_id': environment_id
}
}
Description: This API provides functionality of handling OpenStack credential file (openrc). For Euphrates, it supports:
METHOD: GET
Get openrc file information Example:
http://<SERVER IP>:<PORT>/api/v2/yardstick/openrcs/5g6g3e02-155a-4847-a5f8-154f1b31db8c
METHOD: DELETE
Delete openrc file Example:
http://<SERVER IP>:<PORT>/api/v2/yardstick/openrcs/5g6g3e02-155a-4847-a5f8-154f1b31db8c
Description: This API provides functionality of handling Yardstick pod file (pod.yaml). For Euphrates, it supports:
Which API to call will depend on the parameters.
METHOD: POST
Upload a pod.yaml file Example:
{
'action': 'upload_pod_file',
'args': {
'file': file,
'environment_id': environment_id
}
}
Description: This API provides functionality of handling Yardstick pod file (pod.yaml). For Euphrates, it supports:
METHOD: GET
Get pod file information Example:
http://<SERVER IP>:<PORT>/api/v2/yardstick/pods/5g6g3e02-155a-4847-a5f8-154f1b31db8c
METHOD: DELETE
Delete openrc file Example:
http://<SERVER IP>:<PORT>/api/v2/yardstick/pods/5g6g3e02-155a-4847-a5f8-154f1b31db8c
Description: This API is used to do some work related to Yardstick VM images. For Euphrates, it supports:
Which API to call will depend on the parameters.
METHOD: POST
Load VM images Example:
{
'action': 'load_image',
'args': {
'name': 'yardstick-image'
}
}
Description: This API is used to do some work related to Yardstick VM images. For Euphrates, it supports:
METHOD: GET
Get image information Example:
http://<SERVER IP>:<PORT>/api/v2/yardstick/images/5g6g3e02-155a-4847-a5f8-154f1b31db8c
METHOD: DELETE
Delete images Example:
http://<SERVER IP>:<PORT>/api/v2/yardstick/images/5g6g3e02-155a-4847-a5f8-154f1b31db8c
Description: This API is used to do some work related to yardstick tasks. For Euphrates, it supports:
Which API to call will depend on the parameters.
METHOD: POST
Create a Yardstick task Example:
{
'action': 'create_task',
'args': {
'name': 'task1',
'project_id': project_id
}
}
Description: This API is used to do some work related to yardstick tasks. For Euphrates, it supports:
METHOD: PUT
Add a environment to a task
Example:
{
'action': 'add_environment',
'args': {
'environment_id': 'e3cadbbb-0419-4fed-96f1-a232daa0422a'
}
}
METHOD: PUT
Add a test case to a task Example:
{
'action': 'add_case',
'args': {
'case_name': 'opnfv_yardstick_tc002',
'case_content': case_content
}
}
METHOD: PUT
Add a test suite to a task Example:
{
'action': 'add_suite',
'args': {
'suite_name': 'opnfv_smoke',
'suite_content': suite_content
}
}
METHOD: PUT
Run a task
Example:
{
'action': 'run'
}
METHOD: GET
Get a task’s information Example:
http://<SERVER IP>:<PORT>/api/v2/yardstick/tasks/5g6g3e02-155a-4847-a5f8-154f1b31db8c
METHOD: DELETE
Delete a task
Example:
http://<SERVER IP>:<PORT>/api/v2/yardstick/tasks/5g6g3e02-155a-4847-a5f8-154f1b31db8c
Description: This API is used to do some work related to Yardstick testcases. For Euphrates, it supports:
Which API to call will depend on the parameters.
METHOD: POST
Upload a test case Example:
{
'action': 'upload_case',
'args': {
'file': file
}
}
METHOD: GET
Get all released test cases’ information Example:
http://<SERVER IP>:<PORT>/api/v2/yardstick/testcases
Description: This API is used to do some work related to yardstick testcases. For Euphrates, it supports:
METHOD: GET
Get certain released test case’s information Example:
http://<SERVER IP>:<PORT>/api/v2/yardstick/testcases/opnfv_yardstick_tc002
METHOD: DELETE
Delete a certain test case Example:
http://<SERVER IP>:<PORT>/api/v2/yardstick/testcases/opnfv_yardstick_tc002
Description: This API is used to do some work related to yardstick test suites. For Euphrates, it supports:
Which API to call will depend on the parameters.
METHOD: POST
Create a test suite Example:
{
'action': 'create_suite',
'args': {
'name': <suite_name>,
'testcases': [
'opnfv_yardstick_tc002'
]
}
}
METHOD: GET
Get all test suite Example:
http://<SERVER IP>:<PORT>/api/v2/yardstick/testsuites
Description: This API is used to do some work related to yardstick test suites. For Euphrates, it supports:
METHOD: GET
Get certain test suite’s information Example:
http://<SERVER IP>:<PORT>/api/v2/yardstick/testsuites/<suite_name>
METHOD: DELETE
Delete a certain test suite Example:
http://<SERVER IP>:<PORT>/api/v2/yardstick/testsuites/<suite_name>
Description: This API is used to do some work related to Yardstick test projects. For Euphrates, it supports:
Which API to call will depend on the parameters.
METHOD: POST
Create a Yardstick project Example:
{
'action': 'create_project',
'args': {
'name': 'project1'
}
}
METHOD: GET
Get all projects’ information Example:
http://<SERVER IP>:<PORT>/api/v2/yardstick/projects
Description: This API is used to do some work related to yardstick test projects. For Euphrates, it supports:
METHOD: GET
Get certain project’s information Example:
http://<SERVER IP>:<PORT>/api/v2/yardstick/projects/<project_id>
METHOD: DELETE
Delete a certain project Example:
http://<SERVER IP>:<PORT>/api/v2/yardstick/projects/<project_id>
Description: This API is used to do some work related to Docker containers. For Euphrates, it supports:
Which API to call will depend on the parameters.
METHOD: POST
Create a Grafana Docker container Example:
{
'action': 'create_grafana',
'args': {
'environment_id': <environment_id>
}
}
METHOD: POST
Create an InfluxDB Docker container Example:
{
'action': 'create_influxdb',
'args': {
'environment_id': <environment_id>
}
}
Description: This API is used to do some work related to Docker containers. For Euphrates, it supports:
METHOD: GET
Get certain container’s information Example:
http://<SERVER IP>:<PORT>/api/v2/yardstick/containers/<container_id>
METHOD: DELETE
Delete a certain container Example:
http://<SERVER IP>:<PORT>/api/v2/yardstick/containers/<container_id>
This interface provides a user to view the test result in table format and also values pinned on to a graph.
yardstick report generate <task-ID> <testcase-filename>
1. When the command is triggered using the task-id and the testcase name provided the respective values are retrieved from the database (influxdb in this particular case).
2. The values are then formatted and then provided to the html template framed with complete html body using Django Framework.
The graph is framed with Timestamp on x-axis and output values (differ from testcase to testcase) on y-axis with the help of “Highcharts”.
This chapter provides an overview of the NSB, a contribution to OPNFV Yardstick from Intel.
The goal of NSB is to Extend Yardstick to perform real world VNFs and NFVi Characterization and benchmarking with repeatable and deterministic methods.
The Network Service Benchmarking (NSB) extends the yardstick framework to do VNF characterization and benchmarking in three different execution environments - bare metal i.e. native Linux environment, standalone virtual environment and managed virtualized environment (e.g. Open stack etc.). It also brings in the capability to interact with external traffic generators both hardware & software based for triggering and validating the traffic according to user defined profiles.
NSB extension includes:
Generic data models of Network Services, based on ETSI spec ETSI GS NFV-TST 001
New Standalone context for VNF testing like SRIOV, OVS, OVS-DPDK etc
Generic VNF configuration models and metrics implemented with Python classes
Traffic generator features and traffic profiles
- L1-L3 state-less traffic profiles
- L4-L7 state-full traffic profiles
- Tunneling protocol / network overlay support
Test case samples
- Ping
- Trex
- vPE,vCGNAT, vFirewall etc - ipv4 throughput, latency etc
Traffic generators like Trex, ab/nginx, ixia, iperf etc
KPIs for a given use case:
System agent support for collecting NFVi KPI. This includes:
- CPU statistic
- Memory BW
- OVS-DPDK Stats
Network KPIs, e.g., inpackets, outpackets, thoughput, latency etc
VNF KPIs, e.g., packet_in, packet_drop, packet_fwd etc
The Network Service (NS) defines a set of Virtual Network Functions (VNF) connected together using NFV infrastructure.
The Yardstick NSB extension can support multiple VNFs created by different vendors including traffic generators. Every VNF being tested has its own data model. The Network service defines a VNF modelling on base of performed network functionality. The part of the data model is a set of the configuration parameters, number of connection points used and flavor including core and memory amount.
The ETSI defines a Network Service as a set of configurable VNFs working in some NFV Infrastructure connecting each other using Virtual Links available through Connection Points. The ETSI MANO specification defines a set of management entities called Network Service Descriptors (NSD) and VNF Descriptors (VNFD) that define real Network Service. The picture below makes an example how the real Network Operator use-case can map into ETSI Network service definition
Network Service framework performs the necessary test steps. It may involve
- Interacting with traffic generator and providing the inputs on traffic type / packet structure to generate the required traffic as per the test case. Traffic profiles will be used for this.
- Executing the commands required for the test procedure and analyses the command output for confirming whether the command got executed correctly or not. E.g. As per the test case, run the traffic for the given time period / wait for the necessary time delay
- Verify the test result.
- Validate the traffic flow from SUT
- Fetch the table / data from SUT and verify the value as per the test case
- Upload the logs from SUT onto the Test Harness server
- Read the KPI’s provided by particular VNF
- Models for Network Service benchmarking: The Network Service benchmarking requires the proper modelling approach. The NSB provides models using Python files and defining of NSDs and VNFDs.
The benchmark control application being a part of OPNFV yardstick can call that python models to instantiate and configure the VNFs. Depending on infrastructure type (bare-metal or fully virtualized) that calls could be made directly or using MANO system.
- Traffic generators in NSB: Any benchmark application requires a set of traffic generator and traffic profiles defining the method in which traffic is generated.
The Network Service benchmarking model extends the Network Service definition with a set of Traffic Generators (TG) that are treated same way as other VNFs being a part of benchmarked network service. Same as other VNFs the traffic generator are instantiated and terminated.
Every traffic generator has own configuration defined as a traffic profile and a set of KPIs supported. The python models for TG is extended by specific calls to listen and generate traffic.
- The stateless TREX traffic generator: The main traffic generator used as Network Service stimulus is open source TREX tool.
The TREX tool can generate any kind of stateless traffic.
+--------+ +-------+ +--------+ | | | | | | | Trex | ---> | VNF | ---> | Trex | | | | | | | +--------+ +-------+ +--------+Supported testcases scenarios:
Correlated UDP traffic using TREX traffic generator and replay VNF.
- using different IMIX configuration like pure voice, pure video traffic etc
- using different number IP flows like 1 flow, 1K, 16K, 64K, 256K, 1M flows
- Using different number of rules configured like 1 rule, 1K, 10K rules
For UDP correlated traffic following Key Performance Indicators are collected for every combination of test case parameters:
- RFC2544 throughput for various loss rate defined (1% is a default)
NSB Testing with yardstick framework facilitate performance testing of various VNFs provided.
+-----------+
| | +-----------+
| vPE | ->|TGen Port 0|
| TestCase | | +-----------+
| | |
+-----------+ +------------------+ +-------+ |
| | -- API --> | VNF | <--->
+-----------+ | Yardstick | +-------+ |
| Test Case | --> | NSB Testing | |
+-----------+ | | |
| | | |
| +------------------+ |
+-----------+ | +-----------+
| Traffic | ->|TGen Port 1|
| patterns | +-----------+
+-----------+
Figure 1: Network Service - 2 server configuration
CGNAPT - Carrier Grade Network Address and port Translation
vFW - Virtual Firewall
vACL - Access Control List
UDP_Replay
The Network Service Benchmarking (NSB) extends the yardstick framework to do VNF characterization and benchmarking in three different execution environments viz., bare metal i.e. native Linux environment, standalone virtual environment and managed virtualized environment (e.g. Open stack etc.). It also brings in the capability to interact with external traffic generators both hardware & software based for triggering and validating the traffic according to user defined profiles.
The steps needed to run Yardstick with NSB testing are:
Refer chapter Yardstick Installation for more information on yardstick prerequisites
Several prerequisites are needed for Yardstick (VNF testing):
- Python Modules: pyzmq, pika.
- flex
- bison
- build-essential
- automake
- libtool
- librabbitmq-dev
- rabbitmq-server
- collectd
- intel-cmt-cat
SUT requirements:
Item Description Memory Min 20GB NICs 2 x 10G OS Ubuntu 16.04.3 LTS kernel 4.4.0-34-generic DPDK 17.02
Boot and BIOS settings:
Boot settings default_hugepagesz=1G hugepagesz=1G hugepages=16 hugepagesz=2M hugepages=2048 isolcpus=1-11,22-33 nohz_full=1-11,22-33 rcu_nocbs=1-11,22-33 iommu=on iommu=pt intel_iommu=on Note: nohz_full and rcu_nocbs is to disable Linux kernel interrupts BIOS CPU Power and Performance Policy <Performance> CPU C-state Disabled CPU P-state Disabled Enhanced Intel® Speedstep® Tech Disabl Hyper-Threading Technology (If supported) Enabled Virtualization Techology Enabled Intel(R) VT for Direct I/O Enabled Coherency Enabled Turbo Boost Disabled
Download the source code and install Yardstick from it
git clone https://gerrit.opnfv.org/gerrit/yardstick
cd yardstick
# Switch to latest stable branch
# git checkout <tag or stable branch>
git checkout stable/euphrates
Configure the network proxy, either using the environment variables or setting the global environment file:
cat /etc/environment
http_proxy='http://proxy.company.com:port'
https_proxy='http://proxy.company.com:port'
export http_proxy='http://proxy.company.com:port'
export https_proxy='http://proxy.company.com:port'
The last step is to modify the Yardstick installation inventory, used by Ansible:
cat ./ansible/install-inventory.ini
[jumphost]
localhost ansible_connection=local
[yardstick-standalone]
yardstick-standalone-node ansible_host=192.168.1.2
yardstick-standalone-node-2 ansible_host=192.168.1.3
# section below is only due backward compatibility.
# it will be removed later
[yardstick:children]
jumphost
[all:vars]
ansible_user=root
ansible_pass=root
Note
SSH access without password needs to be configured for all your nodes defined in
install-inventory.ini file.
If you want to use password authentication you need to install sshpass
sudo -EH apt-get install sshpass
To execute an installation for a Bare-Metal or a Standalone context:
./nsb_setup.sh
To execute an installation for an OpenStack context:
./nsb_setup.sh <path to admin-openrc.sh>
Above command setup docker with latest yardstick code. To execute
docker exec -it yardstick bash
It will also automatically download all the packages needed for NSB Testing setup. Refer chapter Yardstick Installation for more on docker Install Yardstick using Docker (recommended)
+----------+ +----------+
| | | |
| | (0)----->(0) | |
| TG1 | | DUT |
| | | |
| | (1)<-----(1) | |
+----------+ +----------+
trafficgen_1 vnf
If user did not run ‘yardstick env influxdb’ inside the container, which will
generate correct yardstick.conf, then create the config file manually (run
inside the container):
cp ./etc/yardstick/yardstick.conf.sample /etc/yardstick/yardstick.conf
vi /etc/yardstick/yardstick.conf
Add trex_path, trex_client_lib and bin_path in ‘nsb’ section.
[DEFAULT]
debug = True
dispatcher = file, influxdb
[dispatcher_influxdb]
timeout = 5
target = http://{YOUR_IP_HERE}:8086
db_name = yardstick
username = root
password = root
[nsb]
trex_path=/opt/nsb_bin/trex/scripts
bin_path=/opt/nsb_bin
trex_client_lib=/opt/nsb_bin/trex_client/stl
docker exec -it yardstick /bin/bash
source /etc/yardstick/openstack.creds (only for heat TC if nsb_setup.sh was NOT used)
export EXTERNAL_NETWORK="<openstack public network>" (only for heat TC)
yardstick --debug task start yardstick/samples/vnf_samples/nsut/<vnf>/<test case>
+----------+ +----------+
| | | |
| | (0)----->(0) | |
| TG1 | | DUT |
| | | |
| | (n)<-----(n) | |
+----------+ +----------+
trafficgen_1 vnf
Before executing Yardstick test cases, make sure that pod.yaml reflects the topology and update all the required fields.:
cp /etc/yardstick/nodes/pod.yaml.nsb.sample /etc/yardstick/nodes/pod.yaml
nodes:
-
name: trafficgen_1
role: TrafficGen
ip: 1.1.1.1
user: root
password: r00t
interfaces:
xe0: # logical name from topology.yaml and vnfd.yaml
vpci: "0000:07:00.0"
driver: i40e # default kernel driver
dpdk_port_num: 0
local_ip: "152.16.100.20"
netmask: "255.255.255.0"
local_mac: "00:00:00:00:00:01"
xe1: # logical name from topology.yaml and vnfd.yaml
vpci: "0000:07:00.1"
driver: i40e # default kernel driver
dpdk_port_num: 1
local_ip: "152.16.40.20"
netmask: "255.255.255.0"
local_mac: "00:00.00:00:00:02"
-
name: vnf
role: vnf
ip: 1.1.1.2
user: root
password: r00t
host: 1.1.1.2 #BM - host == ip, virtualized env - Host - compute node
interfaces:
xe0: # logical name from topology.yaml and vnfd.yaml
vpci: "0000:07:00.0"
driver: i40e # default kernel driver
dpdk_port_num: 0
local_ip: "152.16.100.19"
netmask: "255.255.255.0"
local_mac: "00:00:00:00:00:03"
xe1: # logical name from topology.yaml and vnfd.yaml
vpci: "0000:07:00.1"
driver: i40e # default kernel driver
dpdk_port_num: 1
local_ip: "152.16.40.19"
netmask: "255.255.255.0"
local_mac: "00:00:00:00:00:04"
routing_table:
- network: "152.16.100.20"
netmask: "255.255.255.0"
gateway: "152.16.100.20"
if: "xe0"
- network: "152.16.40.20"
netmask: "255.255.255.0"
gateway: "152.16.40.20"
if: "xe1"
nd_route_tbl:
- network: "0064:ff9b:0:0:0:0:9810:6414"
netmask: "112"
gateway: "0064:ff9b:0:0:0:0:9810:6414"
if: "xe0"
- network: "0064:ff9b:0:0:0:0:9810:2814"
netmask: "112"
gateway: "0064:ff9b:0:0:0:0:9810:2814"
if: "xe1"
Create and configure a bridge named br-int for VM to connect to external network.
Currently this can be done using VXLAN tunnel.
Execute the following on host, where VM is created:
ip link add type vxlan remote <Jumphost IP> local <DUT IP> id <ID: 10> dstport 4789 brctl addbr br-int brctl addif br-int vxlan0 ip link set dev vxlan0 up ip addr add <IP#1, like: 172.20.2.1/24> dev br-int ip link set dev br-int upNote
May be needed to add extra rules to iptable to forward traffic.
iptables -A FORWARD -i br-int -s <network ip address>/<netmask> -j ACCEPT iptables -A FORWARD -o br-int -d <network ip address>/<netmask> -j ACCEPTExecute the following on a jump host:
ip link add type vxlan remote <DUT IP> local <Jumphost IP> id <ID: 10> dstport 4789 ip addr add <IP#2, like: 172.20.2.2/24> dev vxlan0 ip link set dev vxlan0 upNote
Host and jump host are different baremetal servers.
servers: vnf: network_ports: mgmt: cidr: '1.1.1.7/24'
Build guest image for VNF to run.
Most of the sample test cases in Yardstick are using a guest image called
yardstick-nsb-image which deviates from an Ubuntu Cloud Server image
Yardstick has a tool for building this custom image with SampleVNF.
It is necessary to have sudo rights to use this tool.
Also you may need to install several additional packages to use this tool, by following the commands below:
sudo apt-get update && sudo apt-get install -y qemu-utils kpartx
This image can be built using the following command in the directory where Yardstick is installed
export YARD_IMG_ARCH='amd64'
sudo echo "Defaults env_keep += \'YARD_IMG_ARCH\'" >> /etc/sudoers
Please use ansible script to generate a cloud image refer to Yardstick Installation
for more details refer to chapter Yardstick Installation
Note
VM should be build with static IP and should be accessible from yardstick host.
+--------------------+
| |
| |
| DUT |
| (VNF) |
| |
+--------------------+
| VF NIC | | VF NIC |
+--------+ +--------+
^ ^
| |
| |
+----------+ +-------------------------+
| | | ^ ^ |
| | | | | |
| | (0)<----->(0) | ------ | |
| TG1 | | SUT | |
| | | | |
| | (n)<----->(n) |------------------ |
+----------+ +-------------------------+
trafficgen_1 host
nodes:
-
name: trafficgen_1
role: TrafficGen
ip: 1.1.1.1
user: root
password: r00t
key_filename: /root/.ssh/id_rsa
interfaces:
xe0: # logical name from topology.yaml and vnfd.yaml
vpci: "0000:07:00.0"
driver: i40e # default kernel driver
dpdk_port_num: 0
local_ip: "152.16.100.20"
netmask: "255.255.255.0"
local_mac: "00:00:00:00:00:01"
xe1: # logical name from topology.yaml and vnfd.yaml
vpci: "0000:07:00.1"
driver: i40e # default kernel driver
dpdk_port_num: 1
local_ip: "152.16.40.20"
netmask: "255.255.255.0"
local_mac: "00:00.00:00:00:02"
nodes:
-
name: sriov
role: Sriov
ip: 192.168.100.101
user: ""
password: ""
SR-IOV testcase update:
<yardstick>/samples/vnf_samples/nsut/vfw/tc_sriov_rfc2544_ipv4_1rule_1flow_64B_trex.yaml
contexts:
- name: yardstick
type: Node
file: /etc/yardstick/nodes/standalone/pod_trex.yaml
- type: StandaloneSriov
file: /etc/yardstick/nodes/standalone/host_sriov.yaml
name: yardstick
vm_deploy: True
flavor:
images: "/var/lib/libvirt/images/ubuntu.qcow2"
ram: 4096
extra_specs:
hw:cpu_sockets: 1
hw:cpu_cores: 6
hw:cpu_threads: 2
user: "" # update VM username
password: "" # update password
servers:
vnf:
network_ports:
mgmt:
cidr: '1.1.1.61/24' # Update VM IP address, if static, <ip>/<mask> or if dynamic, <start of ip>/<mask>
xe0:
- uplink_0
xe1:
- downlink_0
networks:
uplink_0:
phy_port: "0000:05:00.0"
vpci: "0000:00:07.0"
cidr: '152.16.100.10/24'
gateway_ip: '152.16.100.20'
downlink_0:
phy_port: "0000:05:00.1"
vpci: "0000:00:08.0"
cidr: '152.16.40.10/24'
gateway_ip: '152.16.100.20'
Create and configure a bridge named br-int for VM to connect to external network.
Currently this can be done using VXLAN tunnel.
Execute the following on host, where VM is created:
ip link add type vxlan remote <Jumphost IP> local <DUT IP> id <ID: 10> dstport 4789 brctl addbr br-int brctl addif br-int vxlan0 ip link set dev vxlan0 up ip addr add <IP#1, like: 172.20.2.1/24> dev br-int ip link set dev br-int upNote
May be needed to add extra rules to iptable to forward traffic.
iptables -A FORWARD -i br-int -s <network ip address>/<netmask> -j ACCEPT iptables -A FORWARD -o br-int -d <network ip address>/<netmask> -j ACCEPTExecute the following on a jump host:
ip link add type vxlan remote <DUT IP> local <Jumphost IP> id <ID: 10> dstport 4789 ip addr add <IP#2, like: 172.20.2.2/24> dev vxlan0 ip link set dev vxlan0 upNote
Host and jump host are different baremetal servers.
servers: vnf: network_ports: mgmt: cidr: '1.1.1.7/24'
Build guest image for VNF to run.
Most of the sample test cases in Yardstick are using a guest image called
yardstick-nsb-image which deviates from an Ubuntu Cloud Server image
Yardstick has a tool for building this custom image with SampleVNF.
It is necessary to have sudo rights to use this tool.
Also you may need to install several additional packages to use this tool, by following the commands below:
sudo apt-get update && sudo apt-get install -y qemu-utils kpartx
This image can be built using the following command in the directory where Yardstick is installed:
export YARD_IMG_ARCH='amd64'
sudo echo "Defaults env_keep += \'YARD_IMG_ARCH\'" >> /etc/sudoers
sudo tools/yardstick-img-dpdk-modify tools/ubuntu-server-cloudimg-samplevnf-modify.sh
for more details refer to chapter Yardstick Installation
Note
VM should be build with static IP and should be accessible from yardstick host.
Please refer to below link on how to setup OVS-DPDK
+--------------------+
| |
| |
| DUT |
| (VNF) |
| |
+--------------------+
| virtio | | virtio |
+--------+ +--------+
^ ^
| |
| |
+--------+ +--------+
| vHOST0 | | vHOST1 |
+----------+ +-------------------------+
| | | ^ ^ |
| | | | | |
| | (0)<----->(0) | ------ | |
| TG1 | | SUT | |
| | | (ovs-dpdk) | |
| | (n)<----->(n) |------------------ |
+----------+ +-------------------------+
trafficgen_1 host
nodes:
-
name: trafficgen_1
role: TrafficGen
ip: 1.1.1.1
user: root
password: r00t
interfaces:
xe0: # logical name from topology.yaml and vnfd.yaml
vpci: "0000:07:00.0"
driver: i40e # default kernel driver
dpdk_port_num: 0
local_ip: "152.16.100.20"
netmask: "255.255.255.0"
local_mac: "00:00:00:00:00:01"
xe1: # logical name from topology.yaml and vnfd.yaml
vpci: "0000:07:00.1"
driver: i40e # default kernel driver
dpdk_port_num: 1
local_ip: "152.16.40.20"
netmask: "255.255.255.0"
local_mac: "00:00.00:00:00:02"
nodes:
-
name: ovs_dpdk
role: OvsDpdk
ip: 192.168.100.101
user: ""
password: ""
ovs_dpdk testcase update:
<yardstick>/samples/vnf_samples/nsut/vfw/tc_ovs_rfc2544_ipv4_1rule_1flow_64B_trex.yaml
contexts:
- name: yardstick
type: Node
file: /etc/yardstick/nodes/standalone/pod_trex.yaml
- type: StandaloneOvsDpdk
name: yardstick
file: /etc/yardstick/nodes/standalone/pod_ovs.yaml
vm_deploy: True
ovs_properties:
version:
ovs: 2.7.0
dpdk: 16.11.1
pmd_threads: 2
ram:
socket_0: 2048
socket_1: 2048
queues: 4
vpath: "/usr/local"
flavor:
images: "/var/lib/libvirt/images/ubuntu.qcow2"
ram: 4096
extra_specs:
hw:cpu_sockets: 1
hw:cpu_cores: 6
hw:cpu_threads: 2
user: "" # update VM username
password: "" # update password
servers:
vnf:
network_ports:
mgmt:
cidr: '1.1.1.61/24' # Update VM IP address, if static, <ip>/<mask> or if dynamic, <start of ip>/<mask>
xe0:
- uplink_0
xe1:
- downlink_0
networks:
uplink_0:
phy_port: "0000:05:00.0"
vpci: "0000:00:07.0"
cidr: '152.16.100.10/24'
gateway_ip: '152.16.100.20'
downlink_0:
phy_port: "0000:05:00.1"
vpci: "0000:00:08.0"
cidr: '152.16.40.10/24'
gateway_ip: '152.16.100.20'
This section describes how to run a Sample VNF test case, using Heat context, with SR-IOV. It also covers how to install OpenStack in Ubuntu 16.04, using DevStack, with SR-IOV support.
+----------------------------+
|OpenStack(DevStack) |
| |
| +--------------------+ |
| |sample-VNF VM | |
| | | |
| | DUT | |
| | (VNF) | |
| | | |
| +--------+ +--------+ |
| | VF NIC | | VF NIC | |
| +-----+--+--+----+---+ |
| ^ ^ |
| | | |
+----------+ +---------+----------+-------+
| | | VF0 VF1 |
| | | ^ ^ |
| | | | SUT | |
| TG | (PF0)<----->(PF0) +---------+ | |
| | | | |
| | (PF1)<----->(PF1) +--------------------+ |
| | | |
+----------+ +----------------------------+
trafficgen_1 host
Warning
The following configuration requires sudo access to the system. Make sure that your user have the access.
Enable the Intel VT-d or AMD-Vi extension in the BIOS. Some system manufacturers disable this extension by default.
Activate the Intel VT-d or AMD-Vi extension in the kernel by modifying the GRUB
config file /etc/default/grub.
For the Intel platform:
...
GRUB_CMDLINE_LINUX_DEFAULT="intel_iommu=on"
...
For the AMD platform:
...
GRUB_CMDLINE_LINUX_DEFAULT="amd_iommu=on"
...
Update the grub configuration file and restart the system:
Warning
The following command will reboot the system.
sudo update-grub
sudo reboot
Make sure the extension has been enabled:
sudo journalctl -b 0 | grep -e IOMMU -e DMAR
Feb 06 14:50:14 hostname kernel: ACPI: DMAR 0x000000006C406000 0001E0 (v01 INTEL S2600WF 00000001 INTL 20091013)
Feb 06 14:50:14 hostname kernel: DMAR: IOMMU enabled
Feb 06 14:50:14 hostname kernel: DMAR: Host address width 46
Feb 06 14:50:14 hostname kernel: DMAR: DRHD base: 0x000000d37fc000 flags: 0x0
Feb 06 14:50:14 hostname kernel: DMAR: dmar0: reg_base_addr d37fc000 ver 1:0 cap 8d2078c106f0466 ecap f020de
Feb 06 14:50:14 hostname kernel: DMAR: DRHD base: 0x000000e0ffc000 flags: 0x0
Feb 06 14:50:14 hostname kernel: DMAR: dmar1: reg_base_addr e0ffc000 ver 1:0 cap 8d2078c106f0466 ecap f020de
Feb 06 14:50:14 hostname kernel: DMAR: DRHD base: 0x000000ee7fc000 flags: 0x0
Setup system proxy (if needed). Add the following configuration into the
/etc/environment file:
Note
The proxy server name/port and IPs should be changed according to actuall/current proxy configuration in the lab.
export http_proxy=http://proxy.company.com:port
export https_proxy=http://proxy.company.com:port
export ftp_proxy=http://proxy.company.com:port
export no_proxy=localhost,127.0.0.1,company.com,<IP-OF-HOST1>,<IP-OF-HOST2>,...
export NO_PROXY=localhost,127.0.0.1,company.com,<IP-OF-HOST1>,<IP-OF-HOST2>,...
Upgrade the system:
sudo -EH apt-get update
sudo -EH apt-get upgrade
sudo -EH apt-get dist-upgrade
Install dependencies needed for the DevStack
sudo -EH apt-get install python
sudo -EH apt-get install python-dev
sudo -EH apt-get install python-pip
Setup SR-IOV ports on the host:
Note
The enp24s0f0, enp24s0f1 are physical function (PF) interfaces
on a host and enp24s0f3 is a public interface used in OpenStack, so the
interface names should be changed according to the HW environment used for
testing.
sudo ip link set dev enp24s0f0 up
sudo ip link set dev enp24s0f1 up
sudo ip link set dev enp24s0f3 up
# Create VFs on PF
echo 2 | sudo tee /sys/class/net/enp24s0f0/device/sriov_numvfs
echo 2 | sudo tee /sys/class/net/enp24s0f1/device/sriov_numvfs
Use official Devstack
documentation to install OpenStack on a host. Please note, that stable
pike branch of devstack repo should be used during the installation.
The required local.conf` configuration file are described below.
DevStack configuration file:
Note
Update the devstack configuration file by replacing angluar brackets with a short description inside.
Note
Use lspci | grep Ether & lspci -n | grep <PCI ADDRESS>
commands to get device and vendor id of the virtual function (VF).
[[local|localrc]]
HOST_IP=<HOST_IP_ADDRESS>
ADMIN_PASSWORD=password
MYSQL_PASSWORD=$ADMIN_PASSWORD
DATABASE_PASSWORD=$ADMIN_PASSWORD
RABBIT_PASSWORD=$ADMIN_PASSWORD
SERVICE_PASSWORD=$ADMIN_PASSWORD
HORIZON_PASSWORD=$ADMIN_PASSWORD
# Internet access.
RECLONE=False
PIP_UPGRADE=True
IP_VERSION=4
# Services
disable_service n-net
ENABLED_SERVICES+=,q-svc,q-dhcp,q-meta,q-agt,q-sriov-agt
# Heat
enable_plugin heat https://git.openstack.org/openstack/heat stable/pike
# Neutron
enable_plugin neutron https://git.openstack.org/openstack/neutron.git stable/pike
# Neutron Options
FLOATING_RANGE=<RANGE_IN_THE_PUBLIC_INTERFACE_NETWORK>
Q_FLOATING_ALLOCATION_POOL=start=<START_IP_ADDRESS>,end=<END_IP_ADDRESS>
PUBLIC_NETWORK_GATEWAY=<PUBLIC_NETWORK_GATEWAY>
PUBLIC_INTERFACE=<PUBLIC INTERFACE>
# ML2 Configuration
Q_PLUGIN=ml2
Q_ML2_PLUGIN_MECHANISM_DRIVERS=openvswitch,sriovnicswitch
Q_ML2_PLUGIN_TYPE_DRIVERS=vlan,flat,local,vxlan,gre,geneve
# Open vSwitch provider networking configuration
Q_USE_PROVIDERNET_FOR_PUBLIC=True
OVS_PHYSICAL_BRIDGE=br-ex
OVS_BRIDGE_MAPPINGS=public:br-ex
PHYSICAL_DEVICE_MAPPINGS=physnet1:<PF0_IFNAME>,physnet2:<PF1_IFNAME>
PHYSICAL_NETWORK=physnet1,physnet2
[[post-config|$NOVA_CONF]]
[DEFAULT]
scheduler_default_filters=RamFilter,ComputeFilter,AvailabilityZoneFilter,ComputeCapabilitiesFilter,ImagePropertiesFilter,PciPassthroughFilter
# Whitelist PCI devices
pci_passthrough_whitelist = {\\"devname\\": \\"<PF0_IFNAME>\\", \\"physical_network\\": \\"physnet1\\" }
pci_passthrough_whitelist = {\\"devname\\": \\"<PF1_IFNAME>\\", \\"physical_network\\": \\"physnet2\\" }
[filter_scheduler]
enabled_filters = RetryFilter,AvailabilityZoneFilter,RamFilter,DiskFilter,ComputeFilter,ComputeCapabilitiesFilter,ImagePropertiesFilter,ServerGroupAntiAffinityFilter,ServerGroupAffinityFilter,SameHostFilter
[libvirt]
cpu_mode = host-model
# ML2 plugin bits for SR-IOV enablement of Intel Corporation XL710/X710 Virtual Function
[[post-config|/$Q_PLUGIN_CONF_FILE]]
[ml2_sriov]
agent_required = True
supported_pci_vendor_devs = <VF_DEV_ID:VF_VEN_ID>
Start the devstack installation on a host.
Yardstick automatically install and configure Trex traffic generator on TG host based on provided POD file (see below). Anyway, it’s recommended to check the compatibility of the installed NIC on the TG server with software Trex using the manual at https://trex-tgn.cisco.com/trex/doc/trex_manual.html.
There is an example of Sample VNF test case ready to be executed in an
OpenStack environment with SR-IOV support: samples/vnf_samples/nsut/vfw/
tc_heat_sriov_external_rfc2544_ipv4_1rule_1flow_64B_trex.yaml.
Install yardstick using Install Yardstick (NSB Testing) steps for OpenStack context.
Create pod file for TG in the yardstick repo folder located in the yardstick container:
Note
The ip, user, password and vpci fields show be changed
according to HW environment used for the testing. Use lshw -c network -businfo
command to get the PF PCI address for vpci field.
nodes:
-
name: trafficgen_1
role: tg__0
ip: <TG-HOST-IP>
user: <TG-USER>
password: <TG-PASS>
interfaces:
xe0: # logical name from topology.yaml and vnfd.yaml
vpci: "0000:18:00.0"
driver: i40e # default kernel driver
dpdk_port_num: 0
local_ip: "10.1.1.150"
netmask: "255.255.255.0"
local_mac: "00:00:00:00:00:01"
xe1: # logical name from topology.yaml and vnfd.yaml
vpci: "0000:18:00.1"
driver: i40e # default kernel driver
dpdk_port_num: 1
local_ip: "10.1.1.151"
netmask: "255.255.255.0"
local_mac: "00:00:00:00:00:02"
Run the Sample vFW RFC2544 SR-IOV TC (samples/vnf_samples/nsut/vfw/
tc_heat_sriov_external_rfc2544_ipv4_1rule_1flow_64B_trex.yaml) in the heat
context using steps described in NS testing - using yardstick CLI section.
+----------------------------+ +----------------------------+
|OpenStack(DevStack) | |OpenStack(DevStack) |
| | | |
| +--------------------+ | | +--------------------+ |
| |sample-VNF VM | | | |sample-VNF VM | |
| | | | | | | |
| | TG | | | | DUT | |
| | trafficgen_1 | | | | (VNF) | |
| | | | | | | |
| +--------+ +--------+ | | +--------+ +--------+ |
| | VF NIC | | VF NIC | | | | VF NIC | | VF NIC | |
| +----+---+--+----+---+ | | +-----+--+--+----+---+ |
| ^ ^ | | ^ ^ |
| | | | | | | |
+--------+-----------+-------+ +---------+----------+-------+
| VF0 VF1 | | VF0 VF1 |
| ^ ^ | | ^ ^ |
| | SUT2 | | | | SUT1 | |
| | +-------+ (PF0)<----->(PF0) +---------+ | |
| | | | | |
| +-------------------+ (PF1)<----->(PF1) +--------------------+ |
| | | |
+----------------------------+ +----------------------------+
host2 (compute) host1 (controller)
Pre-configuration of the controller and compute hosts are the same as described in Host pre-configuration section. Follow the steps in the section.
Use official Devstack
documentation to install OpenStack on a host. Please note, that stable
pike branch of devstack repo should be used during the installation.
The required local.conf` configuration file are described below.
Note
Update the devstack configuration files by replacing angluar brackets with a short description inside.
Note
Use lspci | grep Ether & lspci -n | grep <PCI ADDRESS>
commands to get device and vendor id of the virtual function (VF).
DevStack configuration file for controller host:
[[local|localrc]]
HOST_IP=<HOST_IP_ADDRESS>
ADMIN_PASSWORD=password
MYSQL_PASSWORD=$ADMIN_PASSWORD
DATABASE_PASSWORD=$ADMIN_PASSWORD
RABBIT_PASSWORD=$ADMIN_PASSWORD
SERVICE_PASSWORD=$ADMIN_PASSWORD
HORIZON_PASSWORD=$ADMIN_PASSWORD
# Controller node
SERVICE_HOST=$HOST_IP
MYSQL_HOST=$SERVICE_HOST
RABBIT_HOST=$SERVICE_HOST
GLANCE_HOSTPORT=$SERVICE_HOST:9292
# Internet access.
RECLONE=False
PIP_UPGRADE=True
IP_VERSION=4
# Services
disable_service n-net
ENABLED_SERVICES+=,q-svc,q-dhcp,q-meta,q-agt,q-sriov-agt
# Heat
enable_plugin heat https://git.openstack.org/openstack/heat stable/pike
# Neutron
enable_plugin neutron https://git.openstack.org/openstack/neutron.git stable/pike
# Neutron Options
FLOATING_RANGE=<RANGE_IN_THE_PUBLIC_INTERFACE_NETWORK>
Q_FLOATING_ALLOCATION_POOL=start=<START_IP_ADDRESS>,end=<END_IP_ADDRESS>
PUBLIC_NETWORK_GATEWAY=<PUBLIC_NETWORK_GATEWAY>
PUBLIC_INTERFACE=<PUBLIC INTERFACE>
# ML2 Configuration
Q_PLUGIN=ml2
Q_ML2_PLUGIN_MECHANISM_DRIVERS=openvswitch,sriovnicswitch
Q_ML2_PLUGIN_TYPE_DRIVERS=vlan,flat,local,vxlan,gre,geneve
# Open vSwitch provider networking configuration
Q_USE_PROVIDERNET_FOR_PUBLIC=True
OVS_PHYSICAL_BRIDGE=br-ex
OVS_BRIDGE_MAPPINGS=public:br-ex
PHYSICAL_DEVICE_MAPPINGS=physnet1:<PF0_IFNAME>,physnet2:<PF1_IFNAME>
PHYSICAL_NETWORK=physnet1,physnet2
[[post-config|$NOVA_CONF]]
[DEFAULT]
scheduler_default_filters=RamFilter,ComputeFilter,AvailabilityZoneFilter,ComputeCapabilitiesFilter,ImagePropertiesFilter,PciPassthroughFilter
# Whitelist PCI devices
pci_passthrough_whitelist = {\\"devname\\": \\"<PF0_IFNAME>\\", \\"physical_network\\": \\"physnet1\\" }
pci_passthrough_whitelist = {\\"devname\\": \\"<PF1_IFNAME>\\", \\"physical_network\\": \\"physnet2\\" }
[libvirt]
cpu_mode = host-model
# ML2 plugin bits for SR-IOV enablement of Intel Corporation XL710/X710 Virtual Function
[[post-config|/$Q_PLUGIN_CONF_FILE]]
[ml2_sriov]
agent_required = True
supported_pci_vendor_devs = <VF_DEV_ID:VF_VEN_ID>
DevStack configuration file for compute host:
[[local|localrc]]
HOST_IP=<HOST_IP_ADDRESS>
MYSQL_PASSWORD=password
DATABASE_PASSWORD=password
RABBIT_PASSWORD=password
ADMIN_PASSWORD=password
SERVICE_PASSWORD=password
HORIZON_PASSWORD=password
# Controller node
SERVICE_HOST=<CONTROLLER_IP_ADDRESS>
MYSQL_HOST=$SERVICE_HOST
RABBIT_HOST=$SERVICE_HOST
GLANCE_HOSTPORT=$SERVICE_HOST:9292
# Internet access.
RECLONE=False
PIP_UPGRADE=True
IP_VERSION=4
# Neutron
enable_plugin neutron https://git.openstack.org/openstack/neutron.git stable/pike
# Services
ENABLED_SERVICES=n-cpu,rabbit,q-agt,placement-api,q-sriov-agt
# Neutron Options
PUBLIC_INTERFACE=<PUBLIC INTERFACE>
# ML2 Configuration
Q_PLUGIN=ml2
Q_ML2_PLUGIN_MECHANISM_DRIVERS=openvswitch,sriovnicswitch
Q_ML2_PLUGIN_TYPE_DRIVERS=vlan,flat,local,vxlan,gre,geneve
# Open vSwitch provider networking configuration
PHYSICAL_DEVICE_MAPPINGS=physnet1:<PF0_IFNAME>,physnet2:<PF1_IFNAME>
[[post-config|$NOVA_CONF]]
[DEFAULT]
scheduler_default_filters=RamFilter,ComputeFilter,AvailabilityZoneFilter,ComputeCapabilitiesFilter,ImagePropertiesFilter,PciPassthroughFilter
# Whitelist PCI devices
pci_passthrough_whitelist = {\\"devname\\": \\"<PF0_IFNAME>\\", \\"physical_network\\": \\"physnet1\\" }
pci_passthrough_whitelist = {\\"devname\\": \\"<PF1_IFNAME>\\", \\"physical_network\\": \\"physnet2\\" }
[libvirt]
cpu_mode = host-model
# ML2 plugin bits for SR-IOV enablement of Intel Corporation XL710/X710 Virtual Function
[[post-config|/$Q_PLUGIN_CONF_FILE]]
[ml2_sriov]
agent_required = True
supported_pci_vendor_devs = <VF_DEV_ID:VF_VEN_ID>
Start the devstack installation on the controller and compute hosts.
Install yardstick using Install Yardstick (NSB Testing) steps for OpenStack context.
Run sample vFW RFC2544 SR-IOV TC (samples/vnf_samples/nsut/vfw/
tc_heat_rfc2544_ipv4_1rule_1flow_64B_trex.yaml) in the heat
context using steps described in NS testing - using yardstick CLI section
and the following yardtick command line arguments:
yardstick -d task start --task-args='{"provider": "sriov"}' \
samples/vnf_samples/nsut/vfw/tc_heat_rfc2544_ipv4_1rule_1flow_64B_trex.yaml
<IxLoadTclApi verson>Linux64.bin.tgz and
<IxOS version>Linux64.bin.tar.gz (Download from ixia support site)
Install - <IxLoadTclApi verson>Linux64.bin.tgz and
<IxOS version>Linux64.bin.tar.gz
If the installation was not done inside the container, after installing
the IXIA client, check /opt/ixia/ixload/<ver>/bin/ixloadpython and make
sure you can run this cmd inside the yardstick container. Usually user is
required to copy or link /opt/ixia/python/<ver>/bin/ixiapython to
/usr/bin/ixiapython<ver> inside the container.pod_ixia.yaml file with ixia details.cp <repo>/etc/yardstick/nodes/pod.yaml.nsb.sample.ixia etc/yardstick/nodes/pod_ixia.yamlConfig
pod_ixia.yamlnodes: - name: trafficgen_1 role: IxNet ip: 1.2.1.1 #ixia machine ip user: user password: r00t key_filename: /root/.ssh/id_rsa tg_config: ixchassis: "1.2.1.7" #ixia chassis ip tcl_port: "8009" # tcl server port lib_path: "/opt/ixia/ixos-api/8.01.0.2/lib/ixTcl1.0" root_dir: "/opt/ixia/ixos-api/8.01.0.2/" py_bin_path: "/opt/ixia/ixload/8.01.106.3/bin/" dut_result_dir: "/mnt/ixia" version: 8.1 interfaces: xe0: # logical name from topology.yaml and vnfd.yaml vpci: "2:5" # Card:port driver: "none" dpdk_port_num: 0 local_ip: "152.16.100.20" netmask: "255.255.0.0" local_mac: "00:98:10:64:14:00" xe1: # logical name from topology.yaml and vnfd.yaml vpci: "2:6" # [(Card, port)] driver: "none" dpdk_port_num: 1 local_ip: "152.40.40.20" netmask: "255.255.0.0" local_mac: "00:98:28:28:14:00"for sriov/ovs_dpdk pod files, please refer to above Standalone Virtualization for ovs-dpdk/sriov configuration
Start->Programs->Ixia->IxOS->IxOS 8.01-GA-Patch1->Ixia Tcl Server IxOS 8.01-GA-Patch1
or
"C:\Program Files (x86)\Ixia\IxOS\8.01-GA-Patch1\ixTclServer.exe"Results in c:and share the folder on the network.<repo>/samples/vnf_samples/nsut/vfw/tc_baremetal_http_ixload_1b_Requests-65000_Concurrency.yamlIxNetwork testcases use IxNetwork API Python Bindings module, which is installed as part of the requirements of the project.
pod_ixia.yaml file with ixia details.cp <repo>/etc/yardstick/nodes/pod.yaml.nsb.sample.ixia etc/yardstick/nodes/pod_ixia.yamlConfig pod_ixia.yaml
nodes: - name: trafficgen_1 role: IxNet ip: 1.2.1.1 #ixia machine ip user: user password: r00t key_filename: /root/.ssh/id_rsa tg_config: ixchassis: "1.2.1.7" #ixia chassis ip tcl_port: "8009" # tcl server port lib_path: "/opt/ixia/ixos-api/8.01.0.2/lib/ixTcl1.0" root_dir: "/opt/ixia/ixos-api/8.01.0.2/" py_bin_path: "/opt/ixia/ixload/8.01.106.3/bin/" dut_result_dir: "/mnt/ixia" version: 8.1 interfaces: xe0: # logical name from topology.yaml and vnfd.yaml vpci: "2:5" # Card:port driver: "none" dpdk_port_num: 0 local_ip: "152.16.100.20" netmask: "255.255.0.0" local_mac: "00:98:10:64:14:00" xe1: # logical name from topology.yaml and vnfd.yaml vpci: "2:6" # [(Card, port)] driver: "none" dpdk_port_num: 1 local_ip: "152.40.40.20" netmask: "255.255.0.0" local_mac: "00:98:28:28:14:00"for sriov/ovs_dpdk pod files, please refer to above Standalone Virtualization for ovs-dpdk/sriov configuration
Start IxNetwork TCL Server You will also need to configure the IxNetwork machine to start the IXIA IxNetworkTclServer. This can be started like so:
- Connect to the IxNetwork machine using RDP
- Go to:
Start->Programs->Ixia->IxNetwork->IxNetwork 7.21.893.14 GA->IxNetworkTclServer(orIxNetworkApiServer)
Execute testcase in samplevnf folder e.g.
<repo>/samples/vnf_samples/nsut/vfw/tc_baremetal_rfc2544_ipv4_1rule_1flow_64B_ixia.yaml
NSB test configuration and OpenStack setup requirements
NSB requires certain OpenStack deployment configurations. For optimal VNF characterization using external traffic generators NSB requires provider/external networks.
The VNFs require a clear L2 connect to the external network in order to generate realistic traffic from multiple address ranges and ports.
In order to prevent Neutron from filtering traffic we have to disable Neutron Port Security. We also disable DHCP on the data ports because we are binding the ports to DPDK and do not need DHCP addresses. We also disable gateways because multiple default gateways can prevent SSH access to the VNF from the floating IP. We only want a gateway on the mgmt network
uplink_0:
cidr: '10.1.0.0/24'
gateway_ip: 'null'
port_security_enabled: False
enable_dhcp: 'false'
By default Heat will attach every node to every Neutron network that is created. For scale-out tests we do not want to attach every node to every network.
For each node you can specify which ports are on which network using the network_ports dictionary.
In this example we have TRex xe0 <-> xe0 VNF xe1 <-> xe0 UDP_Replay
vnf_0:
floating_ip: true
placement: "pgrp1"
network_ports:
mgmt:
- mgmt
uplink_0:
- xe0
downlink_0:
- xe1
tg_0:
floating_ip: true
placement: "pgrp1"
network_ports:
mgmt:
- mgmt
uplink_0:
- xe0
# Trex always needs two ports
uplink_1:
- xe1
tg_1:
floating_ip: true
placement: "pgrp1"
network_ports:
mgmt:
- mgmt
downlink_0:
- xe0
The configuration of the availability zone is requred in cases where location of exact compute host/group of compute hosts needs to be specified for SampleVNF or traffic generator in the heat test case. If this is the case, please follow the instructions below.
Create a host aggregate in the OpenStack and add the available compute hosts into the aggregate group.
Note
Change the <AZ_NAME> (availability zone name), <AGG_NAME>
(host aggregate name) and <HOST> (host name of one of the compute) in the
commands below.
# create host aggregate
openstack aggregate create --zone <AZ_NAME> --property availability_zone=<AZ_NAME> <AGG_NAME>
# show available hosts
openstack compute service list --service nova-compute
# add selected host into the host aggregate
openstack aggregate add host <AGG_NAME> <HOST>
To specify the OpenStack location (the exact compute host or group of the hosts)
of SampleVNF or traffic generator in the heat test case, the availability_zone server
configuration option should be used. For example:
Note
The <AZ_NAME> (availability zone name) should be changed according
to the name used during the host aggregate creation steps above.
context:
name: yardstick
image: yardstick-samplevnfs
...
servers:
vnf__0:
...
availability_zone: <AZ_NAME>
...
tg__0:
...
availability_zone: <AZ_NAME>
...
networks:
...
There are two example of SampleVNF scale out test case which use the availability zone feature to specify the exact location of scaled VNFs and traffic generators.
Those are:
<repo>/samples/vnf_samples/nsut/prox/tc_prox_heat_context_l2fwd_multiflow-2-scale-out.yaml
<repo>/samples/vnf_samples/nsut/vfw/tc_heat_rfc2544_ipv4_1rule_1flow_64B_trex_scale_out.yaml
Note
This section describes the PROX scale-out testcase, but the same procedure is used for the vFW test case.
Before running the scale-out test case, make sure the host aggregates are configured in the OpenStack environment. To check this, run the following command:
# show configured host aggregates (example)
openstack aggregate list
+----+------+-------------------+
| ID | Name | Availability Zone |
+----+------+-------------------+
| 4 | agg0 | AZ_NAME_0 |
| 5 | agg1 | AZ_NAME_1 |
+----+------+-------------------+
If no host aggregates are configured, please use steps above to configure them.
Run the SampleVNF PROX scale-out test case, specifying the availability zone of each VNF and traffic generator as a task arguments.
Note
The az_0 and az_1 should be changed according to the host
aggregates created in the OpenStack.
yardstick -d task start\
<repo>/samples/vnf_samples/nsut/prox/tc_prox_heat_context_l2fwd_multiflow-2-scale-out.yaml\
--task-args='{
"num_vnfs": 4, "availability_zone": {
"vnf_0": "az_0", "tg_0": "az_1",
"vnf_1": "az_0", "tg_1": "az_1",
"vnf_2": "az_0", "tg_2": "az_1",
"vnf_3": "az_0", "tg_3": "az_1"
}
}'
num_vnfs specifies how many VNFs are going to be deployed in the
heat contexts. vnf_X and tg_X arguments configure the
availability zone where the VNF and traffic generator is going to be deployed.
NSB can collect KPIs from collected. We have support for various plugins enabled by the Barometer project.
The default yardstick-samplevnf has collectd installed. This allows for collecting KPIs from the VNF.
Collecting KPIs from the NFVi is more complicated and requires manual setup. We assume that collectd is not installed on the compute nodes.
To collectd KPIs from the NFVi compute nodes:
- install_collectd on the compute nodes
- create pod.yaml for the compute nodes
- enable specific plugins depending on the vswitch and DPDK
example pod.yaml section for Compute node running collectd.
-
name: "compute-1"
role: Compute
ip: "10.1.2.3"
user: "root"
ssh_port: "22"
password: ""
collectd:
interval: 5
plugins:
# for libvirtd stats
virt: {}
intel_pmu: {}
ovs_stats:
# path to OVS socket
ovs_socket_path: /var/run/openvswitch/db.sock
intel_rdt: {}
VNFs performance data with scale-up
- Helps to figure out optimal number of cores specification in the Virtual Machine template creation or VNF
- Helps in comparison between different VNF vendor offerings
- Better the scale-up index, indicates the performance scalability of a particular solution
For VNF scale-up tests we increase the number for VNF worker threads. In the case of VNFs we also need to increase the number of VCPUs and memory allocated to the VNF.
An example scale-up Heat testcase is:
# Copyright (c) 2016-2018 Intel Corporation
#
# Licensed under the Apache License, Version 2.0 (the "License");
# you may not use this file except in compliance with the License.
# You may obtain a copy of the License at
#
# http://www.apache.org/licenses/LICENSE-2.0
#
# Unless required by applicable law or agreed to in writing, software
# distributed under the License is distributed on an "AS IS" BASIS,
# WITHOUT WARRANTIES OR CONDITIONS OF ANY KIND, either express or implied.
# See the License for the specific language governing permissions and
# limitations under the License.
{% set mem = mem or 20480 %}
{% set vcpus = vcpus or 10 %}
{% set vports = vports or 2 %}
---
schema: yardstick:task:0.1
scenarios:
- type: NSPerf
traffic_profile: ../../traffic_profiles/ipv4_throughput-scale-up.yaml
extra_args:
vports: {{ vports }}
topology: vfw-tg-topology-scale-up.yaml
nodes:
tg__0: tg_0.yardstick
vnf__0: vnf_0.yardstick
options:
framesize:
uplink: {64B: 100}
downlink: {64B: 100}
flow:
src_ip: [
{% for vport in range(0,vports,2|int) %}
{'tg__0': 'xe{{vport}}'},
{% endfor %} ]
dst_ip: [
{% for vport in range(1,vports,2|int) %}
{'tg__0': 'xe{{vport}}'},
{% endfor %} ]
count: 1
traffic_type: 4
rfc2544:
allowed_drop_rate: 0.0001 - 0.0001
vnf__0:
rules: acl_1rule.yaml
vnf_config: {lb_config: 'SW', file: vfw_vnf_pipeline_cores_{{vcpus}}_ports_{{vports}}_lb_1_sw.conf }
runner:
type: Iteration
iterations: 10
interval: 35
context:
# put node context first, so we don't HEAT deploy if node has errors
name: yardstick
image: yardstick-samplevnfs
flavor:
vcpus: {{ vcpus }}
ram: {{ mem }}
disk: 6
extra_specs:
hw:cpu_sockets: 1
hw:cpu_cores: {{ vcpus }}
hw:cpu_threads: 1
user: ubuntu
placement_groups:
pgrp1:
policy: "availability"
servers:
tg_0:
floating_ip: true
placement: "pgrp1"
vnf_0:
floating_ip: true
placement: "pgrp1"
networks:
mgmt:
cidr: '10.0.1.0/24'
{% for vport in range(1,vports,2|int) %}
uplink_{{loop.index0}}:
cidr: '10.1.{{vport}}.0/24'
gateway_ip: 'null'
port_security_enabled: False
enable_dhcp: 'false'
downlink_{{loop.index0}}:
cidr: '10.1.{{vport+1}}.0/24'
gateway_ip: 'null'
port_security_enabled: False
enable_dhcp: 'false'
{% endfor %}
This testcase template requires specifying the number of VCPUs, Memory and Ports.
We set the VCPUs and memory using the --task-args options
yardstick task start --task-args='{"mem": 10480, "vcpus": 4, "vports": 2}' \
samples/vnf_samples/nsut/vfw/tc_heat_rfc2544_ipv4_1rule_1flow_64B_trex_scale-up.yaml
In order to support ports scale-up, traffic and topology templates need to be used in testcase.
A example topology template is:
# Copyright (c) 2016-2018 Intel Corporation
#
# Licensed under the Apache License, Version 2.0 (the "License");
# you may not use this file except in compliance with the License.
# You may obtain a copy of the License at
#
# http://www.apache.org/licenses/LICENSE-2.0
#
# Unless required by applicable law or agreed to in writing, software
# distributed under the License is distributed on an "AS IS" BASIS,
# WITHOUT WARRANTIES OR CONDITIONS OF ANY KIND, either express or implied.
# See the License for the specific language governing permissions and
# limitations under the License.
---
{% set vports = get(extra_args, 'vports', '2') %}
nsd:nsd-catalog:
nsd:
- id: 3tg-topology
name: 3tg-topology
short-name: 3tg-topology
description: 3tg-topology
constituent-vnfd:
- member-vnf-index: '1'
vnfd-id-ref: tg__0
VNF model: ../../vnf_descriptors/tg_rfc2544_tpl.yaml #VNF type
- member-vnf-index: '2'
vnfd-id-ref: vnf__0
VNF model: ../../vnf_descriptors/vfw_vnf.yaml #VNF type
vld:
{% for vport in range(0,vports,2|int) %}
- id: uplink_{{loop.index0}}
name: tg__0 to vnf__0 link {{vport + 1}}
type: ELAN
vnfd-connection-point-ref:
- member-vnf-index-ref: '1'
vnfd-connection-point-ref: xe{{vport}}
vnfd-id-ref: tg__0
- member-vnf-index-ref: '2'
vnfd-connection-point-ref: xe{{vport}}
vnfd-id-ref: vnf__0
- id: downlink_{{loop.index0}}
name: vnf__0 to tg__0 link {{vport + 2}}
type: ELAN
vnfd-connection-point-ref:
- member-vnf-index-ref: '2'
vnfd-connection-point-ref: xe{{vport+1}}
vnfd-id-ref: vnf__0
- member-vnf-index-ref: '1'
vnfd-connection-point-ref: xe{{vport+1}}
vnfd-id-ref: tg__0
{% endfor %}
This template has vports as an argument. To pass this argument it needs to
be configured in extra_args scenario definition. Please note that more
argument can be defined in that section. All of them will be passed to topology
and traffic profile templates
For example:
schema: yardstick:task:0.1
scenarios:
- type: NSPerf
traffic_profile: ../../traffic_profiles/ipv4_throughput-scale-up.yaml
extra_args:
vports: {{ vports }}
topology: vfw-tg-topology-scale-up.yaml
A example traffic profile template is:
# Copyright (c) 2016-2018 Intel Corporation
#
# Licensed under the Apache License, Version 2.0 (the "License");
# you may not use this file except in compliance with the License.
# You may obtain a copy of the License at
#
# http://www.apache.org/licenses/LICENSE-2.0
#
# Unless required by applicable law or agreed to in writing, software
# distributed under the License is distributed on an "AS IS" BASIS,
# WITHOUT WARRANTIES OR CONDITIONS OF ANY KIND, either express or implied.
# See the License for the specific language governing permissions and
# limitations under the License.
# flow definition for ACL tests - 1K flows - ipv4 only
#
# the number of flows defines the widest range of parameters
# for example if srcip_range=1.0.0.1-1.0.0.255 and dst_ip_range=10.0.0.1-10.0.1.255
# and it should define only 16 flows
#
# there is assumption that packets generated will have a random sequences of following addresses pairs
# in the packets
# 1. src=1.x.x.x(x.x.x =random from 1..255) dst=10.x.x.x (random from 1..512)
# 2. src=1.x.x.x(x.x.x =random from 1..255) dst=10.x.x.x (random from 1..512)
# ...
# 512. src=1.x.x.x(x.x.x =random from 1..255) dst=10.x.x.x (random from 1..512)
#
# not all combination should be filled
# Any other field with random range will be added to flow definition
#
# the example.yaml provides all possibilities for traffic generation
#
# the profile defines a public and private side to make limited traffic correlation
# between private and public side same way as it is made by IXIA solution.
#
{% set vports = get(extra_args, 'vports', '2') %}
---
schema: "nsb:traffic_profile:0.1"
# This file is a template, it will be filled with values from tc.yaml before passing to the traffic generator
name: rfc2544
description: Traffic profile to run RFC2544 latency
traffic_profile:
traffic_type: RFC2544Profile # defines traffic behavior - constant or look for highest possible throughput
frame_rate: 100 # pc of linerate
duration: {{ duration }}
{% set count = 0 %}
{% for vport in range(vports|int) %}
uplink_{{vport}}:
ipv4:
id: {{count + 1 }}
outer_l2:
framesize:
64B: "{{ get(imix, 'imix.uplink.64B', '0') }}"
128B: "{{ get(imix, 'imix.uplink.128B', '0') }}"
256B: "{{ get(imix, 'imix.uplink.256B', '0') }}"
373b: "{{ get(imix, 'imix.uplink.373B', '0') }}"
512B: "{{ get(imix, 'imix.uplink.512B', '0') }}"
570B: "{{ get(imix, 'imix.uplink.570B', '0') }}"
1400B: "{{ get(imix, 'imix.uplink.1400B', '0') }}"
1500B: "{{ get(imix, 'imix.uplink.1500B', '0') }}"
1518B: "{{ get(imix, 'imix.uplink.1518B', '0') }}"
outer_l3v4:
proto: "udp"
srcip4: "{{ get(flow, 'flow.src_ip_{{vport}}', '1.1.1.1-1.1.255.255') }}"
dstip4: "{{ get(flow, 'flow.dst_ip_{{vport}}', '90.90.1.1-90.90.255.255') }}"
count: "{{ get(flow, 'flow.count', '1') }}"
ttl: 32
dscp: 0
outer_l4:
srcport: "{{ get(flow, 'flow.src_port_{{vport}}', '1234-4321') }}"
dstport: "{{ get(flow, 'flow.dst_port_{{vport}}', '2001-4001') }}"
count: "{{ get(flow, 'flow.count', '1') }}"
downlink_{{vport}}:
ipv4:
id: {{count + 2}}
outer_l2:
framesize:
64B: "{{ get(imix, 'imix.downlink.64B', '0') }}"
128B: "{{ get(imix, 'imix.downlink.128B', '0') }}"
256B: "{{ get(imix, 'imix.downlink.256B', '0') }}"
373b: "{{ get(imix, 'imix.downlink.373B', '0') }}"
512B: "{{ get(imix, 'imix.downlink.512B', '0') }}"
570B: "{{ get(imix, 'imix.downlink.570B', '0') }}"
1400B: "{{ get(imix, 'imix.downlink.1400B', '0') }}"
1500B: "{{ get(imix, 'imix.downlink.1500B', '0') }}"
1518B: "{{ get(imix, 'imix.downlink.1518B', '0') }}"
outer_l3v4:
proto: "udp"
srcip4: "{{ get(flow, 'flow.dst_ip_{{vport}}', '90.90.1.1-90.90.255.255') }}"
dstip4: "{{ get(flow, 'flow.src_ip_{{vport}}', '1.1.1.1-1.1.255.255') }}"
count: "{{ get(flow, 'flow.count', '1') }}"
ttl: 32
dscp: 0
outer_l4:
srcport: "{{ get(flow, 'flow.dst_port_{{vport}}', '1234-4321') }}"
dstport: "{{ get(flow, 'flow.src_port_{{vport}}', '2001-4001') }}"
count: "{{ get(flow, 'flow.count', '1') }}"
{% set count = count + 2 %}
{% endfor %}
There is an option to provide predefined config for SampleVNFs. Path to config
file may by specified in vnf_config scenario section.
vnf__0:
rules: acl_1rule.yaml
vnf_config: {lb_config: 'SW', file: vfw_vnf_pipeline_cores_4_ports_2_lb_1_sw.conf }
- Follow above traffic generator section to setup.
- Edit num of threads in
<repo>/samples/vnf_samples/nsut/vfw/tc_baremetal_rfc2544_ipv4_1rule_1flow_64B_trex_scale_up.yamle.g, 6 Threads for given VNF
schema: yardstick:task:0.1
scenarios:
{% for worker_thread in [1, 2 ,3 , 4, 5, 6] %}
- type: NSPerf
traffic_profile: ../../traffic_profiles/ipv4_throughput.yaml
topology: vfw-tg-topology.yaml
nodes:
tg__0: trafficgen_1.yardstick
vnf__0: vnf.yardstick
options:
framesize:
uplink: {64B: 100}
downlink: {64B: 100}
flow:
src_ip: [{'tg__0': 'xe0'}]
dst_ip: [{'tg__0': 'xe1'}]
count: 1
traffic_type: 4
rfc2544:
allowed_drop_rate: 0.0001 - 0.0001
vnf__0:
rules: acl_1rule.yaml
vnf_config: {lb_config: 'HW', lb_count: 1, worker_config: '1C/1T', worker_threads: {{worker_thread}}}
nfvi_enable: True
runner:
type: Iteration
iterations: 10
interval: 35
{% endfor %}
context:
type: Node
name: yardstick
nfvi_type: baremetal
file: /etc/yardstick/nodes/pod.yaml
VNFs performance data with scale-out helps
- in capacity planning to meet the given network node requirements
- in comparison between different VNF vendor offerings
- better the scale-out index, provides the flexibility in meeting future capacity requirements
Scale-out not supported on Baremetal.
cd <repo>/ansible trex: standalone_ovs_scale_out_trex_test.yaml or standalone_sriov_scale_out_trex_test.yaml ixia: standalone_ovs_scale_out_ixia_test.yaml or standalone_sriov_scale_out_ixia_test.yaml ixia_correlated: standalone_ovs_scale_out_ixia_correlated_test.yaml or standalone_sriov_scale_out_ixia_correlated_test.yamlupdate the ovs_dpdk or sriov above Ansible scripts reflect the setup
<repo>/samples/vnf_samples/nsut/tc_sriov_vfw_udp_ixia_correlated_scale_out-1.yaml <repo>/samples/vnf_samples/nsut/tc_sriov_vfw_udp_ixia_correlated_scale_out-2.yaml
There are sample scale-out all-VM Heat tests. These tests only use VMs and don’t use external traffic.
The tests use UDP_Replay and correlated traffic.
<repo>/samples/vnf_samples/nsut/cgnapt/tc_heat_rfc2544_ipv4_1flow_64B_trex_correlated_scale_4.yaml
To run the test you need to increase OpenStack CPU, Memory and Port quotas.
The TRex traffic generator can be setup to use multiple threads per core, this is for multiqueue testing.
TRex does not automatically enable multiple threads because we currently cannot detect the number of queues on a device.
To enable multiple queue set the queues_per_port value in the TG VNF
options section.
scenarios:
- type: NSPerf
nodes:
tg__0: tg_0.yardstick
options:
tg_0:
queues_per_port: 2
NSB supports certain Standalone deployment configurations. Standalone supports provisioning a VM in a standalone visualised environment using kvm/qemu. There two types of Standalone contexts available: OVS-DPDK and SRIOV. OVS-DPDK uses OVS network with DPDK drivers. SRIOV enables network traffic to bypass the software switch layer of the Hyper-V stack.
SampleVNF image is spawned in a VM on a baremetal server. OVS with DPDK is installed on the baremetal server.
Note
Ubuntu 17.10 requires DPDK v.17.05 and higher, DPDK v.17.05 requires OVS v.2.8.0.
Default values for OVS-DPDK:
- queues: 4
- lcore_mask: “”
- pmd_cpu_mask: “0x6”
- Prepare SampleVNF image and copy it to
flavor/images.- Prepare context files for TREX and SampleVNF under
contexts/file.- Add bridge named
br-intto the baremetal where SampleVNF image is deployed.- Modify
networks/phy_portaccordingly to the baremetal setup.- Run test from:
# Copyright (c) 2016-2018 Intel Corporation
#
# Licensed under the Apache License, Version 2.0 (the "License");
# you may not use this file except in compliance with the License.
# You may obtain a copy of the License at
#
# http://www.apache.org/licenses/LICENSE-2.0
#
# Unless required by applicable law or agreed to in writing, software
# distributed under the License is distributed on an "AS IS" BASIS,
# WITHOUT WARRANTIES OR CONDITIONS OF ANY KIND, either express or implied.
# See the License for the specific language governing permissions and
# limitations under the License.
---
schema: yardstick:task:0.1
scenarios:
- type: NSPerf
traffic_profile: ../../traffic_profiles/ipv4_throughput.yaml
topology: acl-tg-topology.yaml
nodes:
tg__0: trafficgen_1.yardstick
vnf__0: vnf__0.yardstick
options:
framesize:
uplink: {64B: 100}
downlink: {64B: 100}
flow:
src_ip: [{'tg__0': 'xe0'}]
dst_ip: [{'tg__0': 'xe1'}]
count: 1
traffic_type: 4
rfc2544:
allowed_drop_rate: 0.0001 - 0.0001
vnf__0:
rules: acl_1rule.yaml
vnf_config: {lb_config: 'SW', lb_count: 1, worker_config: '1C/1T', worker_threads: 1}
runner:
type: Iteration
iterations: 10
interval: 35
contexts:
- name: yardstick
type: Node
file: /etc/yardstick/nodes/standalone/trex_bm.yaml
- type: StandaloneOvsDpdk
name: yardstick
file: /etc/yardstick/nodes/standalone/host_ovs.yaml
vm_deploy: True
ovs_properties:
version:
ovs: 2.7.0
dpdk: 16.11.1
pmd_threads: 2
ram:
socket_0: 2048
socket_1: 2048
queues: 4
lcore_mask: ""
pmd_cpu_mask: "0x6"
vpath: "/usr/local"
flavor:
images: "/var/lib/libvirt/images/yardstick-nsb-image.img"
ram: 16384
extra_specs:
hw:cpu_sockets: 1
hw:cpu_cores: 6
hw:cpu_threads: 2
user: ""
password: ""
servers:
vnf__0:
network_ports:
mgmt:
cidr: '1.1.1.7/24'
xe0:
- uplink_0
xe1:
- downlink_0
networks:
uplink_0:
port_num: 0
phy_port: "0000:05:00.0"
vpci: "0000:00:07.0"
cidr: '152.16.100.10/24'
gateway_ip: '152.16.100.20'
downlink_0:
port_num: 1
phy_port: "0000:05:00.1"
vpci: "0000:00:08.0"
cidr: '152.16.40.10/24'
gateway_ip: '152.16.100.20'
This chapter lists available Yardstick test cases. Yardstick test cases are divided in two main categories:
| Network Performance | |
| test case id | OPNFV_YARDSTICK_TC001_NETWORK PERFORMANCE |
| metric | Number of flows and throughput |
| test purpose | The purpose of TC001 is to evaluate the IaaS network performance with regards to flows and throughput, such as if and how different amounts of flows matter for the throughput between hosts on different compute blades. Typically e.g. the performance of a vSwitch depends on the number of flows running through it. Also performance of other equipment or entities can depend on the number of flows or the packet sizes used. The purpose is also to be able to spot the trends. Test results, graphs and similar shall be stored for comparison reasons and product evolution understanding between different OPNFV versions and/or configurations. |
| test tool | pktgen Linux packet generator is a tool to generate packets at very high speed in the kernel. pktgen is mainly used to drive and LAN equipment test network. pktgen supports multi threading. To generate random MAC address, IP address, port number UDP packets, pktgen uses multiple CPU processors in the different PCI bus (PCI, PCIe bus) with Gigabit Ethernet tested (pktgen performance depends on the CPU processing speed, memory delay, PCI bus speed hardware parameters), Transmit data rate can be even larger than 10GBit/s. Visible can satisfy most card test requirements. (Pktgen is not always part of a Linux distribution, hence it needs to be installed. It is part of the Yardstick Docker image. As an example see the /yardstick/tools/ directory for how to generate a Linux image with pktgen included.) |
| test description | This test case uses Pktgen to generate packet flow between two hosts for simulating network workloads on the SUT. |
| traffic profile | An IP table is setup on server to monitor for received packets. |
| configuration | file: opnfv_yardstick_tc001.yaml Packet size is set to 60 bytes. Number of ports: 10, 50, 100, 500 and 1000, where each runs for 20 seconds. The whole sequence is run twice The client and server are distributed on different hardware. For SLA max_ppm is set to 1000. The amount of configured ports map to between 110 up to 1001000 flows, respectively. |
| applicability | Test can be configured with different:
Default values exist. SLA (optional): max_ppm: The number of packets per million packets sent that are acceptable to loose, not received. |
| usability | This test case is used for generating high network throughput to simulate certain workloads on the SUT. Hence it should work with other test cases. |
| references |
ETSI-NFV-TST001 |
| pre-test conditions | The test case image needs to be installed into Glance with pktgen included in it. No POD specific requirements have been identified. |
| test sequence | description and expected result |
| step 1 | Two host VMs are booted, as server and client. |
| step 2 | Yardstick is connected with the server VM by using ssh. ‘pktgen_benchmark’ bash script is copyied from Jump Host to the server VM via the ssh tunnel. |
| step 3 | An IP table is setup on server to monitor for received packets. |
| step 4 | pktgen is invoked to generate packet flow between two server and client for simulating network workloads on the SUT. Results are processed and checked against the SLA. Logs are produced and stored. Result: Logs are stored. |
| step 5 | Two host VMs are deleted. |
| test verdict | Fails only if SLA is not passed, or if there is a test case execution problem. |
| Network Latency | |
| test case id | OPNFV_YARDSTICK_TC002_NETWORK LATENCY |
| metric | RTT (Round Trip Time) |
| test purpose | The purpose of TC002 is to do a basic verification that network latency is within acceptable boundaries when packets travel between hosts located on same or different compute blades. The purpose is also to be able to spot the trends. Test results, graphs and similar shall be stored for comparison reasons and product evolution understanding between different OPNFV versions and/or configurations. |
| test tool | ping Ping is a computer network administration software utility used to test the reachability of a host on an Internet Protocol (IP) network. It measures the round-trip time for packet sent from the originating host to a destination computer that are echoed back to the source. Ping is normally part of any Linux distribution, hence it doesn’t need to be installed. It is also part of the Yardstick Docker image. (For example also a Cirros image can be downloaded from cirros-image, it includes ping) |
| test topology | Ping packets (ICMP protocol’s mandatory ECHO_REQUEST datagram) are sent from host VM to target VM(s) to elicit ICMP ECHO_RESPONSE. For one host VM there can be multiple target VMs. Host VM and target VM(s) can be on same or different compute blades. |
| configuration | file: opnfv_yardstick_tc002.yaml Packet size 100 bytes. Test duration 60 seconds. One ping each 10 seconds. Test is iterated two times. SLA RTT is set to maximum 10 ms. |
| applicability | This test case can be configured with different:
Default values exist. SLA is optional. The SLA in this test case serves as an example. Considerably lower RTT is expected, and also normal to achieve in balanced L2 environments. However, to cover most configurations, both bare metal and fully virtualized ones, this value should be possible to achieve and acceptable for black box testing. Many real time applications start to suffer badly if the RTT time is higher than this. Some may suffer bad also close to this RTT, while others may not suffer at all. It is a compromise that may have to be tuned for different configuration purposes. |
| usability | This test case is one of Yardstick’s generic test. Thus it is runnable on most of the scenarios. |
| references |
ETSI-NFV-TST001 |
| pre-test conditions | The test case image (cirros-image) needs to be installed into Glance with ping included in it. No POD specific requirements have been identified. |
| test sequence | description and expected result |
| step 1 | Two host VMs are booted, as server and client. |
| step 2 | Yardstick is connected with the server VM by using ssh. ‘ping_benchmark’ bash script is copied from Jump Host to the server VM via the ssh tunnel. |
| step 3 | Ping is invoked. Ping packets are sent from server VM to client VM. RTT results are calculated and checked against the SLA. Logs are produced and stored. Result: Logs are stored. |
| step 4 | Two host VMs are deleted. |
| test verdict | Test should not PASS if any RTT is above the optional SLA value, or if there is a test case execution problem. |
| Cache Utilization | |
| test case id | OPNFV_YARDSTICK_TC004_CACHE Utilization |
| metric | cache hit, cache miss, hit/miss ratio, buffer size and page cache size |
| test purpose | The purpose of TC004 is to evaluate the IaaS compute capability with regards to cache utilization.This test case should be run in parallel with other Yardstick test cases and not run as a stand-alone test case. This test case measures cache usage statistics, including cache hit, cache miss, hit ratio, buffer cache size and page cache size, with some wokloads runing on the infrastructure. Both average and maximun values are collected. The purpose is also to be able to spot the trends. Test results, graphs and similar shall be stored for comparison reasons and product evolution understanding between different OPNFV versions and/or configurations. |
| test tool | cachestat cachestat is a tool using Linux ftrace capabilities for showing Linux page cache hit/miss statistics. (cachestat is not always part of a Linux distribution, hence it needs to be installed. As an example see the /yardstick/tools/ directory for how to generate a Linux image with cachestat included.) |
| test description | cachestat test is invoked in a host VM on a compute blade, cachestat test requires some other test cases running in the host to stimulate workload. |
| configuration | File: cachestat.yaml (in the ‘samples’ directory) Interval is set 1. Test repeat, pausing every 1 seconds in-between. Test durarion is set to 60 seconds. SLA is not available in this test case. |
| applicability | Test can be configured with different:
Default values exist. |
| usability | This test case is one of Yardstick’s generic test. Thus it is runnable on most of the scenarios. |
| references |
ETSI-NFV-TST001 |
| pre-test conditions | The test case image needs to be installed into Glance with cachestat included in the image. No POD specific requirements have been identified. |
| test sequence | description and expected result |
| step 1 | A host VM with cachestat installed is booted. |
| step 2 | Yardstick is connected with the host VM by using ssh. ‘cache_stat’ bash script is copyied from Jump Host to the server VM via the ssh tunnel. |
| step 3 | ‘cache_stat’ script is invoked. Raw cache usage statistics are collected and filtrated. Average and maximum values are calculated and recorded. Logs are produced and stored. Result: Logs are stored. |
| step 4 | The host VM is deleted. |
| test verdict | None. Cache utilization results are collected and stored. |
| Storage Performance | |
| test case id | OPNFV_YARDSTICK_TC005_STORAGE PERFORMANCE |
| metric | IOPS (Average IOs performed per second), Throughput (Average disk read/write bandwidth rate), Latency (Average disk read/write latency) |
| test purpose | The purpose of TC005 is to evaluate the IaaS storage performance with regards to IOPS, throughput and latency. The purpose is also to be able to spot the trends. Test results, graphs and similar shall be stored for comparison reasons and product evolution understanding between different OPNFV versions and/or configurations. |
| test tool | fio fio is an I/O tool meant to be used both for benchmark and stress/hardware verification. It has support for 19 different types of I/O engines (sync, mmap, libaio, posixaio, SG v3, splice, null, network, syslet, guasi, solarisaio, and more), I/O priorities (for newer Linux kernels), rate I/O, forked or threaded jobs, and much more. (fio is not always part of a Linux distribution, hence it needs to be installed. As an example see the /yardstick/tools/ directory for how to generate a Linux image with fio included.) |
| test description | fio test is invoked in a host VM on a compute blade, a job file as well as parameters are passed to fio and fio will start doing what the job file tells it to do. |
| configuration | file: opnfv_yardstick_tc005.yaml IO types is set to read, write, randwrite, randread, rw. IO block size is set to 4KB, 64KB, 1024KB. fio is run for each IO type and IO block size scheme, each iteration runs for 30 seconds (10 for ramp time, 20 for runtime). For SLA, minimum read/write iops is set to 100, minimum read/write throughput is set to 400 KB/s, and maximum read/write latency is set to 20000 usec. |
| applicability | This test case can be configured with different:
Default values exist. SLA is optional. The SLA in this test case serves as an example. Considerably higher throughput and lower latency are expected. However, to cover most configurations, both baremetal and fully virtualized ones, this value should be possible to achieve and acceptable for black box testing. Many heavy IO applications start to suffer badly if the read/write bandwidths are lower than this. |
| usability | This test case is one of Yardstick’s generic test. Thus it is runnable on most of the scenarios. |
| references |
ETSI-NFV-TST001 |
| pre-test conditions | The test case image needs to be installed into Glance with fio included in it. No POD specific requirements have been identified. |
| test sequence | description and expected result |
| step 1 | A host VM with fio installed is booted. |
| step 2 | Yardstick is connected with the host VM by using ssh. ‘fio_benchmark’ bash script is copyied from Jump Host to the host VM via the ssh tunnel. |
| step 3 | ‘fio_benchmark’ script is invoked. Simulated IO operations are started. IOPS, disk read/write bandwidth and latency are recorded and checked against the SLA. Logs are produced and stored. Result: Logs are stored. |
| step 4 | The host VM is deleted. |
| test verdict | Fails only if SLA is not passed, or if there is a test case execution problem. |
| Packet Loss Extended Test | |
| test case id | OPNFV_YARDSTICK_TC008_NW PERF, Packet loss Extended Test |
| metric | Number of flows, packet size and throughput |
| test purpose | To evaluate the IaaS network performance with regards to flows and throughput, such as if and how different amounts of packet sizes and flows matter for the throughput between VMs on different compute blades. Typically e.g. the performance of a vSwitch depends on the number of flows running through it. Also performance of other equipment or entities can depend on the number of flows or the packet sizes used. The purpose is also to be able to spot trends. Test results, graphs ans similar shall be stored for comparison reasons and product evolution understanding between different OPNFV versions and/or configurations. |
| configuration | file: opnfv_yardstick_tc008.yaml Packet size: 64, 128, 256, 512, 1024, 1280 and 1518 bytes. Number of ports: 1, 10, 50, 100, 500 and 1000. The amount of configured ports map from 2 up to 1001000 flows, respectively. Each packet_size/port_amount combination is run ten times, for 20 seconds each. Then the next packet_size/port_amount combination is run, and so on. The client and server are distributed on different HW. For SLA max_ppm is set to 1000. |
| test tool | pktgen (Pktgen is not always part of a Linux distribution, hence it needs to be installed. It is part of the Yardstick Docker image. As an example see the /yardstick/tools/ directory for how to generate a Linux image with pktgen included.) |
| references |
ETSI-NFV-TST001 |
| applicability | Test can be configured with different packet sizes, amount of flows and test duration. Default values exist. SLA (optional): max_ppm: The number of packets per million packets sent that are acceptable to loose, not received. |
| pre-test conditions | The test case image needs to be installed into Glance with pktgen included in it. No POD specific requirements have been identified. |
| test sequence | description and expected result |
| step 1 | The hosts are installed, as server and client. pktgen is invoked and logs are produced and stored. Result: Logs are stored. |
| test verdict | Fails only if SLA is not passed, or if there is a test case execution problem. |
| Packet Loss | |
| test case id | OPNFV_YARDSTICK_TC009_NW PERF, Packet loss |
| metric | Number of flows, packets lost and throughput |
| test purpose | To evaluate the IaaS network performance with regards to flows and throughput, such as if and how different amounts of flows matter for the throughput between VMs on different compute blades. Typically e.g. the performance of a vSwitch depends on the number of flows running through it. Also performance of other equipment or entities can depend on the number of flows or the packet sizes used. The purpose is also to be able to spot trends. Test results, graphs ans similar shall be stored for comparison reasons and product evolution understanding between different OPNFV versions and/or configurations. |
| configuration | file: opnfv_yardstick_tc009.yaml Packet size: 64 bytes Number of ports: 1, 10, 50, 100, 500 and 1000. The amount of configured ports map from 2 up to 1001000 flows, respectively. Each port amount is run ten times, for 20 seconds each. Then the next port_amount is run, and so on. The client and server are distributed on different HW. For SLA max_ppm is set to 1000. |
| test tool | pktgen (Pktgen is not always part of a Linux distribution, hence it needs to be installed. It is part of the Yardstick Docker image. As an example see the /yardstick/tools/ directory for how to generate a Linux image with pktgen included.) |
| references |
ETSI-NFV-TST001 |
| applicability | Test can be configured with different packet sizes, amount of flows and test duration. Default values exist. SLA (optional): max_ppm: The number of packets per million packets sent that are acceptable to loose, not received. |
| pre-test conditions | The test case image needs to be installed into Glance with pktgen included in it. No POD specific requirements have been identified. |
| test sequence | description and expected result |
| step 1 | The hosts are installed, as server and client. pktgen is invoked and logs are produced and stored. Result: logs are stored. |
| test verdict | Fails only if SLA is not passed, or if there is a test case execution problem. |
| Memory Latency | |
| test case id | OPNFV_YARDSTICK_TC010_MEMORY LATENCY |
| metric | Memory read latency (nanoseconds) |
| test purpose | The purpose of TC010 is to evaluate the IaaS compute performance with regards to memory read latency. It measures the memory read latency for varying memory sizes and strides. Whole memory hierarchy is measured. The purpose is also to be able to spot the trends. Test results, graphs and similar shall be stored for comparison reasons and product evolution understanding between different OPNFV versions and/or configurations. |
| test tool | Lmbench Lmbench is a suite of operating system microbenchmarks. This test uses lat_mem_rd tool from that suite including:
(LMbench is not always part of a Linux distribution, hence it needs to be installed. As an example see the /yardstick/tools/ directory for how to generate a Linux image with LMbench included.) |
| test description | LMbench lat_mem_rd benchmark measures memory read latency for varying memory sizes and strides. The benchmark runs as two nested loops. The outer loop is the stride size. The inner loop is the array size. For each array size, the benchmark creates a ring of pointers that point backward one stride.Traversing the array is done by:
in a for loop (the over head of the for loop is not significant; the loop is an unrolled loop 100 loads long). The size of the array varies from 512 bytes to (typically) eight megabytes. For the small sizes, the cache will have an effect, and the loads will be much faster. This becomes much more apparent when the data is plotted. Only data accesses are measured; the instruction cache is not measured. The results are reported in nanoseconds per load and have been verified accurate to within a few nanoseconds on an SGI Indy. |
| configuration | File: opnfv_yardstick_tc010.yaml
SLA is optional. The SLA in this test case serves as an example. Considerably lower read latency is expected. However, to cover most configurations, both baremetal and fully virtualized ones, this value should be possible to achieve and acceptable for black box testing. Many heavy IO applications start to suffer badly if the read latency is higher than this. |
| applicability | Test can be configured with different:
Default values exist. SLA (optional) : max_latency: The maximum memory latency that is accepted. |
| usability | This test case is one of Yardstick’s generic test. Thus it is runnable on most of the scenarios. |
| references | LMbench lat_mem_rd ETSI-NFV-TST001 |
| pre-test conditions | The test case image needs to be installed into Glance with Lmbench included in the image. No POD specific requirements have been identified. |
| test sequence | description and expected result |
| step 1 | The host is installed as client. LMbench’s lat_mem_rd tool is invoked and logs are produced and stored. Result: logs are stored. |
| step 1 | A host VM with LMbench installed is booted. |
| step 2 | Yardstick is connected with the host VM by using ssh. ‘lmbench_latency_benchmark’ bash script is copyied from Jump Host to the host VM via the ssh tunnel. |
| step 3 | ‘lmbench_latency_benchmark’ script is invoked. LMbench’s lat_mem_rd benchmark starts to measures memory read latency for varying memory sizes and strides. Memory read latency are recorded and checked against the SLA. Logs are produced and stored. Result: Logs are stored. |
| step 4 | The host VM is deleted. |
| test verdict | Test fails if the measured memory latency is above the SLA value or if there is a test case execution problem. |
| Packet delay variation between VMs | |
| test case id | OPNFV_YARDSTICK_TC011_PACKET DELAY VARIATION BETWEEN VMs |
| metric | jitter: packet delay variation (ms) |
| test purpose | The purpose of TC011 is to evaluate the IaaS network performance with regards to network jitter (packet delay variation). It measures the packet delay variation sending the packets from one VM to the other. The purpose is also to be able to spot the trends. Test results, graphs and similar shall be stored for comparison reasons and product evolution understanding between different OPNFV versions and/or configurations. |
| test tool | iperf3 iPerf3 is a tool for active measurements of the maximum achievable bandwidth on IP networks. It supports tuning of various parameters related to timing, buffers and protocols. The UDP protocols can be used to measure jitter delay. (iperf3 is not always part of a Linux distribution, hence it needs to be installed. It is part of the Yardstick Docker image. As an example see the /yardstick/tools/ directory for how to generate a Linux image with pktgen included.) |
| test description | iperf3 test is invoked between a host VM and a target VM. Jitter calculations are continuously computed by the server, as specified by RTP in RFC 1889. The client records a 64 bit second/microsecond timestamp in the packet. The server computes the relative transit time as (server’s receive time - client’s send time). The client’s and server’s clocks do not need to be synchronized; any difference is subtracted outin the jitter calculation. Jitter is the smoothed mean of differences between consecutive transit times. |
| configuration | File: opnfv_yardstick_tc011.yaml
|
| applicability | Test can be configured with different:
|
| usability | This test case is one of Yardstick’s generic test. Thus it is runnable on most of the scenarios. |
| references |
ETSI-NFV-TST001 |
| pre-test conditions | The test case image needs to be installed into Glance with iperf3 included in the image. No POD specific requirements have been identified. |
| test sequence | description and expected result |
| step 1 | Two host VMs with iperf3 installed are booted, as server and client. |
| step 2 | Yardstick is connected with the host VM by using ssh. A iperf3 server is started on the server VM via the ssh tunnel. |
| step 3 | iperf3 benchmark is invoked. Jitter is calculated and check against the SLA. Logs are produced and stored. Result: Logs are stored. |
| step 4 | The host VMs are deleted. |
| test verdict | Test should not PASS if any jitter is above the optional SLA value, or if there is a test case execution problem. |
| Memory Bandwidth | |
| test case id | OPNFV_YARDSTICK_TC012_MEMORY BANDWIDTH |
| metric | Memory read/write bandwidth (MBps) |
| test purpose | The purpose of TC012 is to evaluate the IaaS compute performance with regards to memory throughput. It measures the rate at which data can be read from and written to the memory (this includes all levels of memory). The purpose is also to be able to spot the trends. Test results, graphs and similar shall be stored for comparison reasons and product evolution understanding between different OPNFV versions and/or configurations. |
| test tool | LMbench LMbench is a suite of operating system microbenchmarks. This test uses bw_mem tool from that suite including:
(LMbench is not always part of a Linux distribution, hence it needs to be installed. As an example see the /yardstick/tools/ directory for how to generate a Linux image with LMbench included.) |
| test description | LMbench bw_mem benchmark allocates twice the specified amount of memory, zeros it, and then times the copying of the first half to the second half. The benchmark is invoked in a host VM on a compute blade. Results are reported in megabytes moved per second. |
| configuration | File: opnfv_yardstick_tc012.yaml
SLA is optional. The SLA in this test case serves as an example. Considerably higher bandwidth is expected. However, to cover most configurations, both baremetal and fully virtualized ones, this value should be possible to achieve and acceptable for black box testing. Many heavy IO applications start to suffer badly if the read/write bandwidths are lower than this. |
| applicability | Test can be configured with different:
Default values exist. SLA (optional) : min_bandwidth: The minimun memory bandwidth that is accepted. |
| usability | This test case is one of Yardstick’s generic test. Thus it is runnable on most of the scenarios. |
| references | LMbench bw_mem ETSI-NFV-TST001 |
| pre-test conditions | The test case image needs to be installed into Glance with Lmbench included in the image. No POD specific requirements have been identified. |
| test sequence | description and expected result |
| step 1 | A host VM with LMbench installed is booted. |
| step 2 | Yardstick is connected with the host VM by using ssh. “lmbench_bandwidth_benchmark” bash script is copied from Jump Host to the host VM via ssh tunnel. |
| step 3 | ‘lmbench_bandwidth_benchmark’ script is invoked. LMbench’s bw_mem benchmark starts to measures memory read/write bandwidth. Memory read/write bandwidth results are recorded and checked against the SLA. Logs are produced and stored. Result: Logs are stored. |
| step 4 | The host VM is deleted. |
| test verdict | Test fails if the measured memory bandwidth is below the SLA value or if there is a test case execution problem. |
| Processing speed | |
| test case id | OPNFV_YARDSTICK_TC014_PROCESSING SPEED |
| metric | score of single cpu running, score of parallel running |
| test purpose | The purpose of TC014 is to evaluate the IaaS compute performance with regards to CPU processing speed. It measures score of single cpu running and parallel running. The purpose is also to be able to spot the trends. Test results, graphs and similar shall be stored for comparison reasons and product evolution understanding between different OPNFV versions and/or configurations. |
| test tool | UnixBench Unixbench is the most used CPU benchmarking software tool. It can measure the performance of bash scripts, CPUs in multithreading and single threading. It can also measure the performance for parallel taks. Also, specific disk IO for small and large files are performed. You can use it to measure either linux dedicated servers and linux vps servers, running CentOS, Debian, Ubuntu, Fedora and other distros. (UnixBench is not always part of a Linux distribution, hence it needs to be installed. As an example see the /yardstick/tools/ directory for how to generate a Linux image with UnixBench included.) |
| test description | The UnixBench runs system benchmarks in a host VM on a compute blade, getting information on the CPUs in the system. If the system has more than one CPU, the tests will be run twice – once with a single copy of each test running at once, and once with N copies, where N is the number of CPUs. UnixBench will processs a set of results from a single test by averaging the individal pass results into a single final value. |
| configuration | file: opnfv_yardstick_tc014.yaml run_mode: Run unixbench in quiet mode or verbose mode test_type: dhry2reg, whetstone and so on For SLA with single_score and parallel_score, both can be set by user, default is NA. |
| applicability | Test can be configured with different:
Default values exist. SLA (optional) : min_score: The minimun UnixBench score that is accepted. |
| usability | This test case is one of Yardstick’s generic test. Thus it is runnable on most of the scenarios. |
| references |
ETSI-NFV-TST001 |
| pre-test conditions | The test case image needs to be installed into Glance with unixbench included in it. No POD specific requirements have been identified. |
| test sequence | description and expected result |
| step 1 | A host VM with UnixBench installed is booted. |
| step 2 | Yardstick is connected with the host VM by using ssh. “unixbench_benchmark” bash script is copied from Jump Host to the host VM via ssh tunnel. |
| step 3 | UnixBench is invoked. All the tests are executed using the “Run” script in the top-level of UnixBench directory. The “Run” script will run a standard “index” test, and save the report in the “results” directory. Then the report is processed by “unixbench_benchmark” and checked againsted the SLA. Result: Logs are stored. |
| step 4 | The host VM is deleted. |
| test verdict | Fails only if SLA is not passed, or if there is a test case execution problem. |
| CPU Load | |
| test case id | OPNFV_YARDSTICK_TC024_CPU Load |
| metric | CPU load |
| test purpose | To evaluate the CPU load performance of the IaaS. This test case should be run in parallel to other Yardstick test cases and not run as a stand-alone test case. Average, minimum and maximun values are obtained. The purpose is also to be able to spot trends. Test results, graphs and similar shall be stored for comparison reasons and product evolution understanding between different OPNFV versions and/or configurations. |
| configuration | file: cpuload.yaml (in the ‘samples’ directory)
|
| test tool | mpstat (mpstat is not always part of a Linux distribution, hence it needs to be installed. It is part of the Yardstick Glance image. However, if mpstat is not present the TC instead uses /proc/stats as source to produce “mpstat” output. |
| references | man-pages |
| applicability | Test can be configured with different:
There are default values for each above-mentioned option. Run in background with other test cases. |
| pre-test conditions | The test case image needs to be installed into Glance with mpstat included in it. No POD specific requirements have been identified. |
| test sequence | description and expected result |
| step 1 | The host is installed. The related TC, or TCs, is invoked and mpstat logs are produced and stored. Result: Stored logs |
| test verdict | None. CPU load results are fetched and stored. |
| Latency, CPU Load, Throughput, Packet Loss | |
| test case id | OPNFV_YARDSTICK_TC037_LATENCY,CPU LOAD,THROUGHPUT, PACKET LOSS |
| metric | Number of flows, latency, throughput, packet loss CPU utilization percentage, CPU interrupt per second |
| test purpose | The purpose of TC037 is to evaluate the IaaS compute capacity and network performance with regards to CPU utilization, packet flows and network throughput, such as if and how different amounts of flows matter for the throughput between hosts on different compute blades, and the CPU load variation. Typically e.g. the performance of a vSwitch depends on the number of flows running through it. Also performance of other equipment or entities can depend on the number of flows or the packet sizes used The purpose is also to be able to spot the trends. Test results, graphs and similar shall be stored for comparison reasons and product evolution understanding between different OPNFV versions and/or configurations. |
| test tool | Ping, Pktgen, mpstat Ping is a computer network administration software utility used to test the reachability of a host on an Internet Protocol (IP) network. It measures the round-trip time for packet sent from the originating host to a destination computer that are echoed back to the source. Linux packet generator is a tool to generate packets at very high speed in the kernel. pktgen is mainly used to drive and LAN equipment test network. pktgen supports multi threading. To generate random MAC address, IP address, port number UDP packets, pktgen uses multiple CPU processors in the different PCI bus (PCI, PCIe bus) with Gigabit Ethernet tested (pktgen performance depends on the CPU processing speed, memory delay, PCI bus speed hardware parameters), Transmit data rate can be even larger than 10GBit/s. Visible can satisfy most card test requirements. The mpstat command writes to standard output activities for each available processor, processor 0 being the first one. Global average activities among all processors are also reported. The mpstat command can be used both on SMP and UP machines, but in the latter, only global average activities will be printed. (Ping is normally part of any Linux distribution, hence it doesn’t need to be installed. It is also part of the Yardstick Docker image. For example also a Cirros image can be downloaded from cirros-image, it includes ping. Pktgen and mpstat are not always part of a Linux distribution, hence it needs to be installed. It is part of the Yardstick Docker image. As an example see the /yardstick/tools/ directory for how to generate a Linux image with pktgen and mpstat included.) |
| test description | This test case uses Pktgen to generate packet flow between two hosts for simulating network workloads on the SUT. Ping packets (ICMP protocol’s mandatory ECHO_REQUEST datagram) are sent from a host VM to the target VM(s) to elicit ICMP ECHO_RESPONSE, meanwhile CPU activities are monitored by mpstat. |
| configuration | file: opnfv_yardstick_tc037.yaml Packet size is set to 64 bytes. Number of ports: 1, 10, 50, 100, 300, 500, 750 and 1000. The amount configured ports map from 2 up to 1001000 flows, respectively. Each port amount is run two times, for 20 seconds each. Then the next port_amount is run, and so on. During the test CPU load on both client and server, and the network latency between the client and server are measured. The client and server are distributed on different hardware. mpstat monitoring interval is set to 1 second. ping packet size is set to 100 bytes. For SLA max_ppm is set to 1000. |
| applicability | Test can be configured with different:
Default values exist. SLA (optional): max_ppm: The number of packets per million packets sent that are acceptable to loose, not received. |
| references |
ETSI-NFV-TST001 |
| pre-test conditions | The test case image needs to be installed into Glance with pktgen, mpstat included in it. No POD specific requirements have been identified. |
| test sequence | description and expected result |
| step 1 | Two host VMs are booted, as server and client. |
| step 2 | Yardstick is connected with the server VM by using ssh. ‘pktgen_benchmark’, “ping_benchmark” bash script are copyied from Jump Host to the server VM via the ssh tunnel. |
| step 3 | An IP table is setup on server to monitor for received packets. |
| step 4 | pktgen is invoked to generate packet flow between two server and client for simulating network workloads on the SUT. Ping is invoked. Ping packets are sent from server VM to client VM. mpstat is invoked, recording activities for each available processor. Results are processed and checked against the SLA. Logs are produced and stored. Result: Logs are stored. |
| step 5 | Two host VMs are deleted. |
| test verdict | Fails only if SLA is not passed, or if there is a test case execution problem. |
| Latency, CPU Load, Throughput, Packet Loss (Extended measurements) | |
| test case id | OPNFV_YARDSTICK_TC038_Latency,CPU Load,Throughput,Packet Loss |
| metric | Number of flows, latency, throughput, CPU load, packet loss |
| test purpose | To evaluate the IaaS network performance with regards to flows and throughput, such as if and how different amounts of flows matter for the throughput between hosts on different compute blades. Typically e.g. the performance of a vSwitch depends on the number of flows running through it. Also performance of other equipment or entities can depend on the number of flows or the packet sizes used. The purpose is also to be able to spot trends. Test results, graphs ans similar shall be stored for comparison reasons and product evolution understanding between different OPNFV versions and/or configurations. |
| configuration | file: opnfv_yardstick_tc038.yaml Packet size: 64 bytes Number of ports: 1, 10, 50, 100, 300, 500, 750 and 1000. The amount configured ports map from 2 up to 1001000 flows, respectively. Each port amount is run ten times, for 20 seconds each. Then the next port_amount is run, and so on. During the test CPU load on both client and server, and the network latency between the client and server are measured. The client and server are distributed on different HW. For SLA max_ppm is set to 1000. |
| test tool | pktgen (Pktgen is not always part of a Linux distribution, hence it needs to be installed. It is part of the Yardstick Glance image. As an example see the /yardstick/tools/ directory for how to generate a Linux image with pktgen included.) ping Ping is normally part of any Linux distribution, hence it doesn’t need to be installed. It is also part of the Yardstick Glance image. (For example also a cirros image can be downloaded, it includes ping) mpstat (Mpstat is not always part of a Linux distribution, hence it needs to be installed. It is part of the Yardstick Glance image. |
| references | Ping and Mpstat man pages ETSI-NFV-TST001 |
| applicability | Test can be configured with different packet sizes, amount of flows and test duration. Default values exist. SLA (optional): max_ppm: The number of packets per million packets sent that are acceptable to loose, not received. |
| pre-test conditions | The test case image needs to be installed into Glance with pktgen included in it. No POD specific requirements have been identified. |
| test sequence | description and expected result |
| step 1 | The hosts are installed, as server and client. pktgen is invoked and logs are produced and stored. Result: Logs are stored. |
| test verdict | Fails only if SLA is not passed, or if there is a test case execution problem. |
| Network Performance | |
| test case id | OPNFV_YARDSTICK_TC042_DPDK pktgen latency measurements |
| metric | L2 Network Latency |
| test purpose | Measure L2 network latency when DPDK is enabled between hosts on different compute blades. |
| configuration | file: opnfv_yardstick_tc042.yaml
|
| test tool |
(DPDK and Pktgen-dpdk are not part of a Linux distribution, hence they needs to be installed. As an example see the /yardstick/tools/ directory for how to generate a Linux image with DPDK and pktgen-dpdk included.) |
| references |
ETSI-NFV-TST001 |
| applicability | Test can be configured with different packet sizes. Default values exist. |
| pre-test conditions | The test case image needs to be installed into Glance with DPDK and pktgen-dpdk included in it. The NICs of compute nodes must support DPDK on POD. And at least compute nodes setup hugepage. If you want to achievement a hight performance result, it is recommend to use NUAM, CPU pin, OVS and so on. |
| test sequence | description and expected result |
| step 1 | The hosts are installed on different blades, as server and client. Both server and client have three interfaces. The first one is management such as ssh. The other two are used by DPDK. |
| step 2 | Testpmd is invoked with configurations to forward packets from one DPDK port to the other on server. |
| step 3 | Pktgen-dpdk is invoked with configurations as a traffic generator and logs are produced and stored on client. Result: Logs are stored. |
| test verdict | Fails only if SLA is not passed, or if there is a test case execution problem. |
| Network Latency Between NFVI Nodes | |
| test case id | OPNFV_YARDSTICK_TC043_LATENCY_BETWEEN_NFVI_NODES |
| metric | RTT (Round Trip Time) |
| test purpose | The purpose of TC043 is to do a basic verification that network latency is within acceptable boundaries when packets travel between different NFVI nodes. The purpose is also to be able to spot the trends. Test results, graphs and similar shall be stored for comparison reasons and product evolution understanding between different OPNFV versions and/or configurations. |
| test tool | ping Ping is a computer network administration software utility used to test the reachability of a host on an Internet Protocol (IP) network. It measures the round-trip time for packet sent from the originating host to a destination computer that are echoed back to the source. |
| test topology | Ping packets (ICMP protocol’s mandatory ECHO_REQUEST datagram) are sent from host node to target node to elicit ICMP ECHO_RESPONSE. |
| configuration | file: opnfv_yardstick_tc043.yaml Packet size 100 bytes. Total test duration 600 seconds. One ping each 10 seconds. SLA RTT is set to maximum 10 ms. |
| applicability | This test case can be configured with different:
Default values exist. SLA is optional. The SLA in this test case serves as an example. Considerably lower RTT is expected, and also normal to achieve in balanced L2 environments. However, to cover most configurations, both bare metal and fully virtualized ones, this value should be possible to achieve and acceptable for black box testing. Many real time applications start to suffer badly if the RTT time is higher than this. Some may suffer bad also close to this RTT, while others may not suffer at all. It is a compromise that may have to be tuned for different configuration purposes. |
| references |
ETSI-NFV-TST001 |
| pre_test conditions | Each pod node must have ping included in it. |
| test sequence | description and expected result |
| step 1 | Yardstick is connected with the NFVI node by using ssh. ‘ping_benchmark’ bash script is copyied from Jump Host to the NFVI node via the ssh tunnel. |
| step 2 | Ping is invoked. Ping packets are sent from server node to client node. RTT results are calculated and checked against the SLA. Logs are produced and stored. Result: Logs are stored. |
| test verdict | Test should not PASS if any RTT is above the optional SLA value, or if there is a test case execution problem. |
| Memory Utilization | |
| test case id | OPNFV_YARDSTICK_TC044_Memory Utilization |
| metric | Memory utilization |
| test purpose | To evaluate the IaaS compute capability with regards to memory utilization.This test case should be run in parallel to other Yardstick test cases and not run as a stand-alone test case. Measure the memory usage statistics including used memory, free memory, buffer, cache and shared memory. Both average and maximun values are obtained. The purpose is also to be able to spot trends. Test results, graphs and similar shall be stored for comparison reasons and product evolution understanding between different OPNFV versions and/or configurations. |
| configuration | File: memload.yaml (in the ‘samples’ directory)
|
| test tool | free free provides information about unused and used memory and swap space on any computer running Linux or another Unix-like operating system. free is normally part of a Linux distribution, hence it doesn’t needs to be installed. |
| references |
ETSI-NFV-TST001 |
| applicability | Test can be configured with different:
There are default values for each above-mentioned option. Run in background with other test cases. |
| pre-test conditions | The test case image needs to be installed into Glance with free included in the image. No POD specific requirements have been identified. |
| test sequence | description and expected result |
| step 1 | The host is installed as client. The related TC, or TCs, is invoked and free logs are produced and stored. Result: logs are stored. |
| test verdict | None. Memory utilization results are fetched and stored. |
| Compute Capacity | |
| test case id | OPNFV_YARDSTICK_TC055_Compute Capacity |
| metric | Number of cpus, number of cores, number of threads, available memory size and total cache size. |
| test purpose | To evaluate the IaaS compute capacity with regards to hardware specification, including number of cpus, number of cores, number of threads, available memory size and total cache size. Test results, graphs and similar shall be stored for comparison reasons and product evolution understanding between different OPNFV versions and/or configurations. |
| configuration | file: opnfv_yardstick_tc055.yaml There is are no additional configurations to be set for this TC. |
| test tool | /proc/cpuinfo this TC uses /proc/cpuinfo as source to produce compute capacity output. |
| references | /proc/cpuinfo_ ETSI-NFV-TST001 |
| applicability | None. |
| pre-test conditions | No POD specific requirements have been identified. |
| test sequence | description and expected result |
| step 1 | The hosts are installed, TC is invoked and logs are produced and stored. Result: Logs are stored. |
| test verdict | None. Hardware specification are fetched and stored. |
| Network Utilization | |
| test case id | OPNFV_YARDSTICK_TC061_Network Utilization |
| metric | Network utilization |
| test purpose | To evaluate the IaaS network capability with regards to network utilization, including Total number of packets received per second, Total number of packets transmitted per second, Total number of kilobytes received per second, Total number of kilobytes transmitted per second, Number of compressed packets received per second (for cslip etc.), Number of compressed packets transmitted per second, Number of multicast packets received per second, Utilization percentage of the network interface. This test case should be run in parallel to other Yardstick test cases and not run as a stand-alone test case. Measure the network usage statistics from the network devices Average, minimum and maximun values are obtained. The purpose is also to be able to spot trends. Test results, graphs and similar shall be stored for comparison reasons and product evolution understanding between different OPNFV versions and/or configurations. |
| configuration | File: netutilization.yaml (in the ‘samples’ directory)
|
| test tool | sar The sar command writes to standard output the contents of selected cumulative activity counters in the operating system. sar is normally part of a Linux distribution, hence it doesn’t needs to be installed. |
| references |
ETSI-NFV-TST001 |
| applicability | Test can be configured with different:
There are default values for each above-mentioned option. Run in background with other test cases. |
| pre-test conditions | The test case image needs to be installed into Glance with sar included in the image. No POD specific requirements have been identified. |
| test sequence | description and expected result. |
| step 1 | The host is installed as client. The related TC, or TCs, is invoked and sar logs are produced and stored. Result: logs are stored. |
| test verdict | None. Network utilization results are fetched and stored. |
| Storage Capacity | |
| test case id | OPNFV_YARDSTICK_TC063_Storage Capacity |
| metric | Storage/disk size, block size Disk Utilization |
| test purpose | This test case will check the parameters which could decide several models and each model has its specified task to measure. The test purposes are to measure disk size, block size and disk utilization. With the test results, we could evaluate the storage capacity of the host. |
| configuration |
|
| test tool | fdisk A command-line utility that provides disk partitioning functions iostat This is a computer system monitor tool used to collect and show operating system storage input and output statistics. |
| references |
ETSI-NFV-TST001 |
| applicability | Test can be configured with different:
There are default values for each above-mentioned option. Run in background with other test cases. |
| pre-test conditions | The test case image needs to be installed into Glance No POD specific requirements have been identified. |
| test sequence | Output the specific storage capacity of disk information as the sequence into file. |
| step 1 | The pod is available and the hosts are installed. Node5 is used and logs are produced and stored. Result: Logs are stored. |
| test verdict | None. |
| Memory Bandwidth | |
| test case id | OPNFV_YARDSTICK_TC069_Memory Bandwidth |
| metric | Megabyte per second (MBps) |
| test purpose | To evaluate the IaaS compute performance with regards to memory bandwidth. Measure the maximum possible cache and memory performance while reading and writing certain blocks of data (starting from 1Kb and further in power of 2) continuously through ALU and FPU respectively. Measure different aspects of memory performance via synthetic simulations. Each simulation consists of four performances (Copy, Scale, Add, Triad). Test results, graphs and similar shall be stored for comparison reasons and product evolution understanding between different OPNFV versions and/or configurations. |
| configuration | File: opnfv_yardstick_tc069.yaml
|
| test tool | RAMspeed RAMspeed is a free open source command line utility to measure cache and memory performance of computer systems. RAMspeed is not always part of a Linux distribution, hence it needs to be installed in the test image. |
| references |
ETSI-NFV-TST001 |
| applicability | Test can be configured with different:
There are default values for each above-mentioned option. |
| pre-test conditions | The test case image needs to be installed into Glance with RAmspeed included in the image. No POD specific requirements have been identified. |
| test sequence | description and expected result |
| step 1 | The host is installed as client. RAMspeed is invoked and logs are produced and stored. Result: logs are stored. |
| test verdict | Test fails if the measured memory bandwidth is below the SLA value or if there is a test case execution problem. |
| Latency, Memory Utilization, Throughput, Packet Loss | |
| test case id | OPNFV_YARDSTICK_TC070_Latency, Memory Utilization, Throughput,Packet Loss |
| metric | Number of flows, latency, throughput, Memory Utilization, packet loss |
| test purpose | To evaluate the IaaS network performance with regards to flows and throughput, such as if and how different amounts of flows matter for the throughput between hosts on different compute blades. Typically e.g. the performance of a vSwitch depends on the number of flows running through it. Also performance of other equipment or entities can depend on the number of flows or the packet sizes used. The purpose is also to be able to spot trends. Test results, graphs and similar shall be stored for comparison reasons and product evolution understanding between different OPNFV versions and/or configurations. |
| configuration | file: opnfv_yardstick_tc070.yaml Packet size: 64 bytes Number of ports: 1, 10, 50, 100, 300, 500, 750 and 1000. The amount configured ports map from 2 up to 1001000 flows, respectively. Each port amount is run two times, for 20 seconds each. Then the next port_amount is run, and so on. During the test Memory Utilization on both client and server, and the network latency between the client and server are measured. The client and server are distributed on different HW. For SLA max_ppm is set to 1000. |
| test tool | pktgen Pktgen is not always part of a Linux distribution, hence it needs to be installed. It is part of the Yardstick Glance image. (As an example see the /yardstick/tools/ directory for how to generate a Linux image with pktgen included.) ping Ping is normally part of any Linux distribution, hence it doesn’t need to be installed. It is also part of the Yardstick Glance image. (For example also a cirros image can be downloaded, it includes ping) free free provides information about unused and used memory and swap space on any computer running Linux or another Unix-like operating system. free is normally part of a Linux distribution, hence it doesn’t needs to be installed. |
| references | Ping and free man pages ETSI-NFV-TST001 |
| applicability | Test can be configured with different packet sizes, amount of flows and test duration. Default values exist. SLA (optional): max_ppm: The number of packets per million packets sent that are acceptable to lose, not received. |
| pre-test conditions | The test case image needs to be installed into Glance with pktgen included in it. No POD specific requirements have been identified. |
| test sequence | description and expected result |
| step 1 | The hosts are installed, as server and client. pktgen is invoked and logs are produced and stored. Result: Logs are stored. |
| test verdict | Fails only if SLA is not passed, or if there is a test case execution problem. |
| Latency, Cache Utilization, Throughput, Packet Loss | |
| test case id | OPNFV_YARDSTICK_TC071_Latency, Cache Utilization, Throughput,Packet Loss |
| metric | Number of flows, latency, throughput, Cache Utilization, packet loss |
| test purpose | To evaluate the IaaS network performance with regards to flows and throughput, such as if and how different amounts of flows matter for the throughput between hosts on different compute blades. Typically e.g. the performance of a vSwitch depends on the number of flows running through it. Also performance of other equipment or entities can depend on the number of flows or the packet sizes used. The purpose is also to be able to spot trends. Test results, graphs and similar shall be stored for comparison reasons and product evolution understanding between different OPNFV versions and/or configurations. |
| configuration | file: opnfv_yardstick_tc071.yaml Packet size: 64 bytes Number of ports: 1, 10, 50, 100, 300, 500, 750 and 1000. The amount configured ports map from 2 up to 1001000 flows, respectively. Each port amount is run two times, for 20 seconds each. Then the next port_amount is run, and so on. During the test Cache Utilization on both client and server, and the network latency between the client and server are measured. The client and server are distributed on different HW. For SLA max_ppm is set to 1000. |
| test tool | pktgen Pktgen is not always part of a Linux distribution, hence it needs to be installed. It is part of the Yardstick Glance image. (As an example see the /yardstick/tools/ directory for how to generate a Linux image with pktgen included.) ping Ping is normally part of any Linux distribution, hence it doesn’t need to be installed. It is also part of the Yardstick Glance image. (For example also a cirros image can be downloaded, it includes ping) cachestat cachestat is not always part of a Linux distribution, hence it needs to be installed. |
| references | Ping man pages ETSI-NFV-TST001 |
| applicability | Test can be configured with different packet sizes, amount of flows and test duration. Default values exist. SLA (optional): max_ppm: The number of packets per million packets sent that are acceptable to lose, not received. |
| pre-test conditions | The test case image needs to be installed into Glance with pktgen included in it. No POD specific requirements have been identified. |
| test sequence | description and expected result |
| step 1 | The hosts are installed, as server and client. pktgen is invoked and logs are produced and stored. Result: Logs are stored. |
| test verdict | Fails only if SLA is not passed, or if there is a test case execution problem. |
| Latency, Network Utilization, Throughput, Packet Loss | |
| test case id | OPNFV_YARDSTICK_TC072_Latency, Network Utilization, Throughput,Packet Loss |
| metric | Number of flows, latency, throughput, Network Utilization, packet loss |
| test purpose | To evaluate the IaaS network performance with regards to flows and throughput, such as if and how different amounts of flows matter for the throughput between hosts on different compute blades. Typically e.g. the performance of a vSwitch depends on the number of flows running through it. Also performance of other equipment or entities can depend on the number of flows or the packet sizes used. The purpose is also to be able to spot trends. Test results, graphs and similar shall be stored for comparison reasons and product evolution understanding between different OPNFV versions and/or configurations. |
| configuration | file: opnfv_yardstick_tc072.yaml Packet size: 64 bytes Number of ports: 1, 10, 50, 100, 300, 500, 750 and 1000. The amount configured ports map from 2 up to 1001000 flows, respectively. Each port amount is run two times, for 20 seconds each. Then the next port_amount is run, and so on. During the test Network Utilization on both client and server, and the network latency between the client and server are measured. The client and server are distributed on different HW. For SLA max_ppm is set to 1000. |
| test tool | pktgen Pktgen is not always part of a Linux distribution, hence it needs to be installed. It is part of the Yardstick Glance image. (As an example see the /yardstick/tools/ directory for how to generate a Linux image with pktgen included.) ping Ping is normally part of any Linux distribution, hence it doesn’t need to be installed. It is also part of the Yardstick Glance image. (For example also a cirros image can be downloaded, it includes ping) sar The sar command writes to standard output the contents of selected cumulative activity counters in the operating system. sar is normally part of a Linux distribution, hence it doesn’t needs to be installed. |
| references | Ping and sar man pages ETSI-NFV-TST001 |
| applicability | Test can be configured with different packet sizes, amount of flows and test duration. Default values exist. SLA (optional): max_ppm: The number of packets per million packets sent that are acceptable to lose, not received. |
| pre-test conditions | The test case image needs to be installed into Glance with pktgen included in it. No POD specific requirements have been identified. |
| test sequence | description and expected result |
| step 1 | The hosts are installed, as server and client. pktgen is invoked and logs are produced and stored. Result: Logs are stored. |
| test verdict | Fails only if SLA is not passed, or if there is a test case execution problem. |
| Throughput per NFVI node test | |
| test case id | OPNFV_YARDSTICK_TC073_Network latency and throughput between nodes |
| metric | Network latency and throughput |
| test purpose | To evaluate the IaaS network performance with regards to flows and throughput, such as if and how different amounts of packet sizes and flows matter for the throughput between nodes in one pod. |
| configuration | file: opnfv_yardstick_tc073.yaml Packet size: default 1024 bytes. Test length: default 20 seconds. The client and server are distributed on different nodes. For SLA max_mean_latency is set to 100. |
| test tool | netperf Netperf is a software application that provides network bandwidth testing between two hosts on a network. It supports Unix domain sockets, TCP, SCTP, DLPI and UDP via BSD Sockets. Netperf provides a number of predefined tests e.g. to measure bulk (unidirectional) data transfer or request response performance. (netperf is not always part of a Linux distribution, hence it needs to be installed.) |
| references | netperf Man pages ETSI-NFV-TST001 |
| applicability | Test can be configured with different packet sizes and test duration. Default values exist. SLA (optional): max_mean_latency |
| pre-test conditions | The POD can be reached by external ip and logged on via ssh |
| test sequence | description and expected result |
| step 1 | Install netperf tool on each specified node, one is as the server, and the other as the client. |
| step 2 | Log on to the client node and use the netperf command to execute the network performance test |
| step 3 | The throughput results stored. |
| test verdict | Fails only if SLA is not passed, or if there is a test case execution problem. |
| Storperf | |
| test case id | OPNFV_YARDSTICK_TC074_Storperf |
| metric | Storage performance |
| test purpose | To evaluate and report on the Cinder volume performance. This testcase integrates with OPNFV StorPerf to measure block performance of the underlying Cinder drivers. Many options are supported, and even the root disk (Glance ephemeral storage can be profiled. The fundamental concept of the test case is to first fill the volumes with random data to ensure reported metrics are indicative of continued usage and not skewed by transitional performance while the underlying storage driver allocates blocks. The metrics for filling the volumes with random data are not reported in the final results. The test also ensures the volumes are performing at a consistent level of performance by measuring metrics every minute, and comparing the trend of the metrics over the run. By evaluating the min and max values, as well as the slope of the trend, it can make the determination that the metrics are stable, and not fluctuating beyond industry standard norms. |
| configuration | file: opnfv_yardstick_tc074.yaml
|
| test tool |
StorPerf is a tool to measure block and object storage performance in an NFVI. StorPerf is delivered as a Docker container from https://hub.docker.com/r/opnfv/storperf-master/tags/. The underlying tool used is FIO, and StorPerf supports any FIO option in order to tailor the test to the exact workload needed. |
| references |
ETSI-NFV-TST001 |
| applicability | Test can be configured with different:
|
| pre-test conditions | If you do not have an Ubuntu 14.04 image in Glance, you will need to add one. Storperf is required to be installed in the environment. There are two possible methods for Storperf installation:
Running StorPerf on Jump Host Requirements:
Running StorPerf in a VM Requirements:
No POD specific requirements have been identified. |
| test sequence | description and expected result |
| step 1 | Yardstick calls StorPerf to create the heat stack with the number of VMs and size of Cinder volumes specified. The VMs will be on their own private subnet, and take floating IP addresses from the specified public network. |
| step 2 | Yardstick calls StorPerf to fill all the volumes with random data. |
| step 3 | Yardstick calls StorPerf to perform the series of tests specified by the workload, queue depths and block sizes. |
| step 4 | Yardstick calls StorPerf to delete the stack it created. |
| test verdict | None. Storage performance results are fetched and stored. |
| Network Capacity and Scale Testing | |
| test case id | OPNFV_YARDSTICK_TC075_Network_Capacity_and_Scale_testing |
| metric | Number of connections, Number of frames sent/received |
| test purpose | To evaluate the network capacity and scale with regards to connections and frmaes. |
| configuration | file: opnfv_yardstick_tc075.yaml There is no additional configuration to be set for this TC. |
| test tool | netstar Netstat is normally part of any Linux distribution, hence it doesn’t need to be installed. |
| references | Netstat man page ETSI-NFV-TST001 |
| applicability | This test case is mainly for evaluating network performance. |
| pre_test conditions | Each pod node must have netstat included in it. |
| test sequence | description and expected result |
| step 1 | The pod is available. Netstat is invoked and logs are produced and stored. Result: Logs are stored. |
| test verdict | None. Number of connections and frames are fetched and stored. |
| Monitor Network Metrics | |
| test case id | OPNFV_YARDSTICK_TC076_Monitor_Network_Metrics |
| metric | IP datagram error rate, ICMP message error rate, TCP segment error rate and UDP datagram error rate |
| test purpose | The purpose of TC076 is to evaluate the IaaS network reliability with regards to IP datagram error rate, ICMP message error rate, TCP segment error rate and UDP datagram error rate. TC076 monitors network metrics provided by the Linux kernel in a host and calculates IP datagram error rate, ICMP message error rate, TCP segment error rate and UDP datagram error rate. The purpose is also to be able to spot the trends. Test results, graphs and similar shall be stored for comparison reasons and product evolution understanding between different OPNFV versions and/or configurations. |
| test tool | nstat nstat is a simple tool to monitor kernel snmp counters and network interface statistics. (nstat is not always part of a Linux distribution, hence it needs to be installed. nstat is provided by the iproute2 collection, which is usually also the name of the package in many Linux distributions.As an example see the /yardstick/tools/ directory for how to generate a Linux image with iproute2 included.) |
| test description | Ping packets (ICMP protocol’s mandatory ECHO_REQUEST datagram) are sent from host VM to target VM(s) to elicit ICMP ECHO_RESPONSE. nstat is invoked on the target vm to monitors network metrics provided by the Linux kernel. |
| configuration | file: opnfv_yardstick_tc076.yaml There is no additional configuration to be set for this TC. |
| references | nstat man page ETSI-NFV-TST001 |
| applicability | This test case is mainly for monitoring network metrics. |
| pre_test conditions | The test case image needs to be installed into Glance with fio included in it. No POD specific requirements have been identified. |
| test sequence | description and expected result |
| step 1 | Two host VMs are booted, as server and client. |
| step 2 | Yardstick is connected with the server VM by using ssh. ‘ping_benchmark’ bash script is copyied from Jump Host to the server VM via the ssh tunnel. |
| step 3 | Ping is invoked. Ping packets are sent from server VM to client VM. RTT results are calculated and checked against the SLA. nstat is invoked on the client vm to monitors network metrics provided by the Linux kernel. IP datagram error rate, ICMP message error rate, TCP segment error rate and UDP datagram error rate are calculated. Logs are produced and stored. Result: Logs are stored. |
| step 4 | Two host VMs are deleted. |
| test verdict | None. |
| Compute Performance | |
| test case id | OPNFV_YARDSTICK_TC078_SPEC CPU 2006 |
| metric | compute-intensive performance |
| test purpose | The purpose of TC078 is to evaluate the IaaS compute performance by using SPEC CPU 2006 benchmark. The SPEC CPU 2006 benchmark has several different ways to measure computer performance. One way is to measure how fast the computer completes a single task; this is called a speed measurement. Another way is to measure how many tasks computer can accomplish in a certain amount of time; this is called a throughput, capacity or rate measurement. |
| test tool | SPEC CPU 2006 The SPEC CPU 2006 benchmark is SPEC’s industry-standardized, CPU-intensive benchmark suite, stressing a system’s processor, memory subsystem and compiler. This benchmark suite includes the SPECint benchmarks and the SPECfp benchmarks. The SPECint 2006 benchmark contains 12 different enchmark tests and the SPECfp 2006 benchmark contains 19 different benchmark tests. SPEC CPU 2006 is not always part of a Linux distribution. SPEC requires that users purchase a license and agree with their terms and conditions. For this test case, users must manually download cpu2006-1.2.iso from the SPEC website and save it under the yardstick/resources folder (e.g. /home/ opnfv/repos/yardstick/yardstick/resources/cpu2006-1.2.iso) SPEC CPU® 2006 benchmark is available for purchase via the SPEC order form (https://www.spec.org/order.html). |
| test description | This test case uses SPEC CPU 2006 benchmark to measure compute-intensive performance of hosts. |
| configuration | file: spec_cpu.yaml (in the ‘samples’ directory) benchmark_subset is set to int. SLA is not available in this test case. |
| applicability | Test can be configured with different:
|
| usability | This test case is used for executing SPEC CPU 2006 benchmark physical servers. The SPECint 2006 benchmark takes approximately 5 hours. |
| references |
ETSI-NFV-TST001 |
| pre-test conditions |
|
| test sequence | description and expected result |
| step 1 | cpu2006-1.2.iso has been saved under the yardstick/resources folder (e.g. /home/opnfv/repos/yardstick/yardstick/resources /cpu2006-1.2.iso). Additional, to use your custom runspec config file you can save it under the yardstick/resources/ files folder and specify the config file name in the runspec_config parameter. |
| step 2 | Upload SPEC CPU2006 ISO to the target server and install SPEC CPU2006 via ansible. |
| step 3 | Yardstick is connected with the target server by using ssh. If custom runspec config file is used, this file is copyied from yardstick to the target server via the ssh tunnel. |
| step 4 | SPEC CPU2006 benchmark is invoked and SPEC CPU 2006 metrics are generated. |
| step 5 | Text, HTML, CSV, PDF, and Configuration file outputs for the SPEC CPU 2006 metrics are fetch from the server and stored under /tmp/result folder. |
| step 6 | uninstall SPEC CPU2006 and remove cpu2006-1.2.iso from the target server . |
| test verdict | None. SPEC CPU2006 results are collected and stored. |
| Storage Performance | |
| test case id | OPNFV_YARDSTICK_TC079_Bonnie++ |
| metric | Sequential Input/Output and Sequential/Random Create speed and CPU useage. |
| test purpose | The purpose of TC078 is to evaluate the IaaS storage performance with regards to Sequential Input/Output and Sequential/Random Create speed and CPU useage statistics. |
| test tool | Bonnie++ Bonnie++ is a disk and file system benchmarking tool for measuring I/O performance. With Bonnie++ you can quickly and easily produce a meaningful value to represent your current file system performance. Bonnie++ is not always part of a Linux distribution, hence it needs to be installed in the test image. |
| test description |
|
| configuration | file: bonnie++.yaml (in the ‘samples’ directory) file_size is set to 1024; ram_size is set to 512; test_dir is set to ‘/tmp’; concurrency is set to 1. SLA is not available in this test case. |
| applicability | Test can be configured with different:
|
| usability | This test case is used for executing Bonnie++ benchmark in VMs. |
| references | bonnie++_ ETSI-NFV-TST001 |
| pre-test conditions | The Bonnie++ distribution includes a ‘bon_csv2html’ Perl script, which takes the comma-separated values reported by Bonnie++ and generates an HTML page displaying them. To use this feature, bonnie++ is required to be install with yardstick (e.g. in yardstick docker). |
| test sequence | description and expected result |
| step 1 | A host VM with fio installed is booted. |
| step 2 | Yardstick is connected with the host VM by using ssh. |
| step 3 | Bonnie++ benchmark is invoked. Simulated IO operations are started. Logs are produced and stored. Result: Logs are stored. |
| step 4 | An HTML report is generated using bonnie++ benchmark results and stored under /tmp/bonnie.html. |
| step 5 | The host VM is deleted. |
| test verdict | None. Bonnie++ html report is generated. |
| Network Latency | |
| test case id | OPNFV_YARDSTICK_TC080_NETWORK_LATENCY_BETWEEN_CONTAINER |
| metric | RTT (Round Trip Time) |
| test purpose | The purpose of TC080 is to do a basic verification that network latency is within acceptable boundaries when packets travel between containers located in two different Kubernetes pods. The purpose is also to be able to spot the trends. Test results, graphs and similar shall be stored for comparison reasons and product evolution understanding between different OPNFV versions and/or configurations. |
| test tool | ping Ping is a computer network administration software utility used to test the reachability of a host on an Internet Protocol (IP) network. It measures the round-trip time for packet sent from the originating host to a destination computer that are echoed back to the source. Ping is normally part of any Linux distribution, hence it doesn’t need to be installed. It is also part of the Yardstick Docker image. |
| test topology | Ping packets (ICMP protocol’s mandatory ECHO_REQUEST datagram) are sent from host container to target container to elicit ICMP ECHO_RESPONSE. |
| configuration | file: opnfv_yardstick_tc080.yaml Packet size 200 bytes. Test duration 60 seconds. SLA RTT is set to maximum 10 ms. |
| applicability | This test case can be configured with different:
Default values exist. SLA is optional. The SLA in this test case serves as an example. Considerably lower RTT is expected, and also normal to achieve in balanced L2 environments. However, to cover most configurations, both bare metal and fully virtualized ones, this value should be possible to achieve and acceptable for black box testing. Many real time applications start to suffer badly if the RTT time is higher than this. Some may suffer bad also close to this RTT, while others may not suffer at all. It is a compromise that may have to be tuned for different configuration purposes. |
| usability | This test case should be run in Kunernetes environment. |
| references |
ETSI-NFV-TST001 |
| pre-test conditions | The test case Docker image (openretriever/yardstick) needs to be pulled into Kubernetes environment. No further requirements have been identified. |
| test sequence | description and expected result |
| step 1 | Two containers are booted, as server and client. |
| step 2 | Yardstick is connected with the server container by using ssh. ‘ping_benchmark’ bash script is copied from Jump Host to the server container via the ssh tunnel. |
| step 3 | Ping is invoked. Ping packets are sent from server container to client container. RTT results are calculated and checked against the SLA. Logs are produced and stored. Result: Logs are stored. |
| step 4 | Two containers are deleted. |
| test verdict | Test should not PASS if any RTT is above the optional SLA value, or if there is a test case execution problem. |
| Network Latency | |
| test case id | OPNFV_YARDSTICK_TC081_NETWORK_LATENCY_BETWEEN_CONTAINER_AND_ VM |
| metric | RTT (Round Trip Time) |
| test purpose | The purpose of TC081 is to do a basic verification that network latency is within acceptable boundaries when packets travel between a containers and a VM. The purpose is also to be able to spot the trends. Test results, graphs and similar shall be stored for comparison reasons and product evolution understanding between different OPNFV versions and/or configurations. |
| test tool | ping Ping is a computer network administration software utility used to test the reachability of a host on an Internet Protocol (IP) network. It measures the round-trip time for packet sent from the originating host to a destination computer that are echoed back to the source. Ping is normally part of any Linux distribution, hence it doesn’t need to be installed. It is also part of the Yardstick Docker image. (For example also a Cirros image can be downloaded from cirros-image, it includes ping) |
| test topology | Ping packets (ICMP protocol’s mandatory ECHO_REQUEST datagram) are sent from host container to target vm to elicit ICMP ECHO_RESPONSE. |
| configuration | file: opnfv_yardstick_tc081.yaml Packet size 200 bytes. Test duration 60 seconds. SLA RTT is set to maximum 10 ms. |
| applicability | This test case can be configured with different:
Default values exist. SLA is optional. The SLA in this test case serves as an example. Considerably lower RTT is expected, and also normal to achieve in balanced L2 environments. However, to cover most configurations, both bare metal and fully virtualized ones, this value should be possible to achieve and acceptable for black box testing. Many real time applications start to suffer badly if the RTT time is higher than this. Some may suffer bad also close to this RTT, while others may not suffer at all. It is a compromise that may have to be tuned for different configuration purposes. |
| usability | This test case should be run in Kunernetes environment. |
| references |
ETSI-NFV-TST001 |
| pre-test conditions | The test case Docker image (openretriever/yardstick) needs to be pulled into Kubernetes environment. The VM image (cirros-image) needs to be installed into Glance with ping included in it. No further requirements have been identified. |
| test sequence | description and expected result |
| step 1 | A containers is booted, as server and a VM is booted as client. |
| step 2 | Yardstick is connected with the server container by using ssh. ‘ping_benchmark’ bash script is copied from Jump Host to the server container via the ssh tunnel. |
| step 3 | Ping is invoked. Ping packets are sent from server container to client VM. RTT results are calculated and checked against the SLA. Logs are produced and stored. Result: Logs are stored. |
| step 4 | The container and VM are deleted. |
| test verdict | Test should not PASS if any RTT is above the optional SLA value, or if there is a test case execution problem. |
| Throughput per VM test | |
| test case id | OPNFV_YARDSTICK_TC083_Network latency and throughput between VMs |
| metric | Network latency and throughput |
| test purpose | To evaluate the IaaS network performance with regards to flows and throughput, such as if and how different amounts of packet sizes and flows matter for the throughput between 2 VMs in one pod. |
| configuration | file: opnfv_yardstick_tc083.yaml Packet size: default 1024 bytes. Test length: default 20 seconds. The client and server are distributed on different nodes. For SLA max_mean_latency is set to 100. |
| test tool | netperf Netperf is a software application that provides network bandwidth testing between two hosts on a network. It supports Unix domain sockets, TCP, SCTP, DLPI and UDP via BSD Sockets. Netperf provides a number of predefined tests e.g. to measure bulk (unidirectional) data transfer or request response performance. (netperf is not always part of a Linux distribution, hence it needs to be installed.) |
| references | netperf Man pages ETSI-NFV-TST001 |
| applicability | Test can be configured with different packet sizes and test duration. Default values exist. SLA (optional): max_mean_latency |
| pre-test conditions | The POD can be reached by external ip and logged on via ssh |
| test sequence | description and expected result |
| step 1 | Install netperf tool on each specified node, one is as the server, and the other as the client. |
| step 2 | Log on to the client node and use the netperf command to execute the network performance test |
| step 3 | The throughput results stored. |
| test verdict | Fails only if SLA is not passed, or if there is a test case execution problem. |
| Control Node Openstack Service High Availability | |
| test case id | OPNFV_YARDSTICK_TC019_HA: Control node Openstack service down |
| test purpose | This test case will verify the high availability of the service provided by OpenStack (like nova-api, neutro-server) on control node. |
| test method | This test case kills the processes of a specific Openstack service on a selected control node, then checks whether the request of the related Openstack command is OK and the killed processes are recovered. |
| attackers | In this test case, an attacker called “kill-process” is needed. This attacker includes three parameters: 1) fault_type: which is used for finding the attacker’s scripts. It should be always set to “kill-process” in this test case. 2) process_name: which is the process name of the specified OpenStack service. If there are multiple processes use the same name on the host, all of them are killed by this attacker. 3) host: which is the name of a control node being attacked. e.g. -fault_type: “kill-process” -process_name: “nova-api” -host: node1 |
| monitors | In this test case, two kinds of monitor are needed: 1. the “openstack-cmd” monitor constantly request a specific
1) monitor_type: which is used for finding the monitor class and related scritps. It should be always set to “openstack-cmd” for this monitor. 2) command_name: which is the command name used for request
1) monitor_type: which used for finding the monitor class and related scritps. It should be always set to “process” for this monitor. 2) process_name: which is the process name for monitor 3) host: which is the name of the node runing the process e.g. monitor1: -monitor_type: “openstack-cmd” -command_name: “openstack server list” monitor2: -monitor_type: “process” -process_name: “nova-api” -host: node1 |
| metrics | In this test case, there are two metrics: 1)service_outage_time: which indicates the maximum outage time (seconds) of the specified Openstack command request. 2)process_recover_time: which indicates the maximun time (seconds) from the process being killed to recovered |
| test tool | Developed by the project. Please see folder: “yardstick/benchmark/scenarios/availability/ha_tools” |
| references | ETSI NFV REL001 |
| configuration | This test case needs two configuration files: 1) test case file: opnfv_yardstick_tc019.yaml -Attackers: see above “attackers” discription -waiting_time: which is the time (seconds) from the process being killed to stoping monitors the monitors -Monitors: see above “monitors” discription -SLA: see above “metrics” discription 2)POD file: pod.yaml The POD configuration should record on pod.yaml first. the “host” item in this test case will use the node name in the pod.yaml. |
| test sequence | description and expected result |
| step 1 | start monitors: each monitor will run with independently process Result: The monitor info will be collected. |
| step 2 | do attacker: connect the host through SSH, and then execute the kill process script with param value specified by “process_name” Result: Process will be killed. |
| step 3 | stop monitors after a period of time specified by “waiting_time” Result: The monitor info will be aggregated. |
| step 4 | verify the SLA Result: The test case is passed or not. |
| post-action | It is the action when the test cases exist. It will check the status of the specified process on the host, and restart the process if it is not running for next test cases. Notice: This post-action uses ‘lsb_release’ command to check the host linux distribution and determine the OpenStack service name to restart the process. Lack of ‘lsb_release’ on the host may cause failure to restart the process. |
| test verdict | Fails only if SLA is not passed, or if there is a test case execution problem. |
| OpenStack Controller Node abnormally shutdown High Availability | |
| test case id | OPNFV_YARDSTICK_TC025_HA: OpenStack Controller Node abnormally shutdown |
| test purpose | This test case will verify the high availability of controller node. When one of the controller node abnormally shutdown, the service provided by it should be OK. |
| test method | This test case shutdowns a specified controller node with some fault injection tools, then checks whether all services provided by the controller node are OK with some monitor tools. |
| attackers | In this test case, an attacker called “host-shutdown” is needed. This attacker includes two parameters: 1) fault_type: which is used for finding the attacker’s scripts. It should be always set to “host-shutdown” in this test case. 2) host: the name of a controller node being attacked. e.g. -fault_type: “host-shutdown” -host: node1 |
| monitors | In this test case, one kind of monitor are needed: 1. the “openstack-cmd” monitor constantly request a specific
1) monitor_type: which is used for finding the monitor class and related scritps. It should be always set to “openstack-cmd” for this monitor. 2) command_name: which is the command name used for request There are four instance of the “openstack-cmd” monitor: monitor1: -monitor_type: “openstack-cmd” -api_name: “nova image-list” monitor2: -monitor_type: “openstack-cmd” -api_name: “neutron router-list” monitor3: -monitor_type: “openstack-cmd” -api_name: “heat stack-list” monitor4: -monitor_type: “openstack-cmd” -api_name: “cinder list” |
| metrics | In this test case, there is one metric: 1)service_outage_time: which indicates the maximum outage time (seconds) of the specified Openstack command request. |
| test tool | Developed by the project. Please see folder: “yardstick/benchmark/scenarios/availability/ha_tools” |
| references | ETSI NFV REL001 |
| configuration | This test case needs two configuration files: 1) test case file: opnfv_yardstick_tc019.yaml -Attackers: see above “attackers” discription -waiting_time: which is the time (seconds) from the process being killed to stoping monitors the monitors -Monitors: see above “monitors” discription -SLA: see above “metrics” discription 2)POD file: pod.yaml The POD configuration should record on pod.yaml first. the “host” item in this test case will use the node name in the pod.yaml. |
| test sequence | description and expected result |
| step 1 | start monitors: each monitor will run with independently process Result: The monitor info will be collected. |
| step 2 | do attacker: connect the host through SSH, and then execute shutdown script on the host Result: The host will be shutdown. |
| step 3 | stop monitors after a period of time specified by “waiting_time” Result: All monitor result will be aggregated. |
| step 4 | verify the SLA Result: The test case is passed or not. |
| post-action | It is the action when the test cases exist. It restarts the specified controller node if it is not restarted. |
| test verdict | Fails only if SLA is not passed, or if there is a test case execution problem. |
| Control Node Openstack Service High Availability - Neutron Server | |
| test case id | OPNFV_YARDSTICK_TC045: Control node Openstack service down - neutron server |
| test purpose | This test case will verify the high availability of the network service provided by OpenStack (neutro-server) on control node. |
| test method | This test case kills the processes of neutron-server service on a selected control node, then checks whether the request of the related Openstack command is OK and the killed processes are recovered. |
| attackers | In this test case, an attacker called “kill-process” is needed. This attacker includes three parameters: 1) fault_type: which is used for finding the attacker’s scripts. It should be always set to “kill-process” in this test case. 2) process_name: which is the process name of the specified OpenStack service. If there are multiple processes use the same name on the host, all of them are killed by this attacker. In this case. This parameter should always set to “neutron- server”. 3) host: which is the name of a control node being attacked. e.g. -fault_type: “kill-process” -process_name: “neutron-server” -host: node1 |
| monitors | In this test case, two kinds of monitor are needed: 1. the “openstack-cmd” monitor constantly request a specific Openstack command, which needs two parameters: 1) monitor_type: which is used for finding the monitor class and related scritps. It should be always set to “openstack-cmd” for this monitor. 2) command_name: which is the command name used for request. In this case, the command name should be neutron related commands. 2. the “process” monitor check whether a process is running on a specific node, which needs three parameters: 1) monitor_type: which used for finding the monitor class and related scritps. It should be always set to “process” for this monitor. 2) process_name: which is the process name for monitor 3) host: which is the name of the node runing the process e.g. monitor1: -monitor_type: “openstack-cmd” -command_name: “neutron agent-list” monitor2: -monitor_type: “process” -process_name: “neutron-server” -host: node1 |
| metrics | In this test case, there are two metrics: 1)service_outage_time: which indicates the maximum outage time (seconds) of the specified Openstack command request. 2)process_recover_time: which indicates the maximun time (seconds) from the process being killed to recovered |
| test tool | Developed by the project. Please see folder: “yardstick/benchmark/scenarios/availability/ha_tools” |
| references | ETSI NFV REL001 |
| configuration | This test case needs two configuration files: 1) test case file: opnfv_yardstick_tc045.yaml -Attackers: see above “attackers” discription -waiting_time: which is the time (seconds) from the process being killed to stoping monitors the monitors -Monitors: see above “monitors” discription -SLA: see above “metrics” discription 2)POD file: pod.yaml The POD configuration should record on pod.yaml first. the “host” item in this test case will use the node name in the pod.yaml. |
| test sequence | description and expected result |
| step 1 | start monitors: each monitor will run with independently process Result: The monitor info will be collected. |
| step 2 | do attacker: connect the host through SSH, and then execute the kill process script with param value specified by “process_name” Result: Process will be killed. |
| step 3 | stop monitors after a period of time specified by “waiting_time” Result: The monitor info will be aggregated. |
| step 4 | verify the SLA Result: The test case is passed or not. |
| post-action | It is the action when the test cases exist. It will check the status of the specified process on the host, and restart the process if it is not running for next test cases. Notice: This post-action uses ‘lsb_release’ command to check the host linux distribution and determine the OpenStack service name to restart the process. Lack of ‘lsb_release’ on the host may cause failure to restart the process. |
| test verdict | Fails only if SLA is not passed, or if there is a test case execution problem. |
| Control Node Openstack Service High Availability - Keystone | |
| test case id | OPNFV_YARDSTICK_TC046: Control node Openstack service down - keystone |
| test purpose | This test case will verify the high availability of the user service provided by OpenStack (keystone) on control node. |
| test method | This test case kills the processes of keystone service on a selected control node, then checks whether the request of the related Openstack command is OK and the killed processes are recovered. |
| attackers | In this test case, an attacker called “kill-process” is needed. This attacker includes three parameters: 1) fault_type: which is used for finding the attacker’s scripts. It should be always set to “kill-process” in this test case. 2) process_name: which is the process name of the specified OpenStack service. If there are multiple processes use the same name on the host, all of them are killed by this attacker. In this case. This parameter should always set to “keystone” 3) host: which is the name of a control node being attacked. e.g. -fault_type: “kill-process” -process_name: “keystone” -host: node1 |
| monitors | In this test case, two kinds of monitor are needed: 1. the “openstack-cmd” monitor constantly request a specific Openstack command, which needs two parameters: 1) monitor_type: which is used for finding the monitor class and related scritps. It should be always set to “openstack-cmd” for this monitor. 2) command_name: which is the command name used for request. In this case, the command name should be keystone related commands. 2. the “process” monitor check whether a process is running on a specific node, which needs three parameters: 1) monitor_type: which used for finding the monitor class and related scritps. It should be always set to “process” for this monitor. 2) process_name: which is the process name for monitor 3) host: which is the name of the node runing the process e.g. monitor1: -monitor_type: “openstack-cmd” -command_name: “keystone user-list” monitor2: -monitor_type: “process” -process_name: “keystone” -host: node1 |
| metrics | In this test case, there are two metrics: 1)service_outage_time: which indicates the maximum outage time (seconds) of the specified Openstack command request. 2)process_recover_time: which indicates the maximun time (seconds) from the process being killed to recovered |
| test tool | Developed by the project. Please see folder: “yardstick/benchmark/scenarios/availability/ha_tools” |
| references | ETSI NFV REL001 |
| configuration | This test case needs two configuration files: 1) test case file: opnfv_yardstick_tc046.yaml -Attackers: see above “attackers” discription -waiting_time: which is the time (seconds) from the process being killed to stoping monitors the monitors -Monitors: see above “monitors” discription -SLA: see above “metrics” discription 2)POD file: pod.yaml The POD configuration should record on pod.yaml first. the “host” item in this test case will use the node name in the pod.yaml. |
| test sequence | description and expected result |
| step 1 | start monitors: each monitor will run with independently process Result: The monitor info will be collected. |
| step 2 | do attacker: connect the host through SSH, and then execute the kill process script with param value specified by “process_name” Result: Process will be killed. |
| step 3 | stop monitors after a period of time specified by “waiting_time” Result: The monitor info will be aggregated. |
| step 4 | verify the SLA Result: The test case is passed or not. |
| post-action | It is the action when the test cases exist. It will check the status of the specified process on the host, and restart the process if it is not running for next test cases. Notice: This post-action uses ‘lsb_release’ command to check the host linux distribution and determine the OpenStack service name to restart the process. Lack of ‘lsb_release’ on the host may cause failure to restart the process. |
| test verdict | Fails only if SLA is not passed, or if there is a test case execution problem. |
| Control Node Openstack Service High Availability - Glance Api | |
| test case id | OPNFV_YARDSTICK_TC047: Control node Openstack service down - glance api |
| test purpose | This test case will verify the high availability of the image service provided by OpenStack (glance-api) on control node. |
| test method | This test case kills the processes of glance-api service on a selected control node, then checks whether the request of the related Openstack command is OK and the killed processes are recovered. |
| attackers | In this test case, an attacker called “kill-process” is needed. This attacker includes three parameters: 1) fault_type: which is used for finding the attacker’s scripts. It should be always set to “kill-process” in this test case. 2) process_name: which is the process name of the specified OpenStack service. If there are multiple processes use the same name on the host, all of them are killed by this attacker. In this case. This parameter should always set to “glance- api”. 3) host: which is the name of a control node being attacked. e.g. -fault_type: “kill-process” -process_name: “glance-api” -host: node1 |
| monitors | In this test case, two kinds of monitor are needed: 1. the “openstack-cmd” monitor constantly request a specific Openstack command, which needs two parameters: 1) monitor_type: which is used for finding the monitor class and related scritps. It should be always set to “openstack-cmd” for this monitor. 2) command_name: which is the command name used for request. In this case, the command name should be glance related commands. 2. the “process” monitor check whether a process is running on a specific node, which needs three parameters: 1) monitor_type: which used for finding the monitor class and related scritps. It should be always set to “process” for this monitor. 2) process_name: which is the process name for monitor 3) host: which is the name of the node runing the process e.g. monitor1: -monitor_type: “openstack-cmd” -command_name: “glance image-list” monitor2: -monitor_type: “process” -process_name: “glance-api” -host: node1 |
| metrics | In this test case, there are two metrics: 1)service_outage_time: which indicates the maximum outage time (seconds) of the specified Openstack command request. 2)process_recover_time: which indicates the maximun time (seconds) from the process being killed to recovered |
| test tool | Developed by the project. Please see folder: “yardstick/benchmark/scenarios/availability/ha_tools” |
| references | ETSI NFV REL001 |
| configuration | This test case needs two configuration files: 1) test case file: opnfv_yardstick_tc047.yaml -Attackers: see above “attackers” discription -waiting_time: which is the time (seconds) from the process being killed to stoping monitors the monitors -Monitors: see above “monitors” discription -SLA: see above “metrics” discription 2)POD file: pod.yaml The POD configuration should record on pod.yaml first. the “host” item in this test case will use the node name in the pod.yaml. |
| test sequence | description and expected result |
| step 1 | start monitors: each monitor will run with independently process Result: The monitor info will be collected. |
| step 2 | do attacker: connect the host through SSH, and then execute the kill process script with param value specified by “process_name” Result: Process will be killed. |
| step 3 | stop monitors after a period of time specified by “waiting_time” Result: The monitor info will be aggregated. |
| step 4 | verify the SLA Result: The test case is passed or not. |
| post-action | It is the action when the test cases exist. It will check the status of the specified process on the host, and restart the process if it is not running for next test cases. Notice: This post-action uses ‘lsb_release’ command to check the host linux distribution and determine the OpenStack service name to restart the process. Lack of ‘lsb_release’ on the host may cause failure to restart the process. |
| test verdict | Fails only if SLA is not passed, or if there is a test case execution problem. |
| Control Node Openstack Service High Availability - Cinder Api | |
| test case id | OPNFV_YARDSTICK_TC048: Control node Openstack service down - cinder api |
| test purpose | This test case will verify the high availability of the volume service provided by OpenStack (cinder-api) on control node. |
| test method | This test case kills the processes of cinder-api service on a selected control node, then checks whether the request of the related Openstack command is OK and the killed processes are recovered. |
| attackers | In this test case, an attacker called “kill-process” is needed. This attacker includes three parameters: 1) fault_type: which is used for finding the attacker’s scripts. It should be always set to “kill-process” in this test case. 2) process_name: which is the process name of the specified OpenStack service. If there are multiple processes use the same name on the host, all of them are killed by this attacker. In this case. This parameter should always set to “cinder- api”. 3) host: which is the name of a control node being attacked. e.g. -fault_type: “kill-process” -process_name: “cinder-api” -host: node1 |
| monitors | In this test case, two kinds of monitor are needed: 1. the “openstack-cmd” monitor constantly request a specific Openstack command, which needs two parameters: 1) monitor_type: which is used for finding the monitor class and related scritps. It should be always set to “openstack-cmd” for this monitor. 2) command_name: which is the command name used for request. In this case, the command name should be cinder related commands. 2. the “process” monitor check whether a process is running on a specific node, which needs three parameters: 1) monitor_type: which used for finding the monitor class and related scritps. It should be always set to “process” for this monitor. 2) process_name: which is the process name for monitor 3) host: which is the name of the node runing the process e.g. monitor1: -monitor_type: “openstack-cmd” -command_name: “cinder list” monitor2: -monitor_type: “process” -process_name: “cinder-api” -host: node1 |
| metrics | In this test case, there are two metrics: 1)service_outage_time: which indicates the maximum outage time (seconds) of the specified Openstack command request. 2)process_recover_time: which indicates the maximun time (seconds) from the process being killed to recovered |
| test tool | Developed by the project. Please see folder: “yardstick/benchmark/scenarios/availability/ha_tools” |
| references | ETSI NFV REL001 |
| configuration | This test case needs two configuration files: 1) test case file: opnfv_yardstick_tc048.yaml -Attackers: see above “attackers” discription -waiting_time: which is the time (seconds) from the process being killed to stoping monitors the monitors -Monitors: see above “monitors” discription -SLA: see above “metrics” discription 2)POD file: pod.yaml The POD configuration should record on pod.yaml first. the “host” item in this test case will use the node name in the pod.yaml. |
| test sequence | description and expected result |
| step 1 | start monitors: each monitor will run with independently process Result: The monitor info will be collected. |
| step 2 | do attacker: connect the host through SSH, and then execute the kill process script with param value specified by “process_name” Result: Process will be killed. |
| step 3 | stop monitors after a period of time specified by “waiting_time” Result: The monitor info will be aggregated. |
| step 4 | verify the SLA Result: The test case is passed or not. |
| post-action | It is the action when the test cases exist. It will check the status of the specified process on the host, and restart the process if it is not running for next test case Notice: This post-action uses ‘lsb_release’ command to check the host linux distribution and determine the OpenStack service name to restart the process. Lack of ‘lsb_release’ on the host may cause failure to restart the process. |
| test verdict | Fails only if SLA is not passed, or if there is a test case execution problem. |
| Control Node Openstack Service High Availability - Swift Proxy | |
| test case id | OPNFV_YARDSTICK_TC049: Control node Openstack service down - swift proxy |
| test purpose | This test case will verify the high availability of the storage service provided by OpenStack (swift-proxy) on control node. |
| test method | This test case kills the processes of swift-proxy service on a selected control node, then checks whether the request of the related Openstack command is OK and the killed processes are recovered. |
| attackers | In this test case, an attacker called “kill-process” is needed. This attacker includes three parameters: 1) fault_type: which is used for finding the attacker’s scripts. It should be always set to “kill-process” in this test case. 2) process_name: which is the process name of the specified OpenStack service. If there are multiple processes use the same name on the host, all of them are killed by this attacker. In this case. This parameter should always set to “swift- proxy”. 3) host: which is the name of a control node being attacked. e.g. -fault_type: “kill-process” -process_name: “swift-proxy” -host: node1 |
| monitors | In this test case, two kinds of monitor are needed: 1. the “openstack-cmd” monitor constantly request a specific Openstack command, which needs two parameters: 1) monitor_type: which is used for finding the monitor class and related scritps. It should be always set to “openstack-cmd” for this monitor. 2) command_name: which is the command name used for request. In this case, the command name should be swift related commands. 2. the “process” monitor check whether a process is running on a specific node, which needs three parameters: 1) monitor_type: which used for finding the monitor class and related scritps. It should be always set to “process” for this monitor. 2) process_name: which is the process name for monitor 3) host: which is the name of the node runing the process e.g. monitor1: -monitor_type: “openstack-cmd” -command_name: “swift stat” monitor2: -monitor_type: “process” -process_name: “swift-proxy” -host: node1 |
| metrics | In this test case, there are two metrics: 1)service_outage_time: which indicates the maximum outage time (seconds) of the specified Openstack command request. 2)process_recover_time: which indicates the maximun time (seconds) from the process being killed to recovered |
| test tool | Developed by the project. Please see folder: “yardstick/benchmark/scenarios/availability/ha_tools” |
| references | ETSI NFV REL001 |
| configuration | This test case needs two configuration files: 1) test case file: opnfv_yardstick_tc049.yaml -Attackers: see above “attackers” discription -waiting_time: which is the time (seconds) from the process being killed to stoping monitors the monitors -Monitors: see above “monitors” discription -SLA: see above “metrics” discription 2)POD file: pod.yaml The POD configuration should record on pod.yaml first. the “host” item in this test case will use the node name in the pod.yaml. |
| test sequence | description and expected result |
| step 1 | start monitors: each monitor will run with independently process Result: The monitor info will be collected. |
| step 2 | do attacker: connect the host through SSH, and then execute the kill process script with param value specified by “process_name” Result: Process will be killed. |
| step 3 | stop monitors after a period of time specified by “waiting_time” Result: The monitor info will be aggregated. |
| step 4 | verify the SLA Result: The test case is passed or not. |
| post-action | It is the action when the test cases exist. It will check the status of the specified process on the host, and restart the process if it is not running for next test cases. Notice: This post-action uses ‘lsb_release’ command to check the host linux distribution and determine the OpenStack service name to restart the process. Lack of ‘lsb_release’ on the host may cause failure to restart the process. |
| test verdict | Fails only if SLA is not passed, or if there is a test case execution problem. |
| OpenStack Controller Node Network High Availability | |
| test case id | OPNFV_YARDSTICK_TC050: OpenStack Controller Node Network High Availability |
| test purpose | This test case will verify the high availability of control node. When one of the controller failed to connect the network, which breaks down the Openstack services on this node. These Openstack service should able to be accessed by other controller nodes, and the services on failed controller node should be isolated. |
| test method | This test case turns off the network interfaces of a specified control node, then checks whether all services provided by the control node are OK with some monitor tools. |
| attackers | In this test case, an attacker called “close-interface” is needed. This attacker includes three parameters: 1) fault_type: which is used for finding the attacker’s scripts. It should be always set to “close-interface” in this test case. 2) host: which is the name of a control node being attacked. 3) interface: the network interface to be turned off. The interface to be closed by the attacker can be set by the variable of “{{ interface_name }}”
|
| monitors | In this test case, the monitor named “openstack-cmd” is needed. The monitor needs needs two parameters: 1) monitor_type: which is used for finding the monitor class and related scritps. It should be always set to “openstack-cmd” for this monitor. 2) command_name: which is the command name used for request There are four instance of the “openstack-cmd” monitor: monitor1:
|
| metrics | In this test case, there is one metric: 1)service_outage_time: which indicates the maximum outage time (seconds) of the specified Openstack command request. |
| test tool | Developed by the project. Please see folder: “yardstick/benchmark/scenarios/availability/ha_tools” |
| references | ETSI NFV REL001 |
| configuration | This test case needs two configuration files: 1) test case file: opnfv_yardstick_tc050.yaml -Attackers: see above “attackers” discription -waiting_time: which is the time (seconds) from the process being killed to stoping monitors the monitors -Monitors: see above “monitors” discription -SLA: see above “metrics” discription 2)POD file: pod.yaml The POD configuration should record on pod.yaml first. the “host” item in this test case will use the node name in the pod.yaml. |
| test sequence | description and expected result |
| step 1 | start monitors: each monitor will run with independently process Result: The monitor info will be collected. |
| step 2 | do attacker: connect the host through SSH, and then execute the turnoff network interface script with param value specified by “{{ interface_name }}”. Result: The specified network interface will be down. |
| step 3 | stop monitors after a period of time specified by “waiting_time” Result: The monitor info will be aggregated. |
| step 4 | verify the SLA Result: The test case is passed or not. |
| post-action | It is the action when the test cases exist. It turns up the network interface of the control node if it is not turned up. |
| test verdict | Fails only if SLA is not passed, or if there is a test case execution problem. |
| OpenStack Controller Node CPU Overload High Availability | |
| test case id | OPNFV_YARDSTICK_TC051: OpenStack Controller Node CPU Overload High Availability |
| test purpose | This test case will verify the high availability of control node. When the CPU usage of a specified controller node is stressed to 100%, which breaks down the Openstack services on this node. These Openstack service should able to be accessed by other controller nodes, and the services on failed controller node should be isolated. |
| test method | This test case stresses the CPU uasge of a specified control node to 100%, then checks whether all services provided by the environment are OK with some monitor tools. |
| attackers | In this test case, an attacker called “stress-cpu” is needed. This attacker includes two parameters: 1) fault_type: which is used for finding the attacker’s scripts. It should be always set to “stress-cpu” in this test case. 2) host: which is the name of a control node being attacked. e.g. -fault_type: “stress-cpu” -host: node1 |
| monitors | In this test case, the monitor named “openstack-cmd” is needed. The monitor needs needs two parameters: 1) monitor_type: which is used for finding the monitor class and related scritps. It should be always set to “openstack-cmd” for this monitor. 2) command_name: which is the command name used for request There are four instance of the “openstack-cmd” monitor: monitor1: -monitor_type: “openstack-cmd” -command_name: “nova image-list” monitor2: -monitor_type: “openstack-cmd” -command_name: “neutron router-list” monitor3: -monitor_type: “openstack-cmd” -command_name: “heat stack-list” monitor4: -monitor_type: “openstack-cmd” -command_name: “cinder list” |
| metrics | In this test case, there is one metric: 1)service_outage_time: which indicates the maximum outage time (seconds) of the specified Openstack command request. |
| test tool | Developed by the project. Please see folder: “yardstick/benchmark/scenarios/availability/ha_tools” |
| references | ETSI NFV REL001 |
| configuration | This test case needs two configuration files: 1) test case file: opnfv_yardstick_tc051.yaml -Attackers: see above “attackers” discription -waiting_time: which is the time (seconds) from the process being killed to stoping monitors the monitors -Monitors: see above “monitors” discription -SLA: see above “metrics” discription 2)POD file: pod.yaml The POD configuration should record on pod.yaml first. the “host” item in this test case will use the node name in the pod.yaml. |
| test sequence | description and expected result |
| step 1 | start monitors: each monitor will run with independently process Result: The monitor info will be collected. |
| step 2 | do attacker: connect the host through SSH, and then execute the stress cpu script on the host. Result: The CPU usage of the host will be stressed to 100%. |
| step 3 | stop monitors after a period of time specified by “waiting_time” Result: The monitor info will be aggregated. |
| step 4 | verify the SLA Result: The test case is passed or not. |
| post-action | It is the action when the test cases exist. It kills the process that stresses the CPU usage. |
| test verdict | Fails only if SLA is not passed, or if there is a test case execution problem. |
| OpenStack Controller Node Disk I/O Block High Availability | |
| test case id | OPNFV_YARDSTICK_TC052: OpenStack Controller Node Disk I/O Block High Availability |
| test purpose | This test case will verify the high availability of control node. When the disk I/O of a specified disk is blocked, which breaks down the Openstack services on this node. Read and write services should still be accessed by other controller nodes, and the services on failed controller node should be isolated. |
| test method | This test case blocks the disk I/O of a specified control node, then checks whether the services that need to read or wirte the disk of the control node are OK with some monitor tools. |
| attackers | In this test case, an attacker called “disk-block” is needed. This attacker includes two parameters: 1) fault_type: which is used for finding the attacker’s scripts. It should be always set to “disk-block” in this test case. 2) host: which is the name of a control node being attacked. e.g. -fault_type: “disk-block” -host: node1 |
| monitors | In this test case, two kinds of monitor are needed: 1. the “openstack-cmd” monitor constantly request a specific Openstack command, which needs two parameters: 1) monitor_type: which is used for finding the monitor class and related scripts. It should be always set to “openstack-cmd” for this monitor. 2) command_name: which is the command name used for request. e.g. -monitor_type: “openstack-cmd” -command_name: “nova flavor-list” 2. the second monitor verifies the read and write function by a “operation” and a “result checker”. the “operation” have two parameters: 1) operation_type: which is used for finding the operation class and related scripts. 2) action_parameter: parameters for the operation. the “result checker” have three parameters: 1) checker_type: which is used for finding the reuslt checker class and realted scripts. 2) expectedValue: the expected value for the output of the checker script. 3) condition: whether the expected value is in the output of checker script or is totally same with the output. In this case, the “operation” adds a flavor and the “result checker” checks whether ths flavor is created. Their parameters show as follows: operation: -operation_type: “nova-create-flavor” -action_parameter:
result checker: -checker_type: “check-flavor” -expectedValue: “test-001” -condition: “in” |
| metrics | In this test case, there is one metric: 1)service_outage_time: which indicates the maximum outage time (seconds) of the specified Openstack command request. |
| test tool | Developed by the project. Please see folder: “yardstick/benchmark/scenarios/availability/ha_tools” |
| references | ETSI NFV REL001 |
| configuration | This test case needs two configuration files: 1) test case file: opnfv_yardstick_tc052.yaml -Attackers: see above “attackers” discription -waiting_time: which is the time (seconds) from the process being killed to stoping monitors the monitors -Monitors: see above “monitors” discription -SLA: see above “metrics” discription 2)POD file: pod.yaml The POD configuration should record on pod.yaml first. the “host” item in this test case will use the node name in the pod.yaml. |
| test sequence | description and expected result |
| step 1 | do attacker: connect the host through SSH, and then execute the block disk I/O script on the host. Result: The disk I/O of the host will be blocked |
| step 2 | start monitors: each monitor will run with independently process Result: The monitor info will be collected. |
| step 3 | do operation: add a flavor |
| step 4 | do result checker: check whether the falvor is created |
| step 5 | stop monitors after a period of time specified by “waiting_time” Result: The monitor info will be aggregated. |
| step 6 | verify the SLA Result: The test case is passed or not. |
| post-action | It is the action when the test cases exist. It excutes the release disk I/O script to release the blocked I/O. |
| test verdict | Fails if monnitor SLA is not passed or the result checker is not passed, or if there is a test case execution problem. |
| OpenStack Controller Load Balance Service High Availability | |
| test case id | OPNFV_YARDSTICK_TC053: OpenStack Controller Load Balance Service High Availability |
| test purpose | This test case will verify the high availability of the load balance service(current is HAProxy) that supports OpenStack on controller node. When the load balance service of a specified controller node is killed, whether other load balancers on other controller nodes will work, and whether the controller node will restart the load balancer are checked. |
| test method | This test case kills the processes of load balance service on a selected control node, then checks whether the request of the related Openstack command is OK and the killed processes are recovered. |
| attackers | In this test case, an attacker called “kill-process” is needed. This attacker includes three parameters: 1) fault_type: which is used for finding the attacker’s scripts. It should be always set to “kill-process” in this test case. 2) process_name: which is the process name of the specified OpenStack service. If there are multiple processes use the same name on the host, all of them are killed by this attacker. In this case. This parameter should always set to “swift- proxy”. 3) host: which is the name of a control node being attacked. e.g. -fault_type: “kill-process” -process_name: “haproxy” -host: node1 |
| monitors | In this test case, two kinds of monitor are needed: 1. the “openstack-cmd” monitor constantly request a specific Openstack command, which needs two parameters: 1) monitor_type: which is used for finding the monitor class and related scritps. It should be always set to “openstack-cmd” for this monitor. 2) command_name: which is the command name used for request. 2. the “process” monitor check whether a process is running on a specific node, which needs three parameters: 1) monitor_type: which used for finding the monitor class and related scripts. It should be always set to “process” for this monitor. 2) process_name: which is the process name for monitor 3) host: which is the name of the node runing the process In this case, the command_name of monitor1 should be services that is supported by load balancer and the process- name of monitor2 should be “haproxy”, for example: e.g. monitor1: -monitor_type: “openstack-cmd” -command_name: “nova image-list” monitor2: -monitor_type: “process” -process_name: “haproxy” -host: node1 |
| metrics | In this test case, there are two metrics: 1)service_outage_time: which indicates the maximum outage time (seconds) of the specified Openstack command request. 2)process_recover_time: which indicates the maximun time (seconds) from the process being killed to recovered |
| test tool | Developed by the project. Please see folder: “yardstick/benchmark/scenarios/availability/ha_tools” |
| references | ETSI NFV REL001 |
| configuration | This test case needs two configuration files: 1) test case file: opnfv_yardstick_tc053.yaml -Attackers: see above “attackers” discription -waiting_time: which is the time (seconds) from the process being killed to stoping monitors the monitors -Monitors: see above “monitors” discription -SLA: see above “metrics” discription 2)POD file: pod.yaml The POD configuration should record on pod.yaml first. the “host” item in this test case will use the node name in the pod.yaml. |
| test sequence | description and expected result |
| step 1 | start monitors: each monitor will run with independently process Result: The monitor info will be collected. |
| step 2 | do attacker: connect the host through SSH, and then execute the kill process script with param value specified by “process_name” Result: Process will be killed. |
| step 3 | stop monitors after a period of time specified by “waiting_time” Result: The monitor info will be aggregated. |
| step 4 | verify the SLA Result: The test case is passed or not. |
| post-action | It is the action when the test cases exist. It will check the status of the specified process on the host, and restart the process if it is not running for next test cases. Notice: This post-action uses ‘lsb_release’ command to check the host linux distribution and determine the OpenStack service name to restart the process. Lack of ‘lsb_release’ on the host may cause failure to restart the process. |
| test verdict | Fails only if SLA is not passed, or if there is a test case execution problem. |
| OpenStack Virtual IP High Availability | |
| test case id | OPNFV_YARDSTICK_TC054: OpenStack Virtual IP High Availability |
| test purpose | This test case will verify the high availability for virtual ip in the environment. When master node of virtual ip is abnormally shutdown, connection to virtual ip and the services binded to the virtual IP it should be OK. |
| test method | This test case shutdowns the virtual IP master node with some fault injection tools, then checks whether virtual ips can be pinged and services binded to virtual ip are OK with some monitor tools. |
| attackers | In this test case, an attacker called “control-shutdown” is needed. This attacker includes two parameters: 1) fault_type: which is used for finding the attacker’s scripts. It should be always set to “control-shutdown” in this test case. 2) host: which is the name of a control node being attacked. In this case the host should be the virtual ip master node, that means the host ip is the virtual ip, for exapmle: -fault_type: “control-shutdown” -host: node1(the VIP Master node) |
| monitors | In this test case, two kinds of monitor are needed: 1. the “ip_status” monitor that pings a specific ip to check the connectivity of this ip, which needs two parameters: 1) monitor_type: which is used for finding the monitor class and related scripts. It should be always set to “ip_status” for this monitor. 2) ip_address: The ip to be pinged. In this case, ip_address should be the virtual IP. 2. the “openstack-cmd” monitor constantly request a specific Openstack command, which needs two parameters: 1) monitor_type: which is used for finding the monitor class and related scripts. It should be always set to “openstack-cmd” for this monitor. 2) command_name: which is the command name used for request. e.g. monitor1: -monitor_type: “ip_status” -host: 192.168.0.2 monitor2: -monitor_type: “openstack-cmd” -command_name: “nova image-list” |
| metrics | In this test case, there are two metrics: 1) ping_outage_time: which-indicates the maximum outage time to ping the specified host. 2)service_outage_time: which indicates the maximum outage time (seconds) of the specified Openstack command request. |
| test tool | Developed by the project. Please see folder: “yardstick/benchmark/scenarios/availability/ha_tools” |
| references | ETSI NFV REL001 |
| configuration | This test case needs two configuration files: 1) test case file: opnfv_yardstick_tc054.yaml -Attackers: see above “attackers” discription -waiting_time: which is the time (seconds) from the process being killed to stoping monitors the monitors -Monitors: see above “monitors” discription -SLA: see above “metrics” discription 2)POD file: pod.yaml The POD configuration should record on pod.yaml first. the “host” item in this test case will use the node name in the pod.yaml. |
| test sequence | description and expected result |
| step 1 | start monitors: each monitor will run with independently process Result: The monitor info will be collected. |
| step 2 | do attacker: connect the host through SSH, and then execute the shutdown script on the VIP master node. Result: VIP master node will be shutdown |
| step 3 | stop monitors after a period of time specified by “waiting_time” Result: The monitor info will be aggregated. |
| step 4 | verify the SLA Result: The test case is passed or not. |
| post-action | It is the action when the test cases exist. It restarts the original VIP master node if it is not restarted. |
| test verdict | Fails only if SLA is not passed, or if there is a test case execution problem. |
| OpenStack Controller Messaging Queue Service High Availability | |
| test case id | OPNFV_YARDSTICK_TC056:OpenStack Controller Messaging Queue Service High Availability |
| test purpose | This test case will verify the high availability of the messaging queue service(RabbitMQ) that supports OpenStack on controller node. When messaging queue service(which is active) of a specified controller node is killed, the test case will check whether messaging queue services(which are standby) on other controller nodes will be switched active, and whether the cluster manager on attacked the controller node will restart the stopped messaging queue. |
| test method | This test case kills the processes of messaging queue service on a selected controller node, then checks whether the request of the related Openstack command is OK and the killed processes are recovered. |
| attackers | In this test case, an attacker called “kill-process” is needed. This attacker includes three parameters: 1) fault_type: which is used for finding the attacker’s scripts. It should be always set to “kill-process” in this test case. 2) process_name: which is the process name of the specified OpenStack service. If there are multiple processes use the same name on the host, all of them are killed by this attacker. In this case, this parameter should always set to “rabbitmq”. 3) host: which is the name of a control node being attacked. e.g. -fault_type: “kill-process” -process_name: “rabbitmq-server” -host: node1 |
| monitors | In this test case, two kinds of monitor are needed: 1. the “openstack-cmd” monitor constantly request a specific Openstack command, which needs two parameters: 1) monitor_type: which is used for finding the monitor class and related scritps. It should be always set to “openstack-cmd” for this monitor. 2) command_name: which is the command name used for request. 2. the “process” monitor check whether a process is running on a specific node, which needs three parameters: 1) monitor_type: which used for finding the monitor class and related scripts. It should be always set to “process” for this monitor. 2) process_name: which is the process name for monitor 3) host: which is the name of the node runing the process In this case, the command_name of monitor1 should be services that will use the messaging queue(current nova, neutron, cinder ,heat and ceilometer are using RabbitMQ) , and the process-name of monitor2 should be “rabbitmq”, for example: e.g. monitor1-1: -monitor_type: “openstack-cmd” -command_name: “openstack image list” monitor1-2: -monitor_type: “openstack-cmd” -command_name: “openstack network list” monitor1-3: -monitor_type: “openstack-cmd” -command_name: “openstack volume list” monitor2: -monitor_type: “process” -process_name: “rabbitmq” -host: node1 |
| metrics | In this test case, there are two metrics: 1)service_outage_time: which indicates the maximum outage time (seconds) of the specified Openstack command request. 2)process_recover_time: which indicates the maximum time (seconds) from the process being killed to recovered |
| test tool | Developed by the project. Please see folder: “yardstick/benchmark/scenarios/availability/ha_tools” |
| references | ETSI NFV REL001 |
| configuration | This test case needs two configuration files: 1) test case file: opnfv_yardstick_tc056.yaml -Attackers: see above “attackers” description -waiting_time: which is the time (seconds) from the process being killed to stoping monitors the monitors -Monitors: see above “monitors” description -SLA: see above “metrics” description 2)POD file: pod.yaml The POD configuration should record on pod.yaml first. the “host” item in this test case will use the node name in the pod.yaml. |
| test sequence | description and expected result |
| step 1 | start monitors: each monitor will run with independently process Result: The monitor info will be collected. |
| step 2 | do attacker: connect the host through SSH, and then execute the kill process script with param value specified by “process_name” Result: Process will be killed. |
| step 3 | stop monitors after a period of time specified by “waiting_time” Result: The monitor info will be aggregated. |
| step 4 | verify the SLA Result: The test case is passed or not. |
| post-action | It is the action when the test cases exist. It will check the status of the specified process on the host, and restart the process if it is not running for next test cases. Notice: This post-action uses ‘lsb_release’ command to check the host linux distribution and determine the OpenStack service name to restart the process. Lack of ‘lsb_release’ on the host may cause failure to restart the process. |
| test verdict | Fails only if SLA is not passed, or if there is a test case execution problem. |
| OpenStack Controller Cluster Management Service High Availability | |||
| test case id | OPNFV_YARDSTICK_TC057_HA: OpenStack Controller Cluster Management Service High Availability | ||
| test purpose | This test case will verify the quorum configuration of the cluster manager(pacemaker) on controller nodes. When a controller node , which holds all active application resources, failed to communicate with other cluster nodes (via corosync), the test case will check whether the standby application resources will take place of those active application resources which should be regarded to be down in the cluster manager. | ||
| test method | This test case kills the processes of cluster messaging service(corosync) on a selected controller node(the node holds the active application resources), then checks whether active application resources are switched to other controller nodes and whether the Openstack commands are OK. | ||
| attackers | In this test case, an attacker called “kill-process” is needed. This attacker includes three parameters: 1) fault_type: which is used for finding the attacker’s scripts. It should be always set to “kill-process” in this test case. 2) process_name: which is the process name of the load balance service. If there are multiple processes use the same name on the host, all of them are killed by this attacker. 3) host: which is the name of a control node being attacked. In this case, this process name should set to “corosync” , for example -fault_type: “kill-process” -process_name: “corosync” -host: node1 |
||
| monitors | In this test case, a kind of monitor is needed: 1. the “openstack-cmd” monitor constantly request a specific
1) monitor_type: which is used for finding the monitor class and related scripts. It should be always set to “openstack-cmd” for this monitor. 2) command_name: which is the command name used for request In this case, the command_name of monitor1 should be services that are managed by the cluster manager. (Since rabbitmq and haproxy are managed by pacemaker, most Openstack Services can be used to check high availability in this case) (e.g.) monitor1: -monitor_type: “openstack-cmd” -command_name: “nova image-list” monitor2: -monitor_type: “openstack-cmd” -command_name: “neutron router-list” monitor3: -monitor_type: “openstack-cmd” -command_name: “heat stack-list” monitor4: -monitor_type: “openstack-cmd” -command_name: “cinder list” |
||
| checkers | In this test case, a checker is needed, the checker will the status of application resources in pacemaker and the checker have three parameters: 1) checker_type: which is used for finding the result checker class and related scripts. In this case the checker type will be “pacemaker-check-resource” 2) resource_name: the application resource name 3) resource_status: the expected status of the resource 4) expectedValue: the expected value for the output of the checker script, in the case the expected value will be the identifier in the cluster manager 3) condition: whether the expected value is in the output of checker script or is totally same with the output. (note: pcs is required to installed on controller node in order to run this checker) (e.g.) checker1: -checker_type: “pacemaker-check-resource” -resource_name: “p_rabbitmq-server” -resource_status: “Stopped” -expectedValue: “node-1” -condition: “in” checker2: -checker_type: “pacemaker-check-resource” -resource_name: “p_rabbitmq-server” -resource_status: “Master” -expectedValue: “node-2” -condition: “in” |
||
| metrics | In this test case, there are two metrics: 1)service_outage_time: which indicates the maximum outage time (seconds) of the specified Openstack command request. | ||
| test tool | None. Self-developed. | ||
| references | ETSI NFV REL001 | ||
| configuration | This test case needs two configuration files: 1) test case file: opnfv_yardstick_tc057.yaml -Attackers: see above “attackers” description -Monitors: see above “monitors” description -Checkers: see above “checkers” description -Steps: the test case execution step, see “test sequence” description below 2)POD file: pod.yaml The POD configuration should record on pod.yaml first. the “host” item in this test case will use the node name in the pod.yaml. |
||
| test sequence | description and expected result | ||
| step 1 | start monitors: each monitor will run with independently process Result: The monitor info will be collected. |
||
| step 2 | do attacker: connect the host through SSH, and then execute the kill process script with param value specified by “process_name” Result: Process will be killed. |
||
| step 3 | do checker: check whether the status of application resources on different nodes are updated | ||
| step 4 | stop monitors after a period of time specified by “waiting_time” Result: The monitor info will be aggregated. |
||
| step 5 | verify the SLA Result: The test case is passed or not. |
||
| post-action | It is the action when the test cases exist. It will check the status of the cluster messaging process(corosync) on the host, and restart the process if it is not running for next test cases. Notice: This post-action uses ‘lsb_release’ command to check the host linux distribution and determine the OpenStack service name to restart the process. Lack of ‘lsb_release’ on the host may cause failure to restart the process. | ||
| test verdict | Fails only if SLA is not passed, or if there is a test case execution problem. | ||
| OpenStack Controller Virtual Router Service High Availability | |||
| test case id | OPNFV_YARDSTICK_TC058: OpenStack Controller Virtual Router Service High Availability | ||
| test purpose | This test case will verify the high availability of virtual routers(L3 agent) on controller node. When a virtual router service on a specified controller node is shut down, this test case will check whether the network of virtual machines will be affected, and whether the attacked virtual router service will be recovered. | ||
| test method | This test case kills the processes of virtual router service (l3-agent) on a selected controller node(the node holds the active l3-agent), then checks whether the network routing of virtual machines is OK and whether the killed service will be recovered. | ||
| attackers | In this test case, an attacker called “kill-process” is needed. This attacker includes three parameters: 1) fault_type: which is used for finding the attacker’s scripts. It should be always set to “kill-process” in this test case. 2) process_name: which is the process name of the load balance service. If there are multiple processes use the same name on the host, all of them are killed by this attacker. 3) host: which is the name of a control node being attacked. In this case, this process name should set to “l3agent” , for example -fault_type: “kill-process” -process_name: “l3agent” -host: node1 |
||
| monitors | In this test case, two kinds of monitor are needed: 1. the “ip_status” monitor that pings a specific ip to check the connectivity of this ip, which needs two parameters: 1) monitor_type: which is used for finding the monitor class and related scripts. It should be always set to “ip_status” for this monitor. 2) ip_address: The ip to be pinged. In this case, ip_address will be either an ip address of external network or an ip address of a virtual machine. 3) host: The node on which ping will be executed, in this case the host will be a virtual machine. 2. the “process” monitor check whether a process is running on a specific node, which needs three parameters: 1) monitor_type: which used for finding the monitor class and related scripts. It should be always set to “process” for this monitor. 2) process_name: which is the process name for monitor. In this case, the process-name of monitor2 should be “l3agent” 3) host: which is the name of the node running the process e.g. monitor1-1: -monitor_type: “ip_status” -host: 172.16.0.11 -ip_address: 172.16.1.11 monitor1-2: -monitor_type: “ip_status” -host: 172.16.0.11 -ip_address: 8.8.8.8 monitor2: -monitor_type: “process” -process_name: “l3agent” -host: node1 |
||
| metrics | In this test case, there are two metrics: 1)service_outage_time: which indicates the maximum outage time (seconds) of the specified Openstack command request. 2)process_recover_time: which indicates the maximum time (seconds) from the process being killed to recovered | ||
| test tool | None. Self-developed. | ||
| references | ETSI NFV REL001 | ||
| configuration | This test case needs two configuration files: 1) test case file: opnfv_yardstick_tc058.yaml -Attackers: see above “attackers” description -Monitors: see above “monitors” description -Steps: the test case execution step, see “test sequence” description below 2)POD file: pod.yaml The POD configuration should record on pod.yaml first. the “host” item in this test case will use the node name in the pod.yaml. |
||
| test sequence | description and expected result | ||
| pre-test conditions | The test case image needs to be installed into Glance with cachestat included in the image. | ||
| step 1 | Two host VMs are booted, these two hosts are in two different networks, the networks are connected by a virtual router. | ||
| step 1 | start monitors: each monitor will run with independently process Result: The monitor info will be collected. |
||
| step 2 | do attacker: connect the host through SSH, and then execute the kill process script with param value specified by “process_name” Result: Process will be killed. |
||
| step 4 | stop monitors after a period of time specified by “waiting_time” Result: The monitor info will be aggregated. |
||
| step 5 | verify the SLA Result: The test case is passed or not. |
||
| post-action | It is the action when the test cases exist. It will check the status of the specified process on the host, and restart the process if it is not running for next test cases. Virtual machines and network created in the test case will be destoryed. Notice: This post-action uses ‘lsb_release’ command to check the host linux distribution and determine the OpenStack service name to restart the process. Lack of ‘lsb_release’ on the host may cause failure to restart the process. |
||
| test verdict | Fails only if SLA is not passed, or if there is a test case execution problem. | ||
| SDN Controller resilience in HA configuration | |
| test case id | OPNFV_YARDSTICK_TC092: SDN controller resilience and high availability HA configuration |
| test purpose | This test validates SDN controller node high availability by verifying there is no impact on the data plane connectivity when one SDN controller fails in a HA configuration, i.e. all existing configured network services DHCP, ARP, L2, L3VPN, Security Groups should continue to operate between the existing VMs while one SDN controller instance is offline and rebooting. The test also validates that network service operations such as creating a new VM in an existing or new L2 network network remain operational while one instance of the SDN controller is offline and recovers from the failure. |
| test method |
|
| attackers | In this test case, an attacker called “kill-process” is needed. This attacker includes three parameters:
|
| monitors |
|
| operations |
|
| metrics |
|
| test tool | Developed by the project. Please see folder: “yardstick/benchmark/scenarios/availability/ha_tools” |
| references | TBD |
| configuration |
|
| test sequence | Description and expected result |
| pre-action |
|
| step 1 |
Each monitor runs in an independent process. Result: The monitor info will be collected. |
| step 2 | Start attacker: SSH to the VIM node and kill the SDN controller process determined in step 2. Result: One SDN controller service will be shut down |
| step 3 | Restart the SDN controller. |
| step 4 | Create a new VM in the existing Neutron network while the SDN controller is offline or still recovering. |
| step 5 | Stop IP connectivity monitors after a period of time specified by “waiting_time” Result: The monitor info will be aggregated |
| step 6 | Verify the IP connectivity monitor result Result: IP connectivity monitor should not have any packet drop failures reported |
| step 7 | Verify process_recover_time, which indicates the maximun time (seconds) from the process being killed to recovered, is within the SLA. This step blocks until either the process has recovered or a timeout occurred. Result: process_recover_time is within SLA limits, if not, test case failed and stopped. |
| step 8 |
Result: The monitor info will be collected. |
| step 9 | Stop IP connectivity monitors after a period of time specified by “waiting_time” Result: The monitor info will be aggregated |
| step 10 | Verify the IP connectivity monitor result Result: IP connectivity monitor should not have any packet drop failures reported |
| test verdict | Fails only if SLA is not passed, or if there is a test case execution problem. |
| SDN Vswitch resilience in non-HA or HA configuration | |
| test case id | OPNFV_YARDSTICK_TC093: SDN Vswitch resilience in non-HA or HA configuration |
| test purpose | This test validates that network data plane services are resilient in the event of Virtual Switch failure in compute nodes. Specifically, the test verifies that existing data plane connectivity is not permanently impacted i.e. all configured network services such as DHCP, ARP, L2, L3 Security Groups continue to operate between the existing VMs eventually after the Virtual Switches have finished rebooting. The test also validates that new network service operations (creating a new VM in the existing L2/L3 network or in a new network, etc.) are operational after the Virtual Switches have recovered from a failure. |
| test method | This testcase first checks if the already configured DHCP/ARP/L2/L3/SNAT connectivity is proper. After it fails and restarts again the VSwitch services which are running on both OpenStack compute nodes, and then checks if already configured DHCP/ARP/L2/L3/SNAT connectivity is not permanently impacted (even if there are some packet loss events) between VMs and the system is able to execute new virtual network operations once the Vswitch services are restarted and have been fully recovered |
| attackers | In this test case, two attackers called “kill-process” are needed. These attackers include three parameters:
|
| monitors | This test case utilizes two monitors of type “ip-status” and one monitor of type “process” to track the following conditions:
Monitors of type “ip-status” use the “ping” utility to verify reachability of a given target IP. |
| operations |
|
| metrics |
|
| test tool | Developed by the project. Please see folder: “yardstick/benchmark/scenarios/availability/ha_tools” |
| references | none |
| configuration |
|
| test sequence | Description and expected result |
| pre-action |
|
| step 1 |
Result: The monitor info will be collected. |
| step 2 | Start attackers: SSH connect to the VIM compute nodes and kill the Vswitch processes Result: the SDN Vswitch services will be shutdown |
| step 3 | Verify the results of the IP connectivity monitors. Result: The outage_time metric reported by the monitors is not greater than the max_outage_time. |
| step 4 | Restart the SDN Vswitch services. |
| step 5 | Create a new VM in the existing Neutron network |
| step 6 |
|
| step 7 | Stop IP connectivity monitors after a period of time specified by “monitor_time” Result: The monitor info will be aggregated |
| step 8 | Verify the IP connectivity monitor results Result: IP connectivity monitor should not have any packet drop failures reported |
| test verdict | This test fails if the SLAs are not met or if there is a test case execution problem. The SLAs are define as follows for this test:
|
| IPv6 connectivity between nodes on the tenant network | |
| test case id | OPNFV_YARDSTICK_TC027_IPv6 connectivity |
| metric | RTT, Round Trip Time |
| test purpose | To do a basic verification that IPv6 connectivity is within acceptable boundaries when ipv6 packets travel between hosts located on same or different compute blades. The purpose is also to be able to spot trends. Test results, graphs and similar shall be stored for comparison reasons and product evolution understanding between different OPNFV versions and/or configurations. |
| configuration | file: opnfv_yardstick_tc027.yaml Packet size 56 bytes. SLA RTT is set to maximum 30 ms. ipv6 test case can be configured as three independent modules (setup, run, teardown). if you only want to setup ipv6 testing environment, do some tests as you want, “run_step” of task yaml file should be configured as “setup”. if you want to setup and run ping6 testing automatically, “run_step” should be configured as “setup, run”. and if you have had a environment which has been setup, you only wan to verify the connectivity of ipv6 network, “run_step” should be “run”. Of course, default is that three modules run sequentially. |
| test tool | ping6 Ping6 is normally part of Linux distribution, hence it doesn’t need to be installed. |
| references |
ETSI-NFV-TST001 |
| applicability | Test case can be configured with different run step you can run setup, run benchmark, teardown independently SLA is optional. The SLA in this test case serves as an example. Considerably lower RTT is expected. |
| pre-test conditions | The test case image needs to be installed into Glance with ping6 included in it. For Brahmaputra, a compass_os_nosdn_ha deploy scenario is need. more installer and more sdn deploy scenario will be supported soon |
| test sequence | description and expected result |
| step 1 | To setup IPV6 testing environment: 1. disable security group 2. create (ipv6, ipv4) router, network and subnet 3. create VRouter, VM1, VM2 |
| step 2 | To run ping6 to verify IPV6 connectivity : 1. ssh to VM1 2. Ping6 to ipv6 router from VM1 3. Get the result(RTT) and logs are stored |
| step 3 | To teardown IPV6 testing environment 1. delete VRouter, VM1, VM2 2. delete (ipv6, ipv4) router, network and subnet 3. enable security group |
| test verdict | Test should not PASS if any RTT is above the optional SLA value, or if there is a test case execution problem. |
| KVM Latency measurements | |
| test case id | OPNFV_YARDSTICK_TC028_KVM Latency measurements |
| metric | min, avg and max latency |
| test purpose | To evaluate the IaaS KVM virtualization capability with regards to min, avg and max latency. The purpose is also to be able to spot trends. Test results, graphs and similar shall be stored for comparison reasons and product evolution understanding between different OPNFV versions and/or configurations. |
| configuration | file: samples/cyclictest-node-context.yaml |
| test tool | Cyclictest (Cyclictest is not always part of a Linux distribution, hence it needs to be installed. As an example see the /yardstick/tools/ directory for how to generate a Linux image with cyclictest included.) |
| references | Cyclictest |
| applicability | This test case is mainly for kvm4nfv project CI verify. Upgrade host linux kernel, boot a gust vm update it’s linux kernel, and then run the cyclictest to test the new kernel is work well. |
| pre-test conditions | The test kernel rpm, test sequence scripts and test guest image need put the right folders as specified in the test case yaml file. The test guest image needs with cyclictest included in it. No POD specific requirements have been identified. |
| test sequence | description and expected result |
| step 1 | The host and guest os kernel is upgraded. Cyclictest is invoked and logs are produced and stored. Result: Logs are stored. |
| test verdict | Fails only if SLA is not passed, or if there is a test case execution problem. |
| Verify Parser Yang-to-Tosca | |
| test case id | OPNFV_YARDSTICK_TC040 Verify Parser Yang-to-Tosca |
| metric |
|
| test purpose | To verify the function of Yang-to-Tosca in Parser. |
| configuration | file: opnfv_yardstick_tc040.yaml yangfile: the path of the yangfile which you want to convert toscafile: the path of the toscafile which is your expected outcome. |
| test tool | Parser (Parser is not part of a Linux distribution, hence it needs to be installed. As an example see the /yardstick/benchmark/scenarios/parser/parser_setup.sh for how to install it manual. Of course, it will be installed and uninstalled automatically when you run this test case by yardstick) |
| references | Parser |
| applicability | Test can be configured with different path of yangfile and toscafile to fit your real environment to verify Parser |
| pre-test conditions | No POD specific requirements have been identified. it can be run without VM |
| test sequence | description and expected result |
| step 1 | parser is installed without VM, running Yang-to-Tosca module to convert yang file to tosca file, validating output against expected outcome. Result: Logs are stored. |
| test verdict | Fails only if output is different with expected outcome or if there is a test case execution problem. |
| Volume storage Performance | |
| test case id | OPNFV_YARDSTICK_TC006_VOLUME STORAGE PERFORMANCE |
| metric | IOPS (Average IOs performed per second), Throughput (Average disk read/write bandwidth rate), Latency (Average disk read/write latency) |
| test purpose | The purpose of TC006 is to evaluate the IaaS volume storage performance with regards to IOPS, throughput and latency. The purpose is also to be able to spot the trends. Test results, graphs and similar shall be stored for comparison reasons and product evolution understanding between different OPNFV versions and/or configurations. |
| test tool | fio fio is an I/O tool meant to be used both for benchmark and stress/hardware verification. It has support for 19 different types of I/O engines (sync, mmap, libaio, posixaio, SG v3, splice, null, network, syslet, guasi, solarisaio, and more), I/O priorities (for newer Linux kernels), rate I/O, forked or threaded jobs, and much more. (fio is not always part of a Linux distribution, hence it needs to be installed. As an example see the /yardstick/tools/ directory for how to generate a Linux image with fio included.) |
| test description | fio test is invoked in a host VM with a volume attached on a compute blade, a job file as well as parameters are passed to fio and fio will start doing what the job file tells it to do. |
| configuration | file: opnfv_yardstick_tc006.yaml Fio job file is provided to define the benchmark process Target volume is mounted at /FIO_Test directory For SLA, minimum read/write iops is set to 100, minimum read/write throughput is set to 400 KB/s, and maximum read/write latency is set to 20000 usec. |
| applicability | This test case can be configured with different:
SLA is optional. The SLA in this test case serves as an example. Considerably higher throughput and lower latency are expected. However, to cover most configurations, both baremetal and fully virtualized ones, this value should be possible to achieve and acceptable for black box testing. Many heavy IO applications start to suffer badly if the read/write bandwidths are lower than this. |
| usability | This test case is one of Yardstick’s generic test. Thus it is runnable on most of the scenarios. |
| references |
ETSI-NFV-TST001 |
| pre-test conditions | The test case image needs to be installed into Glance with fio included in it. No POD specific requirements have been identified. |
| test sequence | description and expected result |
| step 1 | A host VM with fio installed is booted. A 200G volume is attached to the host VM |
| step 2 | Yardstick is connected with the host VM by using ssh. ‘job_file.ini’ is copyied from Jump Host to the host VM via the ssh tunnel. The attached volume is formated and mounted. |
| step 3 | Fio benchmark is invoked. Simulated IO operations are started. IOPS, disk read/write bandwidth and latency are recorded and checked against the SLA. Logs are produced and stored. Result: Logs are stored. |
| step 4 | The host VM is deleted. |
| test verdict | Fails only if SLA is not passed, or if there is a test case execution problem. |
| test case slogan e.g. Network Latency | |
| test case id | e.g. OPNFV_YARDSTICK_TC001_NW Latency |
| metric | what will be measured, e.g. latency |
| test purpose | describe what is the purpose of the test case |
| configuration | what .yaml file to use, state SLA if applicable, state test duration, list and describe the scenario options used in this TC and also list the options using default values. |
| test tool | e.g. ping |
| references | e.g. RFCxxx, ETSI-NFVyyy |
| applicability | describe variations of the test case which can be performend, e.g. run the test for different packet sizes |
| pre-test conditions | describe configuration in the tool(s) used to perform the measurements (e.g. fio, pktgen), POD-specific configuration required to enable running the test |
| test sequence | description and expected result |
| step 1 | use this to describe tests that require sveveral steps e.g collect logs. Result: what happens in this step e.g. logs collected |
| step 2 | remove interface Result: interface down. |
| step N | what is done in step N Result: what happens |
| test verdict | expected behavior, or SLA, pass/fail criteria |
A nice feature of the input task format used in Yardstick is that it supports the template syntax based on Jinja2. This turns out to be extremely useful when, say, you have a fixed structure of your task but you want to parameterize this task in some way. For example, imagine your input task file (task.yaml) runs a set of Ping scenarios:
# Sample benchmark task config file
# measure network latency using ping
schema: "yardstick:task:0.1"
scenarios:
-
type: Ping
options:
packetsize: 200
host: athena.demo
target: ares.demo
runner:
type: Duration
duration: 60
interval: 1
sla:
max_rtt: 10
action: monitor
context:
...
Let’s say you want to run the same set of scenarios with the same runner/ context/sla, but you want to try another packetsize to compare the performance. The most elegant solution is then to turn the packetsize name into a template variable:
# Sample benchmark task config file
# measure network latency using ping
schema: "yardstick:task:0.1"
scenarios:
-
type: Ping
options:
packetsize: {{packetsize}}
host: athena.demo
target: ares.demo
runner:
type: Duration
duration: 60
interval: 1
sla:
max_rtt: 10
action: monitor
context:
...
and then pass the argument value for {{packetsize}} when starting a task with this configuration file. Yardstick provides you with different ways to do that:
1.Pass the argument values directly in the command-line interface (with either a JSON or YAML dictionary):
yardstick task start samples/ping-template.yaml
--task-args'{"packetsize":"200"}'
2.Refer to a file that specifies the argument values (JSON/YAML):
yardstick task start samples/ping-template.yaml --task-args-file args.yaml
Note that the Jinja2 template syntax allows you to set the default values for your parameters. With default values set, your task file will work even if you don’t parameterize it explicitly while starting a task. The default values should be set using the {% set ... %} clause (task.yaml). For example:
# Sample benchmark task config file
# measure network latency using ping
schema: "yardstick:task:0.1"
{% set packetsize = packetsize or "100" %}
scenarios:
-
type: Ping
options:
packetsize: {{packetsize}}
host: athena.demo
target: ares.demo
runner:
type: Duration
duration: 60
interval: 1
...
If you don’t pass the value for {{packetsize}} while starting a task, the default one will be used.
Yardstick makes it possible to use all the power of Jinja2 template syntax, including the mechanism of built-in functions. As an example, let us make up a task file that will do a block storage performance test. The input task file (fio-template.yaml) below uses the Jinja2 for-endfor construct to accomplish that:
#Test block sizes of 4KB, 8KB, 64KB, 1MB
#Test 5 workloads: read, write, randwrite, randread, rw
schema: "yardstick:task:0.1"
scenarios:
{% for bs in ['4k', '8k', '64k', '1024k' ] %}
{% for rw in ['read', 'write', 'randwrite', 'randread', 'rw' ] %}
-
type: Fio
options:
filename: /home/ubuntu/data.raw
bs: {{bs}}
rw: {{rw}}
ramp_time: 10
host: fio.demo
runner:
type: Duration
duration: 60
interval: 60
{% endfor %}
{% endfor %}
context
...
This chapter lists available NSB test cases.
| NSB PROX test for NFVI characterization | |
| test case id | tc_prox_{context}_acl-{port_num}
|
| metric |
|
| test purpose | This test allows to measure how well the SUT can exploit structures in the list of ACL rules. The ACL rules are matched against a 7-tuple of the input packet: the regular 5-tuple and two VLAN tags. The rules in the rule set allow the packet to be forwarded and the rule set contains a default “match all” rule. The KPI is measured with the rule set that has a moderate number of rules with moderate similarity between the rules & the fraction of rules that were used. The ACL test cases are implemented to run in baremetal and heat context for 2 port and 4 port configuration. |
| configuration | The ACL test cases are listed below:
Test duration is set as 300sec for each test. Packet size set as 64 bytes in traffic profile. These can be configured |
| test tool | PROX PROX is a DPDK application that can simulate VNF workloads and can generate traffic and used for NFVI characterization |
| applicability | This PROX ACL test cases can be configured with different:
Default values exist. |
| pre-test conditions | For Openstack test case image (yardstick-samplevnfs) needs to be installed into Glance with Prox and Dpdk included in it. The test need multi-queue enabled in Glance image. For Baremetal tests cases Prox and Dpdk must be installed in the hosts where the test is executed. The pod.yaml file must have the necessary system and NIC information |
| test sequence | description and expected result |
| step 1 | For Baremetal test: The TG and VNF are started on the hosts based on the pod file. For Heat test: Two host VMs are booted, as Traffic generator and VNF(ACL workload) based on the test flavor. |
| step 2 | Yardstick is connected with the TG and VNF by using ssh. The test will resolve the topology and instantiate the VNF and TG and collect the KPI’s/metrics. |
| step 3 | The TG will send packets to the VNF. If the number of dropped packets is more than the tolerated loss the line rate or throughput is halved. This is done until the dropped packets are within an acceptable tolerated loss. The KPI is the number of packets per second for 64 bytes packet size with an accepted minimal packet loss for the default configuration. |
| step 4 | In Baremetal test: The test quits the application and unbind the dpdk ports. In Heat test: Two host VMs are deleted on test completion. |
| test verdict | The test case will achieve a Throughput with an accepted minimal tolerated packet loss. |
| NSB PROX test for NFVI characterization | |
| test case id | tc_prox_{context}_bng-{port_num}
|
| metric |
|
| test purpose | The BNG workload converts packets from QinQ to GRE tunnels, handles routing and adds/removes MPLS tags. This use case simulates a realistic and complex application. The number of users is 32K per port and the number of routes is 8K. The BNG test cases are implemented to run in baremetal and heat context an require 4 port topology to run the default configuration. |
| configuration | The BNG test cases are listed below:
Test duration is set as 300sec for each test. The minimum packet size for BNG test is 78 bytes. This is set in the BNG traffic profile and can be configured to use a higher packet size for the test. |
| test tool | PROX PROX is a DPDK application that can simulate VNF workloads and can generate traffic and used for NFVI characterization |
| applicability | The PROX BNG test cases can be configured with different:
Default values exist. |
| pre-test conditions | For Openstack test case image (yardstick-samplevnfs) needs to be installed into Glance with Prox and Dpdk included in it. The test need multi-queue enabled in Glance image. For Baremetal tests cases Prox and Dpdk must be installed in the hosts where the test is executed. The pod.yaml file must have the necessary system and NIC information |
| test sequence | description and expected result |
| step 1 | For Baremetal test: The TG and VNF are started on the hosts based on the pod file. For Heat test: Two host VMs are booted, as Traffic generator and VNF(BNG workload) based on the test flavor. |
| step 2 | Yardstick is connected with the TG and VNF by using ssh. The test will resolve the topology and instantiate the VNF and TG and collect the KPI’s/metrics. |
| step 3 | The TG will send packets to the VNF. If the number of dropped packets is more than the tolerated loss the line rate or throughput is halved. This is done until the dropped packets are within an acceptable tolerated loss. The KPI is the number of packets per second for 78 bytes packet size with an accepted minimal packet loss for the default configuration. |
| step 4 | In Baremetal test: The test quits the application and unbind the dpdk ports. In Heat test: Two host VMs are deleted on test completion. |
| test verdict | The test case will achieve a Throughput with an accepted minimal tolerated packet loss. |
| NSB PROX test for NFVI characterization | |
| test case id | tc_prox_{context}_bng_qos-{port_num}
|
| metric |
|
| test purpose | The BNG+QoS workload converts packets from QinQ to GRE tunnels, handles routing and adds/removes MPLS tags and performs a QoS. This use case simulates a realistic and complex application. The number of users is 32K per port and the number of routes is 8K. The BNG_QoS test cases are implemented to run in baremetal and heat context an require 4 port topology to run the default configuration. |
| configuration | The BNG_QoS test cases are listed below:
Test duration is set as 300sec for each test. The minumum packet size for BNG_QoS test is 78 bytes. This is set in the bng_qos traffic profile and can be configured to use a higher packet size for the test. |
| test tool | PROX PROX is a DPDK application that can simulate VNF workloads and can generate traffic and used for NFVI characterization |
| applicability | This PROX BNG_QoS test cases can be configured with different:
Default values exist. |
| pre-test conditions | For Openstack test case image (yardstick-samplevnfs) needs to be installed into Glance with Prox and Dpdk included in it. The test need multi-queue enabled in Glance image. For Baremetal tests cases Prox and Dpdk must be installed in the hosts where the test is executed. The pod.yaml file must have the necessary system and NIC information |
| test sequence | description and expected result |
| step 1 | For Baremetal test: The TG and VNF are started on the hosts based on the pod file. For Heat test: Two host VMs are booted, as Traffic generator and VNF(BNG_QoS workload) based on the test flavor. |
| step 2 | Yardstick is connected with the TG and VNF by using ssh. The test will resolve the topology and instantiate the VNF and TG and collect the KPI’s/metrics. |
| step 3 | The TG will send packets to the VNF. If the number of dropped packets is more than the tolerated loss the line rate or throughput is halved. This is done until the dropped packets are within an acceptable tolerated loss. The KPI is the number of packets per second for 78 bytes packet size with an accepted minimal packet loss for the default configuration. |
| step 4 | In Baremetal test: The test quits the application and unbind the dpdk ports. In Heat test: Two host VMs are deleted on test completion. |
| test verdict | The test case will achieve a Throughput with an accepted minimal tolerated packet loss. |
| NSB PROX test for NFVI characterization | |
| test case id | tc_prox_{context}_l2fwd-{port_num}
|
| metric |
|
| test purpose | The PROX L2FWD test has 3 types of test cases: L2FWD: The application will take packets in from one port and forward them unmodified to another port L2FWD_Packet_Touch: The application will take packets in from one port, update src and dst MACs and forward them to another port. L2FWD_Multi_Flow: The application will take packets in from one port, update src and dst MACs and forward them to another port. This test case exercises the softswitch with 200k flows. The above test cases are implemented for baremetal and heat context for 2 port and 4 port configuration. |
| configuration | The L2FWD test cases are listed below:
Test duration is set as 300sec for each test. Packet size set as 64 bytes in traffic profile These can be configured |
| test tool | PROX PROX is a DPDK application that can simulate VNF workloads and can generate traffic and used for NFVI characterization |
| applicability | The PROX L2FWD test cases can be configured with different:
Default values exist. |
| pre-test conditions | For Openstack test case image (yardstick-samplevnfs) needs to be installed into Glance with Prox and Dpdk included in it. For Baremetal tests cases Prox and Dpdk must be installed in the hosts where the test is executed. The pod.yaml file must have the necessary system and NIC information |
| test sequence | description and expected result |
| step 1 | For Baremetal test: The TG and VNF are started on the hosts based on the pod file. For Heat test: Two host VMs are booted, as Traffic generator and VNF(L2FWD workload) based on the test flavor. |
| step 2 | Yardstick is connected with the TG and VNF by using ssh. The test will resolve the topology and instantiate the VNF and TG and collect the KPI’s/metrics. |
| step 3 | The TG will send packets to the VNF. If the number of dropped packets is more than the tolerated loss the line rate or throughput is halved. This is done until the dropped packets are within an acceptable tolerated loss. The KPI is the number of packets per second for 64 bytes packet size with an accepted minimal packet loss for the default configuration. |
| step 4 | In Baremetal test: The test quits the application and unbind the dpdk ports. In Heat test: Two host VMs are deleted on test completion. |
| test verdict | The test case will achieve a Throughput with an accepted minimal tolerated packet loss. |
| NSB PROX test for NFVI characterization | |
| test case id | tc_prox_{context}_l3fwd-{port_num}
|
| metric |
|
| test purpose | The PROX L3FWD application performs basic routing of packets with LPM based look-up method. The L3FWD test cases are implemented for baremetal and heat context for 2 port and 4 port configuration. |
| configuration | The L3FWD test cases are listed below:
Test duration is set as 300sec for each test. The minimum packet size for L3FWD test is 64 bytes. This is set in the traffic profile and can be configured to use a higher packet size for the test. |
| test tool | PROX PROX is a DPDK application that can simulate VNF workloads and can generate traffic and used for NFVI characterization |
| applicability | This PROX L3FWD test cases can be configured with different:
Default values exist. |
| pre-test conditions | For Openstack test case image (yardstick-samplevnfs) needs to be installed into Glance with Prox and Dpdk included in it. The test need multi-queue enabled in Glance image. For Baremetal tests cases Prox and Dpdk must be installed in the hosts where the test is executed. The pod.yaml file must have the necessary system and NIC information |
| test sequence | description and expected result |
| step 1 | For Baremetal test: The TG and VNF are started on the hosts based on the pod file. For Heat test: Two host VMs are booted, as Traffic generator and VNF(L3FWD workload) based on the test flavor. |
| step 2 | Yardstick is connected with the TG and VNF by using ssh. The test will resolve the topology and instantiate the VNF and TG and collect the KPI’s/metrics. |
| step 3 | The TG will send packet to the VNF. If the number of dropped packets is more than the tolerated loss the line rate or throughput is halved. This is done until the dropped packets are within an acceptable tolerated loss. The KPI is the number of packets per second for 64 byte packets with an accepted minimal packet loss for the default configuration. |
| step 4 | In Baremetal test: The test quits the application and unbind the dpdk ports. In Heat test: Two host VMs are deleted on test completion. |
| test verdict | The test case will achieve a Throughput with an accepted minimal tolerated packet loss. |
| NSB PROX test for NFVI characterization | |
| test case id | tc_prox_{context}_mpls_tagging-{port_num}
|
| metric |
|
| test purpose | The PROX MPLS Tagging test will take packets in from one port add an MPLS tag and forward them to another port. While forwarding packets in other direction MPLS tags will be removed. The MPLS test cases are implemented to run in baremetal and heat context an require 4 port topology to run the default configuration. |
| configuration | The MPLS Tagging test cases are listed below:
Test duration is set as 300sec for each test. The minimum packet size for MPLS test is 68 bytes. This is set in the traffic profile and can be configured to use higher packet sizes. |
| test tool | PROX PROX is a DPDK application that can simulate VNF workloads and can generate traffic and used for NFVI characterization |
| applicability | The PROX MPLS Tagging test cases can be configured with different:
Default values exist. |
| pre-test conditions | For Openstack test case image (yardstick-samplevnfs) needs to be installed into Glance with Prox and Dpdk included in it. For Baremetal tests cases Prox and Dpdk must be installed in the hosts where the test is executed. The pod.yaml file must have the necessary system and NIC information |
| test sequence | description and expected result |
| step 1 | For Baremetal test: The TG and VNF are started on the hosts based on the pod file. For Heat test: Two host VMs are booted, as Traffic generator and VNF(MPLS workload) based on the test flavor. |
| step 2 | Yardstick is connected with the TG and VNF by using ssh. The test will resolve the topology and instantiate the VNF and TG and collect the KPI’s/metrics. |
| step 3 | The TG will send packets to the VNF. If the number of dropped packets is more than the tolerated loss the line rate or throughput is halved. This is done until the dropped packets are within an acceptable tolerated loss. The KPI is the number of packets per second for 68 bytes packet size with an accepted minimal packet loss for the default configuration. |
| step 4 | In Baremetal test: The test quits the application and unbind the dpdk ports. In Heat test: Two host VMs are deleted on test completion. |
| test verdict | The test case will achieve a Throughput with an accepted minimal tolerated packet loss. |
| NSB PROX test for NFVI characterization | |
| test case id | tc_prox_{context}_buffering-{port_num}
|
| metric |
|
| test purpose | This test measures the impact of the condition when packets get buffered, thus they stay in memory for the extended period of time, 125ms in this case. The Packet Buffering test cases are implemented to run in baremetal and heat context. The test runs only on the first port of the SUT. |
| configuration | The Packet Buffering test cases are listed below:
Test duration is set as 300sec for each test. The minimum packet size for Buffering test is 64 bytes. This is set in the traffic profile and can be configured to use a higher packet size for the test. |
| test tool | PROX PROX is a DPDK application that can simulate VNF workloads and can generate traffic and used for NFVI characterization |
| applicability |
Default values exist. |
| pre-test conditions | For Openstack test case image (yardstick-samplevnfs) needs to be installed into Glance with Prox and Dpdk included in it. The test need multi-queue enabled in Glance image. For Baremetal tests cases Prox and Dpdk must be installed in the hosts where the test is executed. The pod.yaml file must have the necessary system and NIC information |
| test sequence | description and expected result |
| step 1 | For Baremetal test: The TG and VNF are started on the hosts based on the pod file. For Heat test: Two host VMs are booted, as Traffic generator and VNF(Packet Buffering workload) based on the test flavor. |
| step 2 | Yardstick is connected with the TG and VNF by using ssh. The test will resolve the topology and instantiate the VNF and TG and collect the KPI’s/metrics. |
| step 3 | The TG will send packets to the VNF. If the number of dropped packets is more than the tolerated loss the line rate or throughput is halved. This is done until the dropped packets are within an acceptable tolerated loss. The KPI in this test is the maximum number of packets that can be forwarded given the requirement that the latency of each packet is at least 125 millisecond. |
| step 4 | In Baremetal test: The test quits the application and unbind the dpdk ports. In Heat test: Two host VMs are deleted on test completion. |
| test verdict | The test case will achieve a Throughput with an accepted minimal tolerated packet loss. |
| NSB PROX test for NFVI characterization | |
| test case id | tc_prox_{context}_lb-{port_num}
|
| metric |
|
| test purpose | The applciation transmits packets on one port and revieves them on 4 ports. The conventional 5-tuple is used in this test as it requires some extraction steps and allows defining enough distinct values to find the performance limits. The load is increased (adding more ports if needed) while packets are load balanced using a hash table of 8M entries The number of packets per second that can be forwarded determines the KPI. The default packet size is 64 bytes. |
| configuration | The Load Balancer test cases are listed below:
Test duration is set as 300sec for each test. Packet size set as 64 bytes in traffic profile. These can be configured |
| test tool | PROX PROX is a DPDK application that can simulate VNF workloads and can generate traffic and used for NFVI characterization |
| applicability |
Default values exist. |
| pre-test conditions | For Openstack test case image (yardstick-samplevnfs) needs to be installed into Glance with Prox and Dpdk included in it. The test need multi-queue enabled in Glance image. For Baremetal tests cases Prox and Dpdk must be installed in the hosts where the test is executed. The pod.yaml file must have the necessary system and NIC information |
| test sequence | description and expected result |
| step 1 | For Baremetal test: The TG and VNF are started on the hosts based on the pod file. For Heat test: Two host VMs are booted, as Traffic generator and VNF(Load Balancer workload) based on the test flavor. |
| step 2 | Yardstick is connected with the TG and VNF by using ssh. The test will resolve the topology and instantiate the VNF and TG and collect the KPI’s/metrics. |
| step 3 | The TG will send packets to the VNF. If the number of dropped packets is more than the tolerated loss the line rate or throughput is halved. This is done until the dropped packets are within an acceptable tolerated loss. The KPI is the number of packets per second for 78 bytes packet size with an accepted minimal packet loss for the default configuration. |
| step 4 | In Baremetal test: The test quits the application and unbind the dpdk ports. In Heat test: Two host VMs are deleted on test completion. |
| test verdict | The test case will achieve a Throughput with an accepted minimal tolerated packet loss. |
| NSB PROX test for NFVI characterization | |
| test case id | tc_prox_{context}_vpe-{port_num}
|
| metric |
|
| test purpose | The PROX VPE test handles packet processing, routing, QinQ encapsulation, flows, ACL rules, adds/removes MPLS tagging and performs QoS before forwarding packet to another port. The reverse applies to forwarded packets in the other direction. The VPE test cases are implemented to run in baremetal and heat context an require 4 port topology to run the default configuration. |
| configuration | The VPE test cases are listed below:
Test duration is set as 300sec for each test. The minimum packet size for VPE test is 68 bytes. This is set in the traffic profile and can be configured to use higher packet sizes. |
| test tool | PROX PROX is a DPDK application that can simulate VNF workloads and can generate traffic and used for NFVI characterization |
| applicability | The PROX VPE test cases can be configured with different:
Default values exist. |
| pre-test conditions | For Openstack test case image (yardstick-samplevnfs) needs to be installed into Glance with Prox and Dpdk included in it. For Baremetal tests cases Prox and Dpdk must be installed in the hosts where the test is executed. The pod.yaml file must have the necessary system and NIC information |
| test sequence | description and expected result |
| step 1 | For Baremetal test: The TG and VNF are started on the hosts based on the pod file. For Heat test: Two host VMs are booted, as Traffic generator and VNF(VPE workload) based on the test flavor. |
| step 2 | Yardstick is connected with the TG and VNF by using ssh. The test will resolve the topology and instantiate the VNF and TG and collect the KPI’s/metrics. |
| step 3 | The TG will send packets to the VNF. If the number of dropped packets is more than the tolerated loss the line rate or throughput is halved. This is done until the dropped packets are within an acceptable tolerated loss. The KPI is the number of packets per second for 68 bytes packet size with an accepted minimal packet loss for the default configuration. |
| step 4 | In Baremetal test: The test quits the application and unbind the dpdk ports. In Heat test: Two host VMs are deleted on test completion. |
| test verdict | The test case will achieve a Throughput with an accepted minimal tolerated packet loss. |
The OPNFV testing ecosystem is wide.
The goal of this guide consists in providing some guidelines for new developers involved in test areas.
For the description of the ecosystem, see [DEV1].
There are several ways to join test projects as a developer. In fact you may:
- Develop new test cases
- Develop frameworks
- Develop tooling (reporting, dashboards, graphs, middleware,...)
- Troubleshoot results
- Post-process results
These different tasks may be done within a specific project or as a shared resource accross the different projects.
If you develop new test cases, the best practice is to contribute upstream as much as possible. You may contact the testing group to know which project - in OPNFV or upstream - would be the best place to host the test cases. Such contributions are usually directly connected to a specific project, more details can be found in the user guides of the testing projects.
Each OPNFV testing project provides test cases and the framework to manage them. As a developer, you can obviously contribute to them. The developer guide of the testing projects shall indicate the procedure to follow.
Tooling may be specific to a project or generic to all the projects. For specific tooling, please report to the test project user guide. The tooling used by several test projects will be detailed in this document.
The best event to meet the testing community is probably the plugfest. Such an event is organized after each release. Most of the test projects are present.
The summit is also a good opportunity to meet most of the actors [DEV4].
The testing group is a self organized working group. The OPNFV projects dealing with testing are invited to participate in order to elaborate and consolidate a consistant test strategy (test case definition, scope of projects, resources for long duration, documentation, ...) and align tooling or best practices.
A weekly meeting is organized, the agenda may be amended by any participant. 2 slots have been defined (US/Europe and APAC). Agendas and minutes are public. See [DEV3] for details. The testing group IRC channel is #opnfv-testperf
All the test projects do not have the same maturity and/or number of contributors. The nature of the test projects may be also different. The following best practices may not be acurate for all the projects and are only indicative. Contact the testing group for further details.
Most of the projects have a similar structure, which can be defined as follows:
`-- home
|-- requirements.txt
|-- setup.py
|-- tox.ini
|
|-- <project>
| |-- <api>
| |-- <framework>
| `-- <test cases>
|
|-- docker
| |-- Dockerfile
| `-- Dockerfile.aarch64.patch
|-- <unit tests>
`- docs
|-- release
| |-- release-notes
| `-- results
`-- testing
|-- developer
| `-- devguide
|-- user
`-- userguide
Test projects are installing tools and triggering tests. When it is possible it is recommended to implement an API in order to perform the different actions.
Each test project should be able to expose and consume APIs from other test projects. This pseudo micro service approach should allow a flexible use of the different projects and reduce the risk of overlapping. In fact if project A provides an API to deploy a traffic generator, it is better to reuse it rather than implementing a new way to deploy it. This approach has not been implemented yet but the prerequisites consiting in exposing and API has already been done by several test projects.
Most of the test projects provide a docker as deliverable. Once connected, it is possible to prepare the environement and run tests through a CLI.
Dockerization has been introduced in Brahmaputra and adopted by most of the test projects. Docker containers are pulled on the jumphost of OPNFV POD. <TODO Jose/Mark/Alec>
It is recommended to control the quality of the code of the testing projects, and more precisely to implement some verifications before any merge:
- pep8
- pylint
- unit tests (python 2.7)
- unit tests (python 3.5)
The code of the test project must be covered by unit tests. The coverage shall be reasonable and not decrease when adding new features to the framework. The use of tox is recommended. It is possible to implement strict rules (no decrease of pylint score, unit test coverages) on critical python classes.
Several test projects integrate third party tooling for code quality check and/or traffic generation. Some of the tools can be listed as follows:
| Project | Tool | Comments |
|---|---|---|
| Bottlenecks | TODO | |
| Functest | Tempest Rally Refstack RobotFramework | OpenStack test tooling OpenStack test tooling OpenStack test tooling Used for ODL tests |
| QTIP | Unixbench RAMSpeed nDPI openSSL inxi | |
| Storperf | TODO | |
| VSPERF | TODO | |
| Yardstick | Moongen Trex Pktgen IxLoad, IxNet SPEC Unixbench RAMSpeed LMBench Iperf3 Netperf Pktgen-DPDK Testpmd L2fwd Fio Bonnie++ | Traffic generator Traffic generator Traffic generator Traffic generator Compute Compute Compute Compute Network Network Network Network Network Storage Storage |
The testing group defined several categories also known as tiers. These categories can be used to group test suites.
| Category | Description |
|---|---|
| Healthcheck | Simple and quick healthcheck tests case |
| Smoke | Set of smoke test cases/suites to validate the release |
| Features | Test cases that validate a specific feature on top of OPNFV. Those come from Feature projects and need a bit of support for integration |
| Components | Tests on a specific component (e.g. OpenStack, OVS, DPDK,..) It may extend smoke tests |
| Performance | Performance qualification |
| VNF | Test cases related to deploy an open source VNF including an orchestrator |
| Stress | Stress and robustness tests |
| In Service | In service testing |
The domains deal with the technical scope of the tests. It shall correspond to domains defined for the certification program:
- compute
- network
- storage
- hypervisor
- container
- vim
- mano
- vnf
- ...
One of the goals of the testing working group is to identify the poorly covered areas and avoid testing overlap. Ideally based on the declaration of the test cases, through the tags, domains and tier fields, it shall be possible to create heuristic maps.
Resiliency of NFV refers to the ability of the NFV framework to limit disruption and return to normal or at a minimum acceptable service delivery level in the face of a fault, failure, or an event that disrupts the normal operation [DEV5].
Reliability testing evaluates the ability of SUT to recover in face of fault, failure or disrupts in normal operation or simply the ability of SUT absorbing “disruptions”.
Reliability tests use different forms of faults as stimulus, and the test must measure the reaction in terms of the outage time or impairments to transmission.
Stress testing involves producing excess load as stimulus, and the test must measure the reaction in terms of unexpected outages or (more likely) impairments to transmission.
These kinds of “load” will cause “disruption” which could be easily found in system logs. It is the purpose to raise such “load” to evaluate the SUT if it could provide an acceptable level of service or level of confidence during such circumstances. In Danube and Euphrates, we only considered the stress test with excess load over OPNFV Platform.
In Danube, Bottlenecks and Yardstick project jointly implemented 2 stress tests (concurrently create/destroy VM pairs and do ping, system throughput limit) while Bottlenecks acts as the load manager calling yardstick to execute each test iteration. These tests are designed to test for breaking points and provide level of confidence of the system to users. Summary of the test cases are listed in the following addresses:
Stress test cases for OPNFV Euphrates (OS Ocata) release can be seen as extension/enhancement of those in D release. These tests are located in Bottlenecks/Yardstick repo (Bottlenecks as load manager while Yardstick execute each test iteration):
- VNF scale out/up tests (also plan to measure storage usage simultaneously): https://wiki.opnfv.org/pages/viewpage.action?pageId=12390101
- Life-cycle event with throughputs (measure NFVI to support concurrent
network usage from different VM pairs): https://wiki.opnfv.org/display/DEV/Intern+Project%3A+Baseline+Stress+Test+Case+for+Bottlenecks+E+Release
In OPNFV E release, we also plan to do long duration testing over OS Ocata. A separate CI pipe testing OPNFV XCI (OSA) is proposed to accomplish the job. We have applied specific pod for the testing. Proposals and details are listed below:
- https://wiki.opnfv.org/display/testing/Euphrates+Testing+needs
- https://wiki.opnfv.org/download/attachments/2926539/testing%20evolution%20v1_4.pptx?version=1&modificationDate=1503937629000&api=v2
- https://wiki.opnfv.org/download/attachments/2926539/Testing%20over%20Long%20Duration%20POD.pptx?version=2&modificationDate=1502943821000&api=v2
The long duration testing is supposed to be started when OPNFV E release is published. A simple monitoring module for these tests is also planned to be added: https://wiki.opnfv.org/display/DEV/Intern+Project%3A+Monitoring+Stress+Testing+for+Bottlenecks+E+Release
On http://docs.opnfv.org! A section is dedicated to the testing projects. You will find the overview of the ecosystem and the links to the project documents.
Another source is the testing wiki on https://wiki.opnfv.org/display/testing
You may also contact the testing group on the IRC channel #opnfv-testperf or by mail at test-wg AT lists.opnfv.org (testing group) or opnfv-tech-discuss AT lists.opnfv.org (generic technical discussions).
As any project, the best solution is to contact the project. The project members with their email address can be found under https://git.opnfv.org/<project>/tree/INFO
You may also send a mail to the testing mailing list or use the IRC channel #opnfv-testperf
You should discuss this topic with the project you are working with. If you need access to an OPNFV community POD, it is possible to contact the infrastructure group. Depending on your needs (scenario/installer/tooling), it should be possible to find free time slots on one OPNFV community POD from the Pharos federation. Create a JIRA ticket to describe your needs on https://jira.opnfv.org/projects/INFRA. You must already be an OPNFV contributor. See https://wiki.opnfv.org/display/DEV/Developer+Getting+Started.
Please note that lots of projects have their own “how to contribute” or “get started” page on the OPNFV wiki.
It shall be discussed directly with the project you are working with. It is done through jenkins jobs calling testing project files but the way to onboard cases differ from one project to another.
If you have access to the test API swagger (access granted to contributors), you may use the swagger interface of the test API to declare your project. The URL is http://testresults.opnfv.org/test/swagger/spec.html.
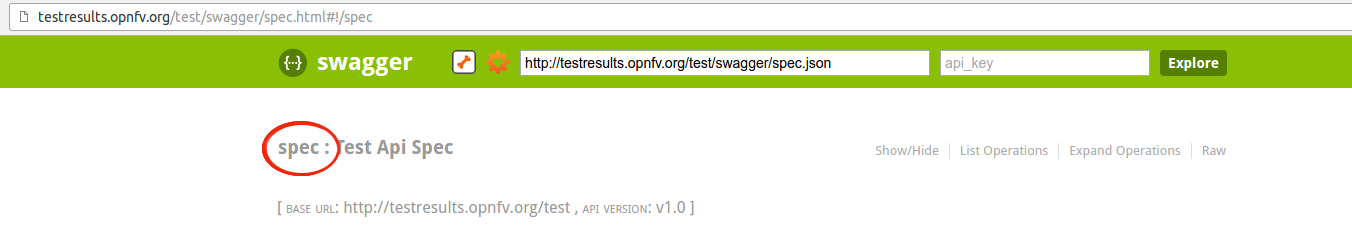
Click on Spec, the list of available methods must be displayed.
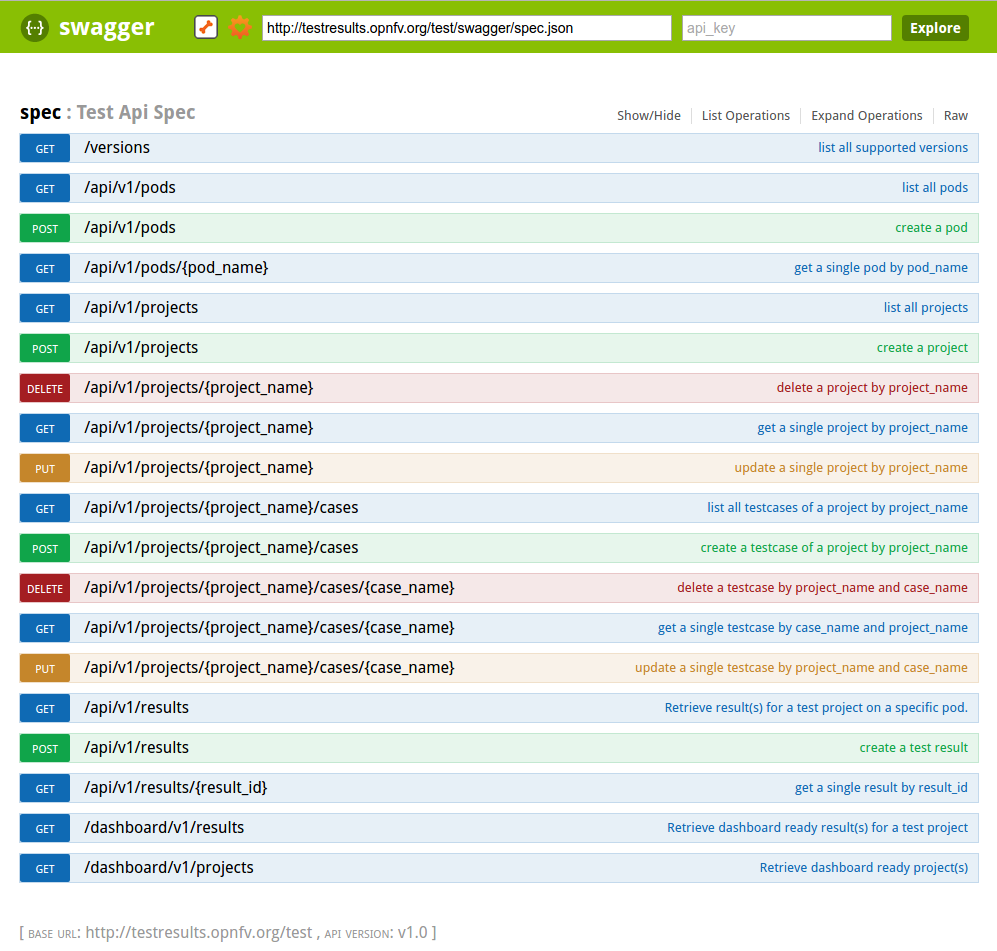
For the declaration of a new project use the POST /api/v1/projects method. For the declaration of new test cases in an existing project, use the POST
/api/v1/projects/{project_name}/cases method
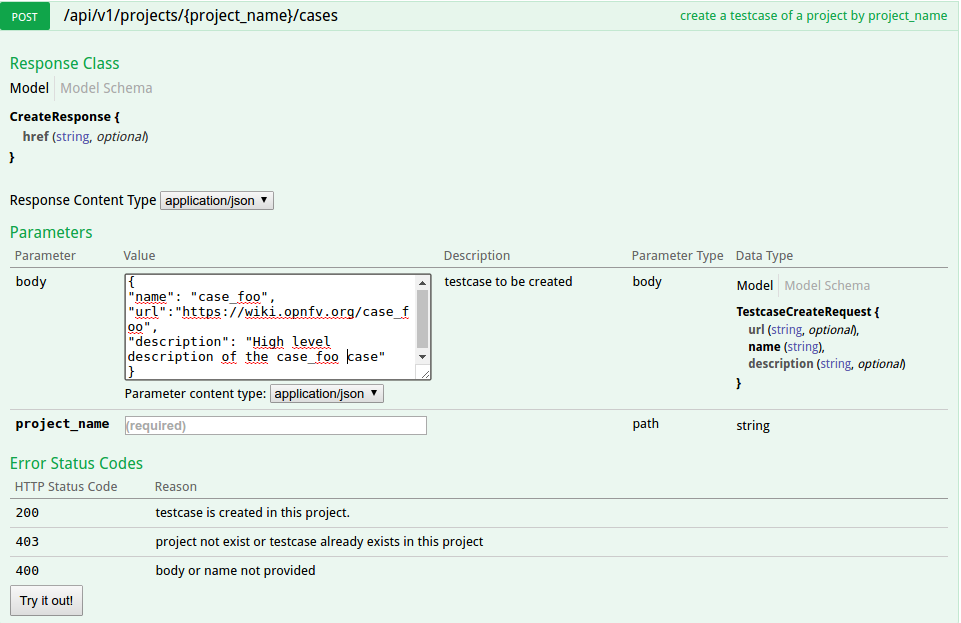
The test database is used to collect test results. By default it is enabled only for CI tests from Production CI pods.
Please note that it is possible to create your own local database.
A dedicated database is for instance created for each plugfest.
The architecture and associated API is described in previous chapter. If you want to push your results from CI, you just have to call the API at the end of your script.
You can also reuse a python function defined in functest_utils.py [DEV2]
The Test API is now documented in this document (see sections above). You may also find autogenerated documentation in http://artifacts.opnfv.org/releng/docs/testapi.html A web protal is also under construction for certification at http://testresults.opnfv.org/test/#/
See table above.
The main ambiguity could be between features and VNF. In fact sometimes you have to spawn VMs to demonstrate the capabilities of the feature you introduced. We recommend to declare your test in the feature category.
VNF category is really dedicated to test including:
- creation of resources
- deployement of an orchestrator/VNFM
- deployment of the VNF
- test of the VNFM
- free resources
The goal is not to study a particular feature on the infrastructure but to have a whole end to end test of a VNF automatically deployed in CI. Moreover VNF are run in weekly jobs (one a week), feature tests are in daily jobs and use to get a scenario score.
Logs and configuration files can be pushed to artifact server from the CI under http://artifacts.opnfv.org/<project name>
This document will provide general view of the project for developers as a quick guide.
This document will provide a comprehensive guilde on Bottlenecks testing framework development.
A unit test is an automated code-level test for a small and fairly isolated part of functionality, mostly in terms of functions. They should interact with external resources at their minimum, and includes testing every corner cases and cases that do not work.
Unit tests should always be pretty simple, by intent. There are a couple of ways to integrate unit tests into your development style [1]:
Comprehensive and integrally designed unit tests serves valuably as validator of your APIs, fuctionalities and the workflow that acctually make them executable. It will make it possibe to deliver your codes more quickly.
In the meanwhile, Coverage Test is the tool for measuring code coverage of Python programs. Accompany with Unit Test, it monitors your program, noting which parts of the code have been executed, then analyzes the source to identify code that could have been executed but was not.
Coverage measurement is typically used to gauge the effectiveness of tests. It can show which parts of your code are being exercised by tests, and which are not.
People use unit test discovery and execution frameworks so that they can forcus on add tests to existing code, then the tests could be tirggerd, resulting report could be obtained automatically.
In addition to adding and running your tests, frameworks can run tests selectively according to your requirements, add coverage and profiling information, generate comprehensive reports.
There are many unit test frameworks in Python, and more arise every day. It will take you some time to be falimiar with those that are famous from among the ever-arising frameworks. However, to us, it always matters more that you are actually writing tests for your codes than how you write them. Plus, nose is quite stable, it’s been used by many projects and it could be adapted easily to mimic any other unit test discovery framework pretty easily. So, why not?
Before you actually implement test codes for your software, please keep the following principles in mind [2]
There only are a few guidance for developing and testing your code on your local server assuming that you already have python installed. For more detailed introduction, please refer to the wesites of nose and coverage [3] [4].
Install Nose using your OS’s package manager. For example:
pip install nose
As to creating tests and a quick start, please refer to [5]
Nose comes with a command line utility called ‘nosetests’. The simplest usage is to call nosetests from within your project directory and pass a ‘tests’ directory as an argument. For example,
nosetests tests
The outputs could be similar to the following summary:
% nosetests tests
....
----------------------------------------------------------------------
Ran 4 tests in 0.003s OK
Coverage is the metric that could complete your unit tests by overseeing your test codes themselves. Nose support coverage test according the Coverage.py.
pip install coverage
To generate a coverage report using the nosetests utility, simply add the –with-coverage. By default, coverage generates data for all modules found in the current directory.
nosetests --with-coverage
% nosetests –with-coverage –cover-package a
The –cover-package switch can be used multiple times to restrain the tests only looking into the 3rd party package to avoid useless information.
nosetests --with-coverage --cover-package a --cover-package b
....
Name Stmts Miss Cover Missing
-------------------------------------
a 8 0 100%
----------------------------------------------------------------------
Ran 4 tests in 0.006sOK
Assuming that you have already got the main idea of unit testing and start to programing you own tests under Bottlenecks repo. The most important thing that should be clarified is that unit tests under Bottlenecks should be either excutable offline and by OPNFV CI pipeline. When you submit patches to Bottlenecks repo, your patch should following certain ruls to enable the tests:
After meeting the two rules, your patch will automatically validated by nose tests executed by OPNFV verify job.
[1]: http://ivory.idyll.org/articles/nose-intro.html
[2]: https://github.com/kennethreitz/python-guide/blob/master/docs/writing/tests.rst
[3]: http://nose.readthedocs.io/en/latest/
[4]: https://coverage.readthedocs.io/en/coverage-4.4.2
[5]: http://blog.jameskyle.org/2010/10/nose-unit-testing-quick-start/
The OVP test suite is intended to provide a method for validating the interfaces and behaviors of an NFVI platform according to the expected capabilities exposed in OPNFV. The behavioral foundation evaluated in these tests should serve to provide a functional baseline for VNF deployment and portability across NFVI instances. All OVP tests are available in open source and are executed in open source test frameworks.
The following requirements are mandatory for a test to be submitted for consideration in the OVP test suite:
New test case proposals should complete a OVP test case worksheet to ensure that all of these considerations are met before the test case is approved for inclusion in the OVP test suite.
Test case naming and structuring must comply with the following conventions. The fully qualified name of a test case must comprise three sections:
<testproject>.<test_area>.<test_case_name>
An example of a fully qualified test case name is functest.tempest.compute.
Functest is a project dealing with functional testing. The project produces its own internal test cases but can also be considered as a framework to support feature and VNF onboarding project testing.
Therefore there are many ways to contribute to Functest. You can:
- Develop new internal test cases
- Integrate the tests from your feature project
- Develop the framework to ease the integration of external test cases
Additional tasks involving Functest but addressing all the test projects may also be mentioned:
- The API / Test collection framework
- The dashboards
- The automatic reporting portals
- The testcase catalog
This document describes how, as a developer, you may interact with the Functest project. The first section details the main working areas of the project. The Second part is a list of “How to” to help you to join the Functest family whatever your field of interest is.
Functest is a project delivering test containers dedicated to OPNFV. It includes the tools, the scripts and the test scenarios. In Euphrates Alpine containers have been introduced in order to lighten the container and manage testing slicing. The new containers are created according to the different tiers:
- functest-core: https://hub.docker.com/r/opnfv/functest-core/
- functest-healthcheck: https://hub.docker.com/r/opnfv/functest-healthcheck/
- functest-smoke: https://hub.docker.com/r/opnfv/functest-smoke/
- functest-features: https://hub.docker.com/r/opnfv/functest-features/
- functest-components: https://hub.docker.com/r/opnfv/functest-components/
- functest-vnf: https://hub.docker.com/r/opnfv/functest-vnf/
- functest-restapi: https://hub.docker.com/r/opnfv/functest-restapi/
Standalone functest dockers are maintained for Euphrates but Alpine containers are recommended.
Functest can be described as follow:
+----------------------+
| |
| +--------------+ | +-------------------+
| | | | Public | |
| | Tools | +------------------+ OPNFV |
| | Scripts | | | System Under Test |
| | Scenarios | | | |
| | | | | |
| +--------------+ | +-------------------+
| |
| Functest Docker |
| |
+----------------------+
The internal test cases in Euphrates are:
- api_check
- connection_check
- snaps_health_check
- vping_ssh
- vping_userdata
- odl
- rally_full
- rally_sanity
- tempest_smoke
- tempest_full
- cloudify_ims
By internal, we mean that this particular test cases have been developed and/or integrated by functest contributors and the associated code is hosted in the Functest repository. An internal case can be fully developed or a simple integration of upstream suites (e.g. Tempest/Rally developed in OpenStack, or odl suites are just integrated in Functest).
The structure of this repository is detailed in [1]. The main internal test cases are in the opnfv_tests subfolder of the repository, the internal test cases can be grouped by domain:
- sdn: odl, odl_fds
- openstack: api_check, connection_check, snaps_health_check, vping_ssh, vping_userdata, tempest_*, rally_*
- vnf: cloudify_ims
If you want to create a new test case you will have to create a new folder under the testcases directory (See next section for details).
The external test cases are inherited from other OPNFV projects, especially the feature projects.
The external test cases are:
- barometer
- bgpvpn
- doctor
- domino
- fds
- promise
- refstack_defcore
- snaps_smoke
- functest-odl-sfc
- orchestra_clearwaterims
- orchestra_openims
- vyos_vrouter
- juju_vepc
External test cases integrated in previous versions but not released in Euphrates:
- copper
- moon
- netready
- security_scan
The code to run these test cases is hosted in the repository of the project. Please note that orchestra test cases are hosted in Functest repository and not in orchestra repository. Vyos_vrouter and juju_vepc code is also hosted in functest as there are no dedicated projects.
Functest is a framework.
Historically Functest is released as a docker file, including tools, scripts and a CLI to prepare the environment and run tests. It simplifies the integration of external test suites in CI pipeline and provide commodity tools to collect and display results.
Since Colorado, test categories also known as tiers have been created to group similar tests, provide consistent sub-lists and at the end optimize test duration for CI (see How To section).
The definition of the tiers has been agreed by the testing working group.
In order to harmonize test integration, abstraction classes have been introduced:
- testcase: base for any test case
- unit: run unit tests as test case
- feature: abstraction for feature project
- vnf: abstraction for vnf onboarding
The goal is to unify the way to run tests in Functest.
Feature, unit and vnf_base inherit from testcase:
+----------------------------------------------------------------+
| |
| TestCase |
| |
| - init() |
| - run() |
| - push_to_db() |
| - is_successful() |
| |
+----------------------------------------------------------------+
| | | |
V V V V
+--------------------+ +---------+ +------------------------+ +-----------------+
| | | | | | | |
| feature | | unit | | vnf | | robotframework |
| | | | | | | |
| | | | |- prepare() | | |
| - execute() | | | |- deploy_orchestrator() | | |
| BashFeature class | | | |- deploy_vnf() | | |
| | | | |- test_vnf() | | |
| | | | |- clean() | | |
+--------------------+ +---------+ +------------------------+ +-----------------+
In order to simplify the creation of test cases, Functest develops also some functions that are used by internal test cases. Several features are supported such as logger, configuration management and Openstack capabilities (tacker,..). These functions can be found under <repo>/functest/utils and can be described as follows:
functest/utils/
|-- config.py
|-- constants.py
|-- decorators.py
|-- env.py
|-- functest_utils.py
|-- openstack_tacker.py
`-- openstack_utils.py
It is recommended to use the SNAPS-OO library for deploying OpenStack instances. SNAPS [4] is an OPNFV project providing OpenStack utils.
Functest is using the Test collection framework and the TestAPI developed by the OPNFV community. See [5] for details.
[1]: http://artifacts.opnfv.org/functest/docs/configguide/index.html Functest configuration guide
[2]: http://artifacts.opnfv.org/functest/docs/userguide/index.html functest user guide
[3]: https://git.opnfv.org/releng-testresults/tree/reporting
[4]: https://git.opnfv.org/snaps/
[5]: http://docs.opnfv.org/en/latest/testing/testing-dev.html
[6]: https://opnfv.biterg.io/goto/283dba93ca18e95964f852c63af1d1ba
[7]: https://wiki.opnfv.org/pages/viewpage.action?pageId=7768932
IRC support chan: #opnfv-functest
Replace your LFID with your actual Linux Foundation ID.
git clone ssh://YourLFID@gerrit.opnfv.org:29418/storperf
It is preferred to use virtualenv for Python dependencies. This way it is known exactly what libraries are needed, and can restart from a clean state at any time to ensure any library is not missing. Simply running the script:
ci/verify.sh
from inside the storperf directory will automatically create a virtualenv in the home directory called ‘storperf_venv’. This will be used as the Python interpreter for the IDE.
In order to run the full set of StorPerf services, docker and docker-compose are required to be installed. This requires docker 17.05 at a minimum.
https://docs.docker.com/engine/installation/linux/docker-ce/ubuntu/
While PyCharm as an excellent IDE, some aspects of it require licensing, and the PyDev Plugin for Eclipse (packaged as LiClipse) is fully open source (although donations are welcome). Therefore this section focuses on using LiClipse for StorPerf development.
http://www.liclipse.com/download.html
Setting up interpreter under PyDev (LiClipse):


Pep8 and Flake8 rule. These are part of the Gerrit checks and I’m going to start enforcing style guidelines soon.


I prefer to do the git clone from the command line, and then import that as a local project in LiClipse.


You technically already did when you ran:
ci/verify.sh
The shortcut to running the unit tests again from the command line is:
source ~/storperf_venv/bin/activate
nosetests --with-xunit \
--with-coverage \
--cover-package=storperf\
--cover-xml \
storperf
Note
You must be in the top level storperf directory in order to run the tests.
Running the tests:
Right click on the tests folder and select Run as Python Unit Test. Chances are, you’ll get:
Traceback (most recent call last):
File "/home/mark/Documents/EMC/git/opnfv/storperf/storperf/tests/storperf_master_test.py", line 24, in setUp
self.storperf = StorPerfMaster()
File "/home/mark/Documents/EMC/git/opnfv/storperf/storperf/storperf_master.py", line 38, in __init__
template_file = open("storperf/resources/hot/agent-group.yaml")
IOError: [Errno 2] No such file or directory: 'storperf/resources/hot/agent-group.yaml'
This means we need to set the working directory of the run configuration.


For some reason, sqlite needs to be added as a builtin.


Installing and configuring Git and Git-Review is necessary in order to follow this guide. The Getting Started page will provide you with some help for that.
cd /home/tim/OPNFV/storperf
git checkout -b TOPIC-BRANCH
git add storperf/utilities/math.py
git add storperf/tests/utilities/math.py
...
git add -a
git pull
git commit --signoff -m "Title of change
Test of change that describes in high level what
was done. There is a lot of documentation in code
so you do not need to repeat it here.
JIRA: STORPERF-54"
The message that is required for the commit should follow a specific set of rules. This practice allows to standardize the description messages attached to the commits, and eventually navigate among the latter more easily. This document happened to be very clear and useful to get started with that.
git review


Note
Check out this section if the git review command returns to you with an “access denied” error.
If you want to collaborate with another developer, you can fetch their review by the Gerrit change id (which is part of the URL, and listed in the top left as Change NNNNN).
git review -d 16213
would download the patchset for change 16213. If there were a topic branch associated with it, it would switch you to that branch, allowing you to look at different patch sets locally at the same time without conflicts.
At the same time the code is being reviewed in Gerrit, you may need to edit it to make some changes and then send it back for review. The following steps go through the procedure.
git status

git add storperf/tests/utilities/math.py
git add storperf/utilities/math.py

git commit --amend

git review

The Gerrit code review should be updated, which results in a ‘patch set 2’ notification appearing in the history log. ‘patch set 1’ being the original code review proposition.
The ‘git review’ command might return to you with an “access denied” error that looks like this :

In this case, you need to make sure your Gerrit account has been added as a member of the StorPerf contributors group : ldap/opnfv-gerrit-storperf- contributors. You also want to check that have signed the CLA (Contributor License Agreement), if not you can sign it in the “Agreements” section of your Gerrit account :

VSPERF is an OPNFV testing project.
VSPERF provides an automated test-framework and comprehensive test suite based on Industry Test Specifications for measuring NFVI data-plane performance. The data-path includes switching technologies with physical and virtual network interfaces. The VSPERF architecture is switch and traffic generator agnostic and test cases can be easily customized. VSPERF was designed to be independent of OpenStack therefore OPNFV installer scenarios are not required. VSPERF can source, configure and deploy the device-under-test using specified software versions and network topology. VSPERF is used as a development tool for optimizing switching technologies, qualification of packet processing functions and for evaluation of data-path performance.
The Euphrates release adds new features and improvements that will help advance high performance packet processing on Telco NFV platforms. This includes new test cases, flexibility in customizing test-cases, new results display options, improved tool resiliency, additional traffic generator support and VPP support.
VSPERF provides a framework where the entire NFV Industry can learn about NFVI data-plane performance and try-out new techniques together. A new IETF benchmarking specification (RFC8204) is based on VSPERF work contributed since 2015. VSPERF is also contributing to development of ETSI NFV test specifications through the Test and Open Source Working Group.
This document is intended to aid those who want to integrate new traffic generator into the vsperf code. It is expected, that reader has already read generic part of VSPERF Design Document.
Let us create a sample traffic generator called sample_tg, step by step.
Implementation of trafficgens is located at tools/pkt_gen/ directory, where every implementation has its dedicated sub-directory. It is required to create a new directory for new traffic generator implementations.
E.g.
$ mkdir tools/pkt_gen/sample_tg
Every trafficgen class must inherit from generic ITrafficGenerator interface class. VSPERF during its initialization scans content of pkt_gen directory for all python modules, that inherit from ITrafficGenerator. These modules are automatically added into the list of supported traffic generators.
Example:
Let us create a draft of tools/pkt_gen/sample_tg/sample_tg.py module.
from tools.pkt_gen import trafficgen
class SampleTG(trafficgen.ITrafficGenerator):
"""
A sample traffic generator implementation
"""
pass
VSPERF is immediately aware of the new class:
$ ./vsperf --list-trafficgen
Output should look like:
Classes derived from: ITrafficGenerator
======
* Dummy: A dummy traffic generator whose data is generated by the user.
* IxNet: A wrapper around IXIA IxNetwork applications.
* Ixia: A wrapper around the IXIA traffic generator.
* Moongen: Moongen Traffic generator wrapper.
* TestCenter: Spirent TestCenter
* Trex: Trex Traffic generator wrapper.
* Xena: Xena Traffic generator wrapper class
All configuration values, required for correct traffic generator function, are passed from VSPERF to the traffic generator in a dictionary. Default values shared among all traffic generators are defined in conf/03_traffic.conf within TRAFFIC dictionary. Default values are loaded by ITrafficGenerator interface class automatically, so it is not needed to load them explicitly. In case that there are any traffic generator specific default values, then they should be set within class specific __init__ function.
VSPERF passes test specific configuration within traffic dictionary to every start and send function. So implementation of these functions must ensure, that default values are updated with the testcase specific values. Proper merge of values is assured by call of merge_spec function from conf module.
Example of merge_spec usage in tools/pkt_gen/sample_tg/sample_tg.py module:
from conf import merge_spec
def start_rfc2544_throughput(self, traffic=None, duration=30):
self._params = {}
self._params['traffic'] = self.traffic_defaults.copy()
if traffic:
self._params['traffic'] = merge_spec(
self._params['traffic'], traffic)
There are some generic functions, which every traffic generator should provide. Although these functions are mainly optional, at least empty implementation must be provided. This is required, so that developer is explicitly aware of these functions.
The connect function is called from the traffic generator controller from its __enter__ method. This function should assure proper connection initialization between DUT and traffic generator. In case, that such implementation is not needed, empty implementation is required.
The disconnect function should perform clean up of any connection specific actions called from the connect function.
Example in tools/pkt_gen/sample_tg/sample_tg.py module:
def connect(self):
pass
def disconnect(self):
pass
Currently VSPERF supports three different types of tests for traffic generators, these are identified in vsperf through the traffic type, which include:
- RFC2544 throughput - Send fixed size packets at different rates, using
traffic configuration, until minimum rate at which no packet loss is detected is found. Methods with its implementation have suffix _rfc2544_throughput.
- RFC2544 back2back - Send fixed size packets at a fixed rate, using traffic
configuration, for specified time interval. Methods with its implementation have suffix _rfc2544_back2back.
- continuous flow - Send fixed size packets at given framerate, using traffic
configuration, for specified time interval. Methods with its implementation have suffix _cont_traffic.
In general, both synchronous and asynchronous interfaces must be implemented for each traffic type. Synchronous functions start with prefix send_. Asynchronous with prefixes start_ and wait_ in case of throughput and back2back and start_ and stop_ in case of continuous traffic type.
Example of synchronous interfaces:
def send_rfc2544_throughput(self, traffic=None, tests=1, duration=20,
lossrate=0.0):
def send_rfc2544_back2back(self, traffic=None, tests=1, duration=20,
lossrate=0.0):
def send_cont_traffic(self, traffic=None, duration=20):
Example of asynchronous interfaces:
def start_rfc2544_throughput(self, traffic=None, tests=1, duration=20,
lossrate=0.0):
def wait_rfc2544_throughput(self):
def start_rfc2544_back2back(self, traffic=None, tests=1, duration=20,
lossrate=0.0):
def wait_rfc2544_back2back(self):
def start_cont_traffic(self, traffic=None, duration=20):
def stop_cont_traffic(self):
Description of parameters used by send, start, wait and stop functions:
param traffic: A dictionary with detailed definition of traffic pattern. It contains following parameters to be implemented by traffic generator.
Note: Traffic dictionary has also virtual switch related parameters, which are not listed below.
Note: There are parameters specific to testing of tunnelling protocols, which are discussed in detail at Integration tests userguide.
Note: A detailed description of the
TRAFFICdictionary can be found at Configuration of TRAFFIC dictionary.
- param traffic_type: One of the supported traffic types, e.g. rfc2544_throughput, rfc2544_continuous, rfc2544_back2back or burst.
- param bidir: Specifies if generated traffic will be full-duplex (true) or half-duplex (false).
- param frame_rate: Defines desired percentage of frame rate used during continuous stream tests.
- param burst_size: Defines a number of frames in the single burst, which is sent by burst traffic type. Burst size is applied for each direction, i.e. the total number of tx frames will be 2*burst_size in case of bidirectional traffic.
- param multistream: Defines number of flows simulated by traffic generator. Value 0 disables MultiStream feature.
- param stream_type: Stream Type defines ISO OSI network layer used for simulation of multiple streams. Supported values:
- L2 - iteration of destination MAC address
- L3 - iteration of destination IP address
- L4 - iteration of destination port of selected transport protocol
- param l2: A dictionary with data link layer details, e.g. srcmac, dstmac and framesize.
- param l3: A dictionary with network layer details, e.g. srcip, dstip, proto and l3 on/off switch enabled.
- param l4: A dictionary with transport layer details, e.g. srcport, dstport and l4 on/off switch enabled.
- param vlan: A dictionary with vlan specific parameters, e.g. priority, cfi, id and vlan on/off switch enabled.
- param scapy: A dictionary with definition of the frame content for both traffic directions. The frame content is defined by a SCAPY notation.
param tests: Number of times the test is executed.
param duration: Duration of continuous test or per iteration duration in case of RFC2544 throughput or back2back traffic types.
param lossrate: Acceptable lossrate percentage.
It is expected that methods send, wait and stop will return values measured by traffic generator within a dictionary. Dictionary keys are defined in ResultsConstants implemented in core/results/results_constants.py. Please check sections for RFC2544 Throughput & Continuous and for Back2Back. The same key names should be used by all traffic generator implementations.
This document is intended to aid those who want to modify the vsperf code. Or to extend it - for example to add support for new traffic generators, deployment scenarios and so on.
Establish connectivity to the VSPERF DUT Linux host. If this is in an OPNFV lab following the steps provided by Pharos to access the POD
The followign steps establish the VSPERF environment.
List all the cli options:
$ ./vsperf -h
Run all tests that have tput in their name - phy2phy_tput, pvp_tput etc.:
$ ./vsperf --tests 'tput'
As above but override default configuration with settings in ‘10_custom.conf’.
This is useful as modifying configuration directly in the configuration files
in conf/NN_*.py shows up as changes under git source control:
$ ./vsperf --conf-file=<path_to_custom_conf>/10_custom.conf --tests 'tput'
Override specific test parameters. Useful for shortening the duration of tests for development purposes:
$ ./vsperf --test-params 'TRAFFICGEN_DURATION=10;TRAFFICGEN_RFC2544_TESTS=1;' \
'TRAFFICGEN_PKT_SIZES=(64,)' pvp_tput
The conf package contains the configuration files (*.conf) for all system
components, it also provides a settings object that exposes all of these
settings.
Settings are not passed from component to component. Rather they are available globally to all components once they import the conf package.
from conf import settings
...
log_file = settings.getValue('LOG_FILE_DEFAULT')
Settings files (*.conf) are valid python code so can be set to complex
types such as lists and dictionaries as well as scalar types:
first_packet_size = settings.getValue('PACKET_SIZE_LIST')[0]
Configuration files follow a strict naming convention that allows them to be
processed in a specific order. All the .conf files are named NNx_name.conf,
where NN is a decimal number and x is an optional alphabetical suffix.
The files are processed in order from 00_name.conf to 99_name.conf
(and from 00a_name to 00z_name), so that if the name setting is given
in both a lower and higher numbered conf file then the higher numbered file
is the effective setting as it is processed after the setting in the lower
numbered file.
The values in the file specified by --conf-file takes precedence over all
the other configuration files and does not have to follow the naming
convention.
VSPERF uses external tools like Open vSwitch and Qemu for execution of testcases. These tools may be downloaded and built automatically (see Installation) or installed manually by user from binary packages. It is also possible to use a combination of both approaches, but it is essential to correctly set paths to all required tools. These paths are stored within a PATHS dictionary, which is evaluated before execution of each testcase, in order to setup testcase specific environment. Values selected for testcase execution are internally stored inside TOOLS dictionary, which is used by VSPERF to execute external tools, load kernel modules, etc.
The default configuration of PATHS dictionary is spread among three different configuration files
to follow logical grouping of configuration options. Basic description of PATHS dictionary
is placed inside conf/00_common.conf. The configuration specific to DPDK and vswitches
is located at conf/02_vswitch.conf. The last part related to the Qemu is defined inside
conf/04_vnf.conf. Default configuration values can be used in case, that all required
tools were downloaded and built automatically by vsperf itself. In case, that some of
tools were installed manually from binary packages, then it will be necessary to modify
the content of PATHS dictionary accordingly.
Dictionary has a specific section of configuration options for every tool type, it means:
PATHS['vswitch']- contains a separate dictionary for each of vswitches supported by VSPEFExample:
PATHS['vswitch'] = { 'OvsDpdkVhost': { ... }, 'OvsVanilla' : { ... }, ... }
PATHS['dpdk']- contains paths to the dpdk sources, kernel modules and tools (e.g. testpmd)Example:
PATHS['dpdk'] = { 'type' : 'src', 'src': { 'path': os.path.join(ROOT_DIR, 'src/dpdk/dpdk/'), 'modules' : ['uio', os.path.join(RTE_TARGET, 'kmod/igb_uio.ko')], 'bind-tool': 'tools/dpdk*bind.py', 'testpmd': os.path.join(RTE_TARGET, 'app', 'testpmd'), }, ... }
PATHS['qemu']- contains paths to the qemu sources and executable fileExample:
PATHS['qemu'] = { 'type' : 'bin', 'bin': { 'qemu-system': 'qemu-system-x86_64' }, ... }
Every section specific to the particular vswitch, dpdk or qemu may contain following types of configuration options:
option
type- is a string, which defines the type of configured paths (‘src’ or ‘bin’) to be selected for a given section:
- value
srcmeans, that VSPERF will use vswitch, DPDK or QEMU built from sources e.g. by execution ofsystems/build_base_machine.shscript during VSPERF installation- value
binmeans, that VSPERF will use vswitch, DPDK or QEMU binaries installed directly in the operating system, e.g. via OS specific packaging systemoption
path- is a string with a valid system path; Its content is checked for existence, prefixed with section name and stored into TOOLS for later use e.g.TOOLS['dpdk_src']orTOOLS['vswitch_src']option
modules- is list of strings with names of kernel modules; Every module name from given list is checked for a ‘.ko’ suffix. In case that it matches and if it is not an absolute path to the module, then module name is prefixed with value ofpathoption defined for the same sectionExample:
""" snippet of PATHS definition from the configuration file: """ PATHS['vswitch'] = { 'OvsVanilla' = { 'type' : 'src', 'src': { 'path': '/tmp/vsperf/src_vanilla/ovs/ovs/', 'modules' : ['datapath/linux/openvswitch.ko'], ... }, ... } ... } """ Final content of TOOLS dictionary used during runtime: """ TOOLS['vswitch_modules'] = ['/tmp/vsperf/src_vanilla/ovs/ovs/datapath/linux/openvswitch.ko']all other options are strings with names and paths to specific tools; If a given string contains a relative path and option
pathis defined for a given section, then string content will be prefixed with content of thepath. Otherwise the name of the tool will be searched within standard system directories. In case that filename contains OS specific wildcards, then they will be expanded to the real path. At the end of the processing, every absolute path will be checked for its existence. In case that temporary path (i.e. path with a_tmpsuffix) does not exist, then log will be written and vsperf will continue. If any other path will not exist, then vsperf execution will be terminated with a runtime error.Example:
""" snippet of PATHS definition from the configuration file: """ PATHS['vswitch'] = { 'OvsDpdkVhost': { 'type' : 'src', 'src': { 'path': '/tmp/vsperf/src_vanilla/ovs/ovs/', 'ovs-vswitchd': 'vswitchd/ovs-vswitchd', 'ovsdb-server': 'ovsdb/ovsdb-server', ... } ... } ... } """ Final content of TOOLS dictionary used during runtime: """ TOOLS['ovs-vswitchd'] = '/tmp/vsperf/src_vanilla/ovs/ovs/vswitchd/ovs-vswitchd' TOOLS['ovsdb-server'] = '/tmp/vsperf/src_vanilla/ovs/ovs/ovsdb/ovsdb-server'
Note: In case that bin type is set for DPDK, then TOOLS['dpdk_src'] will be set to
the value of PATHS['dpdk']['src']['path']. The reason is, that VSPERF uses downloaded
DPDK sources to copy DPDK and testpmd into the GUEST, where testpmd is built. In case,
that DPDK sources are not available, then vsperf will continue with test execution,
but testpmd can’t be used as a guest loopback. This is useful in case, that other guest
loopback applications (e.g. buildin or l2fwd) are used.
Note: In case of RHEL 7.3 OS usage, binary package configuration is required
for Vanilla OVS tests. With the installation of a supported rpm for OVS there is
a section in the conf\10_custom.conf file that can be used.
TRAFFIC dictionary is used for configuration of traffic generator. Default values
can be found in configuration file conf/03_traffic.conf. These default values
can be modified by (first option has the highest priorty):
Parameterssection of testcase definition- command line options specified by
--test-paramsargument- custom configuration file
It is to note, that in case of option 1 and 2, it is possible to specify only
values, which should be changed. In case of custom configuration file, it is
required to specify whole TRAFFIC dictionary with its all values or explicitly
call and update() method of TRAFFIC dictionary.
Detailed description of TRAFFIC dictionary items follows:
'traffic_type' - One of the supported traffic types.
E.g. rfc2544_throughput, rfc2544_back2back,
rfc2544_continuous or burst
Data type: str
Default value: "rfc2544_throughput".
'bidir' - Specifies if generated traffic will be full-duplex (True)
or half-duplex (False)
Data type: str
Supported values: "True", "False"
Default value: "False".
'frame_rate' - Defines desired percentage of frame rate used during
continuous stream tests.
Data type: int
Default value: 100.
'burst_size' - Defines a number of frames in the single burst, which is sent
by burst traffic type. Burst size is applied for each direction,
i.e. the total number of tx frames will be 2*burst_size in case of
bidirectional traffic.
Data type: int
Default value: 100.
'multistream' - Defines number of flows simulated by traffic generator.
Value 0 disables multistream feature
Data type: int
Supported values: 0-65536 for 'L4' stream type
unlimited for 'L2' and 'L3' stream types
Default value: 0.
'stream_type' - Stream type is an extension of the "multistream" feature.
If multistream is disabled, then stream type will be
ignored. Stream type defines ISO OSI network layer used
for simulation of multiple streams.
Data type: str
Supported values:
"L2" - iteration of destination MAC address
"L3" - iteration of destination IP address
"L4" - iteration of destination port
of selected transport protocol
Default value: "L4".
'pre_installed_flows'
- Pre-installed flows is an extension of the "multistream"
feature. If enabled, it will implicitly insert a flow
for each stream. If multistream is disabled, then
pre-installed flows will be ignored.
Data type: str
Supported values:
"Yes" - flows will be inserted into OVS
"No" - flows won't be inserted into OVS
Default value: "No".
'flow_type' - Defines flows complexity.
Data type: str
Supported values:
"port" - flow is defined by ingress ports
"IP" - flow is defined by ingress ports
and src and dst IP addresses
Default value: "port"
'flow_control' - Controls flow control support by traffic generator.
Supported values:
False - flow control is disabled
True - flow control is enabled
Default value: False
Note: Currently it is supported by IxNet only
'learning_frames' - Controls learning frames support by traffic generator.
Supported values:
False - learning frames are disabled
True - learning frames are enabled
Default value: True
Note: Currently it is supported by IxNet only
'l2' - A dictionary with l2 network layer details. Supported
values are:
'srcmac' - Specifies source MAC address filled by traffic generator.
NOTE: It can be modified by vsperf in some scenarios.
Data type: str
Default value: "00:00:00:00:00:00".
'dstmac' - Specifies destination MAC address filled by traffic generator.
NOTE: It can be modified by vsperf in some scenarios.
Data type: str
Default value: "00:00:00:00:00:00".
'framesize' - Specifies default frame size. This value should not be
changed directly. It will be overridden during testcase
execution by values specified by list TRAFFICGEN_PKT_SIZES.
Data type: int
Default value: 64
'l3' - A dictionary with l3 network layer details. Supported
values are:
'enabled' - Specifies if l3 layer should be enabled or disabled.
Data type: bool
Default value: True
NOTE: Supported only by IxNet trafficgen class
'srcip' - Specifies source MAC address filled by traffic generator.
NOTE: It can be modified by vsperf in some scenarios.
Data type: str
Default value: "1.1.1.1".
'dstip' - Specifies destination MAC address filled by traffic generator.
NOTE: It can be modified by vsperf in some scenarios.
Data type: str
Default value: "90.90.90.90".
'proto' - Specifies deflaut protocol type.
Please check particular traffic generator implementation
for supported protocol types.
Data type: str
Default value: "udp".
'l4' - A dictionary with l4 network layer details. Supported
values are:
'enabled' - Specifies if l4 layer should be enabled or disabled.
Data type: bool
Default value: True
NOTE: Supported only by IxNet trafficgen class
'srcport' - Specifies source port of selected transport protocol.
NOTE: It can be modified by vsperf in some scenarios.
Data type: int
Default value: 3000
'dstport' - Specifies destination port of selected transport protocol.
NOTE: It can be modified by vsperf in some scenarios.
Data type: int
Default value: 3001
'vlan' - A dictionary with vlan encapsulation details. Supported
values are:
'enabled' - Specifies if vlan encapsulation should be enabled or
disabled.
Data type: bool
Default value: False
'id' - Specifies vlan id.
Data type: int (NOTE: must fit to 12 bits)
Default value: 0
'priority' - Specifies a vlan priority (PCP header field).
Data type: int (NOTE: must fit to 3 bits)
Default value: 0
'cfi' - Specifies if frames can or cannot be dropped during
congestion (DEI header field).
Data type: int (NOTE: must fit to 1 bit)
Default value: 0
'capture' - A dictionary with traffic capture configuration.
NOTE: It is supported only by T-Rex traffic generator.
'enabled' - Specifies if traffic should be captured
Data type: bool
Default value: False
'tx_ports' - A list of ports, where frames transmitted towards DUT will
be captured. Ports have numbers 0 and 1. TX packet capture
is disabled if list of ports is empty.
Data type: list
Default value: [0]
'rx_ports' - A list of ports, where frames received from DUT will
be captured. Ports have numbers 0 and 1. RX packet capture
is disabled if list of ports is empty.
Data type: list
Default value: [1]
'count' - A number of frames to be captured. The same count value
is applied to both TX and RX captures.
Data type: int
Default value: 1
'filter' - An expression used to filter TX and RX packets. It uses the same
syntax as pcap library. See pcap-filter man page for additional
details.
Data type: str
Default value: ''
'scapy' - A dictionary with definition of a frame content for both traffic
directions. The frame content is defined by a SCAPY notation.
NOTE: It is supported only by the T-Rex traffic generator.
Following keywords can be used to refer to the related parts of
the TRAFFIC dictionary:
Ether_src - refers to TRAFFIC['l2']['srcmac']
Ether_dst - refers to TRAFFIC['l2']['dstmac']
IP_proto - refers to TRAFFIC['l3']['proto']
IP_PROTO - refers to upper case version of TRAFFIC['l3']['proto']
IP_src - refers to TRAFFIC['l3']['srcip']
IP_dst - refers to TRAFFIC['l3']['dstip']
IP_PROTO_sport - refers to TRAFFIC['l4']['srcport']
IP_PROTO_dport - refers to TRAFFIC['l4']['dstport']
Dot1Q_prio - refers to TRAFFIC['vlan']['priority']
Dot1Q_id - refers to TRAFFIC['vlan']['cfi']
Dot1Q_vlan - refers to TRAFFIC['vlan']['id']
'0' - A string with the frame definition for the 1st direction.
Data type: str
Default value: 'Ether(src={Ether_src}, dst={Ether_dst})/'
'Dot1Q(prio={Dot1Q_prio}, id={Dot1Q_id}, vlan={Dot1Q_vlan})/'
'IP(proto={IP_proto}, src={IP_src}, dst={IP_dst})/'
'{IP_PROTO}(sport={IP_PROTO_sport}, dport={IP_PROTO_dport})'
'1' - A string with the frame definition for the 2nd direction.
Data type: str
Default value: 'Ether(src={Ether_dst}, dst={Ether_src})/'
'Dot1Q(prio={Dot1Q_prio}, id={Dot1Q_id}, vlan={Dot1Q_vlan})/'
'IP(proto={IP_proto}, src={IP_dst}, dst={IP_src})/'
'{IP_PROTO}(sport={IP_PROTO_dport}, dport={IP_PROTO_sport})',
VSPERF is able to setup scenarios involving a number of VMs in series or in parallel.
All configuration options related to a particular VM instance are defined as
lists and prefixed with GUEST_ label. It is essential, that there is enough
items in all GUEST_ options to cover all VM instances involved in the test.
In case there is not enough items, then VSPERF will use the first item of
particular GUEST_ option to expand the list to required length.
Example of option expansion for 4 VMs:
""" Original values: """ GUEST_SMP = ['2'] GUEST_MEMORY = ['2048', '4096'] """ Values after automatic expansion: """ GUEST_SMP = ['2', '2', '2', '2'] GUEST_MEMORY = ['2048', '4096', '2048', '2048']
First option can contain macros starting with # to generate VM specific values.
These macros can be used only for options of list or str types with GUEST_
prefix.
Example of macros and their expansion for 2 VMs:
""" Original values: """ GUEST_SHARE_DIR = ['/tmp/qemu#VMINDEX_share'] GUEST_BRIDGE_IP = ['#IP(1.1.1.5)/16'] """ Values after automatic expansion: """ GUEST_SHARE_DIR = ['/tmp/qemu0_share', '/tmp/qemu1_share'] GUEST_BRIDGE_IP = ['1.1.1.5/16', '1.1.1.6/16']
Additional examples are available at 04_vnf.conf.
Note: In case, that macro is detected in the first item of the list, then all other items are ignored and list content is created automatically.
Multiple macros can be used inside one configuration option definition, but macros
cannot be used inside other macros. The only exception is macro #VMINDEX, which
is expanded first and thus it can be used inside other macros.
Following macros are supported:
#VMINDEX- it is replaced by index of VM being executed; This macro is expanded first, so it can be used inside other macros.Example:
GUEST_SHARE_DIR = ['/tmp/qemu#VMINDEX_share']
#MAC(mac_address[, step])- it will iterate givenmac_addresswith optionalstep. In case that step is not defined, then it is set to 1. It means, that first VM will use the value ofmac_address, second VM value ofmac_addressincreased bystep, etc.Example:
GUEST_NICS = [[{'mac' : '#MAC(00:00:00:00:00:01,2)'}]]
#IP(ip_address[, step])- it will iterate givenip_addresswith optionalstep. In case that step is not defined, then it is set to 1. It means, that first VM will use the value ofip_address, second VM value ofip_addressincreased bystep, etc.Example:
GUEST_BRIDGE_IP = ['#IP(1.1.1.5)/16']
#EVAL(expression)- it will evaluate givenexpressionas python code; Only simple expressions should be used. Call of the functions is not supported.Example:
GUEST_CORE_BINDING = [('#EVAL(6+2*#VMINDEX)', '#EVAL(7+2*#VMINDEX)')]
conf.settings also loads configuration from the command line and from the environment.
Every testcase uses one of the supported deployment scenarios to setup test environment. The controller responsible for a given scenario configures flows in the vswitch to route traffic among physical interfaces connected to the traffic generator and virtual machines. VSPERF supports several deployments including PXP deployment, which can setup various scenarios with multiple VMs.
These scenarios are realized by VswitchControllerPXP class, which can configure and execute given number of VMs in serial or parallel configurations. Every VM can be configured with just one or an even number of interfaces. In case that VM has more than 2 interfaces, then traffic is properly routed among pairs of interfaces.
Example of traffic routing for VM with 4 NICs in serial configuration:
+------------------------------------------+
| VM with 4 NICs |
| +---------------+ +---------------+ |
| | Application | | Application | |
| +---------------+ +---------------+ |
| ^ | ^ | |
| | v | v |
| +---------------+ +---------------+ |
| | logical ports | | logical ports | |
| | 0 1 | | 2 3 | |
+--+---------------+----+---------------+--+
^ : ^ :
| | | |
: v : v
+-----------+---------------+----+---------------+----------+
| vSwitch | 0 1 | | 2 3 | |
| | logical ports | | logical ports | |
| previous +---------------+ +---------------+ next |
| VM or PHY ^ | ^ | VM or PHY|
| port -----+ +------------+ +---> port |
+-----------------------------------------------------------+
It is also possible to define different number of interfaces for each VM to better simulate real scenarios.
Example of traffic routing for 2 VMs in serial configuration, where 1st VM has 4 NICs and 2nd VM 2 NICs:
+------------------------------------------+ +---------------------+
| 1st VM with 4 NICs | | 2nd VM with 2 NICs |
| +---------------+ +---------------+ | | +---------------+ |
| | Application | | Application | | | | Application | |
| +---------------+ +---------------+ | | +---------------+ |
| ^ | ^ | | | ^ | |
| | v | v | | | v |
| +---------------+ +---------------+ | | +---------------+ |
| | logical ports | | logical ports | | | | logical ports | |
| | 0 1 | | 2 3 | | | | 0 1 | |
+--+---------------+----+---------------+--+ +--+---------------+--+
^ : ^ : ^ :
| | | | | |
: v : v : v
+-----------+---------------+----+---------------+-------+---------------+----------+
| vSwitch | 0 1 | | 2 3 | | 4 5 | |
| | logical ports | | logical ports | | logical ports | |
| previous +---------------+ +---------------+ +---------------+ next |
| VM or PHY ^ | ^ | ^ | VM or PHY|
| port -----+ +------------+ +---------------+ +----> port |
+-----------------------------------------------------------------------------------+
The number of VMs involved in the test and the type of their connection is defined by deployment name as follows:
pvvp[number]- configures scenario with VMs connected in series with optionalnumberof VMs. In case thatnumberis not specified, then 2 VMs will be used.Example of 2 VMs in a serial configuration:
+----------------------+ +----------------------+ | 1st VM | | 2nd VM | | +---------------+ | | +---------------+ | | | Application | | | | Application | | | +---------------+ | | +---------------+ | | ^ | | | ^ | | | | v | | | v | | +---------------+ | | +---------------+ | | | logical ports | | | | logical ports | | | | 0 1 | | | | 0 1 | | +---+---------------+--+ +---+---------------+--+ ^ : ^ : | | | | : v : v +---+---------------+---------+---------------+--+ | | 0 1 | | 3 4 | | | | logical ports | vSwitch | logical ports | | | +---------------+ +---------------+ | | ^ | ^ | | | | +-----------------+ v | | +----------------------------------------+ | | | physical ports | | | | 0 1 | | +---+----------------------------------------+---+ ^ : | | : v +------------------------------------------------+ | | | traffic generator | | | +------------------------------------------------+
pvpv[number]- configures scenario with VMs connected in parallel with optionalnumberof VMs. In case thatnumberis not specified, then 2 VMs will be used. Multistream feature is used to route traffic to particular VMs (or NIC pairs of every VM). It means, that VSPERF will enable multistream feature and sets the number of streams to the number of VMs and their NIC pairs. Traffic will be dispatched based on Stream Type, i.e. by UDP port, IP address or MAC address.
- Example of 2 VMs in a parallel configuration, where traffic is dispatched
based on the UDP port.
+----------------------+ +----------------------+ | 1st VM | | 2nd VM | | +---------------+ | | +---------------+ | | | Application | | | | Application | | | +---------------+ | | +---------------+ | | ^ | | | ^ | | | | v | | | v | | +---------------+ | | +---------------+ | | | logical ports | | | | logical ports | | | | 0 1 | | | | 0 1 | | +---+---------------+--+ +---+---------------+--+ ^ : ^ : | | | | : v : v +---+---------------+---------+---------------+--+ | | 0 1 | | 3 4 | | | | logical ports | vSwitch | logical ports | | | +---------------+ +---------------+ | | ^ | ^ : | | | ......................: : | | UDP | UDP : | : | | port| port: +--------------------+ : | | 0 | 1 : | : | | | : v v | | +----------------------------------------+ | | | physical ports | | | | 0 1 | | +---+----------------------------------------+---+ ^ : | | : v +------------------------------------------------+ | | | traffic generator | | | +------------------------------------------------+
PXP deployment is backward compatible with PVP deployment, where pvp is
an alias for pvvp1 and it executes just one VM.
The number of interfaces used by VMs is defined by configuration option
GUEST_NICS_NR. In case that more than one pair of interfaces is defined
for VM, then:
- for
pvvp(serial) scenario every NIC pair is connected in serial before connection to next VM is created- for
pvpv(parallel) scenario every NIC pair is directly connected to the physical ports and unique traffic stream is assigned to it
Examples:
- Deployment
pvvp10will start 10 VMs and connects them in series- Deployment
pvpv4will start 4 VMs and connects them in parallel- Deployment
pvpv1and GUEST_NICS_NR = [4] will start 1 VM with 4 interfaces and every NIC pair is directly connected to the physical ports- Deployment
pvvpand GUEST_NICS_NR = [2, 4] will start 2 VMs; 1st VM will have 2 interfaces and 2nd VM 4 interfaces. These interfaces will be connected in serial, i.e. traffic will flow as follows: PHY1 -> VM1_1 -> VM1_2 -> VM2_1 -> VM2_2 -> VM2_3 -> VM2_4 -> PHY2
Note: In case that only 1 or more than 2 NICs are configured for VM,
then testpmd should be used as forwarding application inside the VM.
As it is able to forward traffic between multiple VM NIC pairs.
Note: In case of linux_bridge, all NICs are connected to the same
bridge inside the VM.
Note: In case that multistream feature is configured and pre_installed_flows
is set to Yes, then stream specific flows will be inserted only for connections
originating at physical ports. The rest of the flows will be based on port
numbers only. The same logic applies in case that flow_type TRAFFIC option
is set to ip. This configuration will avoid a testcase malfunction if frame headers
are modified inside VM (e.g. MAC swap or IP change).
VSPERF supports different VSwitches, Traffic Generators, VNFs and Forwarding Applications by using standard object-oriented polymorphism:
- Support for vSwitches is implemented by a class inheriting from IVSwitch.
- Support for Traffic Generators is implemented by a class inheriting from ITrafficGenerator.
- Support for VNF is implemented by a class inheriting from IVNF.
- Support for Forwarding Applications is implemented by a class inheriting from IPktFwd.
By dealing only with the abstract interfaces the core framework can support many implementations of different vSwitches, Traffic Generators, VNFs and Forwarding Applications.
class IVSwitch:
start(self)
stop(self)
add_switch(switch_name)
del_switch(switch_name)
add_phy_port(switch_name)
add_vport(switch_name)
get_ports(switch_name)
del_port(switch_name, port_name)
add_flow(switch_name, flow)
del_flow(switch_name, flow=None)
class ITrafficGenerator:
connect()
disconnect()
send_burst_traffic(traffic, time)
send_cont_traffic(traffic, time, framerate)
start_cont_traffic(traffic, time, framerate)
stop_cont_traffic(self):
send_rfc2544_throughput(traffic, tests, duration, lossrate)
start_rfc2544_throughput(traffic, tests, duration, lossrate)
wait_rfc2544_throughput(self)
send_rfc2544_back2back(traffic, tests, duration, lossrate)
start_rfc2544_back2back(traffic, , tests, duration, lossrate)
wait_rfc2544_back2back()
Note send_xxx() blocks whereas start_xxx() does not and must be followed by a subsequent call to wait_xxx().
class IVnf:
start(memory, cpus,
monitor_path, shared_path_host,
shared_path_guest, guest_prompt)
stop()
execute(command)
wait(guest_prompt)
execute_and_wait (command)
class IPktFwd: start() stop()
Controllers are used in conjunction with abstract interfaces as way of decoupling the control of vSwtiches, VNFs, TrafficGenerators and Forwarding Applications from other components.
The controlled classes provide basic primitive operations. The Controllers sequence and co-ordinate these primitive operation in to useful actions. For instance the vswitch_controller_p2p can be used to bring any vSwitch (that implements the primitives defined in IVSwitch) into the configuration required by the Phy-to-Phy Deployment Scenario.
In order to support a new vSwitch only a new implementation of IVSwitch needs be created for the new vSwitch to be capable of fulfilling all the Deployment Scenarios provided for by existing or future vSwitch Controllers.
Similarly if a new Deployment Scenario is required it only needs to be written once as a new vSwitch Controller and it will immediately be capable of controlling all existing and future vSwitches in to that Deployment Scenario.
Similarly the Traffic Controllers can be used to co-ordinate basic operations provided by implementers of ITrafficGenerator to provide useful tests. Though traffic generators generally already implement full test cases i.e. they both generate suitable traffic and analyse returned traffic in order to implement a test which has typically been predefined in an RFC document. However the Traffic Controller class allows for the possibility of further enhancement - such as iterating over tests for various packet sizes or creating new tests.
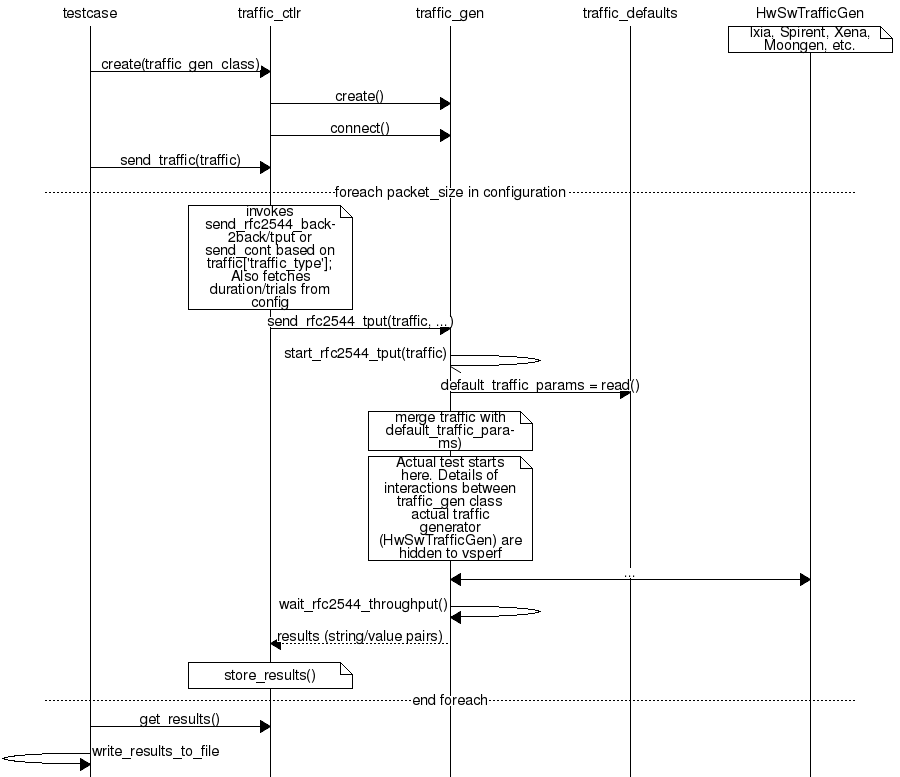
The working of the Loader package (which is responsible for finding arbitrary classes based on configuration data) and the Component Factory which is responsible for choosing the correct class for a particular situation - e.g. Deployment Scenario can be seen in this diagram.
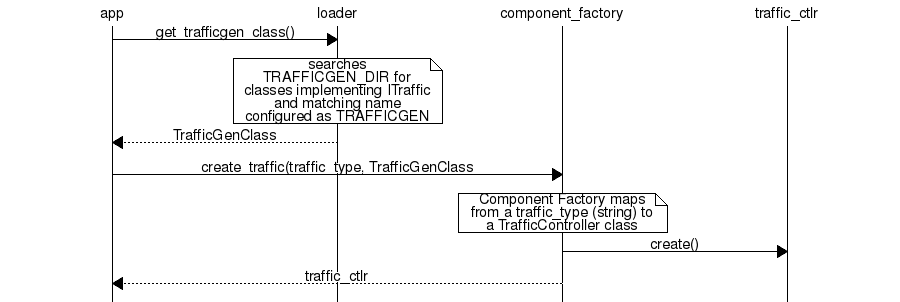
Vsperf uses a standard set of routing tables in order to allow tests to easily mix and match Deployment Scenarios (PVP, P2P topology), Tuple Matching and Frame Modification requirements.
The usage of routing tables is driven by configuration parameter OVS_ROUTING_TABLES.
Routing tables are disabled by default (i.e. parameter is set to False) for better
comparison of results among supported vSwitches (e.g. OVS vs. VPP).
+--------------+
| |
| Table 0 | table#0 - Match table. Flows designed to force 5 & 10
| | tuple matches go here.
| |
+--------------+
|
|
v
+--------------+ table#1 - Routing table. Flow entries to forward
| | packets between ports goes here.
| Table 1 | The chosen port is communicated to subsequent tables by
| | setting the metadata value to the egress port number.
| | Generally this table is set-up by by the
+--------------+ vSwitchController.
|
|
v
+--------------+ table#2 - Frame modification table. Frame modification
| | flow rules are isolated in this table so that they can
| Table 2 | be turned on or off without affecting the routing or
| | tuple-matching flow rules. This allows the frame
| | modification and tuple matching required by the tests
| | in the VSWITCH PERFORMANCE FOR TELCO NFV test
+--------------+ specification to be independent of the Deployment
| Scenario set up by the vSwitchController.
|
v
+--------------+
| |
| Table 3 | table#3 - Egress table. Egress packets on the ports
| | setup in Table 1.
+--------------+
The intention of this Level Test Design (LTD) document is to specify the set of tests to carry out in order to objectively measure the current characteristics of a virtual switch in the Network Function Virtualization Infrastructure (NFVI) as well as the test pass criteria. The detailed test cases will be defined in details-of-LTD, preceded by the doc-id-of-LTD and the scope-of-LTD.
This document is currently in draft form.
The document id will be used to uniquely identify versions of the LTD. The format for the document id will be: OPNFV_vswitchperf_LTD_REL_STATUS, where by the status is one of: draft, reviewed, corrected or final. The document id for this version of the LTD is: OPNFV_vswitchperf_LTD_Brahmaputra_REVIEWED.
The main purpose of this project is to specify a suite of performance tests in order to objectively measure the current packet transfer characteristics of a virtual switch in the NFVI. The intent of the project is to facilitate testing of any virtual switch. Thus, a generic suite of tests shall be developed, with no hard dependencies to a single implementation. In addition, the test case suite shall be architecture independent.
The test cases developed in this project shall not form part of a separate test framework, all of these tests may be inserted into the Continuous Integration Test Framework and/or the Platform Functionality Test Framework - if a vSwitch becomes a standard component of an OPNFV release.
This section describes the features to be tested (FeaturesToBeTested-of-LTD), and identifies the sets of test cases or scenarios (TestIdentification-of-LTD).
Characterizing virtual switches (i.e. Device Under Test (DUT) in this document) includes measuring the following performance metrics:
The following tests aim to determine the maximum forwarding rate that can be achieved with a virtual switch. The list is not exhaustive but should indicate the type of tests that should be required. It is expected that more will be added.
Title: RFC 2544 X% packet loss ratio Throughput and Latency Test
Prerequisite Test: N/A
Priority:
Description:
This test determines the DUT’s maximum forwarding rate with X% traffic loss for a constant load (fixed length frames at a fixed interval time). The default loss percentages to be tested are: - X = 0% - X = 10^-7%
Note: Other values can be tested if required by the user.
The selected frame sizes are those previously defined under Default Test Parameters. The test can also be used to determine the average latency of the traffic.
Under the RFC2544 test methodology, the test duration will include a number of trials; each trial should run for a minimum period of 60 seconds. A binary search methodology must be applied for each trial to obtain the final result.
Expected Result: At the end of each trial, the presence or absence of loss determines the modification of offered load for the next trial, converging on a maximum rate, or RFC2544 Throughput with X% loss. The Throughput load is re-used in related RFC2544 tests and other tests.
Metrics Collected:
The following are the metrics collected for this test:
- The maximum forwarding rate in Frames Per Second (FPS) and Mbps of the DUT for each frame size with X% packet loss.
- The average latency of the traffic flow when passing through the DUT (if testing for latency, note that this average is different from the test specified in Section 26.3 of RFC2544).
- CPU and memory utilization may also be collected as part of this test, to determine the vSwitch’s performance footprint on the system.
Title: RFC 2544 X% packet loss Throughput and Latency Test with packet modification
Prerequisite Test: N/A
Priority:
Description:
This test determines the DUT’s maximum forwarding rate with X% traffic loss for a constant load (fixed length frames at a fixed interval time). The default loss percentages to be tested are: - X = 0% - X = 10^-7%
Note: Other values can be tested if required by the user.
The selected frame sizes are those previously defined under Default Test Parameters. The test can also be used to determine the average latency of the traffic.
Under the RFC2544 test methodology, the test duration will include a number of trials; each trial should run for a minimum period of 60 seconds. A binary search methodology must be applied for each trial to obtain the final result.
During this test, the DUT must perform the following operations on the traffic flow:
- Perform packet parsing on the DUT’s ingress port.
- Perform any relevant address look-ups on the DUT’s ingress ports.
- Modify the packet header before forwarding the packet to the DUT’s egress port. Packet modifications include:
- Modifying the Ethernet source or destination MAC address.
- Modifying/adding a VLAN tag. (Recommended).
- Modifying/adding a MPLS tag.
- Modifying the source or destination ip address.
- Modifying the TOS/DSCP field.
- Modifying the source or destination ports for UDP/TCP/SCTP.
- Modifying the TTL.
Expected Result: The Packet parsing/modifications require some additional degree of processing resource, therefore the RFC2544 Throughput is expected to be somewhat lower than the Throughput level measured without additional steps. The reduction is expected to be greatest on tests with the smallest packet sizes (greatest header processing rates).
Metrics Collected:
The following are the metrics collected for this test:
- The maximum forwarding rate in Frames Per Second (FPS) and Mbps of the DUT for each frame size with X% packet loss and packet modification operations being performed by the DUT.
- The average latency of the traffic flow when passing through the DUT (if testing for latency, note that this average is different from the test specified in Section 26.3 of RFC2544).
- The RFC5481 PDV form of delay variation on the traffic flow, using the 99th percentile.
- CPU and memory utilization may also be collected as part of this test, to determine the vSwitch’s performance footprint on the system.
Title: RFC 2544 Throughput and Latency Profile
Prerequisite Test: N/A
Priority:
Description:
This test reveals how throughput and latency degrades as the offered rate varies in the region of the DUT’s maximum forwarding rate as determined by LTD.Throughput.RFC2544.PacketLossRatio (0% Packet Loss). For example it can be used to determine if the degradation of throughput and latency as the offered rate increases is slow and graceful or sudden and severe.
The selected frame sizes are those previously defined under Default Test Parameters.
The offered traffic rate is described as a percentage delta with respect to the DUT’s RFC 2544 Throughput as determined by LTD.Throughput.RFC2544.PacketLoss Ratio (0% Packet Loss case). A delta of 0% is equivalent to an offered traffic rate equal to the RFC 2544 Maximum Throughput; A delta of +50% indicates an offered rate half-way between the Maximum RFC2544 Throughput and line-rate, whereas a delta of -50% indicates an offered rate of half the RFC 2544 Maximum Throughput. Therefore the range of the delta figure is natuarlly bounded at -100% (zero offered traffic) and +100% (traffic offered at line rate).
The following deltas to the maximum forwarding rate should be applied:
- -50%, -10%, 0%, +10% & +50%
Expected Result: For each packet size a profile should be produced of how throughput and latency vary with offered rate.
Metrics Collected:
The following are the metrics collected for this test:
- The forwarding rate in Frames Per Second (FPS) and Mbps of the DUT for each delta to the maximum forwarding rate and for each frame size.
- The average latency for each delta to the maximum forwarding rate and for each frame size.
- CPU and memory utilization may also be collected as part of this test, to determine the vSwitch’s performance footprint on the system.
- Any failures experienced (for example if the vSwitch crashes, stops processing packets, restarts or becomes unresponsive to commands) when the offered load is above Maximum Throughput MUST be recorded and reported with the results.
Title: RFC 2544 System Recovery Time Test
Prerequisite Test LTD.Throughput.RFC2544.PacketLossRatio
Priority:
Description:
The aim of this test is to determine the length of time it takes the DUT to recover from an overload condition for a constant load (fixed length frames at a fixed interval time). The selected frame sizes are those previously defined under Default Test Parameters, traffic should be sent to the DUT under normal conditions. During the duration of the test and while the traffic flows are passing though the DUT, at least one situation leading to an overload condition for the DUT should occur. The time from the end of the overload condition to when the DUT returns to normal operations should be measured to determine recovery time. Prior to overloading the DUT, one should record the average latency for 10,000 packets forwarded through the DUT.
The overload condition SHOULD be to transmit traffic at a very high frame rate to the DUT (150% of the maximum 0% packet loss rate as determined by LTD.Throughput.RFC2544.PacketLossRatio or line-rate whichever is lower), for at least 60 seconds, then reduce the frame rate to 75% of the maximum 0% packet loss rate. A number of time-stamps should be recorded: - Record the time-stamp at which the frame rate was reduced and record a second time-stamp at the time of the last frame lost. The recovery time is the difference between the two timestamps. - Record the average latency for 10,000 frames after the last frame loss and continue to record average latency measurements for every 10,000 frames, when latency returns to within 10% of pre-overload levels record the time-stamp.
Expected Result:
Metrics collected
The following are the metrics collected for this test:
- The length of time it takes the DUT to recover from an overload condition.
- The length of time it takes the DUT to recover the average latency to pre-overload conditions.
Deployment scenario:
- Physical → virtual switch → physical.
Title: RFC2544 Back To Back Frames Test
Prerequisite Test: N
Priority:
Description:
The aim of this test is to characterize the ability of the DUT to process back-to-back frames. For each frame size previously defined under Default Test Parameters, a burst of traffic is sent to the DUT with the minimum inter-frame gap between each frame. If the number of received frames equals the number of frames that were transmitted, the burst size should be increased and traffic is sent to the DUT again. The value measured is the back-to-back value, that is the maximum burst size the DUT can handle without any frame loss. Please note a trial must run for a minimum of 2 seconds and should be repeated 50 times (at a minimum).
Expected Result:
Tests of back-to-back frames with physical devices have produced unstable results in some cases. All tests should be repeated in multiple test sessions and results stability should be examined.
Metrics collected
The following are the metrics collected for this test:
- The average back-to-back value across the trials, which is the number of frames in the longest burst that the DUT will handle without the loss of any frames.
- CPU and memory utilization may also be collected as part of this test, to determine the vSwitch’s performance footprint on the system.
Deployment scenario:
- Physical → virtual switch → physical.
Title: RFC 2889 X% packet loss Max Forwarding Rate Soak Test
Prerequisite Tests:
LTD.Throughput.RFC2544.PacketLossRatio will determine the offered load and frame size for which the maximum theoretical throughput of the interface has not been achieved. As described in RFC 2544 section 24, the final determination of the benchmark SHOULD be conducted using a full length trial, and for this purpose the duration is 5 minutes with zero loss ratio.
It is also essential to verify that the Traffic Generator has sufficient stability to conduct Soak tests. Therefore, a prerequisite is to perform this test with the DUT removed and replaced with a cross-over cable (or other equivalent very low overhead method such as a loopback in a HW switch), so that the traffic generator (and any other network involved) can be tested over the Soak period. Note that this test may be challenging for software- based traffic generators.
Priority:
Description:
The aim of this test is to understand the Max Forwarding Rate stability over an extended test duration in order to uncover any outliers. To allow for an extended test duration, the test should ideally run for 24 hours or if this is not possible, for at least 6 hours.
For this test, one frame size must be sent at the highest frame rate with X% packet loss ratio, as determined in the prerequisite test (a short trial). The loss ratio shall be measured and recorded every 5 minutes during the test (it may be sufficient to collect lost frame counts and divide by the number of frames sent in 5 minutes to see if a threshold has been crossed, and accept some small inaccuracy in the threshold evaluation, not the result). The default loss ratio is X = 0% and loss ratio > 10^-7% is the default threshold to terminate the test early (or inform the test operator of the failure status).
Note: Other values of X and loss threshold can be tested if required by the user.
Expected Result:
Metrics Collected:
The following are the metrics collected for this test:
- Max Forwarding Rate stability of the DUT.
- This means reporting the number of packets lost per time interval and reporting any time intervals with packet loss. The RFC2889 Forwarding Rate shall be measured in each interval. An interval of 300s is suggested.
- CPU and memory utilization may also be collected as part of this test, to determine the vSwitch’s performance footprint on the system.
- The RFC5481 PDV form of delay variation on the traffic flow, using the 99th percentile, may also be collected.
Title: RFC 2889 Max Forwarding Rate Soak Test with Frame Modification
Prerequisite Test:
LTD.Throughput.RFC2544.PacketLossRatioFrameModification (0% Packet Loss) will determine the offered load and frame size for which the maximum theoretical throughput of the interface has not been achieved. As described in RFC 2544 section 24, the final determination of the benchmark SHOULD be conducted using a full length trial, and for this purpose the duration is 5 minutes with zero loss ratio.
It is also essential to verify that the Traffic Generator has sufficient stability to conduct Soak tests. Therefore, a prerequisite is to perform this test with the DUT removed and replaced with a cross-over cable (or other equivalent very low overhead method such as a loopback in a HW switch), so that the traffic generator (and any other network involved) can be tested over the Soak period. Note that this test may be challenging for software- based traffic generators.
Priority:
Description:
The aim of this test is to understand the Max Forwarding Rate stability over an extended test duration in order to uncover any outliers. To allow for an extended test duration, the test should ideally run for 24 hours or, if this is not possible, for at least 6 hours.
For this test, one frame size must be sent at the highest frame rate with X% packet loss ratio, as determined in the prerequisite test (a short trial). The loss ratio shall be measured and recorded every 5 minutes during the test (it may be sufficient to collect lost frame counts and divide by the number of frames sent in 5 minutes to see if a threshold has been crossed, and accept some small inaccuracy in the threshold evaluation, not the result). The default loss ratio is X = 0% and loss ratio > 10^-7% is the default threshold to terminate the test early (or inform the test operator of the failure status).
Note: Other values of X and loss threshold can be tested if required by the user.
During this test, the DUT must perform the following operations on the traffic flow:
- Perform packet parsing on the DUT’s ingress port.
- Perform any relevant address look-ups on the DUT’s ingress ports.
- Modify the packet header before forwarding the packet to the DUT’s egress port. Packet modifications include:
- Modifying the Ethernet source or destination MAC address.
- Modifying/adding a VLAN tag (Recommended).
- Modifying/adding a MPLS tag.
- Modifying the source or destination ip address.
- Modifying the TOS/DSCP field.
- Modifying the source or destination ports for UDP/TCP/SCTP.
- Modifying the TTL.
Expected Result:
Metrics Collected:
The following are the metrics collected for this test:
- Max Forwarding Rate stability of the DUT.
- This means reporting the number of packets lost per time interval and reporting any time intervals with packet loss. The RFC2889 Forwarding Rate shall be measured in each interval. An interval of 300s is suggested.
- CPU and memory utilization may also be collected as part of this test, to determine the vSwitch’s performance footprint on the system.
- The RFC5481 PDV form of delay variation on the traffic flow, using the 99th percentile, may also be collected.
Title: RFC 6201 Reset Time Test
Prerequisite Test: N/A
Priority:
Description:
The aim of this test is to determine the length of time it takes the DUT to recover from a reset.
Two reset methods are defined - planned and unplanned. A planned reset requires stopping and restarting the virtual switch by the usual ‘graceful’ method defined by it’s documentation. An unplanned reset requires simulating a fatal internal fault in the virtual switch - for example by using kill -SIGKILL on a Linux environment.
Both reset methods SHOULD be exercised.
For each frame size previously defined under Default Test Parameters, traffic should be sent to the DUT under normal conditions. During the duration of the test and while the traffic flows are passing through the DUT, the DUT should be reset and the Reset time measured. The Reset time is the total time that a device is determined to be out of operation and includes the time to perform the reset and the time to recover from it (cf. RFC6201).
RFC6201 defines two methods to measure the Reset time:
Frame-Loss Method: which requires the monitoring of the number of lost frames and calculates the Reset time based on the number of frames lost and the offered rate according to the following formula:
Frames_lost (packets) Reset_time = ------------------------------------- Offered_rate (packets per second)Timestamp Method: which measures the time from which the last frame is forwarded from the DUT to the time the first frame is forwarded after the reset. This involves time-stamping all transmitted frames and recording the timestamp of the last frame that was received prior to the reset and also measuring the timestamp of the first frame that is received after the reset. The Reset time is the difference between these two timestamps.
According to RFC6201 the choice of method depends on the test tool’s capability; the Frame-Loss method SHOULD be used if the test tool supports:
- Counting the number of lost frames per stream.
- Transmitting test frame despite the physical link status.
whereas the Timestamp method SHOULD be used if the test tool supports:
- Timestamping each frame.
- Monitoring received frame’s timestamp.
- Transmitting frames only if the physical link status is up.
Expected Result:
Metrics collected
The following are the metrics collected for this test:
- Average Reset Time over the number of trials performed.
Results of this test should include the following information:
- The reset method used.
- Throughput in Fps and Mbps.
- Average Frame Loss over the number of trials performed.
- Average Reset Time in milliseconds over the number of trials performed.
- Number of trials performed.
- Protocol: IPv4, IPv6, MPLS, etc.
- Frame Size in Octets
- Port Media: Ethernet, Gigabit Ethernet (GbE), etc.
- Port Speed: 10 Gbps, 40 Gbps etc.
- Interface Encapsulation: Ethernet, Ethernet VLAN, etc.
Deployment scenario:
- Physical → virtual switch → physical.
Title: RFC2889 Forwarding Rate Test
Prerequisite Test: LTD.Throughput.RFC2544.PacketLossRatio
Priority:
Description:
This test measures the DUT’s Max Forwarding Rate when the Offered Load is varied between the throughput and the Maximum Offered Load for fixed length frames at a fixed time interval. The selected frame sizes are those previously defined under Default Test Parameters. The throughput is the maximum offered load with 0% frame loss (measured by the prerequisite test), and the Maximum Offered Load (as defined by RFC2285) is “the highest number of frames per second that an external source can transmit to a DUT/SUT for forwarding to a specified output interface or interfaces”.
Traffic should be sent to the DUT at a particular rate (TX rate) starting with TX rate equal to the throughput rate. The rate of successfully received frames at the destination counted (in FPS). If the RX rate is equal to the TX rate, the TX rate should be increased by a fixed step size and the RX rate measured again until the Max Forwarding Rate is found.
The trial duration for each iteration should last for the period of time needed for the system to reach steady state for the frame size being tested. Under RFC2889 (Sec. 5.6.3.1) test methodology, the test duration should run for a minimum period of 30 seconds, regardless whether the system reaches steady state before the minimum duration ends.
Expected Result: According to RFC2889 The Max Forwarding Rate is the highest forwarding rate of a DUT taken from an iterative set of forwarding rate measurements. The iterative set of forwarding rate measurements are made by setting the intended load transmitted from an external source and measuring the offered load (i.e what the DUT is capable of forwarding). If the Throughput == the Maximum Offered Load, it follows that Max Forwarding Rate is equal to the Maximum Offered Load.
Metrics Collected:
The following are the metrics collected for this test:
- The Max Forwarding Rate for the DUT for each packet size.
- CPU and memory utilization may also be collected as part of this test, to determine the vSwitch’s performance footprint on the system.
Deployment scenario:
- Physical → virtual switch → physical. Note: Full mesh tests with multiple ingress and egress ports are a key aspect of RFC 2889 benchmarks, and scenarios with both 2 and 4 ports should be tested. In any case, the number of ports used must be reported.
Title: RFC2889 Forward Pressure Test
Prerequisite Test: LTD.Throughput.RFC2889.MaxForwardingRate
Priority:
Description:
The aim of this test is to determine if the DUT transmits frames with an inter-frame gap that is less than 12 bytes. This test overloads the DUT and measures the output for forward pressure. Traffic should be transmitted to the DUT with an inter-frame gap of 11 bytes, this will overload the DUT by 1 byte per frame. The forwarding rate of the DUT should be measured.
Expected Result: The forwarding rate should not exceed the maximum forwarding rate of the DUT collected by LTD.Throughput.RFC2889.MaxForwardingRate.
Metrics collected
The following are the metrics collected for this test:
- Forwarding rate of the DUT in FPS or Mbps.
- CPU and memory utilization may also be collected as part of this test, to determine the vSwitch’s performance footprint on the system.
Deployment scenario:
- Physical → virtual switch → physical.
Title: RFC2889 Error Frames Filtering Test
Prerequisite Test: N/A
Priority:
Description:
The aim of this test is to determine whether the DUT will propagate any erroneous frames it receives or whether it is capable of filtering out the erroneous frames. Traffic should be sent with erroneous frames included within the flow at random intervals. Illegal frames that must be tested include: - Oversize Frames. - Undersize Frames. - CRC Errored Frames. - Dribble Bit Errored Frames - Alignment Errored Frames
The traffic flow exiting the DUT should be recorded and checked to determine if the erroneous frames where passed through the DUT.
Expected Result: Broken frames are not passed!
Metrics collected
No Metrics are collected in this test, instead it determines:
- Whether the DUT will propagate erroneous frames.
- Or whether the DUT will correctly filter out any erroneous frames from traffic flow with out removing correct frames.
Deployment scenario:
- Physical → virtual switch → physical.
Title: RFC2889 Broadcast Frame Forwarding Test
Prerequisite Test: N
Priority:
Description:
The aim of this test is to determine the maximum forwarding rate of the DUT when forwarding broadcast traffic. For each frame previously defined under Default Test Parameters, the traffic should be set up as broadcast traffic. The traffic throughput of the DUT should be measured.
The test should be conducted with at least 4 physical ports on the DUT. The number of ports used MUST be recorded.
As broadcast involves forwarding a single incoming packet to several destinations, the latency of a single packet is defined as the average of the latencies for each of the broadcast destinations.
The incoming packet is transmitted on each of the other physical ports, it is not transmitted on the port on which it was received. The test MAY be conducted using different broadcasting ports to uncover any performance differences.
Expected Result:
Metrics collected:
The following are the metrics collected for this test:
- The forwarding rate of the DUT when forwarding broadcast traffic.
- The minimum, average & maximum packets latencies observed.
Deployment scenario:
- Physical → virtual switch 3x physical. In the Broadcast rate testing, four test ports are required. One of the ports is connected to the test device, so it can send broadcast frames and listen for miss-routed frames.
Title: Modified RFC 2544 X% packet loss ratio Throughput and Latency Test
Prerequisite Test: N/A
Priority:
Description:
This test determines the DUT’s maximum forwarding rate with X% traffic loss for a constant load (fixed length frames at a fixed interval time). The default loss percentages to be tested are: X = 0%, X = 10^-7%
Modified RFC 2544 throughput benchmarking methodology aims to quantify the throughput measurement variations observed during standard RFC 2544 benchmarking measurements of virtual switches and VNFs. The RFC2544 binary search algorithm is modified to use more samples per test trial to drive the binary search and yield statistically more meaningful results. This keeps the heart of the RFC2544 methodology, still relying on the binary search of throughput at specified loss tolerance, while providing more useful information about the range of results seen in testing. Instead of using a single traffic trial per iteration step, each traffic trial is repeated N times and the success/failure of the iteration step is based on these N traffic trials. Two types of revised tests are defined - Worst-of-N and Best-of-N.
Worst-of-N
Worst-of-N indicates the lowest expected maximum throughput for ( packet size, loss tolerance) when repeating the test.
- Repeat the same test run N times at a set packet rate, record each result.
- Take the WORST result (highest packet loss) out of N result samples, called the Worst-of-N sample.
- If Worst-of-N sample has loss less than the set loss tolerance, then the step is successful - increase the test traffic rate.
- If Worst-of-N sample has loss greater than the set loss tolerance then the step failed - decrease the test traffic rate.
- Go to step 1.
Best-of-N
Best-of-N indicates the highest expected maximum throughput for ( packet size, loss tolerance) when repeating the test.
- Repeat the same traffic run N times at a set packet rate, record each result.
- Take the BEST result (least packet loss) out of N result samples, called the Best-of-N sample.
- If Best-of-N sample has loss less than the set loss tolerance, then the step is successful - increase the test traffic rate.
- If Best-of-N sample has loss greater than the set loss tolerance, then the step failed - decrease the test traffic rate.
- Go to step 1.
Performing both Worst-of-N and Best-of-N benchmark tests yields lower and upper bounds of expected maximum throughput under the operating conditions, giving a very good indication to the user of the deterministic performance range for the tested setup.
Expected Result: At the end of each trial series, the presence or absence of loss determines the modification of offered load for the next trial series, converging on a maximum rate, or RFC2544 Throughput with X% loss. The Throughput load is re-used in related RFC2544 tests and other tests.
Metrics Collected:
The following are the metrics collected for this test:
- The maximum forwarding rate in Frames Per Second (FPS) and Mbps of the DUT for each frame size with X% packet loss.
- The average latency of the traffic flow when passing through the DUT (if testing for latency, note that this average is different from the test specified in Section 26.3 of RFC2544).
- Following may also be collected as part of this test, to determine the vSwitch’s performance footprint on the system:
- CPU core utilization.
- CPU cache utilization.
- Memory footprint.
- System bus (QPI, PCI, ...) utilization.
- CPU cycles consumed per packet.
Title: <tech> Overlay Network RFC 2544 X% packet loss ratio Throughput and Latency Test
NOTE: Throughout this test, four interchangeable overlay technologies are covered by the same test description. They are: VXLAN, GRE, NVGRE and GENEVE.
Prerequisite Test: N/A
Priority:
Description: This test evaluates standard switch performance benchmarks for the scenario where an Overlay Network is deployed for all paths through the vSwitch. Overlay Technologies covered (replacing <tech> in the test name) include:
- VXLAN
- GRE
- NVGRE
- GENEVE
Performance will be assessed for each of the following overlay network functions:
- Encapsulation only
- De-encapsulation only
- Both Encapsulation and De-encapsulation
For each native packet, the DUT must perform the following operations:
- Examine the packet and classify its correct overlay net (tunnel) assignment
- Encapsulate the packet
- Switch the packet to the correct port
For each encapsulated packet, the DUT must perform the following operations:
- Examine the packet and classify its correct native network assignment
- De-encapsulate the packet, if required
- Switch the packet to the correct port
The selected frame sizes are those previously defined under Default Test Parameters.
Thus, each test comprises an overlay technology, a network function, and a packet size with overlay network overhead included (but see also the discussion at https://etherpad.opnfv.org/p/vSwitchTestsDrafts ).
The test can also be used to determine the average latency of the traffic.
Under the RFC2544 test methodology, the test duration will include a number of trials; each trial should run for a minimum period of 60 seconds. A binary search methodology must be applied for each trial to obtain the final result for Throughput.
Expected Result: At the end of each trial, the presence or absence of loss determines the modification of offered load for the next trial, converging on a maximum rate, or RFC2544 Throughput with X% loss (where the value of X is typically equal to zero). The Throughput load is re-used in related RFC2544 tests and other tests.
Metrics Collected: The following are the metrics collected for this test:
- The maximum Throughput in Frames Per Second (FPS) and Mbps of the DUT for each frame size with X% packet loss.
- The average latency of the traffic flow when passing through the DUT and VNFs (if testing for latency, note that this average is different from the test specified in Section 26.3 of RFC2544).
- CPU and memory utilization may also be collected as part of this test, to determine the vSwitch’s performance footprint on the system.
Title: RFC 2544 X% packet loss ratio match action Throughput and Latency Test
Prerequisite Test: LTD.Throughput.RFC2544.PacketLossRatio
Priority:
Description:
The aim of this test is to determine the cost of carrying out match action(s) on the DUT’s RFC2544 Throughput with X% traffic loss for a constant load (fixed length frames at a fixed interval time).
Each test case requires:
- selection of a specific match action(s),
- specifying a percentage of total traffic that is elligible for the match action,
- determination of the specific test configuration (number of flows, number of test ports, presence of an external controller, etc.), and
- measurement of the RFC 2544 Throughput level with X% packet loss: Traffic shall be bi-directional and symmetric.
Note: It would be ideal to verify that all match action-elligible traffic was forwarded to the correct port, and if forwarded to an unintended port it should be considered lost.
A match action is an action that is typically carried on a frame or packet that matches a set of flow classification parameters (typically frame/packet header fields). A match action may or may not modify a packet/frame. Match actions include [1]:
- output : outputs a packet to a particular port.
- normal: Subjects the packet to traditional L2/L3 processing (MAC learning).
- flood: Outputs the packet on all switch physical ports other than the port on which it was received and any ports on which flooding is disabled.
- all: Outputs the packet on all switch physical ports other than the port on which it was received.
- local: Outputs the packet on the
local port, which corresponds to the network device that has the same name as the bridge.- in_port: Outputs the packet on the port from which it was received.
- Controller: Sends the packet and its metadata to the OpenFlow controller as a
packet inmessage.- enqueue: Enqueues the packet on the specified queue within port.
- drop: discard the packet.
Modifications include [1]:
- mod vlan: covered by LTD.Throughput.RFC2544.PacketLossRatioFrameModification
- mod_dl_src: Sets the source Ethernet address.
- mod_dl_dst: Sets the destination Ethernet address.
- mod_nw_src: Sets the IPv4 source address.
- mod_nw_dst: Sets the IPv4 destination address.
- mod_tp_src: Sets the TCP or UDP or SCTP source port.
- mod_tp_dst: Sets the TCP or UDP or SCTP destination port.
- mod_nw_tos: Sets the DSCP bits in the IPv4 ToS/DSCP or IPv6 traffic class field.
- mod_nw_ecn: Sets the ECN bits in the appropriate IPv4 or IPv6 field.
- mod_nw_ttl: Sets the IPv4 TTL or IPv6 hop limit field.
Note: This comprehensive list requires extensive traffic generator capabilities.
The match action(s) that were applied as part of the test should be reported in the final test report.
During this test, the DUT must perform the following operations on the traffic flow:
- Perform packet parsing on the DUT’s ingress port.
- Perform any relevant address look-ups on the DUT’s ingress ports.
- Carry out one or more of the match actions specified above.
The default loss percentages to be tested are: - X = 0% - X = 10^-7% Other values can be tested if required by the user. The selected frame sizes are those previously defined under Default Test Parameters.
The test can also be used to determine the average latency of the traffic when a match action is applied to packets in a flow. Under the RFC2544 test methodology, the test duration will include a number of trials; each trial should run for a minimum period of 60 seconds. A binary search methodology must be applied for each trial to obtain the final result.
Expected Result:
At the end of each trial, the presence or absence of loss determines the modification of offered load for the next trial, converging on a maximum rate, or RFC2544Throughput with X% loss. The Throughput load is re-used in related RFC2544 tests and other tests.
Metrics Collected:
The following are the metrics collected for this test:
- The RFC 2544 Throughput in Frames Per Second (FPS) and Mbps of the DUT for each frame size with X% packet loss.
- The average latency of the traffic flow when passing through the DUT (if testing for latency, note that this average is different from the test specified in Section 26.3 ofRFC2544).
- CPU and memory utilization may also be collected as part of this test, to determine the vSwitch’s performance footprint on the system.
The metrics collected can be compared to that of the prerequisite test to determine the cost of the match action(s) in the pipeline.
Deployment scenario:
- Physical → virtual switch → physical (and others are possible)
- [1] ovs-ofctl - administer OpenFlow switches
- [http://openvswitch.org/support/dist-docs/ovs-ofctl.8.txt ]
These tests will measure the store and forward latency as well as the packet delay variation for various packet types through the virtual switch. The following list is not exhaustive but should indicate the type of tests that should be required. It is expected that more will be added.
Title: Initial Packet Processing Latency
Prerequisite Test: N/A
Priority:
Description:
In some virtual switch architectures, the first packets of a flow will take the system longer to process than subsequent packets in the flow. This test determines the latency for these packets. The test will measure the latency of the packets as they are processed by the flow-setup-path of the DUT. There are two methods for this test, a recommended method and a nalternative method that can be used if it is possible to disable the fastpath of the virtual switch.
Recommended method: This test will send 64,000 packets to the DUT, each belonging to a different flow. Average packet latency will be determined over the 64,000 packets.
Alternative method: This test will send a single packet to the DUT after a fixed interval of time. The time interval will be equivalent to the amount of time it takes for a flow to time out in the virtual switch plus 10%. Average packet latency will be determined over 1,000,000 packets.
This test is intended only for non-learning virtual switches; For learning virtual switches use RFC2889.
For this test, only unidirectional traffic is required.
Expected Result: The average latency for the initial packet of all flows should be greater than the latency of subsequent traffic.
Metrics Collected:
The following are the metrics collected for this test:
- Average latency of the initial packets of all flows that are processed by the DUT.
Deployment scenario:
- Physical → Virtual Switch → Physical.
Title: Packet Delay Variation Soak Test
Prerequisite Tests:
LTD.Throughput.RFC2544.PacketLossRatio will determine the offered load and frame size for which the maximum theoretical throughput of the interface has not been achieved. As described in RFC 2544 section 24, the final determination of the benchmark SHOULD be conducted using a full length trial, and for this purpose the duration is 5 minutes with zero loss ratio.
It is also essential to verify that the Traffic Generator has sufficient stability to conduct Soak tests. Therefore, a prerequisite is to perform this test with the DUT removed and replaced with a cross-over cable (or other equivalent very low overhead method such as a loopback in a HW switch), so that the traffic generator (and any other network involved) can be tested over the Soak period. Note that this test may be challenging for software- based traffic generators.
Priority:
Description:
The aim of this test is to understand the distribution of packet delay variation for different frame sizes over an extended test duration and to determine if there are any outliers. To allow for an extended test duration, the test should ideally run for 24 hours or, if this is not possible, for at least 6 hours.
For this test, one frame size must be sent at the highest frame rate with X% packet loss ratio, as determined in the prerequisite test (a short trial). The loss ratio shall be measured and recorded every 5 minutes during the test (it may be sufficient to collect lost frame counts and divide by the number of frames sent in 5 minutes to see if a threshold has been crossed, and accept some small inaccuracy in the threshold evaluation, not the result). The default loss ratio is X = 0% and loss ratio > 10^-7% is the default threshold to terminate the test early (or inform the test operator of the failure status).
Note: Other values of X and loss threshold can be tested if required by the user.
Expected Result:
Metrics Collected:
The following are the metrics collected for this test:
- The packet delay variation value for traffic passing through the DUT.
- The RFC5481 PDV form of delay variation on the traffic flow, using the 99th percentile, for each 300s interval during the test.
- CPU and memory utilization may also be collected as part of this test, to determine the vSwitch’s performance footprint on the system.
The general aim of these tests is to understand the impact of large flow table size and flow lookups on throughput. The following list is not exhaustive but should indicate the type of tests that should be required. It is expected that more will be added.
Title: RFC 2544 0% loss Flow Scalability throughput test
Prerequisite Test: LTD.Throughput.RFC2544.PacketLossRatio, IF the delta Throughput between the single-flow RFC2544 test and this test with a variable number of flows is desired.
Priority:
Description:
The aim of this test is to measure how throughput changes as the number of flows in the DUT increases. The test will measure the throughput through the fastpath, as such the flows need to be installed on the DUT before passing traffic.
For each frame size previously defined under Default Test Parameters and for each of the following number of flows:
- 1,000
- 2,000
- 4,000
- 8,000
- 16,000
- 32,000
- 64,000
- Max supported number of flows.
This test will be conducted under two conditions following the establishment of all flows as required by RFC 2544, regarding the flow expiration time-out:
- The time-out never expires during each trial.
2) The time-out expires for all flows periodically. This would require a short time-out compared with flow re-appearance for a small number of flows, and may not be possible for all flow conditions.
The maximum 0% packet loss Throughput should be determined in a manner identical to LTD.Throughput.RFC2544.PacketLossRatio.
Expected Result:
Metrics Collected:
The following are the metrics collected for this test:
- The maximum number of frames per second that can be forwarded at the specified number of flows and the specified frame size, with zero packet loss.
Title: RFC 2544 0% loss Memory Bandwidth Scalability test
Prerequisite Tests: LTD.Throughput.RFC2544.PacketLossRatio, IF the delta Throughput between an undisturbed RFC2544 test and this test with the Throughput affected by cache and memory bandwidth contention is desired.
Priority:
Description:
The aim of this test is to understand how the DUT’s performance is affected by cache sharing and memory bandwidth between processes.
During the test all cores not used by the vSwitch should be running a memory intensive application. This application should read and write random data to random addresses in unused physical memory. The random nature of the data and addresses is intended to consume cache, exercise main memory access (as opposed to cache) and exercise all memory buses equally. Furthermore:
- the ratio of reads to writes should be recorded. A ratio of 1:1 SHOULD be used.
- the reads and writes MUST be of cache-line size and be cache-line aligned.
- in NUMA architectures memory access SHOULD be local to the core’s node. Whether only local memory or a mix of local and remote memory is used MUST be recorded.
- the memory bandwidth (reads plus writes) used per-core MUST be recorded; the test MUST be run with a per-core memory bandwidth equal to half the maximum system memory bandwidth divided by the number of cores. The test MAY be run with other values for the per-core memory bandwidth.
- the test MAY also be run with the memory intensive application running on all cores.
Under these conditions the DUT’s 0% packet loss throughput is determined as per LTD.Throughput.RFC2544.PacketLossRatio.
Expected Result:
Metrics Collected:
The following are the metrics collected for this test:
- The DUT’s 0% packet loss throughput in the presence of cache sharing and memory bandwidth between processes.
- Title: VNF Scalability RFC 2544 X% packet loss ratio Throughput and
- Latency Test
Prerequisite Test: N/A
Priority:
Description:
This test determines the DUT’s throughput rate with X% traffic loss for a constant load (fixed length frames at a fixed interval time) when the number of VNFs on the DUT increases. The default loss percentages to be tested are: - X = 0% - X = 10^-7% . The minimum number of VNFs to be tested are 3.
Flow classification should be conducted with L2, L3 and L4 matching to understand the matching and scaling capability of the vSwitch. The matching fields which were used as part of the test should be reported as part of the benchmark report.
The vSwitch is responsible for forwarding frames between the VNFs
The SUT (vSwitch and VNF daisy chain) operation should be validated before running the test. This may be completed by running a burst or continuous stream of traffic through the SUT to ensure proper operation before a test.
Note: The traffic rate used to validate SUT operation should be low enough not to stress the SUT.
Note: Other values can be tested if required by the user.
Note: The same VNF should be used in the “daisy chain” formation. Each addition of a VNF should be conducted in a new test setup (The DUT is brought down, then the DUT is brought up again). An atlernative approach would be to continue to add VNFs without bringing down the DUT. The approach used needs to be documented as part of the test report.
The selected frame sizes are those previously defined under Default Test Parameters. The test can also be used to determine the average latency of the traffic.
Under the RFC2544 test methodology, the test duration will include a number of trials; each trial should run for a minimum period of 60 seconds. A binary search methodology must be applied for each trial to obtain the final result for Throughput.
Expected Result: At the end of each trial, the presence or absence of loss determines the modification of offered load for the next trial, converging on a maximum rate, or RFC2544 Throughput with X% loss. The Throughput load is re-used in related RFC2544 tests and other tests.
If the test VNFs are rather light-weight in terms of processing, the test provides a view of multiple passes through the vswitch on logical interfaces. In other words, the test produces an optimistic count of daisy-chained VNFs, but the cumulative effect of traffic on the vSwitch is “real” (assuming that the vSwitch has some dedicated resources, and the effects on shared resources is understood).
Metrics Collected: The following are the metrics collected for this test:
- The maximum Throughput in Frames Per Second (FPS) and Mbps of the DUT for each frame size with X% packet loss.
- The average latency of the traffic flow when passing through the DUT and VNFs (if testing for latency, note that this average is different from the test specified in Section 26.3 of RFC2544).
- CPU and memory utilization may also be collected as part of this test, to determine the vSwitch’s performance footprint on the system.
Title: VNF Scalability RFC 2544 Throughput and Latency Profile
Prerequisite Test: N/A
Priority:
Description:
This test reveals how throughput and latency degrades as the number of VNFs increases and offered rate varies in the region of the DUT’s maximum forwarding rate as determined by LTD.Throughput.RFC2544.PacketLossRatio (0% Packet Loss). For example it can be used to determine if the degradation of throughput and latency as the number of VNFs and offered rate increases is slow and graceful, or sudden and severe. The minimum number of VNFs to be tested is 3.
The selected frame sizes are those previously defined under Default Test Parameters.
The offered traffic rate is described as a percentage delta with respect to the DUT’s RFC 2544 Throughput as determined by LTD.Throughput.RFC2544.PacketLoss Ratio (0% Packet Loss case). A delta of 0% is equivalent to an offered traffic rate equal to the RFC 2544 Throughput; A delta of +50% indicates an offered rate half-way between the Throughput and line-rate, whereas a delta of -50% indicates an offered rate of half the maximum rate. Therefore the range of the delta figure is natuarlly bounded at -100% (zero offered traffic) and +100% (traffic offered at line rate).
The following deltas to the maximum forwarding rate should be applied:
- -50%, -10%, 0%, +10% & +50%
Note: Other values can be tested if required by the user.
Note: The same VNF should be used in the “daisy chain” formation. Each addition of a VNF should be conducted in a new test setup (The DUT is brought down, then the DUT is brought up again). An atlernative approach would be to continue to add VNFs without bringing down the DUT. The approach used needs to be documented as part of the test report.
Flow classification should be conducted with L2, L3 and L4 matching to understand the matching and scaling capability of the vSwitch. The matching fields which were used as part of the test should be reported as part of the benchmark report.
The SUT (vSwitch and VNF daisy chain) operation should be validated before running the test. This may be completed by running a burst or continuous stream of traffic through the SUT to ensure proper operation before a test.
Note: the traffic rate used to validate SUT operation should be low enough not to stress the SUT
Expected Result: For each packet size a profile should be produced of how throughput and latency vary with offered rate.
Metrics Collected:
The following are the metrics collected for this test:
- The forwarding rate in Frames Per Second (FPS) and Mbps of the DUT for each delta to the maximum forwarding rate and for each frame size.
- The average latency for each delta to the maximum forwarding rate and for each frame size.
- CPU and memory utilization may also be collected as part of this test, to determine the vSwitch’s performance footprint on the system.
- Any failures experienced (for example if the vSwitch crashes, stops processing packets, restarts or becomes unresponsive to commands) when the offered load is above Maximum Throughput MUST be recorded and reported with the results.
The general aim of these tests is to understand the capacity of the and speed with which the vswitch can accommodate new flows.
Title: RFC2889 Address Caching Capacity Test
Prerequisite Test: N/A
Priority:
Description:
Please note this test is only applicable to virtual switches that are capable of MAC learning. The aim of this test is to determine the address caching capacity of the DUT for a constant load (fixed length frames at a fixed interval time). The selected frame sizes are those previously defined under Default Test Parameters.
In order to run this test the aging time, that is the maximum time the DUT will keep a learned address in its flow table, and a set of initial addresses, whose value should be >= 1 and <= the max number supported by the implementation must be known. Please note that if the aging time is configurable it must be longer than the time necessary to produce frames from the external source at the specified rate. If the aging time is fixed the frame rate must be brought down to a value that the external source can produce in a time that is less than the aging time.
Learning Frames should be sent from an external source to the DUT to install a number of flows. The Learning Frames must have a fixed destination address and must vary the source address of the frames. The DUT should install flows in its flow table based on the varying source addresses. Frames should then be transmitted from an external source at a suitable frame rate to see if the DUT has properly learned all of the addresses. If there is no frame loss and no flooding, the number of addresses sent to the DUT should be increased and the test is repeated until the max number of cached addresses supported by the DUT determined.
Expected Result:
Metrics collected:
The following are the metrics collected for this test:
- Number of cached addresses supported by the DUT.
- CPU and memory utilization may also be collected as part of this test, to determine the vSwitch’s performance footprint on the system.
Deployment scenario:
- Physical → virtual switch → 2 x physical (one receiving, one listening).
Title: RFC2889 Address Learning Rate Test
Prerequisite Test: LTD.Memory.RFC2889.AddressCachingCapacity
Priority:
Description:
Please note this test is only applicable to virtual switches that are capable of MAC learning. The aim of this test is to determine the rate of address learning of the DUT for a constant load (fixed length frames at a fixed interval time). The selected frame sizes are those previously defined under Default Test Parameters, traffic should be sent with each IPv4/IPv6 address incremented by one. The rate at which the DUT learns a new address should be measured. The maximum caching capacity from LTD.Memory.RFC2889.AddressCachingCapacity should be taken into consideration as the maximum number of addresses for which the learning rate can be obtained.
Expected Result: It may be worthwhile to report the behaviour when operating beyond address capacity - some DUTs may be more friendly to new addresses than others.
Metrics collected:
The following are the metrics collected for this test:
- The address learning rate of the DUT.
Deployment scenario:
- Physical → virtual switch → 2 x physical (one receiving, one listening).
The following tests aim to determine how tightly coupled the datapath and the control path are within a virtual switch. The following list is not exhaustive but should indicate the type of tests that should be required. It is expected that more will be added.
Title: Control Path and Datapath Coupling
Prerequisite Test:
Priority:
Description:
The aim of this test is to understand how exercising the DUT’s control path affects datapath performance.
Initially a certain number of flow table entries are installed in the vSwitch. Then over the duration of an RFC2544 throughput test flow-entries are added and removed at the rates specified below. No traffic is ‘hitting’ these flow-entries, they are simply added and removed.
The test MUST be repeated with the following initial number of flow-entries installed: - < 10 - 1000 - 100,000 - 10,000,000 (or the maximum supported number of flow-entries)
The test MUST be repeated with the following rates of flow-entry addition and deletion per second: - 0 - 1 (i.e. 1 addition plus 1 deletion) - 100 - 10,000
Expected Result:
Metrics Collected:
The following are the metrics collected for this test:
- The maximum forwarding rate in Frames Per Second (FPS) and Mbps of the DUT.
- The average latency of the traffic flow when passing through the DUT (if testing for latency, note that this average is different from the test specified in Section 26.3 of RFC2544).
- CPU and memory utilization may also be collected as part of this test, to determine the vSwitch’s performance footprint on the system.
Deployment scenario:
- Physical → virtual switch → physical.
The following tests will profile a virtual switch’s CPU and memory utilization under various loads and circumstances. The following list is not exhaustive but should indicate the type of tests that should be required. It is expected that more will be added.
Title: RFC 2544 0% Loss CPU OR Memory Stress Test
Prerequisite Test:
Priority:
Description:
The aim of this test is to understand the overall performance of the system when a CPU or Memory intensive application is run on the same DUT as the Virtual Switch. For each frame size, an LTD.Throughput.RFC2544.PacketLossRatio (0% Packet Loss) test should be performed. Throughout the entire test a CPU or Memory intensive application should be run on all cores on the system not in use by the Virtual Switch. For NUMA system only cores on the same NUMA node are loaded.
It is recommended that stress-ng be used for loading the non-Virtual Switch cores but any stress tool MAY be used.
Expected Result:
Metrics Collected:
The following are the metrics collected for this test:
- Memory and CPU utilization of the cores running the Virtual Switch.
- The number of identity of the cores allocated to the Virtual Switch.
- The configuration of the stress tool (for example the command line parameters used to start it.)
- Note: Stress in the test ID can be replaced with the name of the
- component being stressed, when reporting the results: LTD.CPU.RFC2544.0PacketLoss or LTD.Memory.RFC2544.0PacketLoss
- Test ID: LTD.Throughput.RFC2544.PacketLossRatio
- Test ID: LTD.Throughput.RFC2544.PacketLossRatioFrameModification
- Test ID: LTD.Throughput.RFC2544.Profile
- Test ID: LTD.Throughput.RFC2544.SystemRecoveryTime
- Test ID: LTD.Throughput.RFC2544.BackToBackFrames
- Test ID: LTD.Throughput.RFC2889.Soak
- Test ID: LTD.Throughput.RFC2889.SoakFrameModification
- Test ID: LTD.Throughput.RFC6201.ResetTime
- Test ID: LTD.Throughput.RFC2889.MaxForwardingRate
- Test ID: LTD.Throughput.RFC2889.ForwardPressure
- Test ID: LTD.Throughput.RFC2889.ErrorFramesFiltering
- Test ID: LTD.Throughput.RFC2889.BroadcastFrameForwarding
- Test ID: LTD.Throughput.RFC2544.WorstN-BestN
- Test ID: LTD.Throughput.Overlay.Network.<tech>.RFC2544.PacketLossRatio
- Test ID: LTD.PacketLatency.InitialPacketProcessingLatency
- Test ID: LTD.PacketDelayVariation.RFC3393.Soak
- Test ID: LTD.Scalability.Flows.RFC2544.0PacketLoss
- Test ID: LTD.MemoryBandwidth.RFC2544.0PacketLoss.Scalability
- LTD.Scalability.VNF.RFC2544.PacketLossProfile
- LTD.Scalability.VNF.RFC2544.PacketLossRatio
- Test ID: LTD.Activation.RFC2889.AddressCachingCapacity
- Test ID: LTD.Activation.RFC2889.AddressLearningRate
- Test ID: LTD.CPDPCouplingFlowAddition
- Test ID: LTD.Stress.RFC2544.0PacketLoss
The objective of the OPNFV project titled Characterize vSwitch Performance for Telco NFV Use Cases, is to evaluate the performance of virtual switches to identify its suitability for a Telco Network Function Virtualization (NFV) environment. The intention of this Level Test Plan (LTP) document is to specify the scope, approach, resources, and schedule of the virtual switch performance benchmarking activities in OPNFV. The test cases will be identified in a separate document called the Level Test Design (LTD) document.
This document is currently in draft form.
The document id will be used to uniquely identify versions of the LTP. The format for the document id will be: OPNFV_vswitchperf_LTP_REL_STATUS, where by the status is one of: draft, reviewed, corrected or final. The document id for this version of the LTP is: OPNFV_vswitchperf_LTP_Colorado_REVIEWED.
The main purpose of this project is to specify a suite of performance tests in order to objectively measure the current packet transfer characteristics of a virtual switch in the NFVI. The intent of the project is to facilitate the performance testing of any virtual switch. Thus, a generic suite of tests shall be developed, with no hard dependencies to a single implementation. In addition, the test case suite shall be architecture independent.
The test cases developed in this project shall not form part of a separate test framework, all of these tests may be inserted into the Continuous Integration Test Framework and/or the Platform Functionality Test Framework - if a vSwitch becomes a standard component of an OPNFV release.
The level of testing conducted by vswitchperf in the overall testing sequence (among all the testing projects in OPNFV) is the performance benchmarking of a specific component (the vswitch) in the OPNFV platfrom. It’s expected that this testing will follow on from the functional and integration testing conducted by other testing projects in OPNFV, namely Functest and Yardstick.
A benchmark is defined by the IETF as: A standardized test that serves as a basis for performance evaluation and comparison. It’s important to note that benchmarks are not Functional tests. They do not provide PASS/FAIL criteria, and most importantly ARE NOT performed on live networks, or performed with live network traffic.
In order to determine the packet transfer characteristics of a virtual switch, the benchmarking tests will be broken down into the following categories:
Note: some of the tests above can be conducted simultaneously where the combined results would be insightful, for example Packet/Frame Delay and Scalability.
This section describes the following items: * Test items and their identifiers (TestItems) * Test Traceability Matrix (TestMatrix) * Features to be tested (FeaturesToBeTested) * Features not to be tested (FeaturesNotToBeTested) * Approach (Approach) * Item pass/fail criteria (PassFailCriteria) * Suspension criteria and resumption requirements (SuspensionResumptionReqs)
The test item/application vsperf is trying to test are virtual switches and in particular their performance in an nfv environment. vsperf will first try to measure the maximum achievable performance by a virtual switch and then it will focus in on usecases that are as close to real life deployment scenarios as possible.
vswitchperf leverages the “3x3” matrix (introduced in https://tools.ietf.org/html/draft-ietf-bmwg-virtual-net-02) to achieve test traceability. The matrix was expanded to 3x4 to accommodate scale metrics when displaying the coverage of many metrics/benchmarks). Test case covreage in the LTD is tracked using the following catagories:
| SPEED | ACCURACY | RELIABILITY | SCALE | |
| Activation | X | X | X | X |
| Operation | X | X | X | X |
| De-activation |
X = denotes a test catagory that has 1 or more test cases defined.
Characterizing virtual switches (i.e. Device Under Test (DUT) in this document) includes measuring the following performance metrics:
vsperf doesn’t intend to define or perform any functional tests. The aim is to focus on performance.
The testing approach adoped by the vswitchperf project is black box testing, meaning the test inputs can be generated and the outputs captured and completely evaluated from the outside of the System Under Test. Some metrics can be collected on the SUT, such as cpu or memory utilization if the collection has no/minimal impact on benchmark. This section will look at the deployment scenarios and the general methodology used by vswitchperf. In addition, this section will also specify the details of the Test Report that must be collected for each of the test cases.
The following represents possible deployment test scenarios which can help to determine the performance of both the virtual switch and the datapaths to physical ports (to NICs) and to logical ports (to VNFs):
_
+--------------------------------------------------+ |
| +--------------------+ | |
| | | | |
| | v | | Host
| +--------------+ +--------------+ | |
| | phy port | vSwitch | phy port | | |
+---+--------------+------------+--------------+---+ _|
^ :
| |
: v
+--------------------------------------------------+
| |
| traffic generator |
| |
+--------------------------------------------------+
_
+---------------------------------------------------+ |
| | |
| +-------------------------------------------+ | |
| | Application | | |
| +-------------------------------------------+ | |
| ^ : | |
| | | | | Guest
| : v | |
| +---------------+ +---------------+ | |
| | logical port 0| | logical port 1| | |
+---+---------------+-----------+---------------+---+ _|
^ :
| |
: v _
+---+---------------+----------+---------------+---+ |
| | logical port 0| | logical port 1| | |
| +---------------+ +---------------+ | |
| ^ : | |
| | | | | Host
| : v | |
| +--------------+ +--------------+ | |
| | phy port | vSwitch | phy port | | |
+---+--------------+------------+--------------+---+ _|
^ :
| |
: v
+--------------------------------------------------+
| |
| traffic generator |
| |
+--------------------------------------------------+
_
+----------------------+ +----------------------+ |
| Guest 1 | | Guest 2 | |
| +---------------+ | | +---------------+ | |
| | Application | | | | Application | | |
| +---------------+ | | +---------------+ | |
| ^ | | | ^ | | |
| | v | | | v | | Guests
| +---------------+ | | +---------------+ | |
| | logical ports | | | | logical ports | | |
| | 0 1 | | | | 0 1 | | |
+---+---------------+--+ +---+---------------+--+ _|
^ : ^ :
| | | |
: v : v _
+---+---------------+---------+---------------+--+ |
| | 0 1 | | 3 4 | | |
| | logical ports | | logical ports | | |
| +---------------+ +---------------+ | |
| ^ | ^ | | | Host
| | L-----------------+ v | |
| +--------------+ +--------------+ | |
| | phy ports | vSwitch | phy ports | | |
+---+--------------+----------+--------------+---+ _|
^ ^ : :
| | | |
: : v v
+--------------------------------------------------+
| |
| traffic generator |
| |
+--------------------------------------------------+
_
+----------------------+ +----------------------+ |
| Guest 1 | | Guest 2 | |
|+-------------------+ | | +-------------------+| |
|| Application | | | | Application || |
|+-------------------+ | | +-------------------+| |
| ^ | | | ^ | | | Guests
| | v | | | v | |
|+-------------------+ | | +-------------------+| |
|| logical ports | | | | logical ports || |
|| 0 1 | | | | 0 1 || |
++--------------------++ ++--------------------++ _|
^ : ^ :
(PCI passthrough) | | (PCI passthrough)
| v : | _
+--------++------------+-+------------++---------+ |
| | || 0 | | 1 || | | |
| | ||logical port| |logical port|| | | |
| | |+------------+ +------------+| | | |
| | | | ^ | | | |
| | | L-----------------+ | | | |
| | | | | | | Host
| | | vSwitch | | | |
| | +-----------------------------+ | | |
| | | | |
| | v | |
| +--------------+ +--------------+ | |
| | phy port/VF | | phy port/VF | | |
+-+--------------+--------------+--------------+-+ _|
^ :
| |
: v
+--------------------------------------------------+
| |
| traffic generator |
| |
+--------------------------------------------------+
_
+---------------------------------------------------+ |
| | |
| +-------------------------------------------+ | |
| | Application | | |
| +-------------------------------------------+ | |
| ^ | |
| | | | Guest
| : | |
| +---------------+ | |
| | logical port 0| | |
+---+---------------+-------------------------------+ _|
^
|
: _
+---+---------------+------------------------------+ |
| | logical port 0| | |
| +---------------+ | |
| ^ | |
| | | | Host
| : | |
| +--------------+ | |
| | phy port | vSwitch | |
+---+--------------+------------ -------------- ---+ _|
^
|
:
+--------------------------------------------------+
| |
| traffic generator |
| |
+--------------------------------------------------+
_
+---------------------------------------------------+ |
| | |
| +-------------------------------------------+ | |
| | Application | | |
| +-------------------------------------------+ | |
| : | |
| | | | Guest
| v | |
| +---------------+ | |
| | logical port | | |
+-------------------------------+---------------+---+ _|
:
|
v _
+------------------------------+---------------+---+ |
| | logical port | | |
| +---------------+ | |
| : | |
| | | | Host
| v | |
| +--------------+ | |
| vSwitch | phy port | | |
+-------------------------------+--------------+---+ _|
:
|
v
+--------------------------------------------------+
| |
| traffic generator |
| |
+--------------------------------------------------+
_
+-------------------------+ +-------------------------+ |
| Guest 1 | | Guest 2 | |
| +-----------------+ | | +-----------------+ | |
| | Application | | | | Application | | |
| +-----------------+ | | +-----------------+ | |
| : | | ^ | |
| | | | | | | Guest
| v | | : | |
| +---------------+ | | +---------------+ | |
| | logical port 0| | | | logical port 0| | |
+-----+---------------+---+ +---+---------------+-----+ _|
: ^
| |
v : _
+----+---------------+------------+---------------+-----+ |
| | port 0 | | port 1 | | |
| +---------------+ +---------------+ | |
| : ^ | |
| | | | | Host
| +--------------------+ | |
| | |
| vswitch | |
+-------------------------------------------------------+ _|
HOST 1(Physical port → virtual switch → VNF → virtual switch → Physical port) → HOST 2(Physical port → virtual switch → VNF → virtual switch → Physical port)
_
+----------------------+ +----------------------+ |
| Guest 1 | | Guest 2 | |
| +---------------+ | | +---------------+ | |
| | Application | | | | Application | | |
| +---------------+ | | +---------------+ | |
| ^ | | | ^ | | |
| | v | | | v | | Guests
| +---------------+ | | +---------------+ | |
| | logical ports | | | | logical ports | | |
| | 0 1 | | | | 0 1 | | |
+---+---------------+--+ +---+---------------+--+ _|
^ : ^ :
| | | |
: v : v _
+---+---------------+--+ +---+---------------+--+ |
| | 0 1 | | | | 3 4 | | |
| | logical ports | | | | logical ports | | |
| +---------------+ | | +---------------+ | |
| ^ | | | ^ | | | Hosts
| | v | | | v | |
| +--------------+ | | +--------------+ | |
| | phy ports | | | | phy ports | | |
+---+--------------+---+ +---+--------------+---+ _|
^ : : :
| +-----------------+ |
: v
+--------------------------------------------------+
| |
| traffic generator |
| |
+--------------------------------------------------+
Note: For tests where the traffic generator and/or measurement receiver are implemented on VM and connected to the virtual switch through vNIC, the issues of shared resources and interactions between the measurement devices and the device under test must be considered.
Note: Some RFC 2889 tests require a full-mesh sending and receiving pattern involving more than two ports. This possibility is illustrated in the Physical port → vSwitch → VNF → vSwitch → VNF → vSwitch → physical port diagram above (with 2 sending and 2 receiving ports, though all ports could be used bi-directionally).
Note: When Deployment Scenarios are used in RFC 2889 address learning or cache capacity testing, an additional port from the vSwitch must be connected to the test device. This port is used to listen for flooded frames.
To establish the baseline performance of the virtual switch, tests would initially be run with a simple workload in the VNF (the recommended simple workload VNF would be DPDK‘s testpmd application forwarding packets in a VM or vloop_vnf a simple kernel module that forwards traffic between two network interfaces inside the virtualized environment while bypassing the networking stack). Subsequently, the tests would also be executed with a real Telco workload running in the VNF, which would exercise the virtual switch in the context of higher level Telco NFV use cases, and prove that its underlying characteristics and behaviour can be measured and validated. Suitable real Telco workload VNFs are yet to be identified.
The following list identifies the default parameters for suite of tests:
Tests MUST have these parameters unless otherwise stated. Test cases with non default parameters will be stated explicitly.
Note: For throughput tests unless stated otherwise, test configurations should ensure that traffic traverses the installed flows through the virtual switch, i.e. flows are installed and have an appropriate time out that doesn’t expire before packet transmission starts.
Virtual switches classify packets into flows by processing and matching particular header fields in the packet/frame and/or the input port where the packets/frames arrived. The vSwitch then carries out an action on the group of packets that match the classification parameters. Thus a flow is considered to be a sequence of packets that have a shared set of header field values or have arrived on the same port and have the same action applied to them. Performance results can vary based on the parameters the vSwitch uses to match for a flow. The recommended flow classification parameters for L3 vSwitch performance tests are: the input port, the source IP address, the destination IP address and the Ethernet protocol type field. It is essential to increase the flow time-out time on a vSwitch before conducting any performance tests that do not measure the flow set-up time. Normally the first packet of a particular flow will install the flow in the vSwitch which adds an additional latency, subsequent packets of the same flow are not subject to this latency if the flow is already installed on the vSwitch.
Tests will be assigned a priority in order to determine which tests should be implemented immediately and which tests implementations can be deferred.
Priority can be of following types: - Urgent: Must be implemented immediately. - High: Must be implemented in the next release. - Medium: May be implemented after the release. - Low: May or may not be implemented at all.
The SUT should be configured to its “default” state. The SUT’s configuration or set-up must not change between tests in any way other than what is required to do the test. All supported protocols must be configured and enabled for each test set up.
The DUT should be configured with n ports where n is a multiple of 2. Half of the ports on the DUT should be used as ingress ports and the other half of the ports on the DUT should be used as egress ports. Where a DUT has more than 2 ports, the ingress data streams should be set-up so that they transmit packets to the egress ports in sequence so that there is an even distribution of traffic across ports. For example, if a DUT has 4 ports 0(ingress), 1(ingress), 2(egress) and 3(egress), the traffic stream directed at port 0 should output a packet to port 2 followed by a packet to port 3. The traffic stream directed at port 1 should also output a packet to port 2 followed by a packet to port 3.
Frame formats Layer 2 (data link layer) protocols
+---------------------------+-----------+
| Ethernet Header | Payload | Check Sum |
+-----------------+---------+-----------+
|_________________|_________|___________|
14 Bytes 46 - 1500 4 Bytes
Bytes
Layer 3 (network layer) protocols
+-----------------+-----------+---------+-----------+
| Ethernet Header | IP Header | Payload | Checksum |
+-----------------+-----------+---------+-----------+
|_________________|___________|_________|___________|
14 Bytes 20 bytes 26 - 1480 4 Bytes
Bytes
+-----------------+-----------+---------+-----------+
| Ethernet Header | IP Header | Payload | Checksum |
+-----------------+-----------+---------+-----------+
|_________________|___________|_________|___________|
14 Bytes 40 bytes 26 - 1460 4 Bytes
Bytes
Layer 4 (transport layer) protocols
- TCP
- UDP
- SCTP
+-----------------+-----------+-----------------+---------+-----------+
| Ethernet Header | IP Header | Layer 4 Header | Payload | Checksum |
+-----------------+-----------+-----------------+---------+-----------+
|_________________|___________|_________________|_________|___________|
14 Bytes 40 bytes 20 Bytes 6 - 1460 4 Bytes
Bytes
Layer 5 (application layer) protocols
- RTP
- GTP
+-----------------+-----------+-----------------+---------+-----------+
| Ethernet Header | IP Header | Layer 4 Header | Payload | Checksum |
+-----------------+-----------+-----------------+---------+-----------+
|_________________|___________|_________________|_________|___________|
14 Bytes 20 bytes 20 Bytes >= 6 Bytes 4 Bytes
There is a difference between an Ethernet frame, an IP packet, and a UDP datagram. In the seven-layer OSI model of computer networking, packet refers to a data unit at layer 3 (network layer). The correct term for a data unit at layer 2 (data link layer) is a frame, and at layer 4 (transport layer) is a segment or datagram.
Important concepts related to 10GbE performance are frame rate and throughput. The MAC bit rate of 10GbE, defined in the IEEE standard 802 .3ae, is 10 billion bits per second. Frame rate is based on the bit rate and frame format definitions. Throughput, defined in IETF RFC 1242, is the highest rate at which the system under test can forward the offered load, without loss.
The frame rate for 10GbE is determined by a formula that divides the 10 billion bits per second by the preamble + frame length + inter-frame gap.
The maximum frame rate is calculated using the minimum values of the following parameters, as described in the IEEE 802 .3ae standard:
Therefore, Maximum Frame Rate (64B Frames) = MAC Transmit Bit Rate / (Preamble + Frame Length + Inter-frame Gap) = 10,000,000,000 / (64 + 512 + 96) = 10,000,000,000 / 672 = 14,880,952.38 frame per second (fps)
The starting point for defining the suite of tests for benchmarking the performance of a virtual switch is to take existing RFCs and standards that were designed to test their physical counterparts and adapting them for testing virtual switches. The rationale behind this is to establish a fair comparison between the performance of virtual and physical switches. This section outlines the RFCs that are used by this specification.
Devices RFC 1242 defines the terminology that is used in describing performance benchmarking tests and their results. Definitions and discussions covered include: Back-to-back, bridge, bridge/router, constant load, data link frame size, frame loss rate, inter frame gap, latency, and many more.
RFC 2544 outlines a benchmarking methodology for network Interconnect Devices. The methodology results in performance metrics such as latency, frame loss percentage, and maximum data throughput.
In this document network “throughput” (measured in millions of frames per second) is based on RFC 2544, unless otherwise noted. Frame size refers to Ethernet frames ranging from smallest frames of 64 bytes to largest frames of 9K bytes.
Types of tests are:
Although not included in the defined RFC 2544 standard, another crucial measurement in Ethernet networking is packet delay variation. The definition set out by this specification comes from RFC5481.
RFC 2285 defines the terminology that is used to describe the terminology for benchmarking a LAN switching device. It extends RFC 1242 and defines: DUTs, SUTs, Traffic orientation and distribution, bursts, loads, forwarding rates, etc.
RFC 2889 outlines a benchmarking methodology for LAN switching, it extends RFC 2544. The outlined methodology gathers performance metrics for forwarding, congestion control, latency, address handling and finally filtering.
RFC 3918 outlines a methodology for IP Multicast benchmarking.
RFC 4737 describes metrics for identifying and counting re-ordered packets within a stream, and metrics to measure the extent each packet has been re-ordered.
RFC 5481 defined two common, but different forms of delay variation metrics, and compares the metrics over a range of networking circumstances and tasks. The most suitable form for vSwitch benchmarking is the “PDV” form.
RFC 6201 extends the methodology for characterizing the speed of recovery of the DUT from device or software reset described in RFC 2544.
vswitchperf does not specify Pass/Fail criteria for the tests in terms of a threshold, as benchmarks do not (and should not do this). The results/metrics for a test are simply reported. If it had to be defined, a test is considered to have passed if it succesfully completed and a relavent metric was recorded/reported for the SUT.
In the case of a throughput test, a test should be suspended if a virtual switch is failing to forward any traffic. A test should be restarted from a clean state if the intention is to carry out the test again.
Each test should produce a test report that details SUT information as well as the test results. There are a number of parameters related to the system, DUT and tests that can affect the repeatability of a test results and should be recorded. In order to minimise the variation in the results of a test, it is recommended that the test report includes the following information:
Note: Tests that require additional parameters to be recorded will explicitly specify this.
This section will detail the test activities that will be conducted by vsperf as well as the infrastructure that will be used to complete the tests in OPNFV.
A key consideration when conducting any sort of benchmark is trying to ensure the consistency and repeatability of test results between runs. When benchmarking the performance of a virtual switch there are many factors that can affect the consistency of results. This section describes these factors and the measures that can be taken to limit their effects. In addition, this section will outline some system tests to validate the platform and the VNF before conducting any vSwitch benchmarking tests.
System Isolation:
When conducting a benchmarking test on any SUT, it is essential to limit (and if reasonable, eliminate) any noise that may interfere with the accuracy of the metrics collected by the test. This noise may be introduced by other hardware or software (OS, other applications), and can result in significantly varying performance metrics being collected between consecutive runs of the same test. In the case of characterizing the performance of a virtual switch, there are a number of configuration parameters that can help increase the repeatability and stability of test results, including:
System Validation:
System validation is broken down into two sub-categories: Platform validation and VNF validation. The validation test itself involves verifying the forwarding capability and stability for the sub-system under test. The rationale behind system validation is two fold. Firstly to give a tester confidence in the stability of the platform or VNF that is being tested; and secondly to provide base performance comparison points to understand the overhead introduced by the virtual switch.
Benchmark platform forwarding capability: This is an OPTIONAL test used to verify the platform and measure the base performance (maximum forwarding rate in fps and latency) that can be achieved by the platform without a vSwitch or a VNF. The following diagram outlines the set-up for benchmarking Platform forwarding capability:
__
+--------------------------------------------------+ |
| +------------------------------------------+ | |
| | | | |
| | l2fw or DPDK L2FWD app | | Host
| | | | |
| +------------------------------------------+ | |
| | NIC | | |
+---+------------------------------------------+---+ __|
^ :
| |
: v
+--------------------------------------------------+
| |
| traffic generator |
| |
+--------------------------------------------------+
Benchmark VNF forwarding capability: This test is used to verify the VNF and measure the base performance (maximum forwarding rate in fps and latency) that can be achieved by the VNF without a vSwitch. The performance metrics collected by this test will serve as a key comparison point for NIC passthrough technologies and vSwitches. VNF in this context refers to the hypervisor and the VM. The following diagram outlines the set-up for benchmarking VNF forwarding capability:
__
+--------------------------------------------------+ |
| +------------------------------------------+ | |
| | | | |
| | VNF | | |
| | | | |
| +------------------------------------------+ | |
| | Passthrough/SR-IOV | | Host
| +------------------------------------------+ | |
| | NIC | | |
+---+------------------------------------------+---+ __|
^ :
| |
: v
+--------------------------------------------------+
| |
| traffic generator |
| |
+--------------------------------------------------+
Methodology to benchmark Platform/VNF forwarding capability
The recommended methodology for the platform/VNF validation and benchmark is: - Run RFC2889 Maximum Forwarding Rate test, this test will produce maximum forwarding rate and latency results that will serve as the expected values. These expected values can be used in subsequent steps or compared with in subsequent validation tests. - Transmit bidirectional traffic at line rate/max forwarding rate (whichever is higher) for at least 72 hours, measure throughput (fps) and latency. - Note: Traffic should be bidirectional. - Establish a baseline forwarding rate for what the platform can achieve. - Additional validation: After the test has completed for 72 hours run bidirectional traffic at the maximum forwarding rate once more to see if the system is still functional and measure throughput (fps) and latency. Compare the measure the new obtained values with the expected values.
NOTE 1: How the Platform is configured for its forwarding capability test (BIOS settings, GRUB configuration, runlevel...) is how the platform should be configured for every test after this
NOTE 2: How the VNF is configured for its forwarding capability test (# of vCPUs, vNICs, Memory, affinitization…) is how it should be configured for every test that uses a VNF after this.
Methodology to benchmark the VNF to vSwitch to VNF deployment scenario
vsperf has identified the following concerns when benchmarking the VNF to vSwitch to VNF deployment scenario:
The recommendation from vsperf is that tests for this sceanario must include an external HW traffic generator to act as the tester/traffic transmitter and receiver. The perscribed methodology to benchmark this deployment scanrio with an external tester involves the following three steps:
#. Determine the forwarding capability and latency through the virtual interface connected to the VNF/VM.
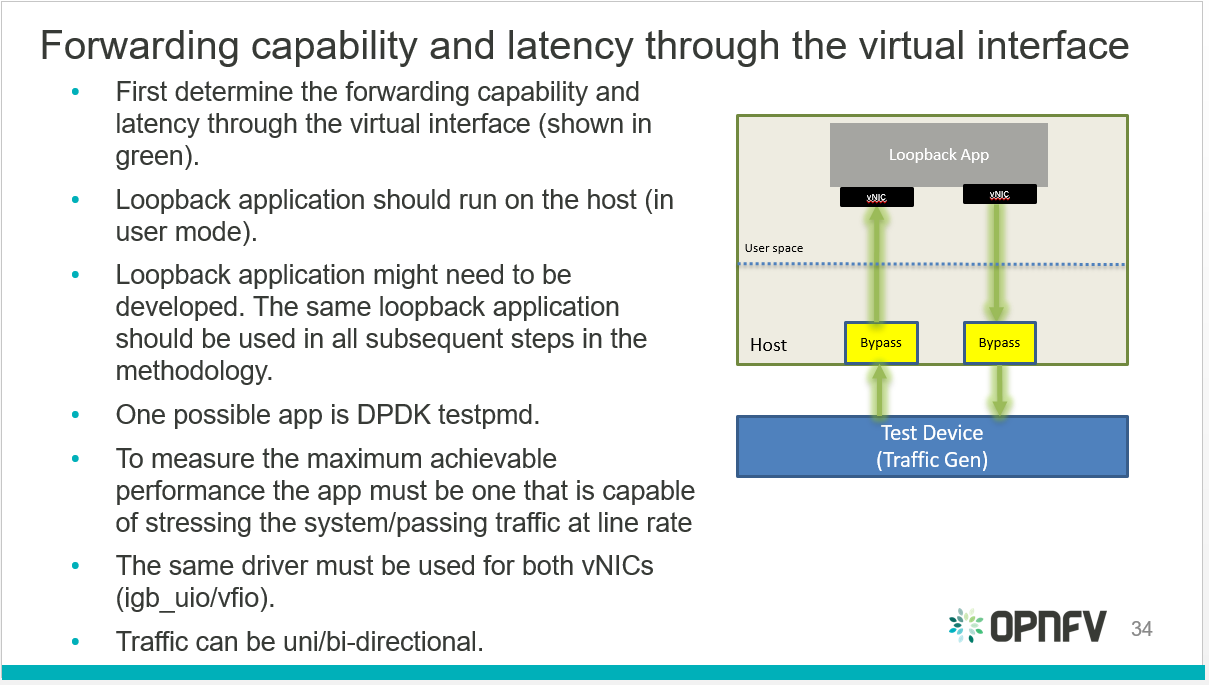
Virtual interfaces performance benchmark
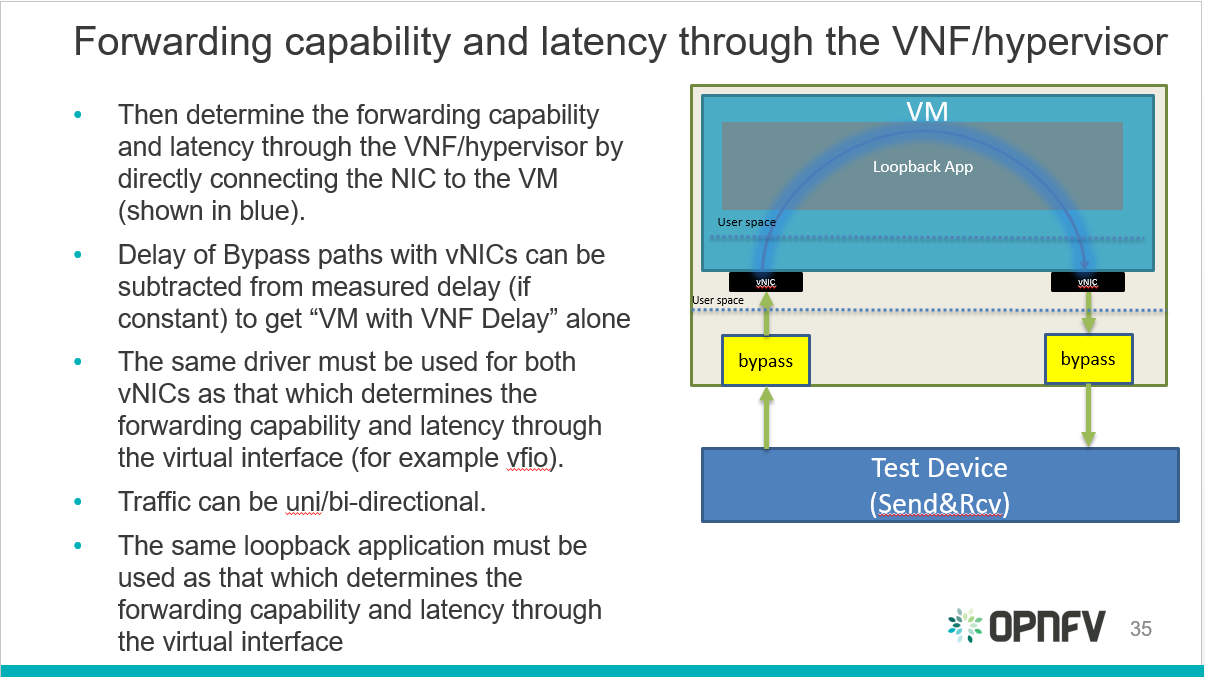
Hypervisor performance benchmark
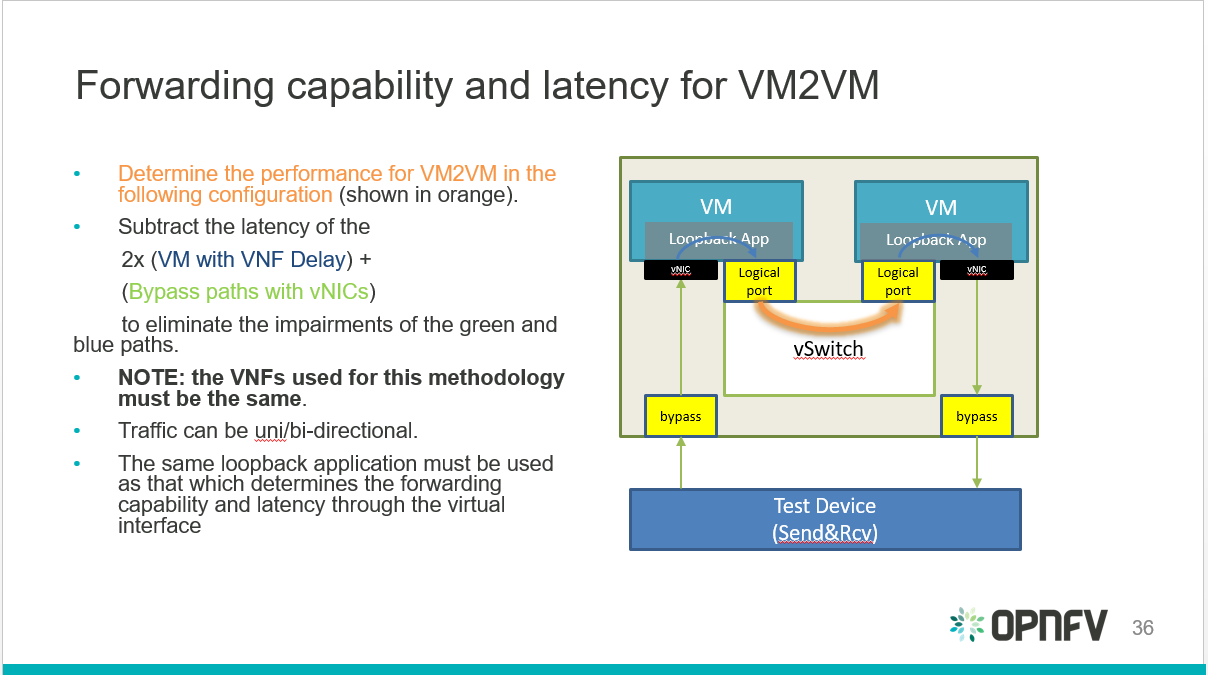
VNF to vSwitch to VNF performance benchmark
vsperf also identified an alternative configuration for the final step:
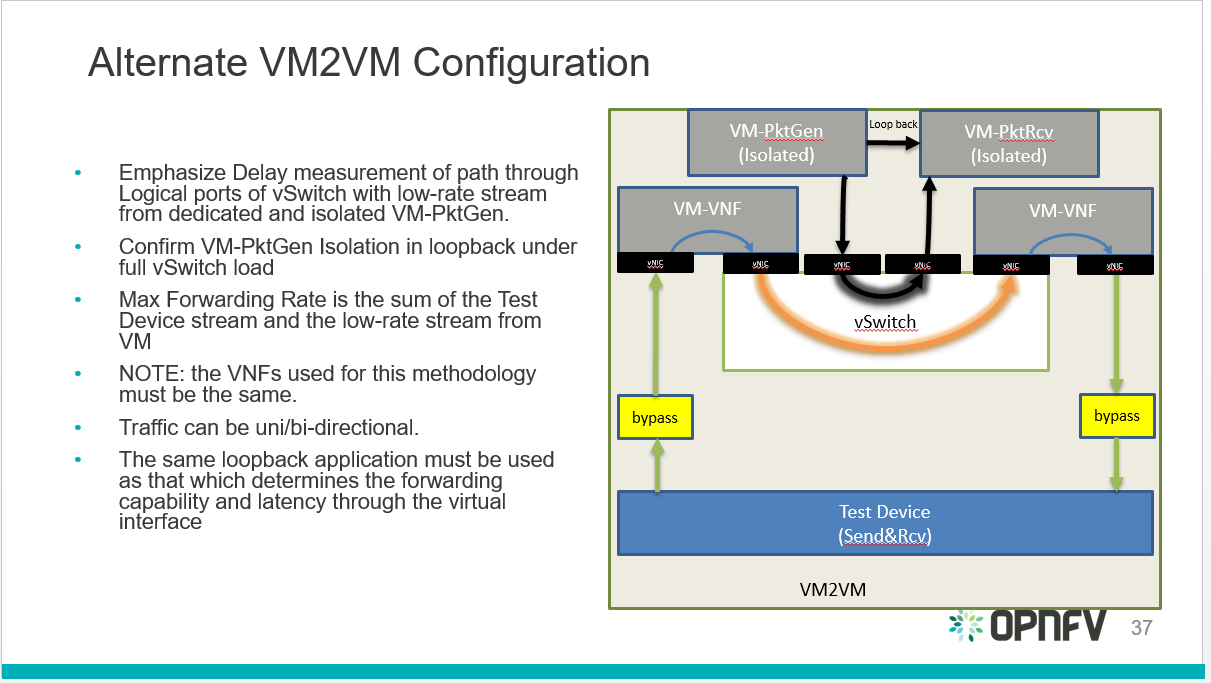
VNF to vSwitch to VNF alternative performance benchmark
VSPERF CI jobs are run using the OPNFV lab infrastructure as described by the ‘Pharos Project <https://www.opnfv.org/community/projects/pharos>`_ . A VSPERF POD is described here https://wiki.opnfv.org/display/pharos/VSPERF+in+Intel+Pharos+Lab+-+Pod+12
vsperf CI jobs are broken down into:
- Daily job:
- Runs everyday takes about 10 hours to complete.
- TESTCASES_DAILY=’phy2phy_tput back2back phy2phy_tput_mod_vlan phy2phy_scalability pvp_tput pvp_back2back pvvp_tput pvvp_back2back’.
- TESTPARAM_DAILY=’–test-params TRAFFICGEN_PKT_SIZES=(64,128,512,1024,1518)’.
- Merge job:
- Runs whenever patches are merged to master.
- Runs a basic Sanity test.
- Verify job:
- Runs every time a patch is pushed to gerrit.
- Builds documentation.
There are 2 scripts that are part of VSPERFs CI:
- build-vsperf.sh: Lives in the VSPERF repository in the ci/ directory and is used to run vsperf with the appropriate cli parameters.
- vswitchperf.yml: YAML description of our jenkins job. lives in the RELENG repository.
More info on vsperf CI can be found here: https://wiki.opnfv.org/display/vsperf/VSPERF+CI
The group responsible for managing, designing, preparing and executing the tests listed in the LTD are the vsperf committers and contributors. The vsperf committers and contributors should work with the relavent OPNFV projects to ensure that the infrastructure is in place for testing vswitches, and that the results are published to common end point (a results database).
The IETF Benchmarking Methodology Working Group (BMWG) was re-chartered in 2014 to include benchmarking for Virtualized Network Functions (VNFs) and their infrastructure. A version of the VSPERF test specification was summarized in an Internet Draft ... Benchmarking Virtual Switches in OPNFV and contributed to the BMWG. In June 2017 the Internet Engineering Steering Group of the IETF approved the most recent version of the draft for publication as a new test specification (RFC 8204).
CI Test cases run daily on the VSPERF Pharos POD for master and stable branches.
./results/scenario.rst ./results/results.rst
Yardstick is a project dealing with performance testing. Yardstick produces its own test cases but can also be considered as a framework to support feature project testing.
Yardstick developed a test API that can be used by any OPNFV project. Therefore there are many ways to contribute to Yardstick.
You can:
This developer guide describes how to interact with the Yardstick project. The first section details the main working areas of the project. The Second part is a list of “How to” to help you to join the Yardstick family whatever your field of interest is.
This guide is made for you. You can have a look at the user guide. There are also references on documentation, video tutorials, tips in the project wiki page. You can also directly contact us by mail with [Yardstick] prefix in the subject at opnfv-tech-discuss@lists.opnfv.org or on the IRC chan #opnfv-yardstick.
Yardstick can be considered as a framework. Yardstick is released as a docker file, including tools, scripts and a CLI to prepare the environement and run tests. It simplifies the integration of external test suites in CI pipelines and provides commodity tools to collect and display results.
Since Danube, test categories (also known as tiers) have been created to group similar tests, provide consistant sub-lists and at the end optimize test duration for CI (see How To section).
The definition of the tiers has been agreed by the testing working group.
The tiers are:
The installation and configuration of the Yardstick is described in the user guide.
Yardstick provides many sample test cases which are located at samples directory of repo.
Sample test cases are designed with the following goals:
Developers should upload their sample test cases as well when they are uploading a new patch which is about the Yardstick new test case or new feature.
OPNFV Release test cases are located at yardstick/tests/opnfv/test_cases.
These test cases are run by OPNFV CI jobs, which means these test cases should
be more mature than sample test cases.
OPNFV scenario owners can select related test cases and add them into the test
suites which represent their scenario.
This section will introduce the meaning of the Test case description file.
we will use ping.yaml as a example to show you how to understand the test case
description file.
This yaml file consists of two sections. One is scenarios, the other
is context.:
---
# Sample benchmark task config file
# measure network latency using ping
schema: "yardstick:task:0.1"
{% set provider = provider or none %}
{% set physical_network = physical_network or 'physnet1' %}
{% set segmentation_id = segmentation_id or none %}
scenarios:
-
type: Ping
options:
packetsize: 200
host: athena.demo
target: ares.demo
runner:
type: Duration
duration: 60
interval: 1
sla:
max_rtt: 10
action: monitor
context:
name: demo
image: yardstick-image
flavor: yardstick-flavor
user: ubuntu
placement_groups:
pgrp1:
policy: "availability"
servers:
athena:
floating_ip: true
placement: "pgrp1"
ares:
placement: "pgrp1"
networks:
test:
cidr: '10.0.1.0/24'
{% if provider == "vlan" %}
provider: {{provider}}
physical_network: {{physical_network}}
{% if segmentation_id %}
segmentation_id: {{segmentation_id}}
{% endif %}
{% endif %}
The contexts section is the description of pre-condition of testing. As
ping.yaml shows, you can configure the image, flavor, name, affinity and
network of Test VM (servers), with this section, you will get a pre-condition
env for Testing.
Yardstick will automatically setup the stack which are described in this
section.
Yardstick converts this section to heat template and sets up the VMs with
heat-client (Yardstick can also support to convert this section to Kubernetes
template to setup containers).
In the examples above, two Test VMs (athena and ares) are configured by
keyword servers.
flavor will determine how many vCPU, how much memory for test VMs.
As yardstick-flavor is a basic flavor which will be automatically created
when you run command yardstick env prepare. yardstick-flavor is
1 vCPU 1G RAM,3G Disk.
image is the image name of test VMs. If you use cirros.3.5.0, you need
fill the username of this image into user.
The policy of placement of Test VMs have two values (affinity and
availability). availability means anti-affinity.
In the network section, you can configure which provider network and
physical_network you want Test VMs to use.
You may need to configure segmentation_id when your network is vlan.
Moreover, you can configure your specific flavor as below, Yardstick will setup the stack for you.
flavor:
name: yardstick-new-flavor
vcpus: 12
ram: 1024
disk: 2
Besides default Heat context, Yardstick also allows you to setup two other
types of context. They are Node and Kubernetes.
context:
type: Kubernetes
name: k8s
and
context:
type: Node
name: LF
The scenarios section is the description of testing steps, you can
orchestrate the complex testing step through scenarios.
Each scenario will do one testing step.
In one scenario, you can configure the type of scenario (operation), runner
type and sla of the scenario.
For TC002, We only have one step, which is Ping from host VM to target VM. In this step, we also have some detailed operations implemented (such as ssh to VM, ping from VM1 to VM2. Get the latency, verify the SLA, report the result).
If you want to get this implementation details implement, you can check with
the scenario.py file. For Ping scenario, you can find it in Yardstick repo
(yardstick/yardstick/benchmark/scenarios/networking/ping.py).
After you select the type of scenario (such as Ping), you will select one type
of runner, there are 4 types of runner. Iteration and Duration are
the most commonly used, and the default is Iteration.
For Iteration, you can specify the iteration number and interval of iteration.
runner:
type: Iteration
iterations: 10
interval: 1
That means Yardstick will repeat the Ping test 10 times and the interval of each iteration is one second.
For Duration, you can specify the duration of this scenario and the
interval of each ping test.
runner:
type: Duration
duration: 60
interval: 10
That means Yardstick will run the ping test as loop until the total time of this scenario reaches 60s and the interval of each loop is ten seconds.
SLA is the criterion of this scenario. This depends on the scenario. Different scenarios can have different SLA metric.
Yardstick already provides a library of testing steps (i.e. different types of scenario).
Basically, what you need to do is to orchestrate the scenario from the library.
Here, we will show two cases. One is how to write a simple test case, the other is how to write a quite complex test case.
First, you can image a basic test case description as below.
| Storage Performance | |
| metric | IOPS (Average IOs performed per second), Throughput (Average disk read/write bandwidth rate), Latency (Average disk read/write latency) |
| test purpose | The purpose of TC005 is to evaluate the IaaS storage performance with regards to IOPS, throughput and latency. |
| test description | fio test is invoked in a host VM on a compute blade, a job file as well as parameters are passed to fio and fio will start doing what the job file tells it to do. |
| configuration | file: opnfv_yardstick_tc005.yaml IO types is set to read, write, randwrite, randread, rw. IO block size is set to 4KB, 64KB, 1024KB. fio is run for each IO type and IO block size scheme, each iteration runs for 30 seconds (10 for ramp time, 20 for runtime). For SLA, minimum read/write iops is set to 100, minimum read/write throughput is set to 400 KB/s, and maximum read/write latency is set to 20000 usec. |
| applicability | This test case can be configured with different:
Default values exist. SLA is optional. The SLA in this test case serves as an example. Considerably higher throughput and lower latency are expected. However, to cover most configurations, both baremetal and fully virtualized ones, this value should be possible to achieve and acceptable for black box testing. Many heavy IO applications start to suffer badly if the read/write bandwidths are lower than this. |
| pre-test conditions | The test case image needs to be installed into Glance with fio included in it. No POD specific requirements have been identified. |
| test sequence | description and expected result |
| step 1 | A host VM with fio installed is booted. |
| step 2 | Yardstick is connected with the host VM by using ssh. ‘fio_benchmark’ bash script is copyied from Jump Host to the host VM via the ssh tunnel. |
| step 3 | ‘fio_benchmark’ script is invoked. Simulated IO operations are started. IOPS, disk read/write bandwidth and latency are recorded and checked against the SLA. Logs are produced and stored. Result: Logs are stored. |
| step 4 | The host VM is deleted. |
| test verdict | Fails only if SLA is not passed, or if there is a test case execution problem. |
TODO
If you are already a contributor of any OPNFV project, you can contribute to Yardstick. If you are totally new to OPNFV, you must first create your Linux Foundation account, then contact us in order to declare you in the repository database.
We distinguish 2 levels of contributors:
Yardstick commitors are promoted by the Yardstick contributors.
OPNFV uses Gerrit for web based code review and repository management for the Git Version Control System. You can access OPNFV Gerrit. Please note that you need to have Linux Foundation ID in order to use OPNFV Gerrit. You can get one from this link.
OPNFV uses JIRA for issue management. An important principle of change management is to have two-way trace-ability between issue management (i.e. JIRA) and the code repository (via Gerrit). In this way, individual commits can be traced to JIRA issues and we also know which commits were used to resolve a JIRA issue.
If you want to contribute to Yardstick, you can pick a issue from Yardstick’s JIRA dashboard or you can create you own issue and submit it to JIRA.
Installing and configuring Git and Git-Review is necessary in order to submit code to Gerrit. The Getting to the code page will provide you with some help for that.
Once you finish a patch, you can submit it to Gerrit for code review. A developer sends a new patch to Gerrit will trigger patch verify job on Jenkins CI. The yardstick patch verify job includes python pylint check, unit test and code coverage test. Before you submit your patch, it is recommended to run the patch verification in your local environment first.
Open a terminal window and set the project’s directory to the working
directory using the cd command. Assume that YARDSTICK_REPO_DIR is the
path to the Yardstick project folder on your computer:
cd $YARDSTICK_REPO_DIR
Verify your patch:
tox
It is used in CI but also by the CLI.
Tell Git which files you would like to take into account for the next commit.
This is called ‘staging’ the files, by placing them into the staging area,
using the git add command (or the synonym git stage command):
git add $YARDSTICK_REPO_DIR/samples/sample.yaml
Alternatively, you can choose to stage all files that have been modified (that is the files you have worked on) since the last time you generated a commit, by using the -a argument:
git add -a
Git won’t let you push (upload) any code to Gerrit if you haven’t pulled the
latest changes first. So the next step is to pull (download) the latest
changes made to the project by other collaborators using the pull command:
git pull
Now that you have the latest version of the project and you have staged the files you wish to push, it is time to actually commit your work to your local Git repository:
git commit --signoff -m "Title of change"
Test of change that describes in high level what was done. There is a lot of
documentation in code so you do not need to repeat it here.
JIRA: YARDSTICK-XXX
The message that is required for the commit should follow a specific set of rules. This practice allows to standardize the description messages attached to the commits, and eventually navigate among the latter more easily.
This document happened to be very clear and useful to get started with that.
Now that the code has been comitted into your local Git repository the
following step is to push it online to Gerrit for it to be reviewed. The
command we will use is git review:
git review
This will automatically push your local commit into Gerrit. You can add Yardstick committers and contributors to review your codes.
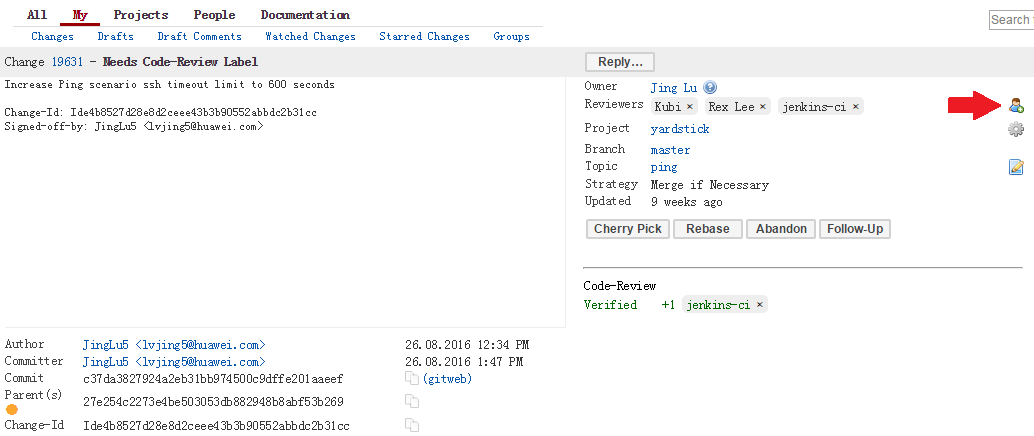
You can find a list Yardstick people
here, or use the
yardstick-reviewers and yardstick-committers groups in gerrit.
At the same time the code is being reviewed in Gerrit, you may need to edit it to make some changes and then send it back for review. The following steps go through the procedure.
Once you have modified/edited your code files under your IDE, you will have to
stage them. The git status command is very helpful at this point as it
provides an overview of Git’s current state:
git status
This command lists the files that have been modified since the last commit.
You can now stage the files that have been modified as part of the Gerrit code
review addition/modification/improvement using git add command. It is now
time to commit the newly modified files, but the objective here is not to
create a new commit, we simply want to inject the new changes into the
previous commit. You can achieve that with the ‘–amend’ option on the
git commit command:
git commit --amend
If the commit was successful, the git status command should not return the
updated files as about to be commited.
The final step consists in pushing the newly modified commit to Gerrit:
git review
During the release cycle, when master and the stable/<release> branch have
diverged, it may be necessary to backport (cherry-pick) changes top the
stable/<release> branch once they have merged to master.
These changes should be identified by the committers reviewing the patch.
Changes should be backported as soon as possible after merging of the
original code.
The process for backporting is as follows:
stable/<release> branch (if the
bug has been identified for backporting).+1).+2 and merges to
stable/<release>.A backported change needs a +1 and a +2 from a committer who didn’t
propose the change (i.e. minimum 3 people involved).
For information about Yardstick plugins, refer to the chapter Installing a plug-in into Yardstick in the user guide.
This document describes the steps to create a new NSB PROX test based on existing PROX functionalities. NSB PROX provides is a simple approximation of an operation and can be used to develop best practices and TCO models for Telco customers, investigate the impact of new Intel compute, network and storage technologies, characterize performance, and develop optimal system architectures and configurations.
Contents
In order to integrate PROX tests into NSB, the following prerequisites are required.
The following is a diagram of a sample NSB PROX Hardware Architecture for both NSB PROX on Bare metal and on Openstack.
In this example when running yardstick on baremetal, yardstick will run on the deployment node, the generator will run on the deployment node and the SUT(SUT) will run on the Controller Node.
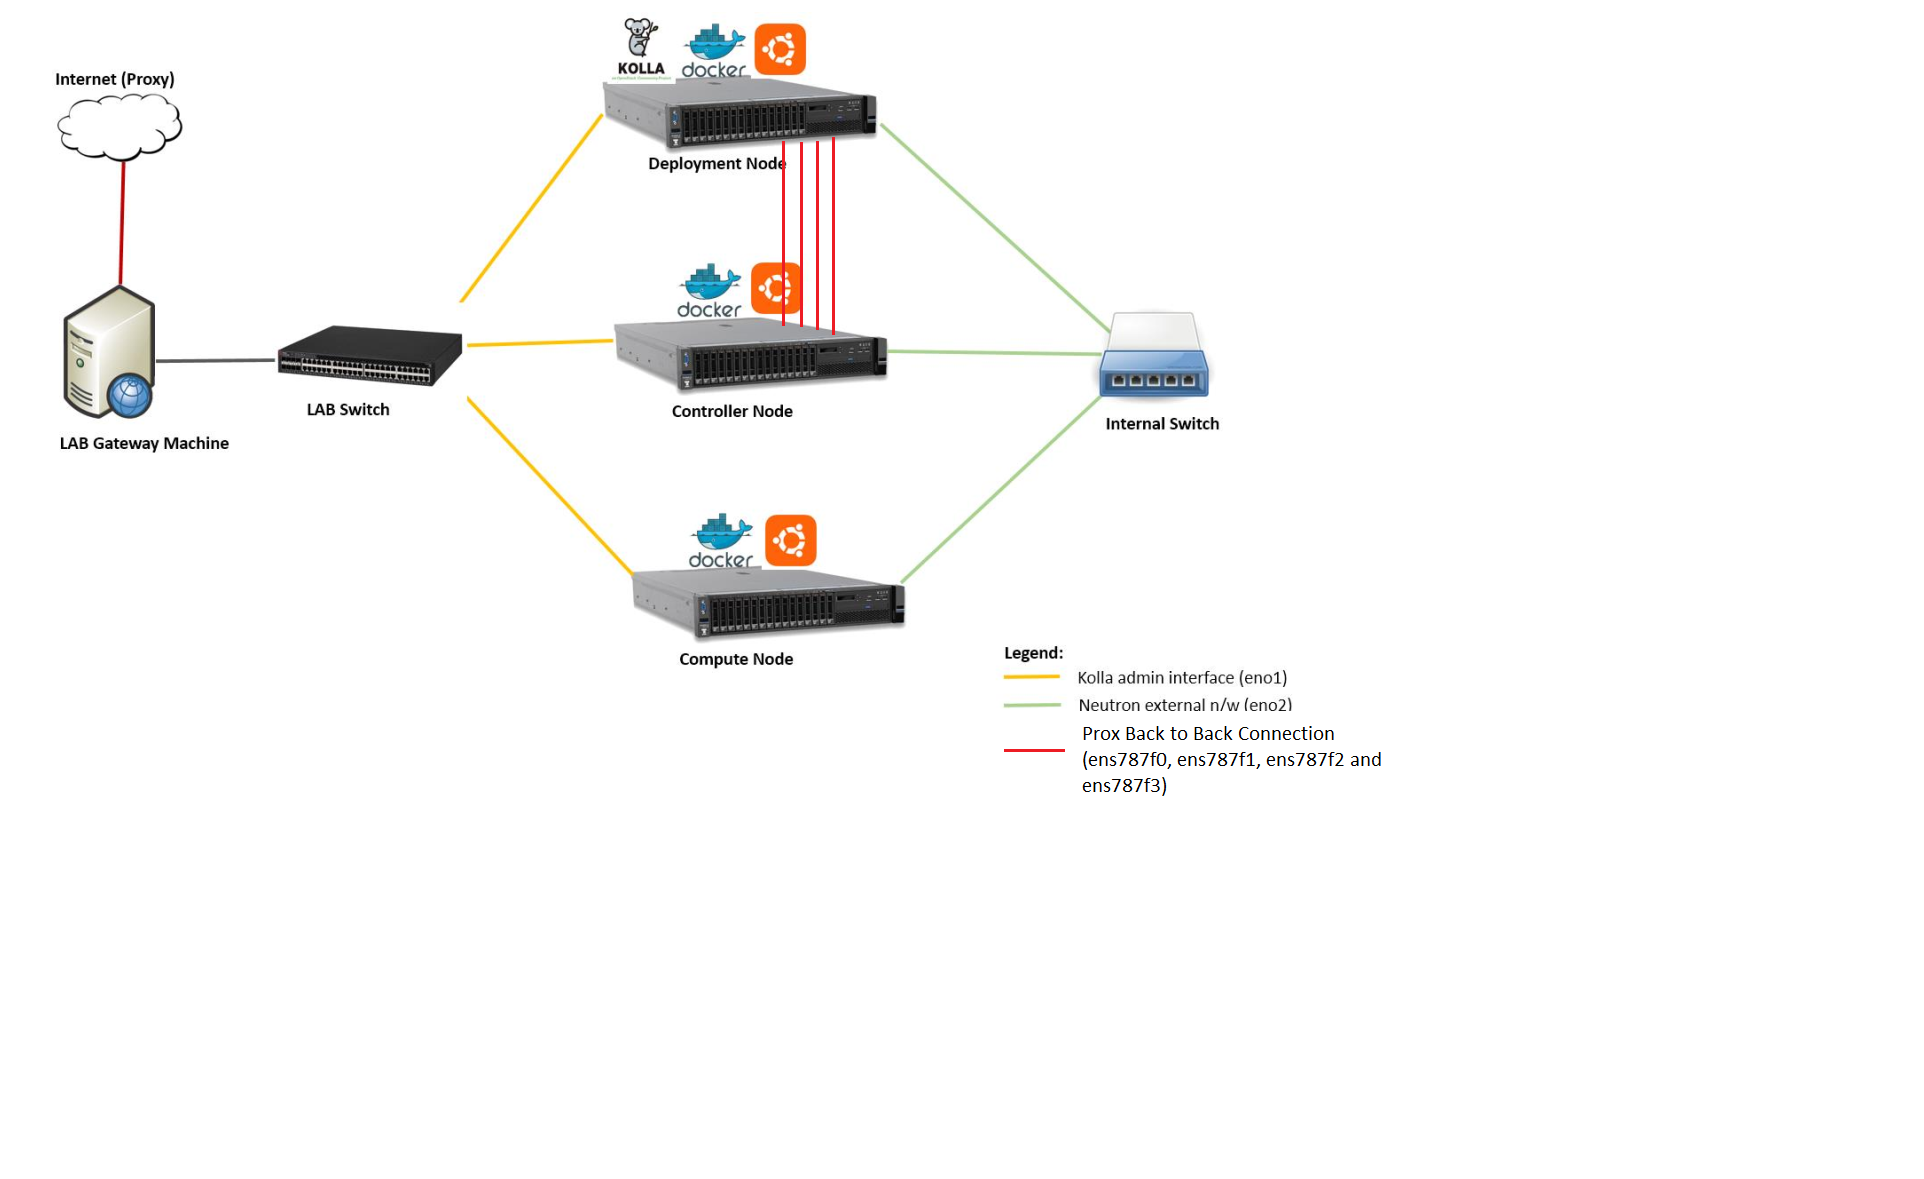
In order to create a new test, one must understand the architecture of the test.
A NSB Prox test architecture is composed of:
A traffic generator. This provides blocks of data on 1 or more ports to the SUT. The traffic generator also consumes the result packets from the system under test.
A SUT consumes the packets generated by the packet generator, and applies one or more tasks to the packets and return the modified packets to the traffic generator.
This is an example of a sample NSB PROX test architecture.
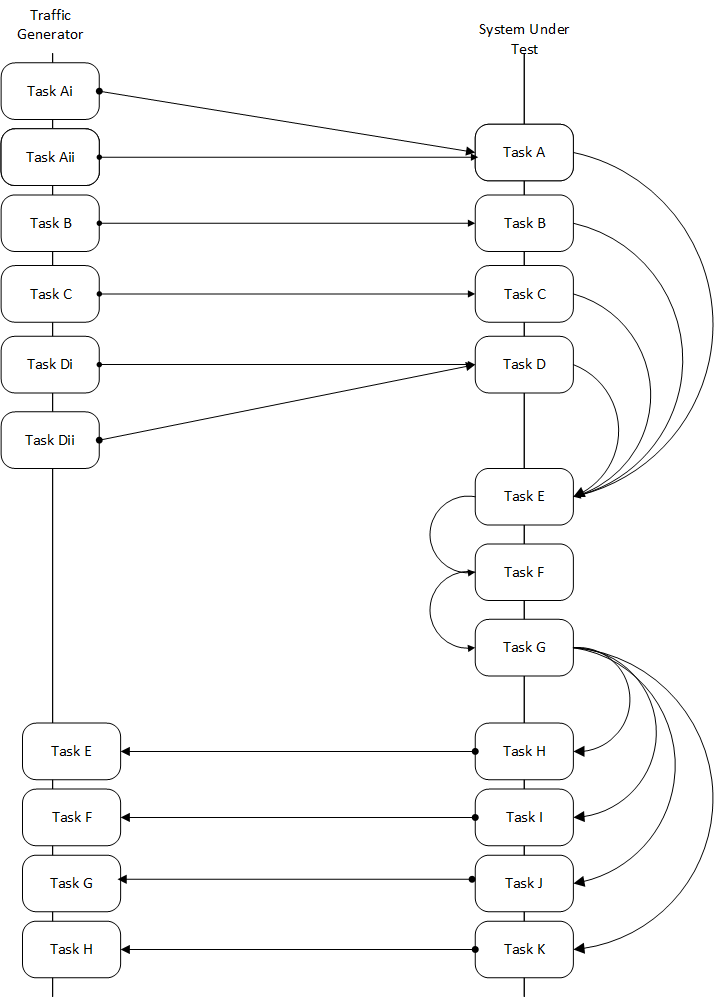
This diagram is of a sample NSB PROX test application.
A NSB Prox test is composed of the following components :-
Test Description File. Usually called
tc_prox_<context>_<test>-<ports>.yaml where
baremetal or heat_contextExample tests tc_prox_baremetal_l2fwd-2.yaml or
tc_prox_heat_context_vpe-4.yaml. This file describes the components
of the test, in the case of openstack the network description and
server descriptions, in the case of baremetal the hardware
description location. It also contains the name of the Traffic Generator, the SUT config file
and the traffic profile description, all described below. See nsb-test-description-label
Traffic Profile file. Example prox_binsearch.yaml. This describes the packet size, tolerated
loss, initial line rate to start traffic at, test interval etc See nsb-traffic-profile-label
Traffic Generator Config file. Usually called gen_<test>-<ports>.cfg.
This describes the activity of the traffic generator
Example traffic generator config file gen_l2fwd-4.cfg
See nsb-traffic-generator-label
SUT Config file. Usually called handle_<test>-<ports>.cfg.
This describes the activity of the SUTs
Example traffic generator config file handle_l2fwd-4.cfg
See nsb-sut-generator-label
NSB PROX Baremetal Configuration file. Usually called
prox-baremetal-<ports>.yaml
This is required for baremetal only. This describes hardware, NICs, IP addresses, Network drivers, usernames and passwords. See baremetal-config-label
Grafana Dashboard. Usually called
Prox_<context>_<test>-<port>-<DateAndTime>.json where
BM or heat2Port or 4PortExample grafana dashboard Prox_BM_L2FWD-4Port-1507804504588.json
Other files may be required. These are test specific files and will be covered later.
Test Description File
Here we will discuss the test description for both baremetal and openstack.
This section will introduce the meaning of the Test case description
file. We will use tc_prox_baremetal_l2fwd-2.yaml as an example to
show you how to understand the test description file.
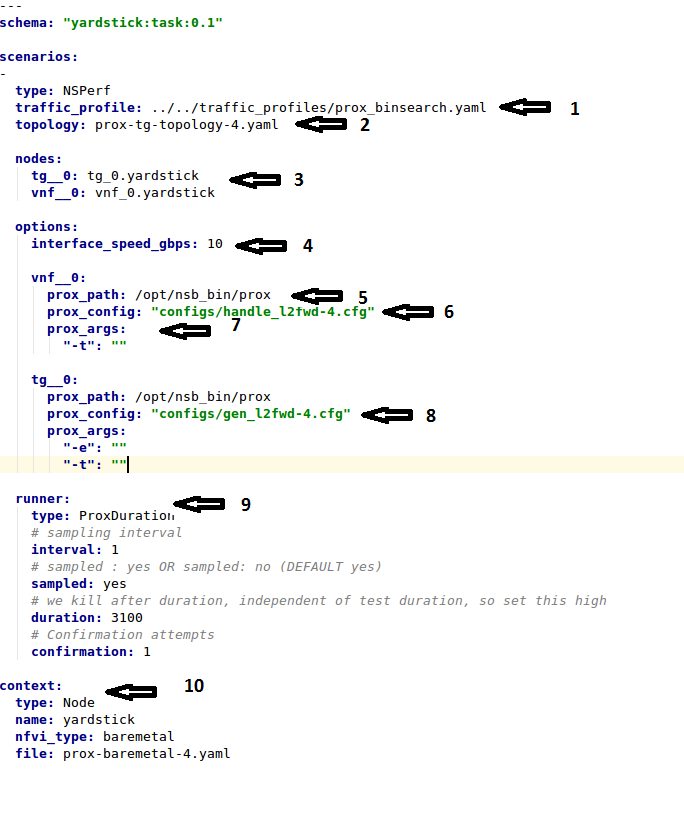
Now let’s examine the components of the file in detail
traffic_profile - This specifies the traffic profile for the
test. In this case prox_binsearch.yaml is used. See nsb-traffic-profile-label
topology - This is either prox-tg-topology-1.yaml orprox-tg-topology-2.yaml or prox-tg-topology-4.yaml
depending on number of ports required.
nodes - This names the Traffic Generator and the System
under Test. Does not need to change.
interface_speed_gbps - This is an optional parameter. If not present
the system defaults to 10Gbps. This defines the speed of the interfaces.
prox_path - Location of the Prox executable on the traffic
generator (Either baremetal or Openstack Virtual Machine)
prox_config - This is the SUT Config File.
In this case it is handle_l2fwd-2.cfg
A number of additional parameters can be added. This example is for VPE:
options:
interface_speed_gbps: 10
vnf__0:
prox_path: /opt/nsb_bin/prox
prox_config: ``configs/handle_vpe-4.cfg``
prox_args:
``-t``: ````
prox_files:
``configs/vpe_ipv4.lua`` : ````
``configs/vpe_dscp.lua`` : ````
``configs/vpe_cpe_table.lua`` : ````
``configs/vpe_user_table.lua`` : ````
``configs/vpe_rules.lua`` : ````
prox_generate_parameter: True
interface_speed_gbps - this specifies the speed of the interface
in Gigabits Per Second. This is used to calculate pps(packets per second).
If the interfaces are of different speeds, then this specifies the speed
of the slowest interface. This parameter is optional. If omitted the
interface speed defaults to 10Gbps.
prox_files - this specified that a number of addition files
need to be provided for the test to run correctly. This files
could provide routing information,hashing information or a
hashing algorithm and ip/mac information.
prox_generate_parameter - this specifies that the NSB application
is required to provide information to the nsb Prox in the form
of a file called parameters.lua, which contains information
retrieved from either the hardware or the openstack configuration.
prox_args - this specifies the command line arguments to start
prox. See prox command line.
prox_config - This specifies the Traffic Generator config file.
runner - This is set to ProxDuration - This specifies that the
test runs for a set duration. Other runner types are available
but it is recommend to use ProxDuration
The following parrameters are supported
interval - (optional) - This specifies the sampling interval.
Default is 1 sec
sampled - (optional) - This specifies if sampling information is
required. Default no
duration - This is the length of the test in seconds. Default
is 60 seconds.
confirmation - This specifies the number of confirmation retests to
be made before deciding to increase or decrease line speed. Default 0.
context - This is context for a 2 port Baremetal configuration.
If a 4 port configuration was required then fileprox-baremetal-4.yamlwould be used. This is the NSB Prox baremetal configuration file.
This describes the details of the traffic flow. In this case
prox_binsearch.yaml is used.
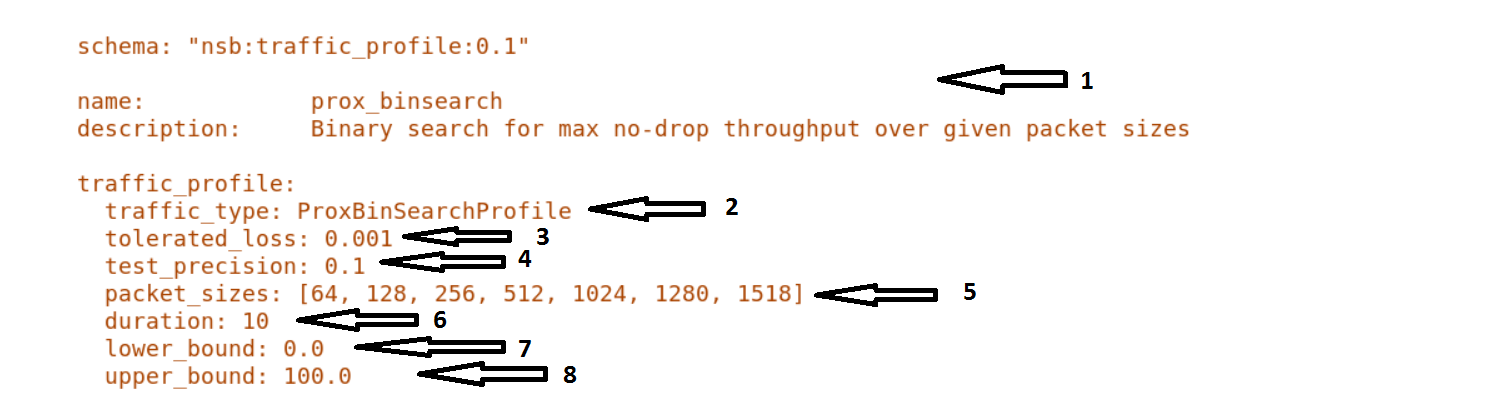
name - The name of the traffic profile. This name should match the name specified in the
traffic_profile field in the Test Description File.
traffic_type - This specifies the type of traffic pattern generated, This name matches
class name of the traffic generator See:
network_services/traffic_profile/prox_binsearch.py class ProxBinSearchProfile(ProxProfile)
In this case it lowers the traffic rate until the number of packets sent is equal to the number of packets received (plus a tolerated loss). Once it achieves this it increases the traffic rate in order to find the highest rate with no traffic loss.
Custom traffic types can be created by creating a new traffic profile class.
tolerated_loss - This specifies the percentage of packets that
can be lost/dropped before
we declare success or failure. Success is Transmitted-Packets from
Traffic Generator is greater than or equal to
packets received by Traffic Generator plus tolerated loss.
test_precision - This specifies the precision of the test
results. For some tests the success criteria may never be
achieved because the test precision may be greater than the
successful throughput. For finer results increase the precision
by making this value smaller.
packet_sizes - This specifies the range of packets size this
test is run for.
duration - This specifies the sample duration that the test
uses to check for success or failure.
lower_bound - This specifies the test initial lower bound sample rate.
On success this value is increased.
upper_bound - This specifies the test initial upper bound sample rate.
On success this value is decreased.
Other traffic profiles exist eg prox_ACL.yaml which does not compare what is received with what is transmitted. It just sends packet at max rate.
It is possible to create custom traffic profiles with by creating new file in the same folder as prox_binsearch.yaml. See this prox_vpe.yaml as example:
schema: ``nsb:traffic_profile:0.1``
name: prox_vpe
description: Prox vPE traffic profile
traffic_profile:
traffic_type: ProxBinSearchProfile
tolerated_loss: 100.0 #0.001
test_precision: 0.01
# The minimum size of the Ethernet frame for the vPE test is 68 bytes.
packet_sizes: [68]
duration: 5
lower_bound: 0.0
upper_bound: 100.0
We will use tc_prox_heat_context_l2fwd-2.yaml as a example to show
you how to understand the test description file.
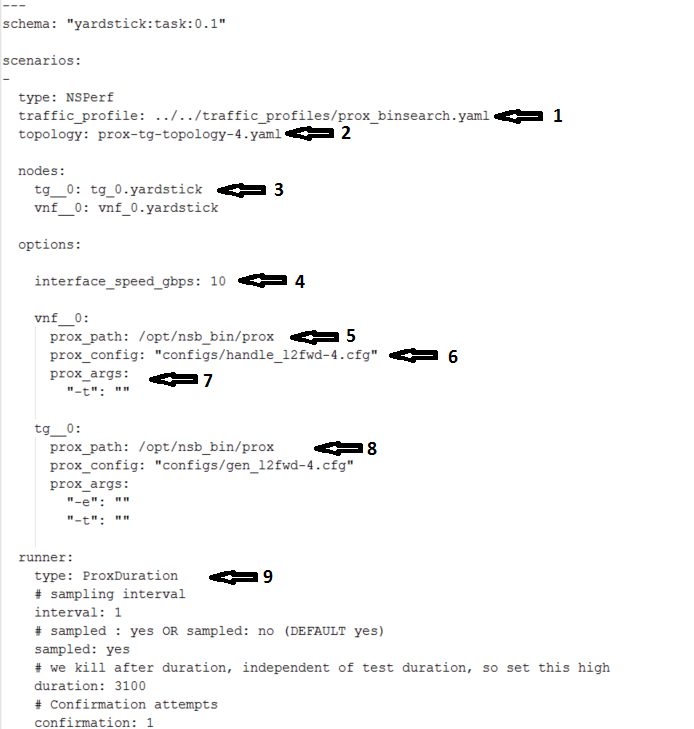
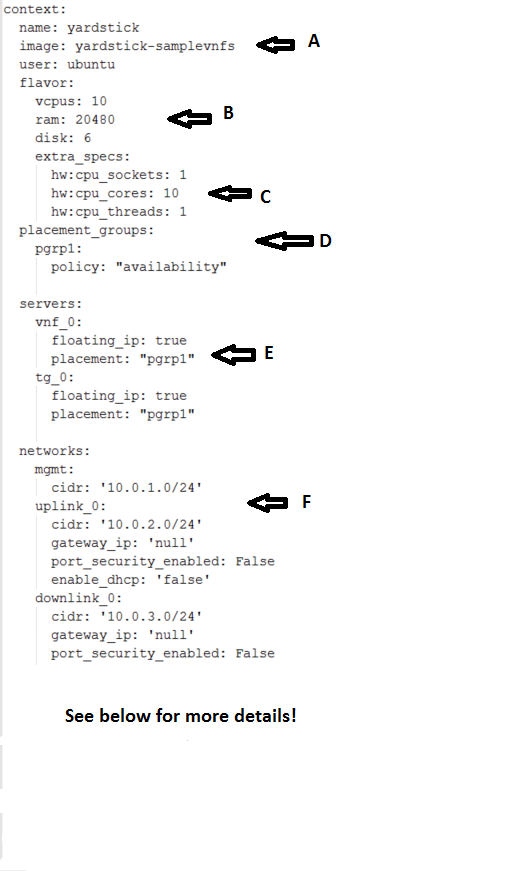
Now lets examine the components of the file in detail
Sections 1 to 9 are exactly the same in Baremetal and in Heat. Section
10 is replaced with sections A to F. Section 10 was for a baremetal
configuration file. This has no place in a heat configuration.
image - yardstick-samplevnfs. This is the name of the image
created during the installation of NSB. This is fixed.
flavor - The flavor is created dynamically. However we could
use an already existing flavor if required. In that case the
flavor would be named:
flavor: yardstick-flavor
extra_specs - This allows us to specify the number of
cores sockets and hyperthreading assigned to it. In this case
we have 1 socket with 10 codes and no hyperthreading enabled.
placement_groups - default. Do not change for NSB PROX.
servers - tg_0 is the traffic generator and vnf_0
is the system under test.
networks - is composed of a management network labeled mgmt
and one uplink network labeled uplink_0 and one downlink
network labeled downlink_0 for 2 ports. If this was a 4 port
configuration there would be 2 extra downlink ports. See this
example from a 4 port l2fwd test.:
networks:
mgmt:
cidr: '10.0.1.0/24'
uplink_0:
cidr: '10.0.2.0/24'
gateway_ip: 'null'
port_security_enabled: False
enable_dhcp: 'false'
downlink_0:
cidr: '10.0.3.0/24'
gateway_ip: 'null'
port_security_enabled: False
enable_dhcp: 'false'
uplink_1:
cidr: '10.0.4.0/24'
gateway_ip: 'null'
port_security_enabled: False
enable_dhcp: 'false'
downlink_1:
cidr: '10.0.5.0/24'
gateway_ip: 'null'
port_security_enabled: False
enable_dhcp: 'false'
This section will describe the traffic generator config file.
This is the same for both baremetal and heat. See this example
of gen_l2fwd_multiflow-2.cfg to explain the options.
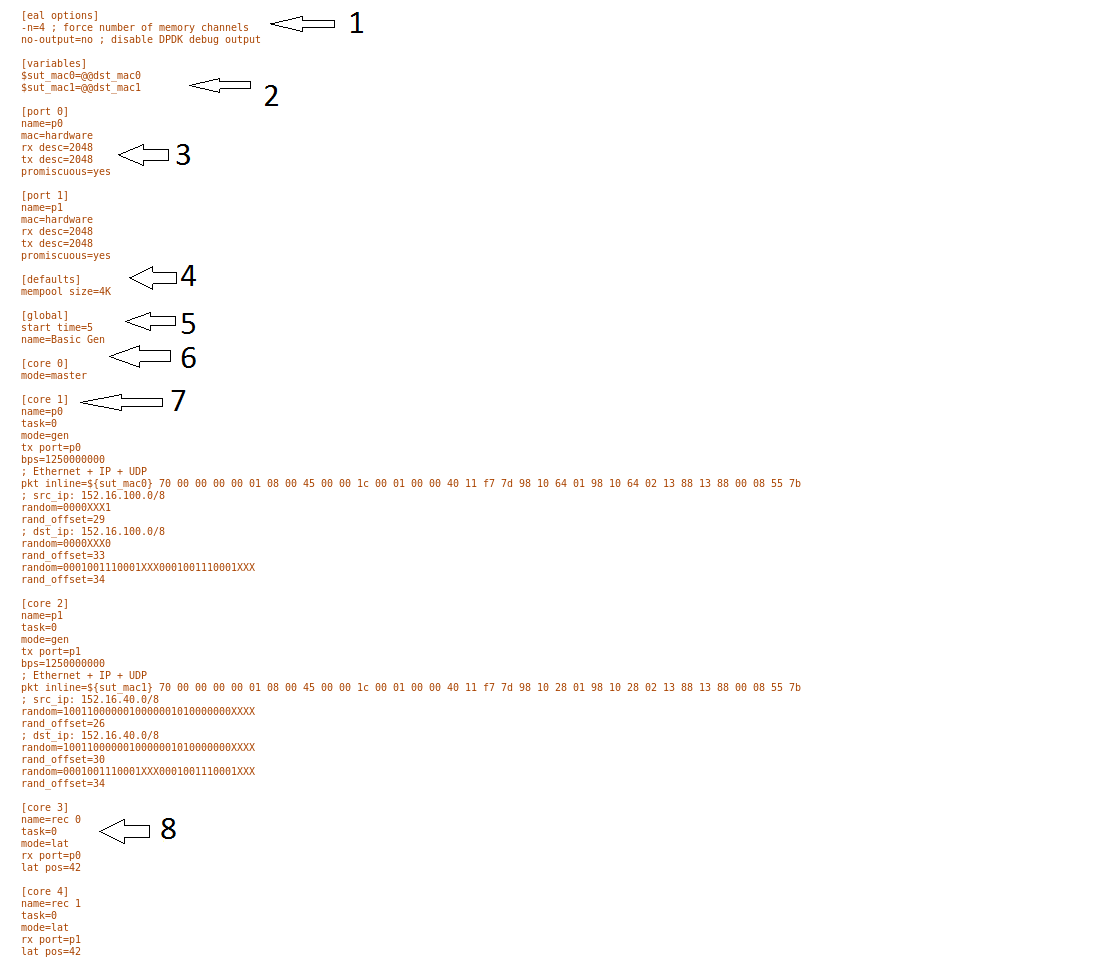
The configuration file is divided into multiple sections, each of which is used to define some parameters and options.:
[eal options]
[variables]
[port 0]
[port 1]
[port .]
[port Z]
[defaults]
[global]
[core 0]
[core 1]
[core 2]
[core .]
[core Z]
See prox options for details
Now let’s examine the components of the file in detail
[eal options] - This specified the EAL (Environmental
Abstraction Layer) options. These are default values and
are not changed. See dpdk wiki page.
[variables] - This section contains variables, as
the name suggests. Variables for Core numbers, mac
addresses, ip addresses etc. They are assigned as a
key = value where the key is used in place of the value.
Caution
A special case for valuables with a value beginning with
@@. These values are dynamically updated by the NSB
application at run time. Values like MAC address,
IP Address etc.
[port 0] - This section describes the DPDK Port. The number
following the keyword port usually refers to the DPDK Port
Id. usually starting from 0. Because you can have multiple
ports this entry usually repeated. Eg. For a 2 port setup
[port0] and [port 1] and for a 4 port setup [port 0],
[port 1], [port 2] and [port 3]:
[port 0]
name=p0
mac=hardware
rx desc=2048
tx desc=2048
promiscuous=yes
name = p0 assigned the name p0 to the
port. Any name can be assigned to a port.mac=hardware sets the MAC address assigned by the hardware
to data from this port.rx desc=2048 sets the number of available descriptors to
allocate for receive packets. This can be changed and can
effect performance.tx desc=2048 sets the number of available descriptors to
allocate for transmit packets. This can be changed and can
effect performance.promiscuous=yes this enables promiscuous mode for this port.[defaults] - Here default operations and settings can be over
written. In this example mempool size=4K the number of mbufs
per task is altered. Altering this value could effect
performance. See prox options for details.
[global] - Here application wide setting are supported. Things
like application name, start time, duration and memory
configurations can be set here. In this example.:
[global]
start time=5
name=Basic Gen
a. ``start time=5`` Time is seconds after which average
stats will be started.
b. ``name=Basic Gen`` Name of the configuration.
[core 0] - This core is designated the master core. Every
Prox application must have a master core. The master mode must
be assigned to exactly one task, running alone on one core.:
[core 0]
mode=master
[core 1] - This describes the activity on core 1. Cores can
be configured by means of a set of [core #] sections, where
# represents either:
an absolute core number: e.g. on a 10-core, dual socket system with hyper-threading, cores are numbered from 0 to 39.
PROX allows a core to be identified by a core number, the letter ‘s’, and a socket number.
It is possible to write a baremetal and an openstack test which use the same traffic generator config file and SUT config file. In this case it is advisable not to use physical core numbering.
However it is also possible to write NSB Prox tests that have been optimized for a particular hardware configuration. In this case it is advisable to use the core numbering. It is up to the user to make sure that cores from the right sockets are used (i.e. from the socket on which the NIC is attached to), to ensure good performance (EPA).
Each core can be assigned with a set of tasks, each running one of the implemented packet processing modes.:
[core 1]
name=p0
task=0
mode=gen
tx port=p0
bps=1250000000
; Ethernet + IP + UDP
pkt inline=${sut_mac0} 70 00 00 00 00 01 08 00 45 00 00 1c 00 01 00 00 40 11 f7 7d 98 10 64 01 98 10 64 02 13 88 13 88 00 08 55 7b
; src_ip: 152.16.100.0/8
random=0000XXX1
rand_offset=29
; dst_ip: 152.16.100.0/8
random=0000XXX0
rand_offset=33
random=0001001110001XXX0001001110001XXX
rand_offset=34
name=p0 - Name assigned to the core.
task=0 - Each core can run a set of tasks. Starting with 0.
Task 1 can be defined later in this core or
can be defined in another [core 1] section with task=1
later in configuration file. Sometimes running
multiple task related to the same packet on the same physical
core improves performance, however sometimes it
is optimal to move task to a separate core. This is best
decided by checking performance.
mode=gen - Specifies the action carried out by this task on
this core. Supported modes are: classify, drop, gen, lat, genl4, nop, l2fwd, gredecap,
greencap, lbpos, lbnetwork, lbqinq, lb5tuple, ipv6_decap, ipv6_encap,
qinqdecapv4, qinqencapv4, qos, routing, impair,
mirror, unmpls, tagmpls, nat, decapnsh, encapnsh, police, acl
Which are :-
- Classify
- Drop
- Basic Forwarding (no touch)
- L2 Forwarding (change MAC)
- GRE encap/decap
- Load balance based on packet fields
- Symmetric load balancing
- QinQ encap/decap IPv4/IPv6
- ARP
- QoS
- Routing
- Unmpls
- Nsh encap/decap
- Policing
- ACL
In the traffic generator we expect a core to generate packets (gen)
and to receive packets & calculate latency (lat)
This core does gen . ie it is a traffic generator.
To understand what each of the modes support please see prox documentation.
tx port=p0 - This specifies that the packets generated are
transmitted to port p0
bps=1250000000 - This indicates Bytes Per Second to
generate packets.
; Ethernet + IP + UDP - This is a comment. Items starting with
; are ignored.
pkt inline=${sut_mac0} 70 00 00 00 ... - Defines the packet
format as a sequence of bytes (each
expressed in hexadecimal notation). This defines the packet
that is generated. This packets begins
with the hexadecimal sequence assigned to sut_mac and the
remainder of the bytes in the string.
This packet could now be sent or modified by random=..
described below before being sent to target.
; src_ip: 152.16.100.0/8 - Comment
random=0000XXX1 - This describes a field of the packet
containing random data. This string can be
8,16,24 or 32 character long and represents 1,2,3 or 4
bytes of data. In this case it describes a byte of
data. Each character in string can be 0,1 or X. 0 or 1
are fixed bit values in the data packet and X is a
random bit. So random=0000XXX1 generates 00000001(1),
00000011(3), 00000101(5), 00000111(7),
00001001(9), 00001011(11), 00001101(13) and 00001111(15)
combinations.
rand_offset=29 - Defines where to place the previously
defined random field.
; dst_ip: 152.16.100.0/8 - Comment
random=0000XXX0 - This is another random field which
generates a byte of 00000000(0), 00000010(2),
00000100(4), 00000110(6), 00001000(8), 00001010(10),
00001100(12) and 00001110(14) combinations.
rand_offset=33 - Defines where to place the previously
defined random field.
random=0001001110001XXX0001001110001XXX - This is
another random field which generates 4 bytes.
rand_offset=34 - Defines where to place the previously
defined 4 byte random field.
Core 2 executes same scenario as Core 1. The only difference in this case is that the packets are generated for Port 1.
[core 3] - This defines the activities on core 3. The purpose
of core 3 and core 4 is to receive packets
sent by the SUT.:
[core 3]
name=rec 0
task=0
mode=lat
rx port=p0
lat pos=42
name=rec 0 - Name assigned to the core.task=0 - Each core can run a set of tasks. Starting with
0. Task 1 can be defined later in this core or
can be defined in another [core 1] section with
task=1 later in configuration file. Sometimes running
multiple task related to the same packet on the same
physical core improves performance, however sometimes it
is optimal to move task to a separate core. This is
best decided by checking performance.mode=lat - Specifies the action carried out by this task on this core. Supported modes are: acl,
classify, drop, gredecap, greencap, ipv6_decap, ipv6_encap, l2fwd, lbnetwork, lbpos, lbqinq, nop,
police, qinqdecapv4, qinqencapv4, qos, routing, impair, lb5tuple, mirror, unmpls, tagmpls,
nat, decapnsh, encapnsh, gen, genl4 and lat. This task(0) per core(3) receives packets on port.rx port=p0 - The port to receive packets on Port 0. Core 4 will receive packets on Port 1.lat pos=42 - Describes where to put a 4-byte timestamp in the packet. Note that the packet length should
be longer than lat pos + 4 bytes to avoid truncation of the timestamp. It defines where the timestamp is
to be read from. Note that the SUT workload might cause the position of the timestamp to change
(i.e. due to encapsulation).This section will describes the SUT(VNF) config file. This is the same for both
baremetal and heat. See this example of handle_l2fwd_multiflow-2.cfg to explain the options.
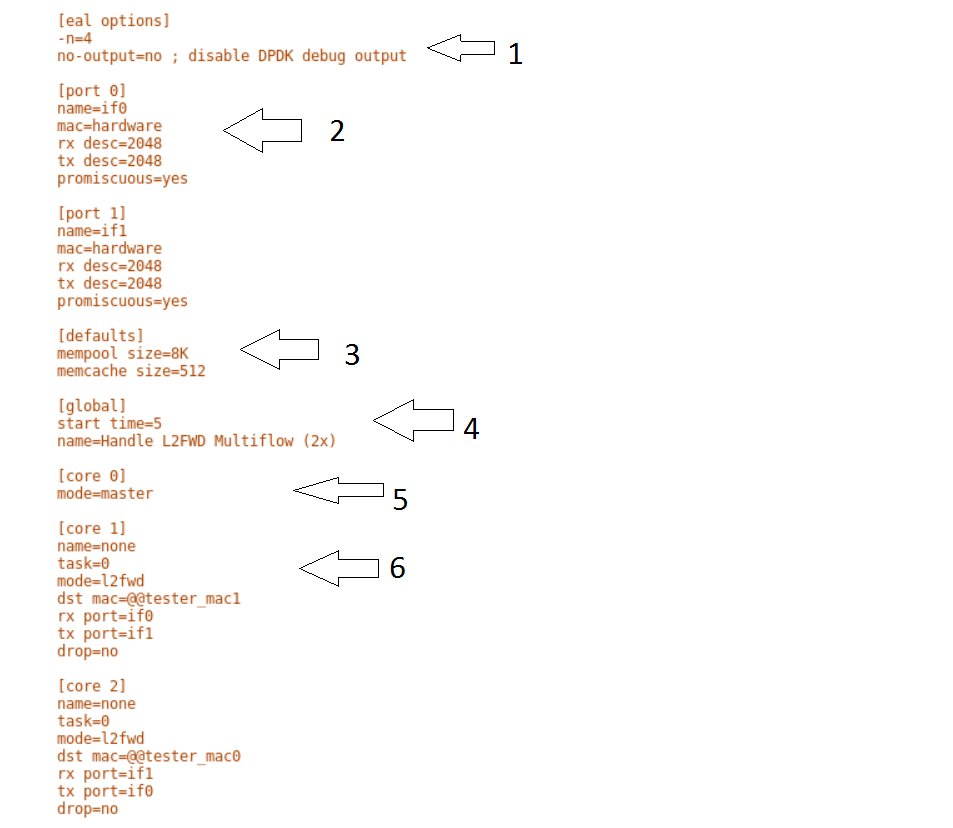
See prox options for details
Now let’s examine the components of the file in detail
[eal options] - same as the Generator config file. This specified the EAL (Environmental Abstraction Layer)
options. These are default values and are not changed.
See dpdk wiki page.
[port 0] - This section describes the DPDK Port. The number following the keyword port usually refers to the DPDK Port Id. usually starting from 0.
Because you can have multiple ports this entry usually repeated. Eg. For a 2 port setup [port0] and [port 1] and for a 4 port setup [port 0], [port 1],
[port 2] and [port 3]:
[port 0]
name=if0
mac=hardware
rx desc=2048
tx desc=2048
promiscuous=yes
name =if0 assigned the name if0 to the port. Any name can be assigned to a port.mac=hardware sets the MAC address assigned by the hardware to data from this port.rx desc=2048 sets the number of available descriptors to allocate for receive packets. This can be changed and can effect performance.tx desc=2048 sets the number of available descriptors to allocate for transmit packets. This can be changed and can effect performance.promiscuous=yes this enables promiscuous mode for this port.[defaults] - Here default operations and settings can be over written.:
[defaults]
mempool size=8K
memcache size=512
mempool size=8K the number of mbufs per task is altered. Altering this value could effect performance. See prox options for details.memcache size=512 - number of mbufs cached per core, default is 256 this is the cache_size. Altering this value could effect performance.[global] - Here application wide setting are supported. Things like application name, start time, duration and memory configurations can be set here.
In this example.:
[global]
start time=5
name=Basic Gen
a. ``start time=5`` Time is seconds after which average stats will be started.
b. ``name=Handle L2FWD Multiflow (2x)`` Name of the configuration.
[core 0] - This core is designated the master core. Every Prox application must have a master core. The master mode must be assigned to
exactly one task, running alone on one core.:
[core 0]
mode=master
[core 1] - This describes the activity on core 1. Cores can be configured by means of a set of [core #] sections, where # represents either:
Each core can be assigned with a set of tasks, each running one of the implemented packet processing modes.:
[core 1]
name=none
task=0
mode=l2fwd
dst mac=@@tester_mac1
rx port=if0
tx port=if1
name=none - No name assigned to the core.task=0 - Each core can run a set of tasks. Starting with 0. Task 1 can be defined later in this core or
can be defined in another [core 1] section with task=1 later in configuration file. Sometimes running
multiple task related to the same packet on the same physical core improves performance, however sometimes it
is optimal to move task to a separate core. This is best decided by checking performance.mode=l2fwd - Specifies the action carried out by this task on this core. Supported modes are: acl,
classify, drop, gredecap, greencap, ipv6_decap, ipv6_encap, l2fwd, lbnetwork, lbpos, lbqinq, nop,
police, qinqdecapv4, qinqencapv4, qos, routing, impair, lb5tuple, mirror, unmpls, tagmpls,
nat, decapnsh, encapnsh, gen, genl4 and lat. This code does l2fwd .. ie it does the L2FWD.dst mac=@@tester_mac1 - The destination mac address of the packet will be set to the MAC address of Port 1 of destination device. (The Traffic Generator/Verifier)rx port=if0 - This specifies that the packets are received from Port 0 called if0tx port=if1 - This specifies that the packets are transmitted to Port 1 called if1If this example we receive a packet on core on a port, carry out operation on the packet on the core and transmit it on on another port still using the same task on the same core.
On some implementation you may wish to use multiple tasks, like this.:
[core 1]
name=rx_task
task=0
mode=l2fwd
dst mac=@@tester_p0
rx port=if0
tx cores=1t1
drop=no
name=l2fwd_if0
task=1
mode=nop
rx ring=yes
tx port=if0
drop=no
In this example you can see Core 1/Task 0 called rx_task receives the packet from if0 and perform the l2fwd. However instead of sending the packet to a
port it sends it to a core see tx cores=1t1. In this case it sends it to Core 1/Task 1.
Core 1/Task 1 called l2fwd_if0, receives the packet, not from a port but from the ring. See rx ring=yes. It does not perform any operation on the packet See mode=none
and sends the packets to if0 see tx port=if0.
It is also possible to implement more complex operations be chaining multiple operations in sequence and using rings to pass packets from one core to another.
In thus example we show a Broadband Network Gateway (BNG) with Quality of Service (QoS). Communication from task to task is via rings.
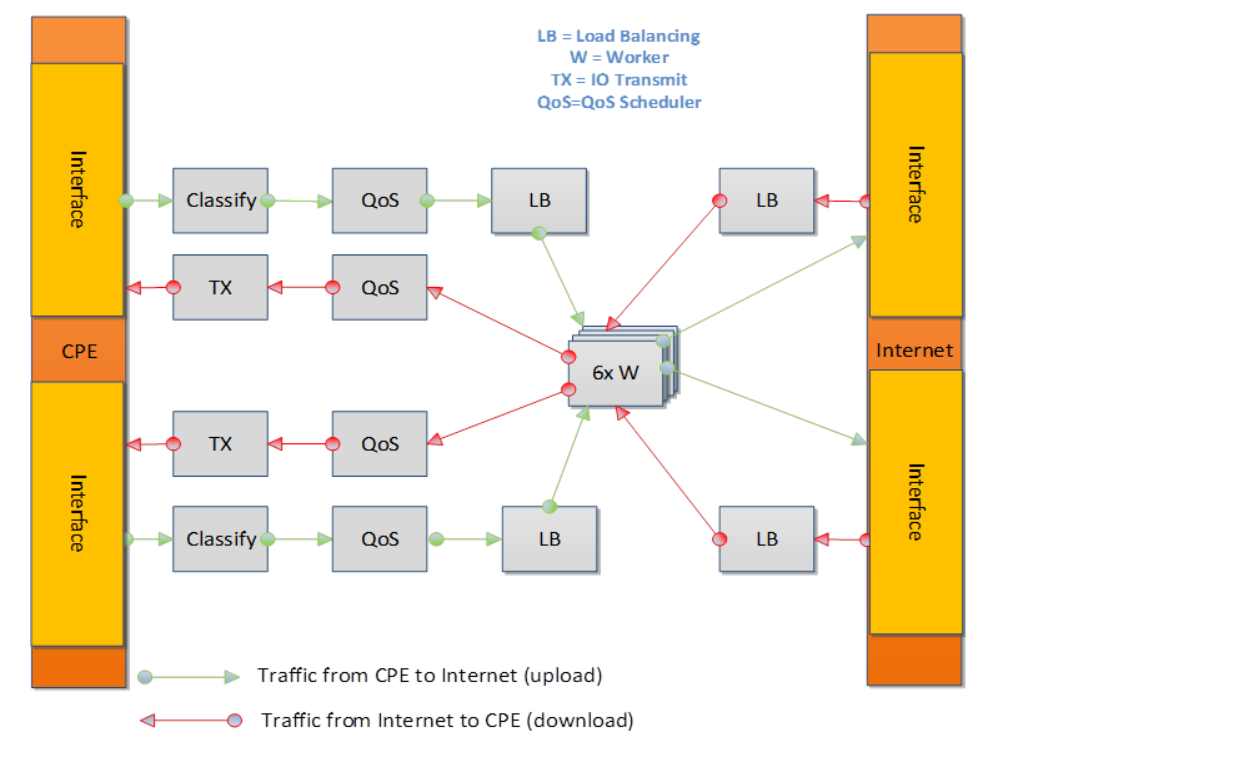
This is required for baremetal testing. It describes the IP address of the various ports, the Network devices drivers and MAC addresses and the network configuration.
In this example we will describe a 2 port configuration. This file is the same for all 2 port NSB Prox tests on the same platforms/configuration.
Now lets describe the sections of the file.
TrafficGen- This section describes the Traffic Generator node of the test configuration. The name of the nodetrafficgen_1must match the node name in theTest Description File for Baremetalmentioned earlier. The password attribute of the test needs to be configured. All other parameters can remain as default settings.interfaces- This defines the DPDK interfaces on the Traffic Generator.xe0is DPDK Port 0.lspciand `` ./dpdk-devbind.py -s`` can be used to provide the interface information.netmaskandlocal_ipshould not be changedxe1is DPDK Port 1. If more than 2 ports are required thenxe1section needs to be repeated and modified accordingly.vnf- This section describes the SUT of the test configuration. The name of the nodevnfmust match the node name in theTest Description File for Baremetalmentioned earlier. The password attribute of the test needs to be configured. All other parameters can remain as default settingsinterfaces- This defines the DPDK interfaces on the SUTxe0- Same as 3 but for theSUT.xe1- Same as 4 but for theSUTalso.routing_table- All parameters should remain unchanged.nd_route_tbl- All parameters should remain unchanged.
The grafana dashboard visually displays the results of the tests. The steps required to produce a grafana dashboard are described here.
Configure
yardstickto use influxDB to store test results. See file/etc/yardstick/yardstick.conf.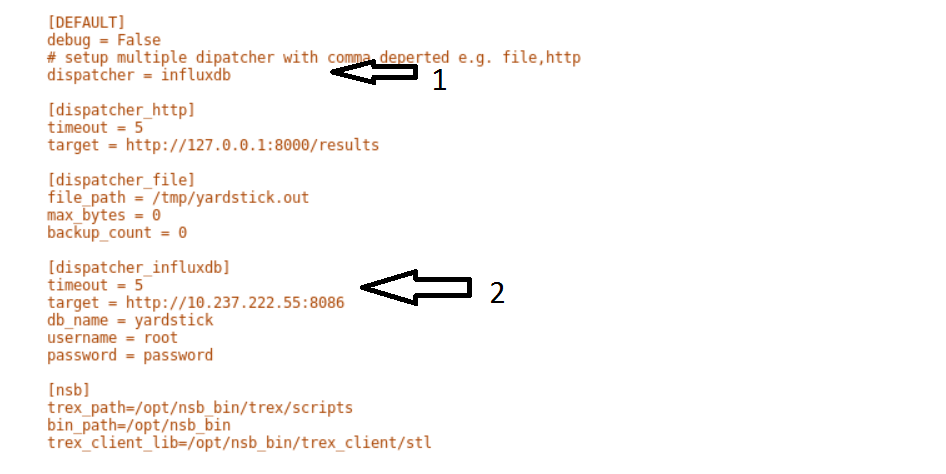
- Specify the dispatcher to use influxDB to store results.
- “target = .. ” - Specify location of influxDB to store results. “db_name = yardstick” - name of database. Do not change “username = root” - username to use to store result. (Many tests are run as root) “password = ... ” - Please set to root user password
Deploy InfludDB & Grafana. See how to Deploy InfluxDB & Grafana. See grafana deployment.
Generate the test data. Run the tests as follows .:
yardstick --debug task start tc_prox_<context>_<test>-ports.yamleg.:
yardstick --debug task start tc_prox_heat_context_l2fwd-4.yamlNow build the dashboard for the test you just ran. The easiest way to do this is to copy an existing dashboard and rename the test and the field names. The procedure to do so is described here. See opnfv grafana dashboard.
In order to run the NSB PROX test.
Install NSB on Traffic Generator node and Prox in SUT. See NSB Installation
To enter container:
docker exec -it yardstick /bin/bashInstall baremetal configuration file (POD files)
Go to location of PROX tests in container
cd /home/opnfv/repos/yardstick/samples/vnf_samples/nsut/proxInstall prox-baremetal-2.yam and prox-baremetal-4.yaml for that topology into this directory as per baremetal-config-label
Install and configure
yardstick.confcd /etc/yardstick/Modify /etc/yardstick/yardstick.conf as per yardstick-config-label
Execute the test. Eg.:
yardstick --debug task start ./tc_prox_baremetal_l2fwd-4.yaml
In order to run the NSB PROX test.
Install NSB on Openstack deployment node. See NSB Installation
To enter container:
docker exec -it yardstick /bin/bashInstall configuration file
Goto location of PROX tests in container
cd /home/opnfv/repos/yardstick/samples/vnf_samples/nsut/proxInstall and configure
yardstick.confcd /etc/yardstick/Modify /etc/yardstick/yardstick.conf as per yardstick-config-label
Execute the test. Eg.:
yardstick --debug task start ./tc_prox_heat_context_l2fwd-4.yaml
Here is a list of frequently asked questions.
If PROX NSB does not work on baremetal, problem is either in network configuration or test file.
Solution
Verify network configuration. Execute existing baremetal test.:
yardstick --debug task start ./tc_prox_baremetal_l2fwd-4.yaml
If test does not work then error in network configuration.
Check DPDK on Traffic Generator and SUT via:-
/root/dpdk-17./usertools/dpdk-devbind.pyVerify MAC addresses match
prox-baremetal-<ports>.yamlviaifconfiganddpdk-devbindCheck your eth port is what you expect. You would not be the first person to think that the port your cable is plugged into is ethX when in fact it is ethY. Use ethtool to visually confirm that the eth is where you expect.:
ethtool -p ethXA led should start blinking on port. (On both System-Under-Test and Traffic Generator)
Check cable.
Install Linux kernel network driver and ensure your ports are
boundto the driver viadpdk-devbind. Bring up port on both SUT and Traffic Generator and check connection.
On SUT and on Traffic Generator:
ifconfig ethX/enoX upCheck link
ethtool ethX/enoX
See
Link detectedifyes.... Cable is good. Ifnoyou have an issue with your cable/port.
If existing baremetal works then issue is with your test. Check the traffic generator gen_<test>-<ports>.cfg to ensure it is producing a valid packet.
Solution
Execute the test as follows:
yardstick --debug task start ./tc_prox_baremetal_l2fwd-4.yaml
Login to Traffic Generator as root.:
cd
/opt/nsb_bin/prox -f /tmp/gen_<test>-<ports>.cfg
Login to SUT as root.:
cd
/opt/nsb_bin/prox -f /tmp/handle_<test>-<ports>.cfg
Now let’s examine the Generator Output. In this case the output of gen_l2fwd-4.cfg.
Now let’s examine the output
- Indicates the amount of data successfully transmitted on Port 0
- Indicates the amount of data successfully received on port 1
- Indicates the amount of data successfully handled for port 1
It appears what is transmitted is received.
Caution
The number of packets MAY not exactly match because the ports are read in sequence.
Caution
What is transmitted on PORT X may not always be received on same port. Please check the Test scenario.
Now lets examine the SUT Output
Now lets examine the output
- What is received on 0 is transmitted on 1, received on 1 transmitted on 0, received on 2 transmitted on 3 and received on 3 transmitted on 2.
- No packets are Failed.
- No packets are discarded.
We can also dump the packets being received or transmitted via the following commands.
dump Arguments: <core id> <task id> <nb packets> Create a hex dump of <nb_packets> from <task_id> on <core_id> showing how packets have changed between RX and TX. dump_rx Arguments: <core id> <task id> <nb packets> Create a hex dump of <nb_packets> from <task_id> on <core_id> at RX dump_tx Arguments: <core id> <task id> <nb packets> Create a hex dump of <nb_packets> from <task_id> on <core_id> at TXeg.:
dump_tx 1 0 1
NSB Prox on Baremetal is a lot more forgiving than NSB Prox on Openstack. A badly formed packed may still work with PROX on Baremetal. However on Openstack the packet must be correct and all fields of the header correct. Eg A packet with an invalid Protocol ID would still work in Baremetal but this packet would be rejected by openstack.
Solution
- Check the validity of the packet.
- Use a known good packet in your test
- If using
Randomfields in the traffic generator, disable them and retry.
Solution
Execute the test as follows:
yardstick --debug task start --keep-deploy ./tc_prox_heat_context_l2fwd-4.yaml
Access docker image if required via:
docker exec -it yardstick /bin/bash
Install openstack credentials.
Depending on your openstack deployment, the location of these credentials may vary. On this platform I do this via:
scp root@10.237.222.55:/etc/kolla/admin-openrc.sh .
source ./admin-openrc.sh
List Stack details
Get the name of the Stack.
Get the Floating IP of the Traffic Generator & SUT
This generates a lot of information. Please not the floating IP of the VNF and the Traffic Generator.
From here you can see the floating IP Address of the SUT / VNF
From here you can see the floating IP Address of the Traffic Generator
Get ssh identity file
In the docker container locate the identity file.:
cd /home/opnfv/repos/yardstick/yardstick/resources/files
ls -lt
Login to SUT as Ubuntu.:
ssh -i ./yardstick_key-01029d1d ubuntu@172.16.2.158
Change to root:
sudo su
Now continue as baremetal.
Login to SUT as Ubuntu.:
ssh -i ./yardstick_key-01029d1d ubuntu@172.16.2.156
Change to root:
sudo su
Now continue as baremetal.
Solution
This usually occurs due to 2 reasons when executing an openstack test.
One or more stacks already exists and are consuming all resources. To resolve
openstack stack list
Response:
+--------------------------------------+--------------------+-----------------+----------------------+--------------+
| ID | Stack Name | Stack Status | Creation Time | Updated Time |
+--------------------------------------+--------------------+-----------------+----------------------+--------------+
| acb559d7-f575-4266-a2d4-67290b556f15 | yardstick-e05ba5a4 | CREATE_COMPLETE | 2017-12-06T15:00:05Z | None |
| 7edf21ce-8824-4c86-8edb-f7e23801a01b | yardstick-08bda9e3 | CREATE_COMPLETE | 2017-12-06T14:56:43Z | None |
+--------------------------------------+--------------------+-----------------+----------------------+--------------+
In this case 2 stacks already exist.
To remove stack:
openstack stack delete yardstick-08bda9e3
Are you sure you want to delete this stack(s) [y/N]? y
The openstack configuration quotas are too small.
The solution is to increase the quota. Use below to query existing quotas:
openstack quota show
And to set quota:
openstack quota set <resource>
Solution
If it fails due to
Missing value auth-url required for auth plugin password
Check your shell environment for Openstack variables. One of them should contain the authentication URL
OS_AUTH_URL=``https://192.168.72.41:5000/v3``
Or similar. Ensure that openstack configurations are exported.
cat /etc/kolla/admin-openrc.sh
Result
export OS_PROJECT_DOMAIN_NAME=default
export OS_USER_DOMAIN_NAME=default
export OS_PROJECT_NAME=admin
export OS_TENANT_NAME=admin
export OS_USERNAME=admin
export OS_PASSWORD=BwwSEZqmUJA676klr9wa052PFjNkz99tOccS9sTc
export OS_AUTH_URL=http://193.168.72.41:35357/v3
export OS_INTERFACE=internal
export OS_IDENTITY_API_VERSION=3
export EXTERNAL_NETWORK=yardstick-public
and visible.
If the Openstack Cli appears to hang, then verify the proxys and no_proxy are set correctly. They should be similar to
FTP_PROXY="http://proxy.ir.intel.com:911/"
HTTPS_PROXY="http://proxy.ir.intel.com:911/"
HTTP_PROXY="http://proxy.ir.intel.com:911/"
NO_PROXY="localhost,127.0.0.1,10.237.222.55,10.237.223.80,10.237.222.134,.ir.intel.com"
ftp_proxy="http://proxy.ir.intel.com:911/"
http_proxy="http://proxy.ir.intel.com:911/"
https_proxy="http://proxy.ir.intel.com:911/"
no_proxy="localhost,127.0.0.1,10.237.222.55,10.237.223.80,10.237.222.134,.ir.intel.com"
Where
- 10.237.222.55 = IP Address of deployment node
- 10.237.223.80 = IP Address of Controller node
- 10.237.222.134 = IP Address of Compute Node
- ir.intel.com = local no proxy
test-precision.This page intends to cover the documentation handling for OPNFV. OPNFV projects are expected to create a variety of document types, according to the nature of the project. Some of these are common to projects that develop/integrate features into the OPNFV platform, e.g. Installation Instructions and User/Configurations Guides. Other document types may be project-specific.
OPNFV documentation is automated and integrated into our git & gerrit toolchains.
We use RST document templates in our repositories and automatically render to HTML and PDF versions of the documents in our artifact store, our Wiki is also able to integrate these rendered documents directly allowing projects to use the revision controlled documentation process for project information, content and deliverables. Read this page which elaborates on how documentation is to be included within opnfvdocs.
All contributions to the OPNFV project are done in accordance with the OPNFV licensing requirements. Documentation in OPNFV is contributed in accordance with the Creative Commons 4.0 and the `SPDX https://spdx.org/>`_ licence. All documentation files need to be licensed using the text below. The license may be applied in the first lines of all contributed RST files:
.. This work is licensed under a Creative Commons Attribution 4.0 International License.
.. SPDX-License-Identifier: CC-BY-4.0
.. (c) <optionally add copywriters name>
These lines will not be rendered in the html and pdf files.
All documentation for your project should be structured and stored in the <repo>/docs/ directory. The documentation toolchain will
look in these directories and be triggered on events in these directories when generating documents.
A general structure is proposed for storing and handling documents that are common across many projects but also for documents that may be
project specific. The documentation is divided into three areas Release, Development and Testing. Templates for these areas can be found
under opnfvdocs/docs/templates/.
Project teams are encouraged to use templates provided by the opnfvdocs project to ensure that there is consistency across the community. Following representation shows the expected structure:
docs/
├── development
│ ├── design
│ ├── overview
│ └── requirements
├── release
│ ├── configguide
│ ├── installation
│ ├── release-notes
│ ├── scenarios
│ │ └── scenario.name
│ └── userguide
├── testing
│ ├── developer
│ └── user
└── infrastructure
├── hardware-infrastructure
├── software-infrastructure
├── continuous-integration
└── cross-community-continuous-integration
Release documentation is the set of documents that are published for each OPNFV release. These documents are created and developed
following the OPNFV release process and milestones and should reflect the content of the OPNFV release.
These documents have a master index.rst file in the <opnfvdocs> repository and extract content from other repositories.
To provide content into these documents place your <content>.rst files in a directory in your repository that matches the master document
and add a reference to that file in the correct place in the corresponding index.rst file in opnfvdocs/docs/release/.
Platform Overview: opnfvdocs/docs/release/overview
Installation Instruction: <repo>/docs/release/installation
User Guide: <repo>/docs/release/userguide
Configuration Guide: <repo>/docs/release/configguide
Release Notes: <repo>/docs/release/release-notes
Documentation created by test projects can be stored under two different sub directories /user or /developemnt. Release notes will be stored under <repo>/docs/release/release-notes
User documentation: <repo>/testing/user/
Will collect the documentation of the test projects allowing the end user to perform testing towards a OPNFV SUT
e.g. Functest/Yardstick/Vsperf/Storperf/Bottlenecks/Qtip installation/config & user guides.
Development documentation: <repo>/testing/developent/
Will collect documentation to explain how to create your own test case and leverage existing testing frameworks e.g. developer guides.
Project specific documents such as design documentation, project overview or requirement documentation can be stored under /docs/development. Links to generated documents will be dislayed under Development Documentaiton section on docs.opnfv.org. You are encouraged to establish the following basic structure for your project as needed:
Requirement Documentation: <repo>/docs/development/requirements/
Design Documentation: <repo>/docs/development/design
Project overview: <repo>/docs/development/overview
Infrastructure documentation can be stored under <repo>/docs/ folder of
corresponding infrastructure project.
Add your documentation to your repository in the folder structure and according to the templates listed above. The documentation templates you will require are available in opnfvdocs/docs/templates/ repository, you should copy the relevant templates to your <repo>/docs/ directory in your repository. For instance if you want to document userguide, then your steps shall be as follows:
git clone ssh://<your_id>@gerrit.opnfv.org:29418/opnfvdocs.git
cp -p opnfvdocs/docs/userguide/* <my_repo>/docs/userguide/
You should then add the relevant information to the template that will explain the documentation. When you are done writing, you can commit the documentation to the project repository.
git add .
git commit --signoff --all
git review
opnfvdocs/docs/submodule/ as follows: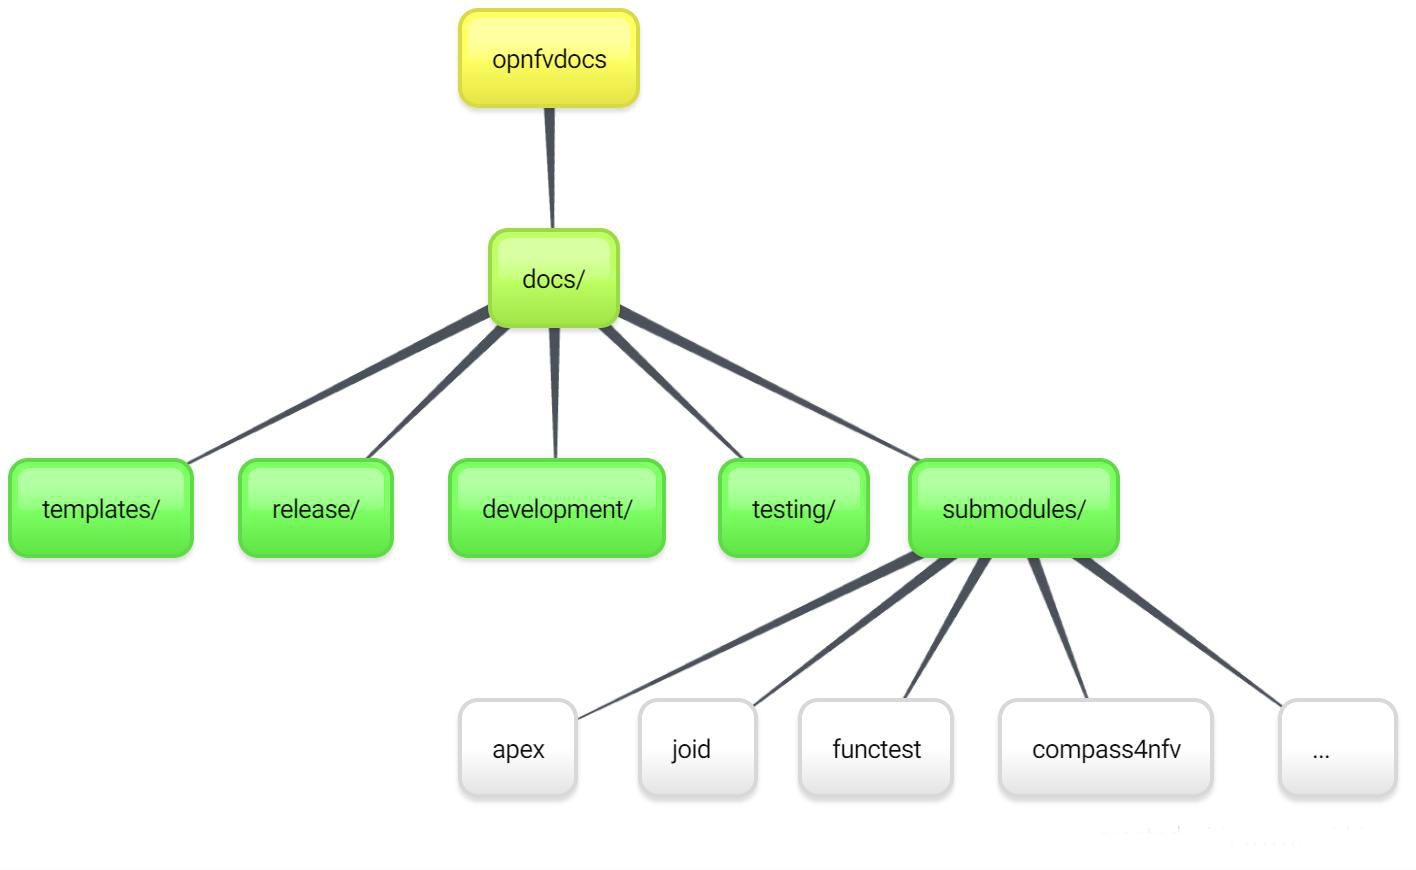
To include your project specific documentation in the composite documentation, first identify where your project documentation should be included. Say your project userguide should figure in the ‘OPNFV Userguide’, then:
vim opnfvdocs/docs/release/userguide.introduction.rst
This opens the text editor. Identify where you want to add the userguide. If the userguide is to be added to the toctree, simply include the path to it, example:
.. toctree::
:maxdepth: 1
submodules/functest/docs/userguide/index
submodules/bottlenecks/docs/userguide/index
submodules/yardstick/docs/userguide/index
<submodules/path-to-your-file>
It’s pretty common to want to reference another location in the OPNFV documentation and it’s pretty easy to do with reStructuredText. This is a quick primer, more information is in the Sphinx section on Cross-referencing arbitrary locations.
Within a single document, you can reference another section simply by:
This is a reference to `The title of a section`_
Assuming that somewhere else in the same file there a is a section title something like:
The title of a section
^^^^^^^^^^^^^^^^^^^^^^
It’s typically better to use :ref: syntax and labels to provide
links as they work across files and are resilient to sections being
renamed. First, you need to create a label something like:
.. _a-label:
The title of a section
^^^^^^^^^^^^^^^^^^^^^^
Note
The underscore (_) before the label is required.
Then you can reference the section anywhere by simply doing:
This is a reference to :ref:`a-label`
or:
This is a reference to :ref:`a section I really liked <a-label>`
Note
When using :ref:-style links, you don’t need a trailing
underscore (_).
Because the labels have to be unique, it usually makes sense to prefix
the labels with the project name to help share the label space, e.g.,
sfc-user-guide instead of just user-guide.
Once you have made these changes you need to push the patch back to the opnfvdocs team for review and integration.
git add .
git commit --signoff --all
git review
Be sure to add the project leader of the opnfvdocs project as a reviewer of the change you just pushed in gerrit.
It is recommended that all rst content is validated by doc8 standards. To validate your rst files using doc8, install doc8.
sudo pip install doc8
doc8 can now be used to check the rst files. Execute as,
doc8 --ignore D000,D001 <file>
To build whole documentation under opnfvdocs/, follow these steps:
Install virtual environment.
sudo pip install virtualenv
cd /local/repo/path/to/project
Download the OPNFVDOCS repository.
git clone https://gerrit.opnfv.org/gerrit/opnfvdocs
Change directory to opnfvdocs & install requirements.
cd opnfvdocs
sudo pip install -r etc/requirements.txt
Update submodules, build documentation using tox & then open using any browser.
cd opnfvdocs
git submodule update --init
tox -edocs
firefox docs/_build/html/index.html
Note
Make sure to run tox -edocs and not just tox.
To test how the documentation renders in HTML, follow these steps:
Install virtual environment.
sudo pip install virtualenv
cd /local/repo/path/to/project
Download the opnfvdocs repository.
git clone https://gerrit.opnfv.org/gerrit/opnfvdocs
Change directory to opnfvdocs & install requirements.
cd opnfvdocs
sudo pip install -r etc/requirements.txt
Move the conf.py file to your project folder where RST files have been kept:
mv opnfvdocs/docs/conf.py <path-to-your-folder>/
Move the static files to your project folder:
mv opnfvdocs/_static/ <path-to-your-folder>/
Build the documentation from within your project folder:
sphinx-build -b html <path-to-your-folder> <path-to-output-folder>
Your documentation shall be built as HTML inside the specified output folder directory.
Note
Be sure to remove the conf.py, the static/ files and the output folder from the <project>/docs/. This is for testing only. Only commit the rst files and related content.
Clone the opnfvdocs repository and your submodule to .gitmodules following the convention of the file
cd docs/submodules/
git submodule add https://gerrit.opnfv.org/gerrit/$reponame
git submodule init $reponame/
git submodule update $reponame/
git add .
git commit -sv
git review
git rm docs/submodules/$reponame rm -rf .git/modules/$reponame git config -f .git/config –remove-section submodule.$reponame 2> /dev/null git add . git commit -sv git review
Moving away from submodules.
At the cost of some release-time overhead, there are several benefits the transition provides projects:
To make the transition the following steps need to be taken across three repositories:
In your project repo:
Add the following files:
docs/conf.py
from docs_conf.conf import * # noqa: F401,F403
docs/conf.yaml
---
project_cfg: opnfv
project: Example
docs/requirements.txt
lfdocs-conf
sphinx_opnfv_theme
# Uncomment the following line if your project uses Sphinx to document
# HTTP APIs
# sphinxcontrib-httpdomain
tox.ini
[tox]
minversion = 1.6
envlist =
docs,
docs-linkcheck
skipsdist = true
[testenv:docs]
deps = -rdocs/requirements.txt
commands =
sphinx-build -b html -n -d {envtmpdir}/doctrees ./docs/ {toxinidir}/docs/_build/html
echo "Generated docs available in {toxinidir}/docs/_build/html"
whitelist_externals = echo
[testenv:docs-linkcheck]
deps = -rdocs/requirements.txt
commands = sphinx-build -b linkcheck -d {envtmpdir}/doctrees ./docs/ {toxinidir}/docs/_build/linkcheck
.gitignore
.tox/ docs/_build/*
docs/index.rst
If this file doesn’t exist, it will need to be created along any other missing index file for directories (release, development). Any example of the file’s content looks like this:
.. This work is licensed under a Creative Commons Attribution 4.0 International License.
.. SPDX-License-Identifier: CC-BY-4.0
.. (c) Open Platform for NFV Project, Inc. and its contributors
.. _<project-name>:
==============
<project-name>
==============
.. toctree::
:numbered:
:maxdepth: 2
release/release-notes/index
release/installation/index
release/userguide/index
scenarios/index
You can verify the build works by running:
tox -e docs
In the releng repository:
Update your project’s job file jjb/<project>/<projects-jobs.yaml with the following (taken from this guide):
---
- project:
name: PROJECT
project: PROJECT
project-name: 'PROJECT'
project-pattern: 'PROJECT'
rtd-build-url: RTD_BUILD_URL
rtd-token: RTD_TOKEN
jobs:
- '{project-name}-rtd-jobs'
You can either send an email to helpdesk in order to get a copy of RTD_BUILD_URL and RTD_TOKEN, ping aricg or bramwelt in #opnfv-docs on Freenode, or add Aric Gardner or Trevor Bramwell to your patch as a reviewer and they will pass along the token and build URL.
In the opnfvdocs repository:
Add an intersphinx link to the opnfvdocs repo configuration:
docs/conf.py
intersphinx_mapping['<project>'] = ('http://opnfv-<project>.readthedocs.io', None)
If the project exists on ReadTheDocs, and the previous build was merged in and ran, you can verify the linking is working currectly by finding the following line in the output of tox -e docs:
loading intersphinx inventory from https://opnfv-<project>.readthedocs.io/en/latest/objects.inv...
Ensure all references in opnfvdocs are using :ref: or :doc: and not directly specifying submodule files with ../submodules/<project>.
For example:
.. toctree::
../submodules/releng/docs/overview.rst
Would become:
.. toctree::
:ref:`Releng Overview <releng:overview>`
Some more examples can be seen here.
Remove the submodule from opnfvdocs, replacing <project> with your project and commit the change:
git rm docs/submodules/<project>
git commit -s
git review
The index file must relatively refence your other rst files in that directory.
Here is an example index.rst :
*******************
Documentation Title
*******************
.. toctree::
:numbered:
:maxdepth: 2
documentation-example
Document source files have to be written in reStructuredText format (rst). Each file would be build as an html page.
Here is an example source rst file :
=============
Chapter Title
=============
Section Title
=============
Subsection Title
----------------
Hello!
See http://sphinx-doc.org/rest.html .
Hint: You can add dedicated contents by using ‘only’ directive with build type (‘html’ and ‘singlehtml’) for OPNFV document. But, this is not encouraged to use since this may make different views.
.. only:: html
This line will be shown only in html version.
The verify job name is docs-verify-rtd-{branch}.
When you send document changes to gerrit, jenkins will create your documents in HTML formats (normal and single-page) to verify that new document can be built successfully. Please check the jenkins log and artifact carefully. You can improve your document even though if the build job succeeded.
The merge job name is docs-merge-rtd-{branch}.
Once the patch is merged, jenkins will automatically trigger building of the new documentation. This might take about 15 minutes while readthedocs builds the documentatation. The newly built documentation shall show up as appropriate placed in docs.opnfv.org/{branch}/path-to-file.
Contents:
This document describes how to install the Fraser release of OPNFV when using Apex as a deployment tool covering it’s limitations, dependencies and required system resources.
Fraser release of OPNFV when using Apex as a deployment tool Docs (c) by Tim Rozet (Red Hat)
Fraser release of OPNFV when using Apex as a deployment tool Docs are licensed under a Creative Commons Attribution 4.0 International License. You should have received a copy of the license along with this. If not, see <http://creativecommons.org/licenses/by/4.0/>.
This document describes the steps to install an OPNFV Fraser reference platform using the Apex installer.
The audience is assumed to have a good background in networking and Linux administration.
Apex uses Triple-O from the RDO Project OpenStack distribution as a provisioning tool. The Triple-O image based life cycle installation tool provisions an OPNFV Target System (1 or 3 controllers, 0 or more compute nodes) with OPNFV specific configuration provided by the Apex deployment tool chain.
The Apex deployment artifacts contain the necessary tools to deploy and
configure an OPNFV target system using the Apex deployment toolchain.
These artifacts offer the choice of using the Apex bootable ISO
(opnfv-apex-fraser.iso) to both install CentOS 7 and the
necessary materials to deploy or the Apex RPMs (opnfv-apex*.rpm),
and their associated dependencies, which expects installation to a
CentOS 7 libvirt enabled host. The RPM contains a collection of
configuration files, prebuilt disk images, and the automatic deployment
script (opnfv-deploy).
An OPNFV install requires a “Jump Host” in order to operate. The bootable
ISO will allow you to install a customized CentOS 7 release to the Jump Host,
which includes the required packages needed to run opnfv-deploy.
If you already have a Jump Host with CentOS 7 installed, you may choose to
skip the ISO step and simply install the (opnfv-apex*.rpm) RPMs. The RPMs
are the same RPMs included in the ISO and include all the necessary disk
images and configuration files to execute an OPNFV deployment. Either method
will prepare a host to the same ready state for OPNFV deployment.
opnfv-deploy instantiates a Triple-O Undercloud VM server using libvirt
as its provider. This VM is then configured and used to provision the
OPNFV target deployment. These nodes can be either virtual or bare metal.
This guide contains instructions for installing either method.
Apex is based on the OpenStack Triple-O project as distributed by the RDO Project. It is important to understand the basics of a Triple-O deployment to help make decisions that will assist in successfully deploying OPNFV.
Triple-O stands for OpenStack On OpenStack. This means that OpenStack will be used to install OpenStack. The target OPNFV deployment is an OpenStack cloud with NFV features built-in that will be deployed by a smaller all-in-one deployment of OpenStack. In this deployment methodology there are two OpenStack installations. They are referred to as the undercloud and the overcloud. The undercloud is used to deploy the overcloud.
The undercloud is the all-in-one installation of OpenStack that includes baremetal provisioning capability. The undercloud will be deployed as a virtual machine on a Jump Host. This VM is pre-built and distributed as part of the Apex RPM.
The overcloud is OPNFV. Configuration will be passed into undercloud and the undercloud will use OpenStack’s orchestration component, named Heat, to execute a deployment that will provision the target OPNFV nodes.
The undercloud is not Highly Available. End users do not depend on the undercloud. It is only for management purposes.
Apex will deploy three control nodes in an HA deployment. Each of these nodes will run the following services:
VM Migration is configured and VMs can be evacuated as needed or as invoked by tools such as heat as part of a monitored stack deployment in the overcloud.
OPNFV distinguishes different types of SDN controllers, deployment options, and features into “scenarios”. These scenarios are universal across all OPNFV installers, although some may or may not be supported by each installer.
The standard naming convention for a scenario is: <VIM platform>-<SDN type>-<feature>-<ha/noha>
The only supported VIM type is “OS” (OpenStack), while SDN types can be any supported SDN controller. “feature” includes things like ovs_dpdk, sfc, etc. “ha” or “noha” determines if the deployment will be highly available. If “ha” is used at least 3 control nodes are required.
Apex provides pre-built scenario files in /etc/opnfv-apex which a user can select from to deploy the desired scenario. Simply pass the desired file to the installer as a (-d) deploy setting. Read further in the Apex documentation to learn more about invoking the deploy command. Below is quick reference matrix for OPNFV scenarios supported in Apex. Please refer to the respective OPNFV Docs documentation for each scenario in order to see a full scenario description. Also, please refer to release notes for information about known issues per scenario. The following scenarios correspond to a supported <Scenario>.yaml deploy settings file:
| Scenario | Owner | Supported |
| os-nosdn-nofeature-ha | Apex | Yes |
| os-nosdn-nofeature-noha | Apex | Yes |
| os-nosdn-bar-ha | Barometer | Yes |
| os-nosdn-bar-noha | Barometer | Yes |
| os-nosdn-calipso-noha | Calipso | No |
| os-nosdn-ovs_dpdk-ha | Apex | No |
| os-nosdn-ovs_dpdk-noha | Apex | No |
| os-nosdn-fdio-ha | FDS | No |
| os-nosdn-fdio-noha | FDS | No |
| os-nosdn-kvm_ovs_dpdk-ha | KVM for NFV | No |
| os-nosdn-kvm_ovs_dpdk -noha | KVM for NFV | No |
| os-nosdn-performance-ha | Apex | No |
| os-odl-nofeature-ha | Apex | Yes |
| os-odl-nofeature-noha | Apex | Yes |
| os-odl-ovs_dpdk-ha | Apex | No |
| os-odl-ovs_dpdk-noha | Apex | No |
| os-odl-bgpvpn-ha | SDNVPN | Yes |
| os-odl-bgpvpn-noha | SDNVPN | Yes |
| os-odl-sriov-ha | Apex | No |
| os-odl-sriov-noha | Apex | No |
| os-odl-l2gw-ha | Apex | No |
| os-odl-l2gw-noha | Apex | No |
| os-odl-sfc-ha | SFC | No |
| os-odl-sfc-noha | SFC | No |
| os-odl-gluon-noha | Gluon | No |
| os-odl-csit-noha | Apex | No |
| os-odl-fdio-ha | FDS | No |
| os-odl-fdio-noha | FDS | No |
| os-odl-fdio_dvr-ha | FDS | No |
| os-odl-fdio_dvr-noha | FDS | No |
| os-onos-nofeature-ha | ONOSFW | No |
| os-onos-sfc-ha | ONOSFW | No |
| os-ovn-nofeature-noha | Apex | Yes |
The Jump Host requirements are outlined below:
Network requirements include:
*These networks can be combined with each other or all combined on the Control Plane network.
**Internal API network, by default, is collapsed with provisioning in IPv4 deployments, this is not possible with the current lack of PXE boot support and therefore the API network is required to be its own network in an IPv6 deployment.
Bare metal nodes require:
In order to execute a deployment, one must gather the following information:
The setup presumes that you have 6 or more bare metal servers already setup with network connectivity on at least 1 or more network interfaces for all servers via a TOR switch or other network implementation.
The physical TOR switches are not automatically configured from the OPNFV reference platform. All the networks involved in the OPNFV infrastructure as well as the provider networks and the private tenant VLANs needs to be manually configured.
The Jump Host can be installed using the bootable ISO or by using the
(opnfv-apex*.rpm) RPMs and their dependencies. The Jump Host should then
be configured with an IP gateway on its admin or public interface and
configured with a working DNS server. The Jump Host should also have routable
access to the lights out network for the overcloud nodes.
opnfv-deploy is then executed in order to deploy the undercloud VM and to
provision the overcloud nodes. opnfv-deploy uses three configuration files
in order to know how to install and provision the OPNFV target system.
The information gathered under section
Execution Requirements (Bare Metal Only) is put into the YAML file
/etc/opnfv-apex/inventory.yaml configuration file. Deployment options are
put into the YAML file /etc/opnfv-apex/deploy_settings.yaml. Alternatively
there are pre-baked deploy_settings files available in /etc/opnfv-apex/.
These files are named with the naming convention
os-sdn_controller-enabled_feature-[no]ha.yaml. These files can be used in place
of the /etc/opnfv-apex/deploy_settings.yaml file if one suites your
deployment needs. Networking definitions gathered under section
Network Requirements are put into the YAML file
/etc/opnfv-apex/network_settings.yaml. opnfv-deploy will boot the
undercloud VM and load the target deployment configuration into the
provisioning toolchain. This information includes MAC address, IPMI,
Networking Environment and OPNFV deployment options.
Once configuration is loaded and the undercloud is configured it will then reboot the overcloud nodes via IPMI. The nodes should already be set to PXE boot first off the admin interface. The nodes will first PXE off of the undercloud PXE server and go through a discovery/introspection process.
Introspection boots off of custom introspection PXE images. These images are designed to look at the properties of the hardware that is being booted and report the properties of it back to the undercloud node.
After introspection the undercloud will execute a Heat Stack Deployment to continue node provisioning and configuration. The nodes will reboot and PXE from the undercloud PXE server again to provision each node using Glance disk images provided by the undercloud. These disk images include all the necessary packages and configuration for an OPNFV deployment to execute. Once the disk images have been written to node’s disks the nodes will boot locally and execute cloud-init which will execute the final node configuration. This configuration is largely completed by executing a puppet apply on each node.
This section goes step-by-step on how to correctly install and provision the OPNFV target system to bare metal nodes.
sudo yum -y groupinstall "Virtualization Host"
chkconfig libvirtd on && reboot
to install virtualization support and enable libvirt on boot. If you use
the CentOS 7 DVD proceed to step 1b once the CentOS 7 with
“Virtualization Host” support is completed.installing OPNFV CentOS 7. The ISO comes prepared to be written directly to a USB drive with dd as such:
dd if=opnfv-apex.iso of=/dev/sdX bs=4M
Replace /dev/sdX with the device assigned to your usb drive. Then select the USB device as the boot media on your Jump Host
2a. When not using the OPNFV Apex ISO, install these repos:
sudo yum install https://repos.fedorapeople.org/repos/openstack/openstack-pike/rdo-release-pike-1.noarch.rpmsudo yum install epel-releasesudo curl -o /etc/yum.repos.d/opnfv-apex.repo http://artifacts.opnfv.org/apex/fraser/opnfv-apex.repoThe RDO Project release repository is needed to install OpenVSwitch, which is a dependency of opnfv-apex. If you do not have external connectivity to use this repository you need to download the OpenVSwitch RPM from the RDO Project repositories and install it with the opnfv-apex RPM. The opnfv-apex repo hosts all of the Apex dependencies which will automatically be installed when installing RPMs, but will be pre-installed with the ISO.
the Apex RPMs to the Jump Host. Download the first 3 Apex RPMs from the
OPNFV downloads page, under the TripleO RPMs
https://www.opnfv.org/software/downloads.
The following RPMs are available for installation:
** These RPMs are not yet distributed by CentOS or EPEL.
Apex has built these for distribution with Apex while CentOS and EPEL do
not distribute them. Once they are carried in an upstream channel Apex will
no longer carry them and they will not need special handling for
installation. You do not need to explicitly install these as they will be
automatically installed by installing python34-opnfv-apex when the
opnfv-apex.repo has been previously downloaded to /etc/yum.repos.d/.
Install the three required RPMs (replace <rpm> with the actual downloaded
artifact):
yum -y install <opnfv-apex.rpm> <opnfv-apex-undercloud> <python34-opnfv-apex>
/etc/resolv.conf to point to a DNS server
(8.8.8.8 is provided by Google).IPMI configuration information gathered in section
Execution Requirements (Bare Metal Only) needs to be added to the
inventory.yaml file.
Copy /usr/share/doc/opnfv/inventory.yaml.example as your inventory file
template to /etc/opnfv-apex/inventory.yaml.
The nodes dictionary contains a definition block for each baremetal host that will be deployed. 0 or more compute nodes and 1 or 3 controller nodes are required. (The example file contains blocks for each of these already). It is optional at this point to add more compute nodes into the node list. By specifying 0 compute nodes in the inventory file, the deployment will automatically deploy “all-in-one” nodes which means the compute will run along side the controller in a single overcloud node. Specifying 3 control nodes will result in a highly-available service model.
Edit the following values for each node:
mac_address: MAC of the interface that will PXE boot from undercloud
ipmi_ip: IPMI IP Address
ipmi_user: IPMI username
ipmi_password: IPMI password
pm_type: Power Management driver to use for the nodevalues: pxe_ipmitool (tested) or pxe_wol (untested) or pxe_amt (untested)
cpus: (Introspected*) CPU cores available
memory: (Introspected*) Memory available in Mib
disk: (Introspected*) Disk space available in Gb
disk_device: (Opt***) Root disk device to use for installation
arch: (Introspected*) System architecture
capabilities: (Opt**) Node’s role in deploymentvalues: profile:control or profile:compute
* Introspection looks up the overcloud node’s resources and overrides these value. You can leave default values and Apex will get the correct values when it runs introspection on the nodes.
** If capabilities profile is not specified then Apex will select node’s roles in the OPNFV cluster in a non-deterministic fashion.
*** disk_device declares which hard disk to use as the root device for installation. The format is a comma delimited list of devices, such as “sda,sdb,sdc”. The disk chosen will be the first device in the list which is found by introspection to exist on the system. Currently, only a single definition is allowed for all nodes. Therefore if multiple disk_device definitions occur within the inventory, only the last definition on a node will be used for all nodes.
Edit the 2 settings files in /etc/opnfv-apex/. These files have comments to help you customize them.
/etc/opnfv-apex/). These files are named with the naming convention
os-sdn_controller-enabled_feature-[no]ha.yaml. These files can be used in
place of the (/etc/opnfv-apex/deploy_settings.yaml) file if one suites
your deployment needs. If a pre-built deploy_settings file is chosen there
is no need to customize (/etc/opnfv-apex/deploy_settings.yaml). The
pre-built file can be used in place of the
(/etc/opnfv-apex/deploy_settings.yaml) file.opnfv-deploy¶You are now ready to deploy OPNFV using Apex!
opnfv-deploy will use the inventory and settings files to deploy OPNFV.
Follow the steps below to execute:
sudo opnfv-deploy -n network_settings.yaml
-i inventory.yaml -d deploy_settings.yaml
If you need more information about the options that can be passed to
opnfv-deploy use opnfv-deploy --help. -n
network_settings.yaml allows you to customize your networking topology.
Note it can also be useful to run the command with the --debug
argument which will enable a root login on the overcloud nodes with
password: ‘opnfvapex’. It is also useful in some cases to surround the
deploy command with nohup. For example:
nohup <deploy command> &, will allow a deployment to continue even if
ssh access to the Jump Host is lost during deployment.Deploying virtually is an alternative deployment method to bare metal, where only a single bare metal Jump Host server is required to execute deployment. This deployment type is useful when physical resources are constrained, or there is a desire to deploy a temporary sandbox environment.
With virtual deployments, two deployment options are offered. The first is a standard deployment where the Jump Host server will host the undercloud VM along with any number of OPNFV overcloud control/compute nodes. This follows the same deployment workflow as baremetal, and can take between 1 to 2 hours to complete.
The second option is to use snapshot deployments. Snapshots are saved disk images of previously deployed OPNFV upstream. These snapshots are promoted daily and contain and already deployed OPNFV environment that has passed a series of tests. The advantage of the snapshot is that it deploys in less than 10 minutes. Another major advantage is that the snapshots work on both CentOS and Fedora OS. Note: Fedora support is only tested via PIP installation at this time and not via RPM.
The virtual deployment operates almost the same way as the bare metal
deployment with a few differences mainly related to power management.
opnfv-deploy still deploys an undercloud VM. In addition to the undercloud
VM a collection of VMs (3 control nodes + 2 compute for an HA deployment or 1
control node and 0 or more compute nodes for a Non-HA Deployment) will be
defined for the target OPNFV deployment. All overcloud VMs are registered
with a Virtual BMC emulator which will service power management (IPMI)
commands. The overcloud VMs are still provisioned with the same disk images
and configuration that baremetal would use. Using 0 nodes for a virtual
deployment will automatically deploy “all-in-one” nodes which means the compute
will run along side the controller in a single overcloud node. Specifying 3
control nodes will result in a highly-available service model.
To Triple-O these nodes look like they have just built and registered the same way as bare metal nodes, the main difference is the use of a libvirt driver for the power management. Finally, the default network settings file will deploy without modification. Customizations are welcome but not needed if a generic set of network settings are acceptable.
Snapshot deployments use the same opnfv-deploy CLI as standard deployments.
The snapshot deployment will use a cache in order to store snapshots that are
downloaded from the internet at deploy time. This caching avoids re-downloading
the same artifact between deployments. The snapshot deployment recreates the same
network and libvirt setup as would have been provisioned by the Standard
deployment, with the exception that there is no undercloud VM. The snapshot
deployment will give the location of the RC file to use in order to interact
with the Overcloud directly from the jump host.
Snapshots come in different topology flavors. One is able to deploy either HA (3 Control, 2 Computes, no-HA (1 Control, 2 Computes), or all-in-one (1 Control/Compute. The snapshot deployment itself is always done with the os-odl-nofeature-* scenario.
This section goes step-by-step on how to correctly install and provision the OPNFV target system to VM nodes.
In scenarios where advanced performance options or features are used, such as using huge pages with nova instances, DPDK, or iommu; it is required to enabled nested KVM support. This allows hardware extensions to be passed to the overcloud VMs, which will allow the overcloud compute nodes to bring up KVM guest nova instances, rather than QEMU. This also provides a great performance increase even in non-required scenarios and is recommended to be enabled.
During deployment the Apex installer will detect if nested KVM is enabled,
and if not, it will attempt to enable it; while printing a warning message
if it cannot. Check to make sure before deployment that Nested
Virtualization is enabled in BIOS, and that the output of cat
/sys/module/kvm_intel/parameters/nested returns “Y”. Also verify using
lsmod that the kvm_intel module is loaded for x86_64 machines, and
kvm_amd is loaded for AMD64 machines.
Follow the instructions in the Install Bare Metal Jump Host section.
opnfv-deploy for Standard Deployment¶You are now ready to deploy OPNFV!
opnfv-deploy has virtual deployment capability that includes all of
the configuration necessary to deploy OPNFV with no modifications.
If no modifications are made to the included configurations the target environment will deploy with the following architecture:
- 1 undercloud VM
- The option of 3 control and 2 or more compute VMs (HA Deploy / default) or 1 control and 0 or more compute VMs (Non-HA deploy)
- 1-5 networks: provisioning, private tenant networking, external, storage and internal API. The API, storage and tenant networking networks can be collapsed onto the provisioning network.
Follow the steps below to execute:
sudo opnfv-deploy -v [ --virtual-computes n ]
[ --virtual-cpus n ] [ --virtual-ram n ]
-n network_settings.yaml -d deploy_settings.yaml
Note it can also be useful to run the command with the --debug
argument which will enable a root login on the overcloud nodes with
password: ‘opnfvapex’. It is also useful in some cases to surround the
deploy command with nohup. For example:
nohup <deploy command> &, will allow a deployment to continue even if
ssh access to the Jump Host is lost during deployment. By specifying
--virtual-computes 0, the deployment will proceed as all-in-one.opnfv-deploy for Snapshot Deployment¶Deploying snapshots requires enough disk space to cache snapshot archives, as well as store VM disk images per deployment. The snapshot cache directory can be configured at deploy time. Ensure a directory is used on a partition with enough space for about 20GB. Additionally, Apex will attempt to detect the default libvirt storage pool on the jump host. This is typically ‘/var/lib/libvirt/images’. On default CentOS installations, this path will resolve to the /root partition, which is only around 50GB. Therefore, ensure that the path for the default storage pool has enough space to hold the VM backing storage (approx 4GB per VM). Note, each Overcloud VM disk size is set to 40GB, however Libvirt grows these disks dynamically. Due to this only 4GB will show up at initial deployment, but the disk may grow from there up to 40GB.
The new arguments to deploy snapshots include:
- –snapshot: Enables snapshot deployments
- –snap-cache: Indicates the directory to use for caching artifacts
An example deployment command is:
In the above example, several of the Standard Deployment arguments are still used to deploy snapshots:
- -d: Deploy settings are used to determine OpenStack version of snapshots to use as well as the topology
- –virtual-computes - When set to 0, it indicates to Apex to use an all-in-one snapshot
- –no-fetch - Can be used to disable fetching latest snapshot artifact from upstream and use the latest found in –snap-cache
To verify the set you can follow the instructions in the Verifying the Setup section.
In addition to deploying with OPNFV tested artifacts included in the opnfv-apex-undercloud and opnfv-apex RPMs, it is now possible to deploy directly from upstream artifacts. Essentially this deployment pulls the latest RDO overcloud and undercloud artifacts at deploy time. This option is useful for being able to deploy newer versions of OpenStack that are not included with this release, and offers some significant advantages for some users. Please note this feature is currently in beta for the Fraser release and will be fully supported in the next OPNFV release.
In addition to being able to install newer versions of OpenStack, the upstream deployment option allows the use of a newer version of TripleO, which provides overcloud container support. Therefore when deploying from upstream with an OpenStack version newer than Pike, every OpenStack service (also OpenDaylight) will be running as a docker container. Furthermore, deploying upstream gives the user the flexibility of including any upstream OpenStack patches he/she may need by simply adding them into the deploy settings file. The patches will be applied live during deployment.
This section goes step-by-step on how to correctly install and provision the OPNFV target system using a direct upstream deployment.
With upstream deployments it is required to have internet access. In addition, the upstream artifacts will be cached under the root partition of the jump host. It is required to at least have 10GB free space in the root partition in order to download and prepare the cached artifacts.
Some deploy settings files are already provided which have been tested by the Apex team. These include (under /etc/opnfv-apex/):
- os-nosdn-queens_upstream-noha.yaml
- os-nosdn-master_upstream-noha.yaml
- os-odl-queens_upstream-noha.yaml
- os-odl-master_upstream-noha.yaml
Each of these scenarios has been tested by Apex over the Fraser release, but none are guaranteed to work as upstream is a moving target and this feature is relatively new. Still it is the goal of the Apex team to provide support and move to an upstream based deployments in the future, so please file a bug when encountering any issues.
With upstream deployments it is possible to include any pending patch in OpenStack gerrit with the deployment. These patches are applicable to either the undercloud or the overcloud. This feature is useful in the case where a developer or user desires to pull in an unmerged patch for testing with a deployment. In order to use this feature, include the following in the deploy settings file, under “global_params” section:
patches:
undercloud:
- change-id: <gerrit change id>
project: openstack/<project name>
branch: <branch where commit is proposed>
overcloud:
- change-id: <gerrit change id>
project: openstack/<project name>
branch: <branch where commit is proposed>
You may include as many patches as needed. If the patch is already merged or abandoned, then it will not be included in the deployment.
opnfv-deploy¶Deploying is similar to the typical method used for baremetal and virtual
deployments with the addition of a few new arguments to the opnfv-deploy
command. In order to use an upstream deployment, please use the --upstream
argument. Also, the artifacts for each upstream deployment are only
downloaded when a newer version is detected upstream. In order to explicitly
disable downloading new artifacts from upstream if previous artifacts are
already cached, please use the --no-fetch argument.
Upstream deployments will use a containerized overcloud. These containers are
Docker images built by the Kolla project. The Containers themselves are run
and controlled through Docker as root user. In order to access logs for each
service, examine the ‘/var/log/containers’ directory or use the docker logs
<container name>. To see a list of services running on the node, use the
docker ps command. Each container uses host networking, which means that
the networking of the overcloud node will act the same exact way as a
traditional deployment. In order to attach to a container, use this command:
docker exec -it <container name/id> bin/bash. This will login to the
container with a bash shell. Note the containers do not use systemd, unlike
the traditional deployment model and are instead started as the first process
in the container. To restart a service, use the docker restart <container>
command.
Once the deployment has finished, the OPNFV deployment can be accessed via the undercloud node. From the Jump Host ssh to the undercloud host and become the stack user. Alternatively ssh keys have been setup such that the root user on the Jump Host can ssh to undercloud directly as the stack user. For convenience a utility script has been provided to look up the undercloud’s ip address and ssh to the undercloud all in one command. An optional user name can be passed to indicate whether to connect as the stack or root user. The stack user is default if a username is not specified.
opnfv-util undercloud rootsu - stackOnce connected to undercloud as the stack user look for two keystone files that can be used to interact with the undercloud and the overcloud. Source the appropriate RC file to interact with the respective OpenStack deployment.
source stackrc (undercloud)source overcloudrc (overcloud / OPNFV)The contents of these files include the credentials for the administrative user for undercloud and OPNFV respectively. At this point both undercloud and OPNFV can be interacted with just as any OpenStack installation can be. Start by listing the nodes in the undercloud that were used to deploy the overcloud.
source stackrcopenstack server listThe control and compute nodes will be listed in the output of this server list command. The IP addresses that are listed are the control plane addresses that were used to provision the nodes. Use these IP addresses to connect to these nodes. Initial authentication requires using the user heat-admin.
ssh heat-admin@192.0.2.7To begin creating users, images, networks, servers, etc in OPNFV source the overcloudrc file or retrieve the admin user’s credentials from the overcloudrc file and connect to the web Dashboard.
You are now able to follow the OpenStack Verification section.
Once connected to the OPNFV Dashboard make sure the OPNFV target system is working correctly:
http://download.cirros-cloud.net/0.3.5/cirros-0.3.5-x86_64-disk.img.172.16.1.0/24, click Next.Congratulations you have successfully installed OPNFV!
This section aims to explain in more detail the steps that Apex follows to make a deployment. It also tries to explain possible issues you might find in the process of building or deploying an environment.
After installing the Apex RPMs in the Jump Host, some files will be located around the system.
As mentioned earlier in this guide, the Undercloud VM will be in charge of deploying OPNFV (Overcloud VMs). Since the Undercloud is an all-in-one OpenStack deployment, it will use Glance to manage the images that will be deployed as the Overcloud.
So whatever customization that is done to the images located in the jumpserver (/var/opt/opnfv/images) will be uploaded to the undercloud and consequently, to the overcloud.
Make sure, the customization is performed on the right image. For example, if I virt-customize the following image overcloud-full-opendaylight.qcow2, but then I deploy OPNFV with the following command:
sudo opnfv-deploy -n network_settings.yaml -d /etc/opnfv-apex/os-onos-nofeature-ha.yaml
It will not have any effect over the deployment, since the customized image is the opendaylight one, and the scenario indicates that the image to be deployed is the overcloud-full-onos.qcow2.
Post-deployment scripts will perform some configuration tasks such ssh-key injection, network configuration, NATing, OpenVswitch creation. It will take care of some OpenStack tasks such creation of endpoints, external networks, users, projects, etc.
If any of these steps fail, the execution will be interrupted. In some cases, the interruption occurs at very early stages, so a new deployment must be executed. However, some other cases it could be worth it to try to debug it.
There is not external connectivity from the overcloud nodes:
Post-deployment scripts will configure the routing, nameservers and a bunch of other things between the overcloud and the undercloud. If local connectivity, like pinging between the different nodes, is working fine, script must have failed when configuring the NAT via iptables. The main rules to enable external connectivity would look like these:
iptables -t nat -A POSTROUTING -o eth0 -j MASQUERADEiptables -t nat -A POSTROUTING -s ${external_cidr} -o eth0 -j MASQUERADEiptables -A FORWARD -i eth2 -j ACCEPTiptables -A FORWARD -s ${external_cidr} -m state --state ESTABLISHED,RELATED -j ACCEPTservice iptables saveThese rules must be executed as root (or sudo) in the undercloud machine.
When a user deploys a scenario that starts with os-odl*:
OpenDaylight (ODL) SDN controller will be deployed and integrated with OpenStack. ODL will run as a systemd service, and can be managed as as a regular service:
systemctl start/restart/stop opendaylight.service
This command must be executed as root in the controller node of the overcloud, where OpenDaylight is running. ODL files are located in /opt/opendaylight. ODL uses karaf as a Java container management system that allows the users to install new features, check logs and configure a lot of things. In order to connect to Karaf’s console, use the following command:
opnfv-util opendaylight
This command is very easy to use, but in case it is not connecting to Karaf, this is the command that is executing underneath:
ssh -p 8101 -o UserKnownHostsFile=/dev/null -o StrictHostKeyChecking=no karaf@localhost
Of course, localhost when the command is executed in the overcloud controller, but you use its public IP to connect from elsewhere.
This section will try to gather different type of failures, the root cause and some possible solutions or workarounds to get the process continued.
I can see in the output log a post-deployment error messages:
Heat resources will apply puppet manifests during this phase. If one of these processes fail, you could try to see the error and after that, re-run puppet to apply that manifest. Log into the controller (see verification section for that) and check as root /var/log/messages. Search for the error you have encountered and see if you can fix it. In order to re-run the puppet manifest, search for “puppet apply” in that same log. You will have to run the last “puppet apply” before the error. And It should look like this:
FACTER_heat_outputs_path="/var/run/heat-config/heat-config-puppet/5b4c7a01-0d63-4a71-81e9-d5ee6f0a1f2f" FACTER_fqdn="overcloud-controller-0.localdomain.com" \ FACTER_deploy_config_name="ControllerOvercloudServicesDeployment_Step4" puppet apply --detailed-exitcodes -l syslog -l console \ /var/lib/heat-config/heat-config-puppet/5b4c7a01-0d63-4a71-81e9-d5ee6f0a1f2f.ppAs a comment, Heat will trigger the puppet run via os-apply-config and it will pass a different value for step each time. There is a total of five steps. Some of these steps will not be executed depending on the type of scenario that is being deployed.
Please report bugs via the OPNFV Apex JIRA
page. You may now use the log collecting utility provided by Apex in order
to gather all of the logs from the overcloud after a deployment failure. To
do this please use the opnfv-pyutil --fetch-logs command. The log file
location will be displayed at the end of executing the script. Please attach
this log to the JIRA Bug.
All Apex and “common” entities are protected by the Apache 2.0 License.
Upstream OpenDaylight provides a number of packaging and deployment options meant for consumption by downstream projects like OPNFV.
Currently, OPNFV Apex uses OpenDaylight’s Puppet module, which in turn depends on OpenDaylight’s RPM.
| Authors: | Tim Rozet (trozet@redhat.com) |
|---|---|
| Authors: | Dan Radez (dradez@redhat.com) |
| Version: | 6.0 |
This High Availability Requirement Analysis Document is used for eliciting High Availability Requirements of OPNFV. The document will refine high-level High Availability goals, into detailed HA mechanism design. And HA mechanisms are related with potential failures on different layers in OPNFV. Moreover, this document can be used as reference for HA Testing scenarios design. A requirement engineering model KAOS is used in this document.
The following concepts in KAOS will be used in the diagrams of this document.
Figure 1 shows how these concepts are displayed in a KAOS diagram.
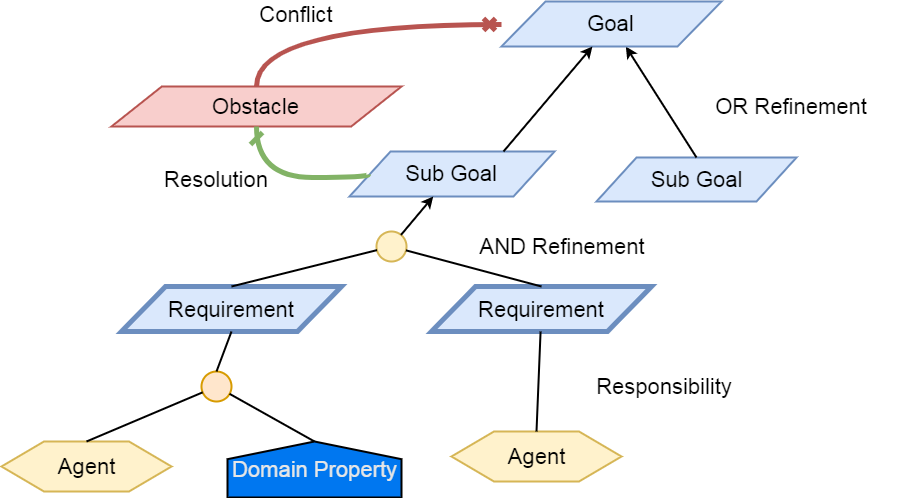
Fig 1. A KAOS Sample Diagram
The Final Goal of OPNFV High Availability is to provide high available VNF services. And the following objectives are required to meet:
Service Level Agreements of OPNFV HA are mainly focused on time constraints of service outage, failure detection, failure recovery. The following table outlines the SLA metrics of different service availability levels described in ETSI GS NFV-REL 001 V1.1.1 (2015-01). Table 1 shows time constraints of different Service Availability Levels. In this document, SAL1 is the default benchmark value required to meet.
Table 1. Time Constraints for Different Service Availability Levels
| Service Availability Level | Failure Detection Time | Failure Recovery Time |
|---|---|---|
| SAL1 | <1s | 5-6s |
| SAL2 | <5s | 10-15s |
| SAL3 | <10s | 20-25s |
Figure 2 shows the overall decomposition of high availability goals. The high availability of VNF Services can be refined to high availability of VNFs, MANO, and the NFVI where VNFs are deployed; the high availability of NFVI Service can be refined to high availability of Virtual Compute Instances, Virtual Storage and Virtual Network Services; the high availability of virtual instance is either the high availability of containers or the high availability of VMs, and these high availability goals can be further decomposed by how the NFV environment is deployed.
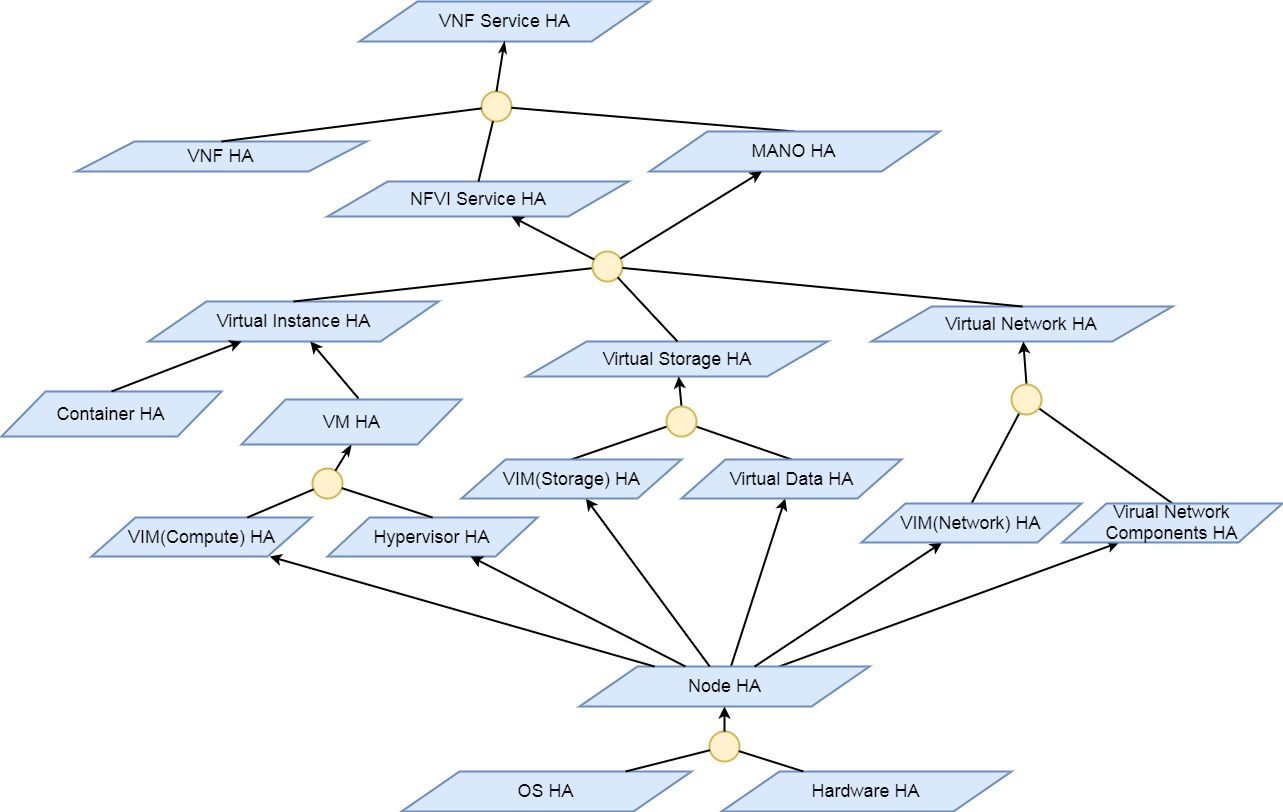
Fig 2. Overall HA Analysis of OPNFV
Thus the high availability requirement of VNF services can be classified into high availability requirements on different layers in OPNFV. The following layers are mainly discussed in this document:
The next section will illustrate detailed analysis of HA requirements on these layers.
The VIM in the NFV reference architecture contains different components of Openstack, SDN controllers and other virtual resource controllers. VIM components can be classified into three types:
Table 2 shows the potential faults that may happen on VIM layer. Currently the main focus of VIM HA is the service crash of VIM components, which may occur on all types of VIM components. To prevent VIM services from being unavailable, Active/Active Redundancy, Active/Passive Redundancy and Message Queue are used for different types of VIM components, as is shown in figure 3.
Table 2. Potential Faults in VIM level
| Service | Fault | Description | Severity |
|---|---|---|---|
| General | Service Crash | The processes of a service crashed unnormally. | Critical |
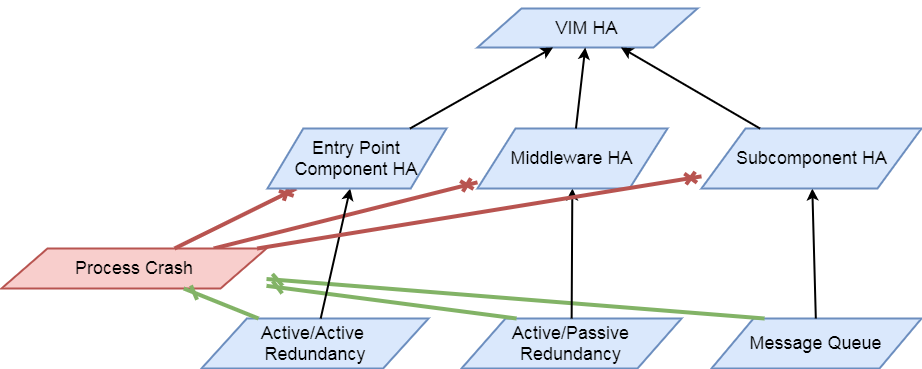
Fig 3. VIM HA Analysis
Active/Active Redundancy manages both the main and redundant systems concurrently. If there is a failure happens on a component, the backups are already online and users are unlikely to notice that the failed VIM component is under fixing. A typical Active/Active Redundancy will have redundant instances, and these instances are load balanced via a virtual IP address and a load balancer such as HAProxy.
When one of the redundant VIM component fails, the load balancer should be aware of the instance failure, and then isolate the failed instance from being called until it is recovered. The requirement decomposition of Active/Active Redundancy is shown in Figure 4.
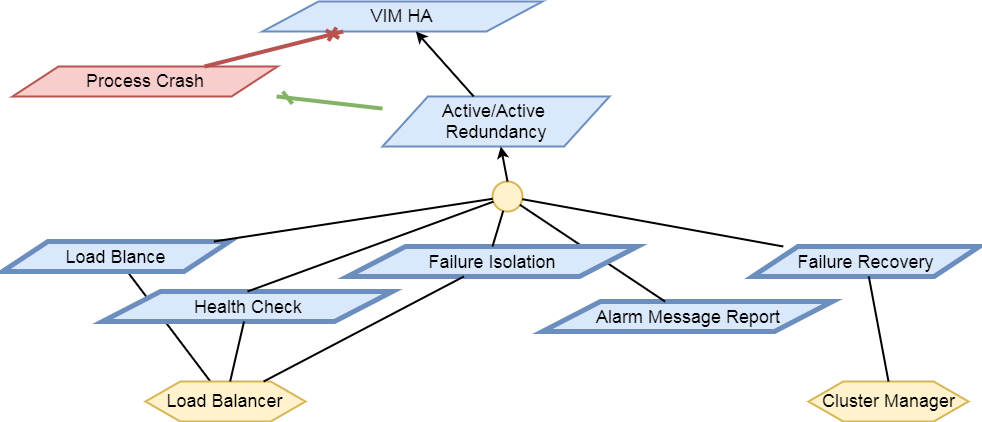
Fig 4. Active/Active Redundancy Requirement Decomposition
The following requirements are elicited for VIM Active/Active Redundancy:
[Req 5.4.1] Redundant VIM components should be load balanced by a load balancer.
[Req 5.4.2] The load balancer should check the health status of VIM component instances.
[Req 5.4.3] The load balancer should isolate the failed VIM component instance until it is recovered.
[Req 5.4.4] The alarm information of VIM component failure should be reported.
[Req 5.4.5] Failed VIM component instances should be recovered by a cluster manager.
Table 3 shows the current VIM components using Active/Active Redundancy and the corresponding HA test cases to verify them.
Table 3. VIM Components using Active/Active Redundancy
| Component | Description | Related HA Test Case |
|---|---|---|
| nova-api | endpoint component of Openstack Compute Service Nova | yardstick_tc019 |
| nova-novncproxy | server daemon that serves the Nova noVNC Websocket Proxy service, which provides a websocket proxy that is compatible with OpenStack Nova noVNC consoles. | |
| neeutron-server | endpoint component of Openstack Networking Service Neutron | yardstick_tc045 |
| keystone | component of Openstack Identity Service Service Keystone | yardstick_tc046 |
| glance-api | endpoint component of Openstack Image Service Glance | yardstick_tc047 |
| glance-registry | server daemon that serves image metadata through a REST-like API. | |
| cinder-api | endpoint component of Openstack Block Storage Service Service Cinder | yardstick_tc048 |
| swift-proxy | endpoint component of Openstack Object Storage Swift | yardstick_tc049 |
| horizon | component of Openstack Dashboard Service Horizon | |
| heat-api | endpoint component of Openstack Stack Service Heat | |
| mysqld | database service of VIM components |
Active/Passive Redundancy maintains a redundant instance that can be brought online when the active service fails. A typical Active/Passive Redundancy maintains replacement resources that can be brought online when required. Requests are handled using a virtual IP address (VIP) that facilitates returning to service with minimal reconfiguration. A cluster manager (such as Pacemaker or Corosync) monitors these components, bringing the backup online as necessary.
When the main instance of a VIM component is failed, the cluster manager should be aware of the failure and switch the backup instance online. And the failed instance should also be recovered to another backup instance. The requirement decomposition of Active/Passive Redundancy is shown in Figure 5.
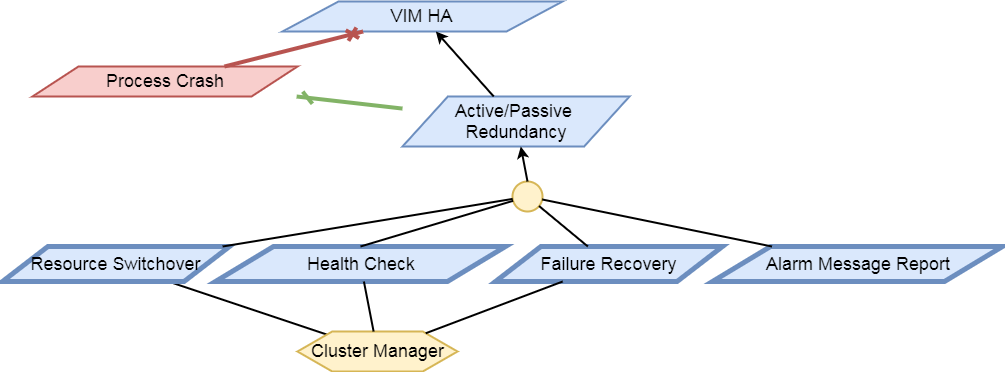
Fig 5. Active/Passive Redundancy Requirement Decomposition
The following requirements are elicited for VIM Active/Passive Redundancy:
[Req 5.4.6] The cluster manager should replace the failed main VIM component instance with a backup instance.
[Req 5.4.7] The cluster manager should check the health status of VIM component instances.
[Req 5.4.8] Failed VIM component instances should be recovered by the cluster manager.
[Req 5.4.9] The alarm information of VIM component failure should be reported.
Table 4 shows the current VIM components using Active/Passive Redundancy and the corresponding HA test cases to verify them.
Table 4. VIM Components using Active/Passive Redundancy
| Component | Description | Related HA Test Case |
|---|---|---|
| haproxy | load balancer component of VIM components | yardstick_tc053 |
| rabbitmq-server | messaging queue service of VIM components | yardstick_tc056 |
| corosync | cluster management component of VIM components | yardstick_tc057 |
Message Queue provides an asynchronous communication protocol. In Openstack, some projects ( like Nova, Cinder) use Message Queue to call their sub components. Although Message Queue itself is not an HA mechanism, how it works ensures the high availability when redundant components subscribe to the Message Queue. When a VIM sub component fails, since there are other redundant components are subscribing to the Message Queue, requests still can be processed. And fault isolation can also be archived since failed components won’t fetch requests actively. Also, the recovery of failed components is required. Figure 6 shows the requirement decomposition of Message Queue.
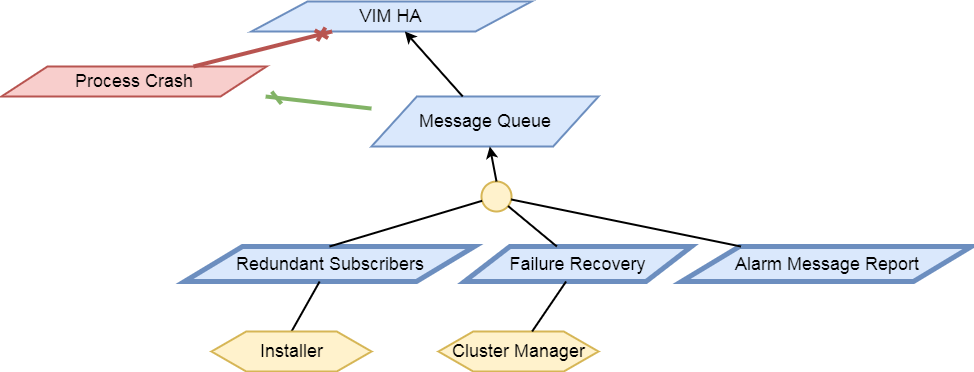
Fig 6. Message Queue Redundancy Requirement Decomposition
The following requirements are elicited for Message Queue:
[Req 5.4.10] Redundant component instances should subscribe to the Message Queue, which is implemented by the installer.
[Req 5.4.11] Failed VIM component instances should be recovered by the cluster manager.
[Req 5.4.12] The alarm information of VIM component failure should be reported.
Table 5 shows the current VIM components using Message Queue and the corresponding HA test cases to verify them.
Table 5. VIM Components using Messaging Queue
| Component | Description | Related HA Test Case |
|---|---|---|
| nova-scheduler | Openstack compute component determines how to dispatch compute requests | |
| nova-cert | Openstack compute component that serves the Nova Cert service for X509 certificates. Used to generate certificates for euca-bundle-image. | |
| nova-conductor | server daemon that serves the Nova Conductor service, which provides coordination and database query support for Nova. | |
| nova-compute | Handles all processes relating to instances (guest vms). nova-compute is responsible for building a disk image, launching it via the underlying virtualization driver, responding to calls to check its state, attaching persistent storage, and terminating it. | |
| nova-consoleauth | Openstack compute component for Authentication of nova consoles. | |
| cinder-scheduler | Openstack volume storage component decides on placement for newly created volumes and forwards the request to cinder-volume. | |
| cinder-volume | Openstack volume storage component receives volume management requests from cinder-api and cinder-scheduler, and routes them to storage backends using vendor-supplied drivers. | |
| heat-engine | Openstack Heat project server with an internal RPC api called by the heat-api server. |
Providing carrier grade Service Assurance is critical in the network transformation to a software defined and virtualized network (NFV). Medium-/large-scale cloud environments account for between hundreds and hundreds of thousands of infrastructure systems. It is vital to monitor systems for malfunctions that could lead to users application service disruption and promptly react to these fault events to facilitate improving overall system performance. As the size of infrastructure and virtual resources grow, so does the effort of monitoring back-ends. SFQM aims to expose as much useful information as possible off the platform so that faults and errors in the NFVI can be detected promptly and reported to the appropriate fault management entity.
The OPNFV platform (NFVI) requires functionality to:
Examples of local measurable QoS factors for Traffic Monitoring which impact both Quality of Experience and five 9’s availability would be (using Metro Ethernet Forum Guidelines as reference):
Other KPIs such as Call drops, Call Setup Success Rate, Call Setup time etc. are measured by the VNF.
In addition to Traffic Monitoring, the NFVI must also support Performance Monitoring of the physical interfaces themselves (e.g. NICs), i.e. an ability to monitor and trace errors on the physical interfaces and report them.
All these traffic statistics for Traffic and Performance Monitoring must be measured in-service and must be capable of being reported by standard Telco mechanisms (e.g. SNMP traps), for potential enforcement actions.
The scope of the project is to provide interfaces to support monitoring of the NFVI. The project will develop plugins for telemetry frameworks to enable the collection of platform stats and events and relay gathered information to fault management applications or the VIM. The scope is limited to collecting/gathering the events and stats and relaying them to a relevant endpoint. The project will not enforce or take any actions based on the gathered information.
NOTE: The SFQM project has been replaced by Barometer. The output of the project will provide interfaces and functions to support monitoring of Packet Latency and Network Interfaces while the VNF is in service.
The DPDK interface/API will be updated to support:
collectd will be updated to support the exposure of DPDK metrics and events.
Specific testing and integration will be carried out to cover:
The following list of features and functionality will be developed:
The scope of the project involves developing the relavant DPDK APIs, OVS APIs, sample applications, as well as the utilities in collectd to export all the relavent information to a telemetry and events consumer.
VNF specific processing, Traffic Monitoring, Performance Monitoring and Management Agent are out of scope.
The Proposed Interface counters include:
The Proposed Packet Latency Monitor include:
Support for failover of DPDK enabled cores is also out of scope of the current proposal. However, this is an important requirement and must-have functionality for any DPDK enabled framework in the NFVI. To that end, a second phase of this project will be to implement DPDK Keep Alive functionality that would address this and would report to a VNF-level Failover and High Availability mechanism that would then determine what actions, including failover, may be triggered.
In reality many VNFs will have an existing performance or traffic monitoring utility used to monitor VNF behavior and report statistics, counters, etc.
The consumption of performance and traffic related information/events provided by this project should be a logical extension of any existing VNF/NFVI monitoring framework. It should not require a new framework to be developed. We do not see the Barometer gathered metrics and evetns as major additional effort for monitoring frameworks to consume; this project would be sympathetic to existing monitoring frameworks. The intention is that this project represents an interface for NFVI monitoring to be used by higher level fault management entities (see below).
Allowing the Barometer metrics and events to be handled within existing telemetry frameoworks makes it simpler for overall interfacing with higher level management components in the VIM, MANO and OSS/BSS. The Barometer proposal would be complementary to the Doctor project, which addresses NFVI Fault Management support in the VIM, and the VES project, which addresses the integration of VNF telemetry-related data into automated VNF management systems. To that end, the project committers and contributors for the Barometer project wish to collaborate with the Doctor and VES projects to facilitate this.
collectd is a daemon which collects system performance statistics periodically and provides a variety of mechanisms to publish the collected metrics. It supports more than 90 different input and output plugins. Input plugins retrieve metrics and publish them to the collectd deamon, while output plugins publish the data they receive to an end point. collectd also has infrastructure to support thresholding and notification.
Within collectd notifications and performance data are dispatched in the same way. There are producer plugins (plugins that create notifications/metrics), and consumer plugins (plugins that receive notifications/metrics and do something with them).
Statistics in collectd consist of a value list. A value list includes:
Host, plugin, plugin instance, type and type instance uniquely identify a collectd value.
Values lists are often accompanied by data sets that describe the values in more detail. Data sets consist of:
Types in collectd are defined in types.db. Examples of types in types.db:
bitrate value:GAUGE:0:4294967295
counter value:COUNTER:U:U
if_octets rx:COUNTER:0:4294967295, tx:COUNTER:0:4294967295
In the example above if_octets has two data sources: tx and rx.
Notifications in collectd are generic messages containing:
This section will discuss the Barometer features that were integrated with DPDK.
This section will discuss the Barometer features that enable Measuring Telco Traffic and Performance KPIs.
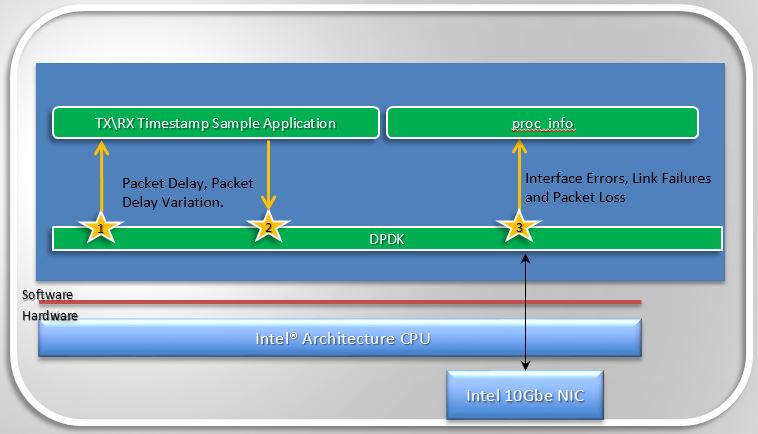
Measuring Telco Traffic and Performance KPIs
With the features Barometer enabled in DPDK to enable measuring Telco traffic and performance KPIs, we can now retrieve NIC statistics including error stats and relay them to a DPDK user. The next step is to enable monitoring of the DPDK interfaces based on the stats that we are retrieving from the NICs, by relaying the information to a higher level Fault Management entity. To enable this Barometer has been enabling a number of plugins for collectd.
SFQM aims to enable fault detection within DPDK, the very first feature to meet this goal is the DPDK Keep Alive Sample app that is part of DPDK 2.2.
DPDK Keep Alive or KA is a sample application that acts as a heartbeat/watchdog for DPDK packet processing cores, to detect application thread failure. The application supports the detection of ‘failed’ DPDK cores and notification to a HA/SA middleware. The purpose is to detect Packet Processing Core fails (e.g. infinite loop) and ensure the failure of the core does not result in a fault that is not detectable by a management entity.
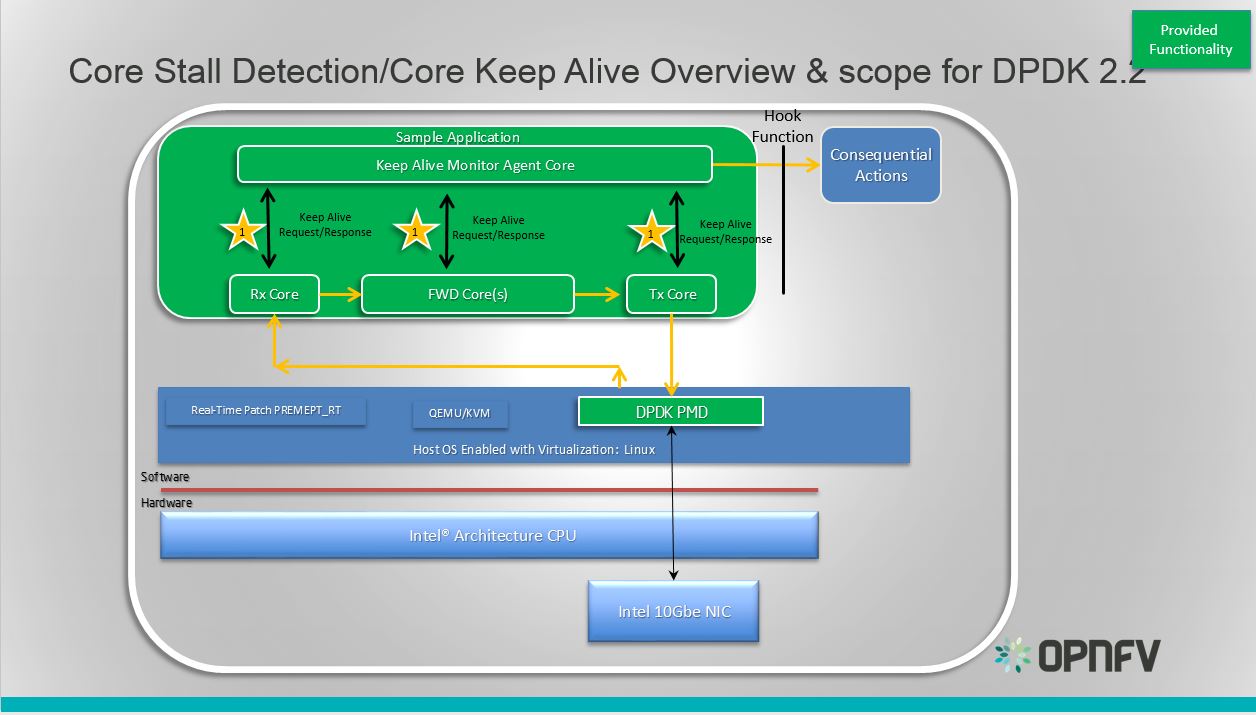
DPDK Keep Alive Sample Application
Essentially the app demonstrates how to detect ‘silent outages’ on DPDK packet processing cores. The application can be decomposed into two specific parts: detection and notification.
This section provides some explanation of the The Keep-Alive/’Liveliness’ conceptual scheme as well as the DPDK Keep Alive App. The initialization and run-time paths are very similar to those of the L2 forwarding application (see L2 Forwarding Sample Application (in Real and Virtualized Environments) for more information).
There are two types of cores: a Keep Alive Monitor Agent Core (master DPDK core) and Worker cores (Tx/Rx/Forwarding cores). The Keep Alive Monitor Agent Core will supervise worker cores and report any failure (2 successive missed pings). The Keep-Alive/’Liveliness’ conceptual scheme is:
Note: Only the worker cores state is monitored. There is no mechanism or agent to monitor the Keep Alive Monitor Agent Core.
The following section provides some explanation of the code aspects that are specific to the Keep Alive sample application.
The heartbeat functionality is initialized with a struct rte_heartbeat and the callback function to invoke in the case of a timeout.
rte_global_keepalive_info = rte_keepalive_create(&dead_core, NULL);
if (rte_global_hbeat_info == NULL)
rte_exit(EXIT_FAILURE, "keepalive_create() failed");
The function that issues the pings hbeat_dispatch_pings() is configured to run every check_period milliseconds.
if (rte_timer_reset(&hb_timer,
(check_period * rte_get_timer_hz()) / 1000,
PERIODICAL,
rte_lcore_id(),
&hbeat_dispatch_pings, rte_global_keepalive_info
) != 0 )
rte_exit(EXIT_FAILURE, "Keepalive setup failure.\n");
The rest of the initialization and run-time path follows the same paths as the the L2 forwarding application. The only addition to the main processing loop is the mark alive functionality and the example random failures.
rte_keepalive_mark_alive(&rte_global_hbeat_info);
cur_tsc = rte_rdtsc();
/* Die randomly within 7 secs for demo purposes.. */
if (cur_tsc - tsc_initial > tsc_lifetime)
break;
The rte_keepalive_mark_alive() function simply sets the core state to alive.
static inline void
rte_keepalive_mark_alive(struct rte_heartbeat *keepcfg)
{
keepcfg->state_flags[rte_lcore_id()] = 1;
}
Keep Alive Monitor Agent Core Monitoring Options The application can run on either a host or a guest. As such there are a number of options for monitoring the Keep Alive Monitor Agent Core through a Local Agent on the compute node:
Application Location DPDK KA LOCAL AGENT HOST X HOST/GUEST GUEST X HOST/GUEST
For the first implementation of a Local Agent SFQM will enable:
Application Location DPDK KA LOCAL AGENT HOST X HOST
Through extending the dpdkstat plugin for collectd with KA functionality, and integrating the extended plugin with Monasca for high performing, resilient, and scalable fault detection.
This document provides guidelines on how to install and configure Barometer with Apex and Compass4nfv. The deployment script installs and enables a series of collectd plugins on the compute node(s), which collect and dispatch specific metrics and events from the platform.
Deploying the Barometer components in Apex is done through the deploy-opnfv command by selecting
a scenario-file which contains the barometer: true option. These files are located on the
Jump Host in the /etc/opnfv-apex/ folder. Two scenarios are pre-defined to include Barometer,
and they are: os-nosdn-bar-ha.yaml and os-nosdn-bar-noha.yaml.
$ cd /etc/opnfv-apex
$ opnfv-deploy -d os-nosdn-bar-ha.yaml -n network_settings.yaml -i inventory.yaml –- debug
Deploying the Barometer components in Compass4nfv is done by running the deploy.sh script after
exporting a scenario-file which contains the barometer: true option. Two scenarios are pre-defined
to include Barometer, and they are: os-nosdn-bar-ha.yaml and os-nosdn-bar-noha.yaml. For more
information, please refer to these useful links:
https://github.com/opnfv/compass4nfv
https://wiki.opnfv.org/display/compass4nfv/Compass+101
https://wiki.opnfv.org/display/compass4nfv/Containerized+Compass
The quickest way to deploy using Compass4nfv is given below.
$ export SCENARIO=os-nosdn-bar-ha.yml
$ curl https://raw.githubusercontent.com/opnfv/compass4nfv/master/quickstart.sh | bash
There’s no specific Hardware configuration required. However, the intel_rdt plugin works
only on platforms with Intel CPUs.
All Barometer plugins are automatically deployed on all compute nodes. There is no option to selectively install only a subset of plugins. Any custom disabling or configuration must be done directly on the compute node(s) after the deployment is completed.
The Barometer components are built-in in the ISO image, and respectively the RPM/Debian packages. There is no simple way to update only the Barometer plugins in an existing deployment.
This document describes briefly the methods of validating the Barometer installation.
The Barometer test-suite in Functest is called barometercollectd and is part of the Features
tier. Running these tests is done automatically by the OPNFV deployment pipeline on the supported
scenarios. The testing consists of basic verifications that each plugin is functional per their
default configurations. Inside the Functest container, the detailed results can be found in the
/home/opnfv/functest/results/barometercollectd.log.
The functionality for each plugin (such as enabling/disabling and configuring its capabilities)
is controlled as described in the User Guide through their individual .conf file located in
the /etc/collectd/collectd.conf.d/ folder on the compute node(s). In order for any changes to
take effect, the collectd service must be stopped and then started again.
The following steps describe how to perform a simple “manual” testing of the Barometer components:
On the controller:
Get a list of the available metrics:
$ openstack metric list
Take note of the ID of the metric of interest, and show the measures of this metric:
$ openstack metric measures show <metric_id>
Watch the measure list for updates to verify that metrics are being added:
$ watch –n2 –d openstack metric measures show <metric_id>
More on testing and displaying metrics is shown below.
On the compute:
Connect to any compute node and ensure that the collectd service is running. The log file
collectd.log should contain no errors and should indicate that each plugin was successfully
loaded. For example, from the Jump Host:
$ opnfv-util overcloud compute0
$ ls /etc/collectd/collectd.conf.d/
$ systemctl status collectd
$ vi /opt/stack/collectd.log
The following plugings should be found loaded: aodh, gnocchi, hugepages, intel_rdt, mcelog, ovs_events, ovs_stats, snmp, virt
On the compute node, induce an event monitored by the plugins; e.g. a corrected memory error:
$ git clone https://git.kernel.org/pub/scm/utils/cpu/mce/mce-inject.git
$ cd mce-inject
$ make
$ modprobe mce-inject
Modify the test/corrected script to include the following:
CPU 0 BANK 0
STATUS 0xcc00008000010090
ADDR 0x0010FFFFFFF
Inject the error:
$ ./mce-inject < test/corrected
Connect to the controller and query the monitoring services. Make sure the overcloudrc.v3 file has been copied to the controller (from the undercloud VM or from the Jump Host) in order to be able to authenticate for OpenStack services.
$ opnfv-util overcloud controller0
$ su
$ source overcloudrc.v3
$ gnocchi metric list
$ aodh alarm list
The output for the gnocchi and aodh queries should be similar to the excerpts below:
+--------------------------------------+---------------------+------------------------------------------------------------------------------------------------------------+-----------+-------------+
| id | archive_policy/name | name | unit | resource_id |
+--------------------------------------+---------------------+------------------------------------------------------------------------------------------------------------+-----------+-------------+
[...]
| 0550d7c1-384f-4129-83bc-03321b6ba157 | high | overcloud-novacompute-0.jf.intel.com-hugepages-mm-2048Kb@vmpage_number.free | Pages | None |
| 0cf9f871-0473-4059-9497-1fea96e5d83a | high | overcloud-novacompute-0.jf.intel.com-hugepages-node0-2048Kb@vmpage_number.free | Pages | None |
| 0d56472e-99d2-4a64-8652-81b990cd177a | high | overcloud-novacompute-0.jf.intel.com-hugepages-node1-1048576Kb@vmpage_number.used | Pages | None |
| 0ed71a49-6913-4e57-a475-d30ca2e8c3d2 | high | overcloud-novacompute-0.jf.intel.com-hugepages-mm-1048576Kb@vmpage_number.used | Pages | None |
| 11c7be53-b2c1-4c0e-bad7-3152d82c6503 | high | overcloud-novacompute-0.jf.intel.com-mcelog- | None | None |
| | | SOCKET_0_CHANNEL_any_DIMM_any@errors.uncorrected_memory_errors_in_24h | | |
| 120752d4-385e-4153-aed8-458598a2a0e0 | high | overcloud-novacompute-0.jf.intel.com-cpu-24@cpu.interrupt | jiffies | None |
| 1213161e-472e-4e1b-9e56-5c6ad1647c69 | high | overcloud-novacompute-0.jf.intel.com-cpu-6@cpu.softirq | jiffies | None |
[...]
+--------------------------------------+-------+------------------------------------------------------------------+-------+----------+---------+
| alarm_id | type | name | state | severity | enabled |
+--------------------------------------+-------+------------------------------------------------------------------+-------+----------+---------+
| fbd06539-45dd-42c5-a991-5c5dbf679730 | event | gauge.memory_erros(overcloud-novacompute-0.jf.intel.com-mcelog) | ok | moderate | True |
| d73251a5-1c4e-4f16-bd3d-377dd1e8cdbe | event | gauge.mcelog_status(overcloud-novacompute-0.jf.intel.com-mcelog) | ok | moderate | True |
[...]
For Fraser release, Compass4nfv integrated the barometer-collectd container of Barometer.
As a result, on the compute node, collectd runs in a Docker container. On the controller node,
Grafana and InfluxDB are installed and configured.
The following steps describe how to perform simple “manual” testing of the Barometer components after successfully deploying a Barometer scenario using Compass4nfv:
On the compute:
Connect to any compute node and ensure that the collectd container is running.
root@host2:~# docker ps | grep collectd
You should see the container opnfv/barometer-collectd running.
Testing using mce-inject is similar to testing done in Apex.
On the controller:
3. Connect to the controller and query the monitoring services. Make sure to log in to the lxc-utility container before using the OpenStack CLI. Please refer to this wiki for details: https://wiki.opnfv.org/display/compass4nfv/Containerized+Compass#ContainerizedCompass-HowtouseOpenStackCLI
root@host1-utility-container-d15da033:~# source ~/openrc root@host1-utility-container-d15da033:~# gnocchi metric list root@host1-utility-container-d15da033:~# aodh alarm listThe output for the gnocchi and aodh queries should be similar to the excerpts shown in the section above for Apex.
4. Use a web browser to connect to Grafana at http://<serverip>:3000/, using the hostname or
IP of your Ubuntu server and port 3000. Log in with admin/admin. You will see collectd
InfluxDB database in the Data Sources. Also, you will notice metrics coming in the several
dashboards such as CPU Usage and Host Overview.
For more details on the Barometer containers, Grafana and InfluxDB, please refer to the following documentation links: https://wiki.opnfv.org/display/fastpath/Barometer+Containers#BarometerContainers-barometer-collectdcontainer <barometer-docker-userguide>
Collectd is a daemon which collects system performance statistics periodically and provides a variety of mechanisms to publish the collected metrics. It supports more than 90 different input and output plugins. Input plugins retrieve metrics and publish them to the collectd deamon, while output plugins publish the data they receive to an end point. collectd also has infrastructure to support thresholding and notification.
Barometer has enabled the following collectd plugins:
All the plugins above are available on the collectd master, except for the Gnocchi and Aodh plugins as they are Python-based plugins and only C plugins are accepted by the collectd community. The Gnocchi and Aodh plugins live in the OpenStack repositories.
Other plugins existing as a pull request into collectd master:
Third party application in Barometer repository:
Plugins and application included in the Euphrates release:
Write Plugins: aodh plugin, SNMP agent plugin, gnocchi plugin.
Read Plugins/application: Intel RDT plugin, virt plugin, Open vSwitch stats plugin, Open vSwitch PMD stats application.
Note
Plugins included in the OPNFV E release will be built-in for Apex integration and can be configured as shown in the examples below.
The collectd plugins in OPNFV are configured with reasonable defaults, but can be overridden.
The plugins that have been merged to the collectd master branch can all be built and configured through the barometer repository.
Note
To build all the upstream plugins, clone the barometer repo:
$ git clone https://gerrit.opnfv.org/gerrit/barometer
To install collectd as a service and install all it’s dependencies:
$ cd barometer/systems && ./build_base_machine.sh
This will install collectd as a service and the base install directory will be /opt/collectd.
Sample configuration files can be found in ‘/opt/collectd/etc/collectd.conf.d’
Note
If you don’t want to use one of the Barometer plugins, simply remove the sample config file from ‘/opt/collectd/etc/collectd.conf.d’
Note
If you plan on using the Exec plugin (for OVS_PMD_STATS or for executing scripts on notification generation), the plugin requires a non-root user to execute scripts. By default, collectd_exec user is used in the exec.conf provided in the sample configurations directory under src/collectd in the Barometer repo. These scripts DO NOT create this user. You need to create this user or modify the configuration in the sample configurations directory under src/collectd to use another existing non root user before running build_base_machine.sh.
Note
If you are using any Open vSwitch plugins you need to run:
$ sudo ovs-vsctl set-manager ptcp:6640
After this, you should be able to start collectd as a service
$ sudo systemctl status collectd
If you want to use granfana to display the metrics you collect, please see: grafana guide
For more information on configuring and installing OpenStack plugins for collectd, check out the collectd-openstack-plugins GSG.
Below is the per plugin installation and configuration guide, if you only want to install some/particular plugins.
Repo: https://github.com/collectd/collectd
Branch: master
Dependencies: DPDK (http://dpdk.org/)
Note
DPDK statistics plugin requires DPDK version 16.04 or later.
To build and install DPDK to /usr please see: https://github.com/collectd/collectd/blob/master/docs/BUILD.dpdkstat.md
Building and installing collectd:
$ git clone https://github.com/collectd/collectd.git
$ cd collectd
$ ./build.sh
$ ./configure --enable-syslog --enable-logfile --enable-debug
$ make
$ sudo make install
Note
If DPDK was installed in a non standard location you will need to specify paths to the header files and libraries using LIBDPDK_CPPFLAGS and LIBDPDK_LDFLAGS. You will also need to add the DPDK library symbols to the shared library path using ldconfig. Note that this update to the shared library path is not persistant (i.e. it will not survive a reboot).
Example of specifying custom paths to DPDK headers and libraries:
$ ./configure LIBDPDK_CPPFLAGS="path to DPDK header files" LIBDPDK_LDFLAGS="path to DPDK libraries"
This will install collectd to default folder /opt/collectd. The collectd
configuration file (collectd.conf) can be found at /opt/collectd/etc.
To configure the dpdkstats plugin you need to modify the configuration file to
include:
LoadPlugin dpdkstat
<Plugin dpdkstat>
Coremask "0xf"
ProcessType "secondary"
FilePrefix "rte"
EnabledPortMask 0xffff
PortName "interface1"
PortName "interface2"
</Plugin>
To configure the dpdkevents plugin you need to modify the configuration file to include:
<LoadPlugin dpdkevents>
Interval 1
</LoadPlugin>
<Plugin "dpdkevents">
<EAL>
Coremask "0x1"
MemoryChannels "4"
FilePrefix "rte"
</EAL>
<Event "link_status">
SendEventsOnUpdate false
EnabledPortMask 0xffff
SendNotification true
</Event>
<Event "keep_alive">
SendEventsOnUpdate false
LCoreMask "0xf"
KeepAliveShmName "/dpdk_keepalive_shm_name"
SendNotification true
</Event>
</Plugin>
Note
Currently, the DPDK library doesn’t support API to de-initialize the DPDK resources allocated on the initialization. It means, the collectd plugin will not be able to release the allocated DPDK resources (locks/memory/pci bindings etc.) correctly on collectd shutdown or reinitialize the DPDK library if primary DPDK process is restarted. The only way to release those resources is to terminate the process itself. For this reason, the plugin forks off a separate collectd process. This child process becomes a secondary DPDK process which can be run on specific CPU cores configured by user through collectd configuration file (“Coremask” EAL configuration option, the hexadecimal bitmask of the cores to run on).
For more information on the plugin parameters, please see: https://github.com/collectd/collectd/blob/master/src/collectd.conf.pod
Note
dpdkstat plugin initialization time depends on read interval. It requires 5 read cycles to set up internal buffers and states, during that time no statistics are submitted. Also, if plugin is running and the number of DPDK ports is increased, internal buffers are resized. That requires 3 read cycles and no port statistics are submitted during that time.
The Address-Space Layout Randomization (ASLR) security feature in Linux should be disabled, in order for the same hugepage memory mappings to be present in all DPDK multi-process applications.
To disable ASLR:
$ sudo echo 0 > /proc/sys/kernel/randomize_va_space
To fully enable ASLR:
$ sudo echo 2 > /proc/sys/kernel/randomize_va_space
Warning
Disabling Address-Space Layout Randomization (ASLR) may have security implications. It is recommended to be disabled only when absolutely necessary, and only when all implications of this change have been understood.
For more information on multi-process support, please see: http://dpdk.org/doc/guides/prog_guide/multi_proc_support.html
DPDK stats plugin limitations:
DPDK stats known issues:
DPDK port visibility
When network port controlled by Linux is bound to DPDK driver, the port will not be available in the OS. It affects the SNMP write plugin as those ports will not be present in standard IF-MIB. Thus, additional work is required to be done to support DPDK ports and statistics.
Repo: https://github.com/collectd/collectd
Branch: master
Dependencies: None, but assumes hugepages are configured.
To configure some hugepages:
$ sudo mkdir -p /mnt/huge
$ sudo mount -t hugetlbfs nodev /mnt/huge
$ sudo bash -c "echo 14336 > /sys/devices/system/node/node0/hugepages/hugepages-2048kB/nr_hugepages"
Building and installing collectd:
$ git clone https://github.com/collectd/collectd.git
$ cd collectd
$ ./build.sh
$ ./configure --enable-syslog --enable-logfile --enable-hugepages --enable-debug
$ make
$ sudo make install
This will install collectd to default folder /opt/collectd. The collectd
configuration file (collectd.conf) can be found at /opt/collectd/etc.
To configure the hugepages plugin you need to modify the configuration file to
include:
LoadPlugin hugepages
<Plugin hugepages>
ReportPerNodeHP true
ReportRootHP true
ValuesPages true
ValuesBytes false
ValuesPercentage false
</Plugin>
For more information on the plugin parameters, please see: https://github.com/collectd/collectd/blob/master/src/collectd.conf.pod
Repo: https://github.com/collectd/collectd
Branch: master
Dependencies:
- PMU tools (jevents library) https://github.com/andikleen/pmu-tools
To be suitable for use in collectd plugin shared library libjevents should be compiled as position-independent code. To do this add the following line to pmu-tools/jevents/Makefile:
CFLAGS += -fPIC
Building and installing jevents library:
$ git clone https://github.com/andikleen/pmu-tools.git
$ cd pmu-tools/jevents/
$ make
$ sudo make install
Download the Hardware Events that are relevant to your CPU, download the appropriate CPU event list json file:
$ wget https://raw.githubusercontent.com/andikleen/pmu-tools/master/event_download.py
$ python event_download.py
This will download the json files to the location: $HOME/.cache/pmu-events/. If you don’t want to download these files to the aforementioned location, set the environment variable XDG_CACHE_HOME to the location you want the files downloaded to.
Building and installing collectd:
$ git clone https://github.com/collectd/collectd.git
$ cd collectd
$ ./build.sh
$ ./configure --enable-syslog --enable-logfile --with-libjevents=/usr/local --enable-debug
$ make
$ sudo make install
This will install collectd to default folder /opt/collectd. The collectd
configuration file (collectd.conf) can be found at /opt/collectd/etc.
To configure the PMU plugin you need to modify the configuration file to
include:
<LoadPlugin intel_pmu>
Interval 1
</LoadPlugin>
<Plugin "intel_pmu">
ReportHardwareCacheEvents true
ReportKernelPMUEvents true
ReportSoftwareEvents true
Cores ""
</Plugin>
If you want to monitor Intel CPU specific CPU events, make sure to enable the additional two options shown below:
<Plugin intel_pmu>
ReportHardwareCacheEvents true
ReportKernelPMUEvents true
ReportSoftwareEvents true
EventList "$HOME/.cache/pmu-events/GenuineIntel-6-2D-core.json"
HardwareEvents "L2_RQSTS.CODE_RD_HIT,L2_RQSTS.CODE_RD_MISS" "L2_RQSTS.ALL_CODE_RD"
Cores ""
</Plugin>
Note
If you set XDG_CACHE_HOME to anything other than the variable above - you will need to modify the path for the EventList configuration.
Use “Cores” option to monitor metrics only for configured cores. If an empty string is provided as value for this field default cores configuration is applied - that is all available cores are monitored separately. To limit monitoring to cores 0-7 set the option as shown below:
Cores "[0-7]"
For more information on the plugin parameters, please see: https://github.com/collectd/collectd/blob/master/src/collectd.conf.pod
Note
The plugin opens file descriptors whose quantity depends on number of monitored CPUs and number of monitored counters. Depending on configuration, it might be required to increase the limit on the number of open file descriptors allowed. This can be done using ‘ulimit -n’ command. If collectd is executed as a service ‘LimitNOFILE=’ directive should be defined in [Service] section of collectd.service file.
Repo: https://github.com/collectd/collectd
Branch: master
Dependencies:
- PQoS/Intel RDT library https://github.com/01org/intel-cmt-cat.git
- msr kernel module
Building and installing PQoS/Intel RDT library:
$ git clone https://github.com/01org/intel-cmt-cat.git
$ cd intel-cmt-cat
$ make
$ make install PREFIX=/usr
You will need to insert the msr kernel module:
$ modprobe msr
Building and installing collectd:
$ git clone https://github.com/collectd/collectd.git
$ cd collectd
$ ./build.sh
$ ./configure --enable-syslog --enable-logfile --with-libpqos=/usr/ --enable-debug
$ make
$ sudo make install
This will install collectd to default folder /opt/collectd. The collectd
configuration file (collectd.conf) can be found at /opt/collectd/etc.
To configure the RDT plugin you need to modify the configuration file to
include:
<LoadPlugin intel_rdt>
Interval 1
</LoadPlugin>
<Plugin "intel_rdt">
Cores ""
</Plugin>
For more information on the plugin parameters, please see: https://github.com/collectd/collectd/blob/master/src/collectd.conf.pod
Repo: https://github.com/collectd/collectd
Branch: feat_ipmi_events, feat_ipmi_analog
Dependencies: OpenIPMI library (http://openipmi.sourceforge.net/)
The IPMI plugin is already implemented in the latest collectd and sensors like temperature, voltage, fanspeed, current are already supported there. The list of supported IPMI sensors has been extended and sensors like flow, power are supported now. Also, a System Event Log (SEL) notification feature has been introduced.
Install dependencies
On Centos, install OpenIPMI library:
$ sudo yum install OpenIPMI ipmitool
Anyway, it’s recommended to use the latest version of the OpenIPMI library as it includes fixes of known issues which aren’t included in standard OpenIPMI library package. The latest version of the library can be found at https://sourceforge.net/p/openipmi/code/ci/master/tree/. Steps to install the library from sources are described below.
Remove old version of OpenIPMI library:
$ sudo yum remove OpenIPMI ipmitool
Build and install OpenIPMI library:
$ git clone https://git.code.sf.net/p/openipmi/code openipmi-code
$ cd openipmi-code
$ autoreconf --install
$ ./configure --prefix=/usr
$ make
$ sudo make install
Add the directory containing OpenIPMI*.pc files to the PKG_CONFIG_PATH
environment variable:
export PKG_CONFIG_PATH=/usr/lib/pkgconfig
Enable IPMI support in the kernel:
$ sudo modprobe ipmi_devintf
$ sudo modprobe ipmi_si
Note
If HW supports IPMI, the /dev/ipmi0 character device will be
created.
Clone and install the collectd IPMI plugin:
$ git clone https://github.com/collectd/collectd
$ cd collectd
$ ./build.sh
$ ./configure --enable-syslog --enable-logfile --enable-debug
$ make
$ sudo make install
This will install collectd to default folder /opt/collectd. The collectd
configuration file (collectd.conf) can be found at /opt/collectd/etc.
To configure the IPMI plugin you need to modify the file to include:
LoadPlugin ipmi
<Plugin ipmi>
<Instance "local">
SELEnabled true # only feat_ipmi_events branch supports this
</Instance>
</Plugin>
Note
By default, IPMI plugin will read all available analog sensor values, dispatch the values to collectd and send SEL notifications.
For more information on the IPMI plugin parameters and SEL feature configuration, please see: https://github.com/collectd/collectd/blob/master/src/collectd.conf.pod
Extended analog sensors support doesn’t require additional configuration. The usual collectd IPMI documentation can be used:
IPMI documentation:
Repo: https://github.com/collectd/collectd
Branch: master
Dependencies: mcelog
Start by installing mcelog.
Note
The kernel has to have CONFIG_X86_MCE enabled. For 32bit kernels you need atleast a 2.6,30 kernel.
On Centos:
$ sudo yum install mcelog
Or build from source
$ git clone https://git.kernel.org/pub/scm/utils/cpu/mce/mcelog.git
$ cd mcelog
$ make
... become root ...
$ make install
$ cp mcelog.service /etc/systemd/system/
$ systemctl enable mcelog.service
$ systemctl start mcelog.service
Verify you got a /dev/mcelog. You can verify the daemon is running completely by running:
$ mcelog --client
This should query the information in the running daemon. If it prints nothing that is fine (no errors logged yet). More info @ http://www.mcelog.org/installation.html
Modify the mcelog configuration file “/etc/mcelog/mcelog.conf” to include or enable:
socket-path = /var/run/mcelog-client
[dimm]
dimm-tracking-enabled = yes
dmi-prepopulate = yes
uc-error-threshold = 1 / 24h
ce-error-threshold = 10 / 24h
[socket]
socket-tracking-enabled = yes
mem-uc-error-threshold = 100 / 24h
mem-ce-error-threshold = 100 / 24h
mem-ce-error-log = yes
[page]
memory-ce-threshold = 10 / 24h
memory-ce-log = yes
memory-ce-action = soft
[trigger]
children-max = 2
directory = /etc/mcelog
Clone and install the collectd mcelog plugin:
$ git clone https://github.com/collectd/collectd
$ cd collectd
$ ./build.sh
$ ./configure --enable-syslog --enable-logfile --enable-debug
$ make
$ sudo make install
This will install collectd to default folder /opt/collectd. The collectd
configuration file (collectd.conf) can be found at /opt/collectd/etc.
To configure the mcelog plugin you need to modify the configuration file to
include:
<LoadPlugin mcelog>
Interval 1
</LoadPlugin>
<Plugin mcelog>
<Memory>
McelogClientSocket "/var/run/mcelog-client"
PersistentNotification false
</Memory>
#McelogLogfile "/var/log/mcelog"
</Plugin>
For more information on the plugin parameters, please see: https://github.com/collectd/collectd/blob/master/src/collectd.conf.pod
Simulating a Machine Check Exception can be done in one of 3 ways:
mcelog test suite:
It is always a good idea to test an error handling mechanism before it is really needed. mcelog includes a test suite. The test suite relies on mce-inject which needs to be installed and in $PATH.
You also need the mce-inject kernel module configured (with CONFIG_X86_MCE_INJECT=y), compiled, installed and loaded:
$ modprobe mce-inject
Then you can run the mcelog test suite with
$ make test
This will inject different classes of errors and check that the mcelog triggers runs. There will be some kernel messages about page offlining attempts. The test will also lose a few pages of memory in your system (not significant).
Note
This test will kill any running mcelog, which needs to be restarted manually afterwards.
mce-inject:
A utility to inject corrected, uncorrected and fatal machine check exceptions
$ git clone https://git.kernel.org/pub/scm/utils/cpu/mce/mce-inject.git
$ cd mce-inject
$ make
$ modprobe mce-inject
Modify the test/corrected script to include the following:
CPU 0 BANK 0
STATUS 0xcc00008000010090
ADDR 0x0010FFFFFFF
Inject the error: .. code:: bash
$ ./mce-inject < test/corrected
Note
The uncorrected and fatal scripts under test will cause a platform reset. Only the fatal script generates the memory errors**. In order to quickly emulate uncorrected memory errors and avoid host reboot following test errors from mce-test suite can be injected:
$ mce-inject mce-test/cases/coverage/soft-inj/recoverable_ucr/data/srao_mem_scrub
mce-test:
In addition a more in-depth test of the Linux kernel machine check facilities can be done with the mce-test test suite. mce-test supports testing uncorrected error handling, real error injection, handling of different soft offlining cases, and other tests.
Corrected memory error injection:
To inject corrected memory errors:
$ APEI_IF=/sys/kernel/debug/apei/einj
$ echo 0x8 > $APEI_IF/error_type
$ echo 0x01f5591000 > $APEI_IF/param1
$ echo 0xfffffffffffff000 > $APEI_IF/param2
$ echo 1 > $APEI_IF/notrigger
$ echo 1 > $APEI_IF/error_inject
OvS Plugins Repo: https://github.com/collectd/collectd
OvS Plugins Branch: master
OvS Events MIBs: The SNMP OVS interface link status is provided by standard IF-MIB (http://www.net-snmp.org/docs/mibs/IF-MIB.txt)
Dependencies: Open vSwitch, Yet Another JSON Library (https://github.com/lloyd/yajl)
On Centos, install the dependencies and Open vSwitch:
$ sudo yum install yajl-devel
Steps to install Open vSwtich can be found at http://docs.openvswitch.org/en/latest/intro/install/fedora/
Start the Open vSwitch service:
$ sudo service openvswitch-switch start
Configure the ovsdb-server manager:
$ sudo ovs-vsctl set-manager ptcp:6640
Clone and install the collectd ovs plugin:
$ git clone $REPO
$ cd collectd
$ git checkout master
$ ./build.sh
$ ./configure --enable-syslog --enable-logfile --enable-debug
$ make
$ sudo make install
This will install collectd to default folder /opt/collectd. The collectd
configuration file (collectd.conf) can be found at /opt/collectd/etc.
To configure the OVS events plugin you need to modify the configuration file to include:
<LoadPlugin ovs_events>
Interval 1
</LoadPlugin>
<Plugin ovs_events>
Port "6640"
Address "127.0.0.1"
Socket "/var/run/openvswitch/db.sock"
Interfaces "br0" "veth0"
SendNotification true
</Plugin>
To configure the OVS stats plugin you need to modify the configuration file to include:
<LoadPlugin ovs_stats>
Interval 1
</LoadPlugin>
<Plugin ovs_stats>
Port "6640"
Address "127.0.0.1"
Socket "/var/run/openvswitch/db.sock"
Bridges "br0"
</Plugin>
For more information on the plugin parameters, please see: https://github.com/collectd/collectd/blob/master/src/collectd.conf.pod
Repo: https://gerrit.opnfv.org/gerrit/barometer
Prequistes: 1. Open vSwitch dependencies are installed. 2. Open vSwitch service is running. 3. Ovsdb-server manager is configured. You can refer Open vSwitch Plugins section above for each one of them.
OVS PMD stats application is run through the exec plugin.
To configure the OVS PMD stats application you need to modify the exec plugin configuration to include:
<LoadPlugin exec>
Interval 1
</LoadPlugin
<Plugin exec>
Exec "user:group" "<path to ovs_pmd_stat.sh>"
</Plugin>
Note
Exec plugin configuration has to be changed to use appropriate user before starting collectd service.
ovs_pmd_stat.sh calls the script for OVS PMD stats application with its argument:
sudo python /usr/local/src/ovs_pmd_stats.py" "--socket-pid-file"
"/var/run/openvswitch/ovs-vswitchd.pid"
Repo: https://github.com/collectd/collectd
Branch: master
Dependencies: NET-SNMP library
Start by installing net-snmp and dependencies.
On Centos 7:
$ sudo yum install net-snmp net-snmp-libs net-snmp-utils net-snmp-devel
$ sudo systemctl start snmpd.service
go to the snmp configuration steps.
From source:
Clone and build net-snmp:
$ git clone https://github.com/haad/net-snmp.git
$ cd net-snmp
$ ./configure --with-persistent-directory="/var/net-snmp" --with-systemd --enable-shared --prefix=/usr
$ make
Become root
$ make install
Copy default configuration to persistent folder:
$ cp EXAMPLE.conf /usr/share/snmp/snmpd.conf
Set library path and default MIB configuration:
$ cd ~/
$ echo export LD_LIBRARY_PATH=/usr/lib >> .bashrc
$ net-snmp-config --default-mibdirs
$ net-snmp-config --snmpconfpath
Configure snmpd as a service:
$ cd net-snmp
$ cp ./dist/snmpd.service /etc/systemd/system/
$ systemctl enable snmpd.service
$ systemctl start snmpd.service
Add the following line to snmpd.conf configuration file
/etc/snmp/snmpd.conf to make all OID tree visible for SNMP clients:
view systemview included .1
To verify that SNMP is working you can get IF-MIB table using SNMP client to view the list of Linux interfaces:
$ snmpwalk -v 2c -c public localhost IF-MIB::interfaces
Get the default MIB location:
$ net-snmp-config --default-mibdirs
/opt/stack/.snmp/mibs:/usr/share/snmp/mibs
Install Intel specific MIBs (if needed) into location received by
net-snmp-config command (e.g. /usr/share/snmp/mibs).
$ git clone https://gerrit.opnfv.org/gerrit/barometer.git
$ sudo cp -f barometer/mibs/*.txt /usr/share/snmp/mibs/
$ sudo systemctl restart snmpd.service
Clone and install the collectd snmp_agent plugin:
$ cd ~
$ git clone https://github.com/collectd/collectd
$ cd collectd
$ ./build.sh
$ ./configure --enable-syslog --enable-logfile --enable-debug --enable-snmp --with-libnetsnmp
$ make
$ sudo make install
This will install collectd to default folder /opt/collectd. The collectd
configuration file (collectd.conf) can be found at /opt/collectd/etc.
SNMP Agent plugin is a generic plugin and cannot work without configuration. To configure the snmp_agent plugin you need to modify the configuration file to include OIDs mapped to collectd types. The following example maps scalar memAvailReal OID to value represented as free memory type of memory plugin:
LoadPlugin snmp_agent
<Plugin "snmp_agent">
<Data "memAvailReal">
Plugin "memory"
Type "memory"
TypeInstance "free"
OIDs "1.3.6.1.4.1.2021.4.6.0"
</Data>
</Plugin>
The snmpwalk command can be used to validate the collectd configuration:
$ snmpwalk -v 2c -c public localhost 1.3.6.1.4.1.2021.4.6.0
UCD-SNMP-MIB::memAvailReal.0 = INTEGER: 135237632 kB
Limitations
For more information on the plugin parameters, please see: https://github.com/collectd/collectd/blob/master/src/collectd.conf.pod
For more details on AgentX subagent, please see: http://www.net-snmp.org/tutorial/tutorial-5/toolkit/demon/
Repo: https://github.com/collectd/collectd
Branch: master
Dependencies: libvirt (https://libvirt.org/), libxml2
On Centos, install the dependencies:
$ sudo yum install libxml2-devel libpciaccess-devel yajl-devel device-mapper-devel
Install libvirt:
Note
libvirt version in package manager might be quite old and offer only limited functionality. Hence, building and installing libvirt from sources is recommended. Detailed instructions can bet found at: https://libvirt.org/compiling.html
$ sudo yum install libvirt-devel
Certain metrics provided by the plugin have a requirement on a minimal version of the libvirt API. File system information statistics require a Guest Agent (GA) to be installed and configured in a VM. User must make sure that installed GA version supports retrieving file system information. Number of Performance monitoring events metrics depends on running libvirt daemon version.
Note
Please keep in mind that RDT metrics (part of Performance monitoring events) have to be supported by hardware. For more details on hardware support, please see: https://github.com/01org/intel-cmt-cat
Additionally perf metrics cannot be collected if Intel RDT plugin is enabled.
libvirt version can be checked with following commands:
$ virsh --version
$ libvirtd --version
| Statistic | Min. libvirt API version | Requires GA |
|---|---|---|
| Domain reason | 0.9.2 | No |
| Disk errors | 0.9.10 | No |
| Job statistics | 1.2.9 | No |
| File system information | 1.2.11 | Yes |
| Performance monitoring events | 1.3.3 | No |
Start libvirt daemon:
$ systemctl start libvirtd
Create domain (VM) XML configuration file. For more information on domain XML format and examples, please see: https://libvirt.org/formatdomain.html
Note
Installing additional hypervisor dependencies might be required before deploying virtual machine.
Create domain, based on created XML file:
$ virsh define DOMAIN_CFG_FILE.xml
Start domain:
$ virsh start DOMAIN_NAME
Check if domain is running:
$ virsh list
Check list of available Performance monitoring events and their settings:
$ virsh perf DOMAIN_NAME
Enable or disable Performance monitoring events for domain:
$ virsh perf DOMAIN_NAME [--enable | --disable] EVENT_NAME --live
Clone and install the collectd virt plugin:
$ git clone $REPO
$ cd collectd
$ ./build.sh
$ ./configure --enable-syslog --enable-logfile --enable-debug
$ make
$ sudo make install
Where $REPO is equal to information provided above.
This will install collectd to /opt/collectd. The collectd configuration file
collectd.conf can be found at /opt/collectd/etc.
To load the virt plugin user needs to modify the configuration file to include:
LoadPlugin virt
Additionally, user can specify plugin configuration parameters in this file,
such as connection URL, domain name and much more. By default extended virt plugin
statistics are disabled. They can be enabled with ExtraStats option.
<Plugin virt>
RefreshInterval 60
ExtraStats "cpu_util disk disk_err domain_state fs_info job_stats_background pcpu perf vcpupin"
</Plugin>
For more information on the plugin parameters, please see: https://github.com/collectd/collectd/blob/master/src/collectd.conf.pod
NOTE: In an OPNFV installation, collectd is installed and configured as a service.
Collectd service scripts are available in the collectd/contrib directory. To install collectd as a service:
$ sudo cp contrib/systemd.collectd.service /etc/systemd/system/
$ cd /etc/systemd/system/
$ sudo mv systemd.collectd.service collectd.service
$ sudo chmod +x collectd.service
Modify collectd.service
[Service]
ExecStart=/opt/collectd/sbin/collectd
EnvironmentFile=-/opt/collectd/etc/
EnvironmentFile=-/opt/collectd/etc/
CapabilityBoundingSet=CAP_SETUID CAP_SETGID
Reload
$ sudo systemctl daemon-reload
$ sudo systemctl start collectd.service
$ sudo systemctl status collectd.service should show success
Exec Plugin : Can be used to show you when notifications are being generated by calling a bash script that dumps notifications to file. (handy for debug). Modify /opt/collectd/etc/collectd.conf:
LoadPlugin exec
<Plugin exec>
# Exec "user:group" "/path/to/exec"
NotificationExec "user" "<path to barometer>/barometer/src/collectd/collectd_sample_configs/write_notification.sh"
</Plugin>
write_notification.sh (just writes the notification passed from exec through STDIN to a file (/tmp/notifications)):
#!/bin/bash
rm -f /tmp/notifications
while read x y
do
echo $x$y >> /tmp/notifications
done
output to /tmp/notifications should look like:
Severity:WARNING
Time:1479991318.806
Host:localhost
Plugin:ovs_events
PluginInstance:br-ex
Type:gauge
TypeInstance:link_status
uuid:f2aafeec-fa98-4e76-aec5-18ae9fc74589
linkstate of "br-ex" interface has been changed to "DOWN"
LoadPlugin logfile
<Plugin logfile>
LogLevel info
File "/var/log/collectd.log"
Timestamp true
PrintSeverity false
</Plugin>
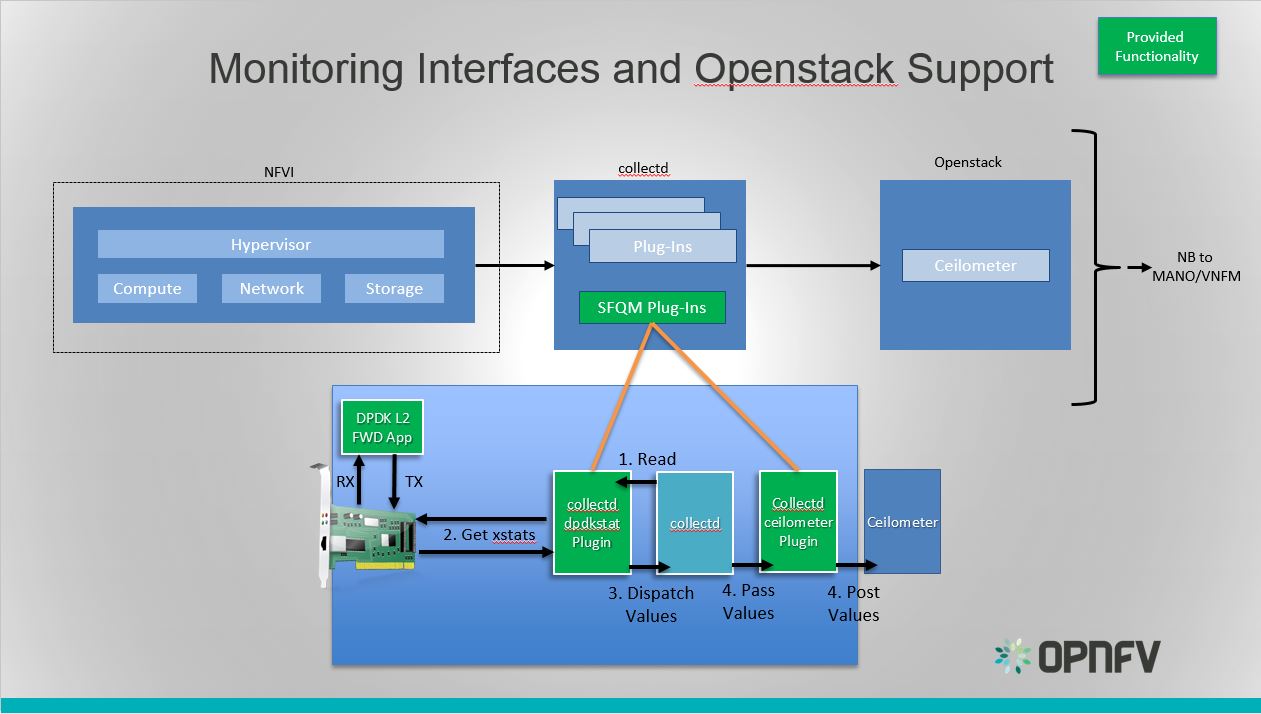
Monitoring Interfaces and Openstack Support
The figure above shows the DPDK L2 forwarding application running on a compute node, sending and receiving traffic. Collectd is also running on this compute node retrieving the stats periodically from DPDK through the dpdkstat plugin and publishing the retrieved stats to OpenStack through the collectd-openstack-plugins.
To see this demo in action please checkout: Barometer OPNFV Summit demo
For more information on configuring and installing OpenStack plugins for collectd, check out the collectd-openstack-plugins GSG.
AAA – on top of collectd there secure agents like SNMP V3, Openstack agents etc. with their own AAA methods.
Collectd runs as a daemon with root permissions.
The Exec plugin allows the execution of external programs but counters the security concerns by:
privileges.
Protection of Data in flight:
Known vulnerabilities include:
https://www.cvedetails.com/vulnerability-list/vendor_id-11242/Collectd.html
CVE-2017-7401 fixed https://github.com/collectd/collectd/issues/2174 in Version 5.7.2.
in Version 5.4.3.
in Version 4.10.2.
http://www.cvedetails.com/product/20310/Collectd-Collectd.html?vendor_id=11242
It’s recommended to only use collectd plugins from signed packages.
| [1] | https://collectd.org/wiki/index.php/Naming_schema |
| [2] | https://github.com/collectd/collectd/blob/master/src/daemon/plugin.h |
| [3] | https://collectd.org/wiki/index.php/Value_list_t |
| [4] | https://collectd.org/wiki/index.php/Data_set |
| [5] | https://collectd.org/documentation/manpages/types.db.5.shtml |
| [6] | https://collectd.org/wiki/index.php/Data_source |
| [7] | https://collectd.org/wiki/index.php/Meta_Data_Interface |
The Barometer repository contains a python based application for VES (VNF Event Stream) which receives the collectd specific metrics via Kafka bus, normalizes the metric data into the VES message format and sends it into the VES collector.
The application currently supports pushing platform relevant metrics through the additional measurements field for VES.
Collectd has a write_kafka plugin that sends collectd metrics and values to
a Kafka Broker. The VES message formatting application, ves_app.py, receives metrics from
the Kafka broker, normalises the data to VES message format for forwarding to VES collector.
The VES message formatting application will be simply referred to as the “VES application”
within this userguide
The VES application can be run in host mode (baremetal), hypervisor mode (on a host with a hypervisor and VMs running) or guest mode(within a VM). The main software blocks that are required to run the VES application demo are:
- Kafka
- Collectd
- VES Application
- VES Collector
Dependencies: install JAVA & Zookeeper.
Ubuntu 16.04:
$ sudo apt-get install default-jre $ sudo apt-get install zookeeperd $ sudo apt-get install python-pip
CentOS:
$ sudo yum update -y $ sudo yum install java-1.8.0-openjdk $ sudo yum install epel-release $ sudo yum install python-pip $ sudo yum install zookeeper $ sudo yum install telnet $ sudo yum install wgetNote
You may need to add the repository that contains zookeeper. To do so, follow the step below and try to install zookeeper again using steps above. Otherwise, skip next step.
$ sudo yum install https://archive.cloudera.com/cdh5/one-click-install/redhat/7/x86_64/cloudera-cdh-5-0.x86_64.rpmStart zookeeper:
$ sudo zookeeper-server startif you get the error message like
ZooKeeper data directory is missing at /var/lib/zookeeperduring the start of zookeeper, initialize zookeeper data directory using the command below and start zookeeper again, otherwise skip the next step.$ sudo /usr/lib/zookeeper/bin/zkServer-initialize.sh No myid provided, be sure to specify it in /var/lib/zookeeper/myid if using non-standalone
Test if Zookeeper is running as a daemon.
$ telnet localhost 2181Type ‘ruok’ & hit enter. Expected response is ‘imok’ which means that Zookeeper is up running.
Install Kafka
Note
VES doesn’t work with version 0.9.4 of kafka-python. The recommended/tested version is 1.3.3.
$ sudo pip install kafka-python $ wget "https://archive.apache.org/dist/kafka/1.0.0/kafka_2.11-1.0.0.tgz" $ tar -xvzf kafka_2.11-1.0.0.tgz $ sed -i -- 's/#delete.topic.enable=true/delete.topic.enable=true/' kafka_2.11-1.0.0/config/server.properties $ sudo nohup kafka_2.11-1.0.0/bin/kafka-server-start.sh \ kafka_2.11-1.0.0/config/server.properties > kafka_2.11-1.0.0/kafka.log 2>&1 &Note
If Kafka server fails to start, please check if the platform IP address is associated with the hostname in the static host lookup table. If it doesn’t exist, use the following command to add it.
$ echo "$(ip route get 8.8.8.8 | awk '{print $NF; exit}') $HOSTNAME" | sudo tee -a /etc/hosts
Test the Kafka Installation
To test if the installation worked correctly there are two scripts, producer and consumer scripts. These will allow you to see messages pushed to broker and receive from broker.
Producer (Publish “Hello World”):
$ echo "Hello, World" | kafka_2.11-1.0.0/bin/kafka-console-producer.sh \ --broker-list localhost:9092 --topic TopicTest > /dev/nullConsumer (Receive “Hello World”):
$ kafka_2.11-1.0.0/bin/kafka-console-consumer.sh --zookeeper \ localhost:2181 --topic TopicTest --from-beginning --max-messages 1 --timeout-ms 3000
Install development tools:
Ubuntu 16.04:
$ sudo apt-get install build-essential bison autotools-dev autoconf $ sudo apt-get install pkg-config flex libtoolCentOS:
$ sudo yum group install 'Development Tools'
Install Apache Kafka C/C++ client library:
$ git clone https://github.com/edenhill/librdkafka.git ~/librdkafka
$ cd ~/librdkafka
$ git checkout -b v0.9.5 v0.9.5
$ ./configure --prefix=/usr
$ make
$ sudo make install
Build collectd with Kafka support:
$ git clone https://github.com/collectd/collectd.git ~/collectd
$ cd ~/collectd
$ ./build.sh
$ ./configure --with-librdkafka=/usr --without-perl-bindings --enable-perl=no
$ make && sudo make install
Note
If installing from git repository collectd.conf configuration file will be located in
directory /opt/collectd/etc/. If installing from via a package manager collectd.conf
configuration file will be located in directory /etc/collectd/
Configure and start collectd. Modify Collectd configuration file collectd.conf
as following:
Start collectd process as a service as described in Installing collectd as a service.
In this mode Collectd runs from within a VM and sends metrics to the VES collector.
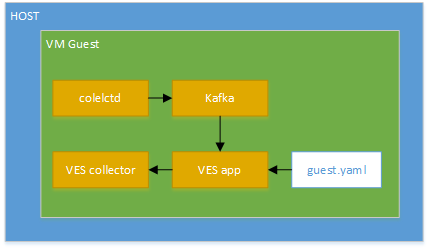
VES guest mode setup
Install dependencies:
$ sudo pip install pyyaml python-kafka
Clone Barometer repo and start the VES application:
$ git clone https://gerrit.opnfv.org/gerrit/barometer
$ cd barometer/3rd_party/collectd-ves-app/ves_app
$ nohup python ves_app.py --events-schema=guest.yaml --config=ves_app_config.conf > ves_app.stdout.log &
Modify Collectd configuration file collectd.conf as following:
LoadPlugin logfile LoadPlugin interface LoadPlugin memory LoadPlugin load LoadPlugin disk LoadPlugin uuid LoadPlugin write_kafka <Plugin logfile> LogLevel info File "/opt/collectd/var/log/collectd.log" Timestamp true PrintSeverity false </Plugin> <Plugin cpu> ReportByCpu true ReportByState true ValuesPercentage true </Plugin> <Plugin write_kafka> Property "metadata.broker.list" "localhost:9092" <Topic "collectd"> Format JSON </Topic> </Plugin>
Start collectd process as a service as described in Installing collectd as a service.
Note
The above configuration is used for a localhost. The VES application can be
configured to use remote VES collector and remote Kafka server. To do
so, the IP addresses/host names needs to be changed in collector.conf
and ves_app_config.conf files accordingly.
This mode is used to collect hypervisor statistics about guest VMs and to send those metrics into the VES collector. Also, this mode collects host statistics and send them as part of the guest VES message.
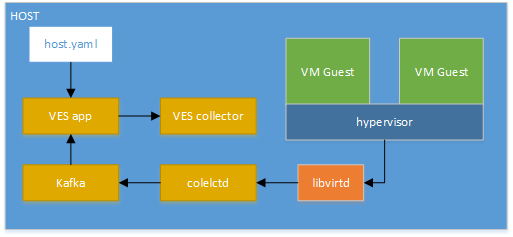
VES hypervisor mode setup
Running the VES in hypervisor mode looks like steps described in Setup VES application (guest mode) but with the following exceptions:
hypervisor.yaml configuration file should be used instead of guest.yaml
file when VES application is running.libvirtd dependencies needs to be installed on where
collectd daemon is running. To install those dependencies, see virt plugin
section of Barometer user guide.Note
At least one VM instance should be up and running by hypervisor on the host.
LoadPlugin logfile
LoadPlugin cpu
LoadPlugin virt
LoadPlugin write_kafka
<Plugin logfile>
LogLevel info
File "/opt/collectd/var/log/collectd.log"
Timestamp true
PrintSeverity false
</Plugin>
<Plugin virt>
Connection "qemu:///system"
RefreshInterval 60
HostnameFormat uuid
PluginInstanceFormat name
ExtraStats "cpu_util"
</Plugin>
<Plugin write_kafka>
Property "metadata.broker.list" "localhost:9092"
<Topic "collectd">
Format JSON
</Topic>
</Plugin>
Start collectd process as a service as described in Installing collectd as a service.
Note
The above configuration is used for a localhost. The VES application can be
configured to use remote VES collector and remote Kafka server. To do
so, the IP addresses/host names needs to be changed in collector.conf
and ves_app_config.conf files accordingly.
Note
The list of the plugins can be extented depends on your needs.
This mode is used to collect platform wide metrics and to send those metrics into the VES collector. It is most suitable for running within a baremetal platform.
Install dependencies:
$ sudo pip install pyyaml
Clone Barometer repo and start the VES application:
$ git clone https://gerrit.opnfv.org/gerrit/barometer
$ cd barometer/3rd_party/collectd-ves-app/ves_app
$ nohup python ves_app.py --events-schema=host.yaml --config=ves_app_config.conf > ves_app.stdout.log &
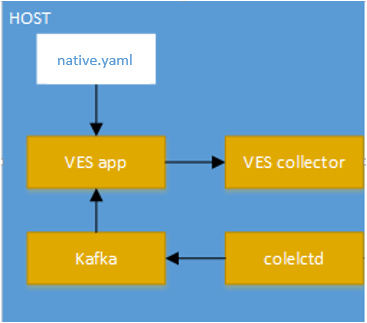
VES Native mode setup
Modify collectd configuration file collectd.conf as following:
LoadPlugin interface
LoadPlugin memory
LoadPlugin disk
LoadPlugin cpu
<Plugin cpu>
ReportByCpu true
ReportByState true
ValuesPercentage true
</Plugin>
LoadPlugin write_kafka
<Plugin write_kafka>
Property "metadata.broker.list" "localhost:9092"
<Topic "collectd">
Format JSON
</Topic>
</Plugin>
Start collectd process as a service as described in Installing collectd as a service.
Note
The above configuration is used for a localhost. The VES application can be
configured to use remote VES collector and remote Kafka server. To do
so, the IP addresses/host names needs to be changed in collector.conf
and ves_app_config.conf files accordingly.
Note
The list of the plugins can be extented depends on your needs.
Note
Test Collector setup is required only for VES application testing purposes.
Install dependencies:
$ sudo pip install jsonschema
Clone VES Test Collector:
$ git clone https://github.com/att/evel-test-collector.git ~/evel-test-collector
Modify VES Test Collector config file to point to existing log directory and schema file:
$ sed -i.back 's/^\(log_file[ ]*=[ ]*\).*/\1collector.log/' ~/evel-test-collector/config/collector.conf
$ sed -i.back 's/^\(schema_file[ ]*=.*\)event_format_updated.json$/\1CommonEventFormat.json/' ~/evel-test-collector/config/collector.conf
Start VES Test Collector:
$ cd ~/evel-test-collector/code/collector
$ nohup python ./collector.py --config ../../config/collector.conf > collector.stdout.log &
Details of the Vendor Event Listener REST service
REST resources are defined with respect to a ServerRoot:
ServerRoot = https://{Domain}:{Port}/{optionalRoutingPath}
REST resources are of the form:
{ServerRoot}/eventListener/v{apiVersion}`
{ServerRoot}/eventListener/v{apiVersion}/{topicName}`
{ServerRoot}/eventListener/v{apiVersion}/eventBatch`
Within the VES directory (3rd_party/collectd-ves-app/ves_app) there is a
configuration file called ves_app_conf.conf. The description of the
configuration options are described below:
127.0.0.1)30000)vendor_event_listener)example_vnf)false)20)3)9092)localhost)The format of the VES message is generated by the VES application based on the
YAML schema configuration file provided by user via --events-schema
command-line option of the application.
Note
Use --help option of VES application to see the
description of all available options
Note
The detailed installation guide of the VES application is described in the VES Application User Guide.
The message defined by YAML schema should correspond to format defined in VES shema definition.
Warning
This section doesn’t explain the YAML language itself, so the knowledge of the YAML language is required before continue reading it!
Since, the VES message output is a JSON format, it’s recommended to understand how YAML document is converted to JSON before starting to create a new YAML definition for the VES. E.g.:
The following YAML document:
---
additionalMeasurements:
plugin: somename
instance: someinstance
will be converted to JSON like this:
{
"additionalMeasurements": {
"instance": "someinstance",
"plugin": "somename"
}
}
Note
The YAML syntax section of PyYAML documentation can be used as a reference for this.
The VES agent can generate two type of messages which are sent to the VES collector. Each message type must be specified in the YAML configuration file using a specific YAML tag.
This type is used to send a message defined in YAML configuration to the VES
collector with a specified interval (default is 20 sec and it’s configurable
via command line option of the application). This type can be specified in
the configuration using !Measurements tag. For instance:
---
# My comments
My Host Measurements: !Measurements
... # message definition
This type is used to send a message defined in YAML configuration to the VES
collector when collectd notification is received from Kafka bus (collectd
write_kafka plugin). This type can be specified in the configuration
using !Events tag. For instance:
---
# My comments
My Events: !Events
... # event definition
The VES application caches collectd metrics received via Kafka bus. The data is stored in a table format. It’s important to know it before mapping collectd metric values to message defined in YAML configuration file.
VES collectd metric cache example:
| host | plugin | plugin_instance | type | type_instace | time | value | ds_name | interval |
|---|---|---|---|---|---|---|---|---|
| localhost | cpu | percent | user | 1509535512.30567 | 16 | value | 10 | |
| localhost | memory | memory | free | 1509535573.448014 | 798456 | value | 10 | |
| localhost | interface | eth0 | if_packets | 1509544183.956496 | 253 | rx | 10 | |
| 7ec333e7 | virt | Ubuntu-12.04.5-LTS | percent | virt_cpu_total | 1509544402.378035 | 0.2 | value | 10 |
| 7ec333e7 | virt | Ubuntu-12.04.5-LTS | memory | rss | 1509544638.55119 | 123405 | value | 10 |
| 7ec333e7 | virt | Ubuntu-12.04.5-LTS | if_octets | vnet1 | 1509544646.27108 | 67 | tx | 10 |
| cc659a52 | virt | Ubuntu-16.04 | percent | virt_cpu_total | 1509544745.617207 | 0.3 | value | 10 |
| cc659a52 | virt | Ubuntu-16.04 | memory | rss | 1509544754.329411 | 4567 | value | 10 |
| cc659a52 | virt | Ubuntu-16.04 | if_octets | vnet0 | 1509544760.720381 | 0 | rx | 10 |
It’s possible from YAML configuration file to refer to any field of any row of
the table via special YAML tags like ValueItem or ArrayItem. See the
Collectd metric reference reference for more details.
Note
The collectd data types file contains map of type to
ds_name field. It can be used to get possible value for ds_name
field. See the collectd data types description for more details on
collectd data types.
If the metric will not be updated by the collectd during the double metric interval time, it will be removed (aged) from VES internal cache.
There are four type of references supported by the YAML format: System, Config, Collectd metric and Collectd notification. The format of the reference is the following:
"{<ref type>.<attribute name>}"
Note
Possible values for <ref type> and <attribute name> are
described in farther sections.
This reference is used to get system statistics like time, date etc. The system
reference (<ref type> = system) can be used in any place of the YAML
configuration file. This type of reference provides the following attributes:
hostnameidtime1509641411.631951.dateYYYY-MM-DD. For instance 2017-11-02.For example:
Date: "{system.date}"
This reference is used to get VES configuration described in VES application
configuration description sectoin. The reference (<ref type> = config)
can be used in any place of the YAML configuration file. This type of reference
provides the following attributes:
intervalSendEventInterval
configuration of the VES application.For example:
Interval: "{config.interval}"
This reference is used to get the attribute value of collectd metric from the
VES cache. The reference (<ref type> = vl) can be used ONLY inside
Measurements, ValueItem and ArrayItem tags. Using the reference
inside a helper tag is also allowed if the helper tag is located inside the
tag where the reference is allowed (e.g.: ArrayItem). The
<attribute name> name corresponds to the table field name described in
Collectd metrics in VES section. For example:
name: "{vl.type}-{vl.type_instance}"
This reference is used to get the attribute value of received collectd
notification. The reference (<ref type> = n) can be used ONLY inside
Events tag. Using the reference inside a helper tag is also allowed if
the helper tag is located inside the Events tag. This type of reference
provides the following attributes:
hostpluginplugin_instancetypetype_instanceseveritymessageNote
The exact value for each attribute depends on the collectd plugin which may generate the notification. Please refer to the collectd plugin description document to get more details on the specific collectd plugin.
YAML config example:
sourceId: "{n.plugin_instance}"
This section describes the YAML tags used to map collectd metric values in the YAML configuration file.
This tag is a YAML map which is used to define the VES measurement message. It’s allowed to be used multiple times in the document (e.g.: you can define multiple VES messages in one YAML document). This tag works in the same way as ArrayItem tag does and all keys have the same description/rules.
This tag is used to select a collectd metric and get its attribute value using Collectd metric reference. The type of this tag is a YAML array of maps with the possible keys described below.
SELECT (required)VALUE (optional)!Number "{vl.value}" expression is used.DEFAULT (optional)SELECT criteria.ValueItem tag description example:
memoryFree: !ValueItem
- SELECT:
plugin: memory
type: memory
type_instance: rss
- VALUE: !Bytes2Kibibytes "{vl.value}"
- DEFAULT: 0
The tag process workflow is described on the figure below.
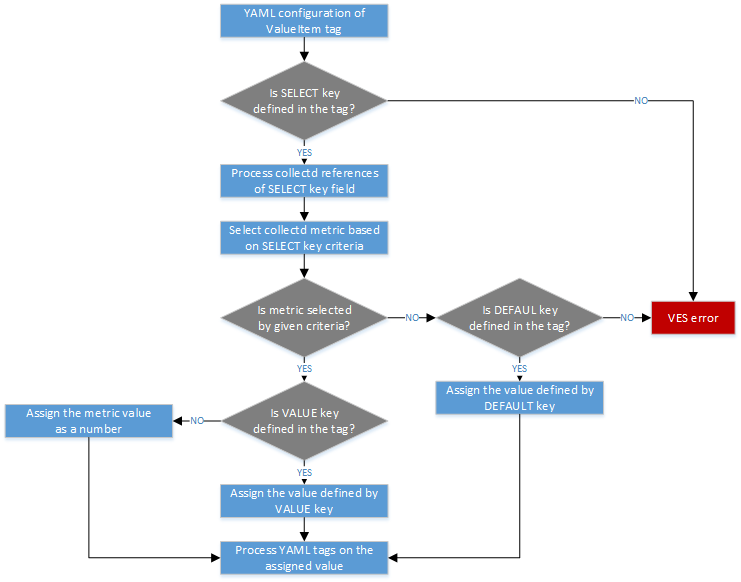
YAML ValueItem tag process workflow
This tag is used to select a list of collectd metrics and generate a YAML array
of YAML items described by ITEM-DESC key. If no collectd metrics are
selected by the given criteria, the empty array will be returned.
SELECT (optional)Is a YAML map which describes the select metrics criteria. Each key name of
the map must correspond to the table field name described in Collectd
metrics in VES section. The value of the key may be regular expression. To
enable regular expression in the value, the YAML string containing / char
at the beginning and at the end should be used. For example:
plugin: "/^(?!virt).*$/" # selected all metrics except ``virt`` plugin
The VES application uses the python RE library to work with regular expression specified in the YAML configuration. Please refer to python regular expression syntax documentation for more details on a syntax used by the VES.
Multiple SELECT keys are allowed by the tag. If nor SELECT or
INDEX-KEY key is specified, the VES error is generated.
INDEX-KEY (optional)ITEM-DESC key.ITEM-DESC (required)ArrayItem tags and other Helper YAML tags are also
allowed in the definition of the key.In the example below, the ArrayItem tag is used to generate an array of
ITEM-DESC items for each collectd metrics except virt plugin with
unique plugin, plugin_instance attribute values.
Measurements: !ArrayItem
- SELECT:
plugin: "/^(?!virt).*$/"
- INDEX-KEY:
- plugin
- plugin_instance
- ITEM-DESC:
name: !StripExtraDash "{vl.plugin}-{vl.plugin_instance}"
The tag process workflow is described on the figure below.
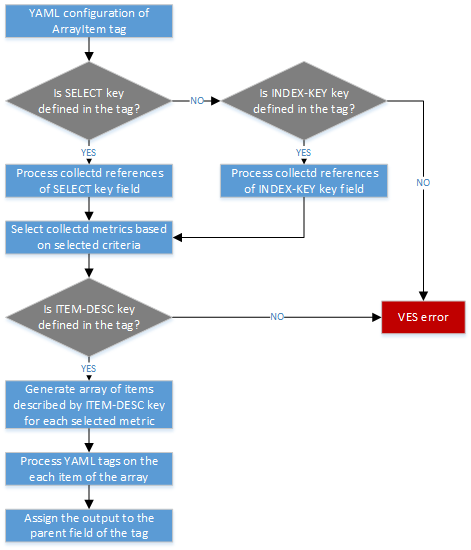
YAML ArrayItem tag process workflow
This section describes the YAML tags used to map the collectd notification to the VES event message in the YAML configuration file.
This tag is a YAML map which is used to define the VES event message. It’s allowed to be used multiple times in the document (e.g.: you can map multiple collectd notification into VES message in one YAML document). The possible keys of the tag are described below.
CONDITION (optional)ITEM-DESC (required)The example of the VES event message which will be generate by the VES
application when collectd notification of the virt plugin is triggered
is described below.
---
Virt Event: !Events
- ITEM-DESC:
event:
commonEventHeader:
domain: fault
eventType: Notification
sourceId: &event_sourceId "{n.plugin_instance}"
sourceName: *event_sourceId
lastEpochMicrosec: !Number "{n.time}"
startEpochMicrosec: !Number "{n.time}"
faultFields:
alarmInterfaceA: !StripExtraDash "{n.plugin}-{n.plugin_instance}"
alarmCondition: "{n.severity}"
faultFieldsVersion: 1.1
- CONDITION:
plugin: virt
This section describes the YAML tags used as utilities for formatting the output message. The YAML configuration process workflow is described on the figure below.
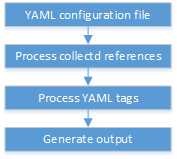
YAML configuration process workflow
The !Number tag is used in YAML configuration file to convert string value into
the number type. For instance:
lastEpochMicrosec: !Number "3456"
The output of the tag will be the JSON number.
{
lastEpochMicrosec: 3456
}
The !Bytes2Kibibytes tag is used in YAML configuration file to convert
bytes into kibibytes (1 kibibyte = 1024 bytes). For instance:
memoryConfigured: !Bytes2Kibibytes 4098
memoryConfigured: !Bytes2Kibibytes "1024"
The output of the tag will be the JSON number.
{
memoryConfigured: 4
memoryConfigured: 1
}
The !MapValue tag is used in YAML configuration file to map one value
into another value defined in the configuration. For instance:
Severity: !MapValue
VALUE: Failure
TO:
Failure: Critical
Error: Warnign
The output of the tag will be the mapped value.
{
Severity: Critical
}
The !StripExtraDash tag is used in YAML configuration file to strip extra
dashes in the string (dashes at the beginning, at the end and double dashes).
For example:
name: !StripExtraDash string-with--extra-dashes-
The output of the tag will be the JSON string with extra dashes removed.
{
name: string-with-extra-dashes
}
The intention of this user guide is to outline how to install and test the Barometer project’s docker images. The OPNFV docker hub contains 5 docker images from the Barometer project:
For description of images please see section Barometer Docker Images Description
For steps to build and run Collectd image please see section Build and Run Collectd Docker Image
For steps to build and run InfluxDB and Grafana images please see section Build and Run InfluxDB and Grafana Docker Images
For steps to build and run VES and Kafka images please see section Build and Run VES and Kafka Docker Images
For overview of running VES application with Kafka please see the VES Application User Guide
The barometer collectd docker image gives you a collectd installation that includes all the barometer plugins.
Note
The Dockerfile is available in the docker/barometer-collectd directory in the barometer repo. The Dockerfile builds a CentOS 7 docker image. The container MUST be run as a privileged container.
Collectd is a daemon which collects system performance statistics periodically and provides a variety of mechanisms to publish the collected metrics. It supports more than 90 different input and output plugins. Input plugins retrieve metrics and publish them to the collectd deamon, while output plugins publish the data they receive to an end point. Collectd also has infrastructure to support thresholding and notification.
Collectd docker image has enabled the following collectd plugins (in addition to the standard collectd plugins):
Plugins and third party applications in Barometer repository that will be available in the docker image:
The Barometer project’s InfluxDB and Grafana docker images are 2 docker images that database and graph statistics reported by the Barometer collectd docker. InfluxDB is an open-source time series database tool which stores the data from collectd for future analysis via Grafana, which is a open-source metrics anlytics and visualisation suite which can be accessed through any browser.
The Barometer project’s VES application and Kafka docker images are based on a CentOS 7 image. Kafka docker image has a dependancy on Zookeeper. Kafka must be able to connect and register with an instance of Zookeeper that is either running on local or remote host. Kafka recieves and stores metrics recieved from Collectd. VES application pulls latest metrics from Kafka which it normalizes into VES format for sending to a VES collector. Please see details in VES Application User Guide
Note
This step has to be performed only if host is behind HTTP/HTTPS proxy
Proxy URL have to be set in dedicated config file
proxy=http://your.proxy.domain:1234
Acquire::http::Proxy "http://your.proxy.domain:1234"
After update of config file, apt mirrors have to be updated via ‘apt-get update’
$ sudo apt-get update
Note
This step has to be performed only if host is behind HTTP/HTTPS proxy
Configuring proxy for packaging system is not enough, also some proxy environment variables have to be set in the system before ansible scripts can be started. Barometer configures docker proxy automatically via ansible task as a part of ‘one click install’ process - user only has to provide proxy URL using common shell environment variables and ansible will automatically configure proxies for docker(to be able to fetch barometer images). Another component used by ansible (e.g. pip is used for downloading python dependencies) will also benefit from setting proxy variables properly in the system.
Variables mentioned above have to be visible for superuser (because most actions involving ansible-barometer installation require root privileges). Proxy variables are commonly defined in ‘/etc/environment’ file (but any other place is good as long as variables can be seen by commands using ‘su’).
Sample proxy configuration in /etc/environment:
http_proxy=http://your.proxy.domain:1234
https_proxy=http://your.proxy.domain:1234
ftp_proxy=http://your.proxy.domain:1234
no_proxy=localhost
Note
The following steps have been verified with Ansible 2.6.3 on Ubuntu 16.04 and 18.04. To install Ansible 2.6.3 on Ubuntu:
$ sudo apt-get install python
$ sudo apt-get install python-pip
$ sudo pip install 'ansible==2.6.3'
The following steps have been verified with Ansible 2.6.3 on Centos 7.5. To install Ansible 2.6.3 on Centos:
$ sudo yum install python
$ sudo yum install epel-release
$ sudo yum install python-pip
$ sudo pip install 'ansible==2.6.3'
$ git clone https://gerrit.opnfv.org/gerrit/barometer
$ cd barometer/docker/ansible
Edit inventory file and add hosts: $barometer_dir/docker/ansible/default.inv
[collectd_hosts]
localhost
[collectd_hosts:vars]
install_mcelog=true
insert_ipmi_modules=true
[influxdb_hosts]
localhost
[grafana_hosts]
localhost
[prometheus_hosts]
#localhost
[kafka_hosts]
#localhost
[ves_hosts]
#localhost
Change localhost to different hosts where neccessary. Hosts for influxdb and grafana are required only for collectd_service.yml. Hosts for kafka and ves are required only for collectd_ves.yml.
To change host for kafka edit kafka_ip_addr in ./roles/config_files/vars/main.yml.
By default ansible will try to fulfill dependencies for mcelog and ipmi plugin. For mcelog plugin it installs mcelog daemon. For ipmi it tries to insert ipmi_devintf and ipmi_si kernel modules. This can be changed in inventory file with use of variables install_mcelog and insert_ipmi_modules, both variables are independent:
[collectd_hosts:vars]
install_mcelog=false
insert_ipmi_modules=false
Note
On Ubuntu 18.04 to use mcelog plugin the user has to install mcelog daemon manually ahead of installing from ansible scripts as the deb package is not available in official Ubuntu 18.04 repo. It means that setting install_mcelog to true is ignored.
Generate ssh keys if not present, otherwise move onto next step.
$ sudo ssh-keygen
Copy ssh key to all target hosts. It requires to provide root password. The example is for localhost.
$ sudo ssh-copy-id root@localhost
Verify that key is added and password is not required to connect.
$ sudo ssh root@localhost
Note
Keys should be added to every target host and [localhost] is only used as an example. For multinode installation keys need to be copied for each node: [collectd_hostname], [influxdb_hostname] etc.
The One Click installation features easy and scalable deployment of Collectd, Influxdb and Grafana containers using Ansible playbook. The following steps goes through more details.
$ sudo ansible-playbook -i default.inv collectd_service.yml
Check the three containers are running, the output of docker ps should be similar to:
$ sudo docker ps
CONTAINER ID IMAGE COMMAND CREATED STATUS PORTS NAMES
a033aeea180d opnfv/barometer-grafana "/run.sh" 9 days ago Up 7 minutes bar-grafana
1bca2e4562ab opnfv/barometer-influxdb "/entrypoint.sh in..." 9 days ago Up 7 minutes bar-influxdb
daeeb68ad1d5 opnfv/barometer-collectd "/run_collectd.sh ..." 9 days ago Up 7 minutes bar-collectd
To make some changes when a container is running run:
$ sudo docker exec -ti <CONTAINER ID> /bin/bash
Connect to <host_ip>:3000 with a browser and log into Grafana: admin/admin. For short introduction please see the: Grafana guide.
The collectd configuration files can be accessed directly on target system in ‘/opt/collectd/etc/collectd.conf.d’. It can be used for manual changes or enable/disable plugins. If configuration has been modified it is required to restart collectd:
$ sudo docker restart bar-collectd
Before running Kafka an instance of zookeeper is required. See Run Kafka docker image for notes on how to run it. The ‘zookeeper_hostname’ and ‘broker_id’ can be set in ./roles/run_kafka/vars/main.yml.
$ sudo ansible-playbook -i default.inv collectd_ves.yml
Check the three containers are running, the output of docker ps should be similar to:
$ sudo docker ps
CONTAINER ID IMAGE COMMAND CREATED STATUS PORTS NAMES
8b095ad94ea1 zookeeper:3.4.11 "/docker-entrypoin..." 7 minutes ago Up 7 minutes awesome_jennings
eb8bba3c0b76 opnfv/barometer-ves "./start_ves_app.s..." 21 minutes ago Up 6 minutes bar-ves
86702a96a68c opnfv/barometer-kafka "/src/start_kafka.sh" 21 minutes ago Up 6 minutes bar-kafka
daeeb68ad1d5 opnfv/barometer-collectd "/run_collectd.sh ..." 13 days ago Up 6 minutes bar-collectd
To make some changes when a container is running run:
$ sudo docker exec -ti <CONTAINER ID> /bin/bash
Some of the plugins are loaded depending on specific system requirements and can be omitted if dependency is not met, this is the case for:
- hugepages, ipmi, mcelog, intel_rdt, virt, ovs_stats, ovs_events
Tags can be used to run a specific part of the configuration without running the whole playbook. To run a specific parts only:
$ sudo ansible-playbook -i default.inv collectd_service.yml --tags "syslog,cpu,uuid"
To disable some parts or plugins:
$ sudo ansible-playbook -i default.inv collectd_service.yml --skip-tags "en_default_all,syslog,cpu,uuid"
List of available tags:
Note
The below sections provide steps for manual installation and configuration of docker images. They are not neccessary if docker images were installed with use of Ansible-Playbook.
Note
To install docker:
$ sudo apt-get install curl
$ sudo curl -fsSL https://get.docker.com/ | sh
$ sudo usermod -aG docker <username>
$ sudo systemctl status docker
Replace <username> above with an appropriate user name.
Note
To install docker:
$ sudo yum remove docker docker-common docker-selinux docker-engine
$ sudo yum install -y yum-utils device-mapper-persistent-data lvm2
$ sudo yum-config-manager --add-repo https://download.docker.com/linux/centos/docker-ce.repo
$ sudo yum-config-manager --enable docker-ce-edge
$ sudo yum-config-manager --enable docker-ce-test
$ sudo yum install docker-ce
$ sudo usermod -aG docker <username>
$ sudo systemctl status docker
Replace <username> above with an appropriate user name.
Note
If this is the first time you are installing a package from a recently added repository, you will be prompted to accept the GPG key, and the key’s fingerprint will be shown. Verify that the fingerprint is correct, and if so, accept the key. The fingerprint should match060A 61C5 1B55 8A7F 742B 77AA C52F EB6B 621E 9F35.
Retrieving key from https://download.docker.com/linux/centos/gpg Importing GPG key 0x621E9F35:
Userid : “Docker Release (CE rpm) <docker@docker.com>” Fingerprint: 060a 61c5 1b55 8a7f 742b 77aa c52f eb6b 621e 9f35 From : https://download.docker.com/linux/centos/gpgIs this ok [y/N]: y
Note
This applies for both CentOS and Ubuntu.
If you are behind an HTTP or HTTPS proxy server, you will need to add this configuration in the Docker systemd service file.
$ sudo mkdir -p /etc/systemd/system/docker.service.d
2. Create a file called /etc/systemd/system/docker.service.d/http-proxy.conf that adds the HTTP_PROXY environment variable:
[Service]
Environment="HTTP_PROXY=http://proxy.example.com:80/"
Or, if you are behind an HTTPS proxy server, create a file called /etc/systemd/system/docker.service.d/https-proxy.conf that adds the HTTPS_PROXY environment variable:
[Service]
Environment="HTTPS_PROXY=https://proxy.example.com:443/"
Or create a single file with all the proxy configurations: /etc/systemd/system/docker.service.d/proxy.conf
[Service]
Environment="HTTP_PROXY=http://proxy.example.com:80/"
Environment="HTTPS_PROXY=https://proxy.example.com:443/"
Environment="FTP_PROXY=ftp://proxy.example.com:443/"
Environment="NO_PROXY=localhost"
$ sudo systemctl daemon-reload
$ sudo systemctl restart docker
sudo systemctl show --property=Environment docker
Note
This applies for both CentOS and Ubuntu.
$ sudo docker run hello-world
The output should be something like:
Unable to find image 'hello-world:latest' locally
latest: Pulling from library/hello-world
5b0f327be733: Pull complete
Digest: sha256:07d5f7800dfe37b8c2196c7b1c524c33808ce2e0f74e7aa00e603295ca9a0972
Status: Downloaded newer image for hello-world:latest
Hello from Docker!
This message shows that your installation appears to be working correctly.
To generate this message, Docker took the following steps:
1. The Docker client contacted the Docker daemon.
2. The Docker daemon pulled the "hello-world" image from the Docker Hub.
3. The Docker daemon created a new container from that image which runs the
executable that produces the output you are currently reading.
4. The Docker daemon streamed that output to the Docker client, which sent it
to your terminal.
To try something more ambitious, you can run an Ubuntu container with:
$ docker run -it ubuntu bash
If you wish to use a pre-built barometer image, you can pull the barometer image from https://hub.docker.com/r/opnfv/barometer-collectd/
$ docker pull opnfv/barometer-collectd
$ git clone https://gerrit.opnfv.org/gerrit/barometer
$ cd barometer/docker/barometer-collectd
$ sudo docker build -t opnfv/barometer-collectd --build-arg http_proxy=`echo $http_proxy` \
--build-arg https_proxy=`echo $https_proxy` -f Dockerfile .
Note
Main directory of barometer source code (directory that contains ‘docker’,
‘docs’, ‘src’ and systems sub-directories) will be referred as
<BAROMETER_REPO_DIR>
Note
In the above mentioned docker build command, http_proxy & https_proxy arguments needs to be
passed only if system is behind an HTTP or HTTPS proxy server.
Check the docker images:
$ sudo docker images
Output should contain a barometer-collectd image:
REPOSITORY TAG IMAGE ID CREATED SIZE
opnfv/barometer-collectd latest 05f2a3edd96b 3 hours ago 1.2GB
centos 7 196e0ce0c9fb 4 weeks ago 197MB
centos latest 196e0ce0c9fb 4 weeks ago 197MB
hello-world latest 05a3bd381fc2 4 weeks ago 1.84kB
$ cd <BAROMETER_REPO_DIR>
$ sudo docker run -ti --net=host -v \
`pwd`/src/collectd/collectd_sample_configs:/opt/collectd/etc/collectd.conf.d \
-v /var/run:/var/run -v /tmp:/tmp --privileged opnfv/barometer-collectd
Note
The docker collectd image contains configuration for all the collectd plugins. In the command above we are overriding /opt/collectd/etc/collectd.conf.d by mounting a host directory src/collectd/collectd_sample_configs that contains only the sample configurations we are interested in running. It’s important to do this if you don’t have DPDK, or RDT installed on the host. Sample configurations can be found at: https://github.com/opnfv/barometer/tree/master/src/collectd/collectd_sample_configs
Check your docker image is running
sudo docker ps
To make some changes when the container is running run:
sudo docker exec -ti <CONTAINER ID> /bin/bash
The barometer-influxdb image is based on the influxdb:1.3.7 image from the influxdb dockerhub. To view detils on the base image please visit https://hub.docker.com/_/influxdb/ Page includes details of exposed ports and configurable enviromental variables of the base image.
The barometer-grafana image is based on grafana:4.6.3 image from the grafana dockerhub. To view details on the base image please visit https://hub.docker.com/r/grafana/grafana/ Page includes details on exposed ports and configurable enviromental variables of the base image.
The barometer-grafana image includes pre-configured source and dashboards to display statistics exposed by the barometer-collectd image. The default datasource is an influxdb database running on localhost but the address of the influxdb server can be modified when launching the image by setting the environmental variables influxdb_host to IP or hostname of host on which influxdb server is running.
Additional dashboards can be added to barometer-grafana by mapping a volume to /opt/grafana/dashboards. Incase where a folder is mounted to this volume only files included in this folder will be visible inside barometer-grafana. To ensure all default files are also loaded please ensure they are included in volume folder been mounted. Appropriate example are given in section Run the Grafana docker image
If you wish to use pre-built barometer project’s influxdb and grafana images, you can pull the images from https://hub.docker.com/r/opnfv/barometer-influxdb/ and https://hub.docker.com/r/opnfv/barometer-grafana/
Note
If your preference is to build images locally please see sections Build InfluxDB Docker Image and Build Grafana Docker Image
$ docker pull opnfv/barometer-influxdb
$ docker pull opnfv/barometer-grafana
Note
If you have pulled the pre-built barometer-influxdb and barometer-grafana images there is no requirement to complete steps outlined in sections Build InfluxDB Docker Image and Build Grafana Docker Image and you can proceed directly to section Run the Influxdb and Grafana Images If you wish to run the barometer-influxdb and barometer-grafana images via Docker Compose proceed directly to section Docker Compose.
Build influxdb image from Dockerfile
$ cd barometer/docker/barometer-influxdb
$ sudo docker build -t opnfv/barometer-influxdb --build-arg http_proxy=`echo $http_proxy` \
--build-arg https_proxy=`echo $https_proxy` -f Dockerfile .
Note
In the above mentioned docker build command, http_proxy & https_proxy arguments needs to
be passed only if system is behind an HTTP or HTTPS proxy server.
Check the docker images:
$ sudo docker images
Output should contain an influxdb image:
REPOSITORY TAG IMAGE ID CREATED SIZE
opnfv/barometer-influxdb latest 1e4623a59fe5 3 days ago 191MB
Build Grafana image from Dockerfile
$ cd barometer/docker/barometer-grafana
$ sudo docker build -t opnfv/barometer-grafana --build-arg http_proxy=`echo $http_proxy` \
--build-arg https_proxy=`echo $https_proxy` -f Dockerfile .
Note
In the above mentioned docker build command, http_proxy & https_proxy arguments needs to
be passed only if system is behind an HTTP or HTTPS proxy server.
Check the docker images:
$ sudo docker images
Output should contain an influxdb image:
REPOSITORY TAG IMAGE ID CREATED SIZE
opnfv/barometer-grafana latest 05f2a3edd96b 3 hours ago 1.2GB
$ sudo docker run -tid -v /var/lib/influxdb:/var/lib/influxdb -p 8086:8086 -p 25826:25826 opnfv/barometer-influxdb
Check your docker image is running
sudo docker ps
To make some changes when the container is running run:
sudo docker exec -ti <CONTAINER ID> /bin/bash
Connecting to an influxdb instance running on local system and adding own custom dashboards
$ cd <BAROMETER_REPO_DIR>
$ sudo docker run -tid -v /var/lib/grafana:/var/lib/grafana -v ${PWD}/docker/barometer-grafana/dashboards:/opt/grafana/dashboards \
-p 3000:3000 opnfv/barometer-grafana
Connecting to an influxdb instance running on remote system with hostname of someserver and IP address of 192.168.121.111
$ sudo docker run -tid -v /var/lib/grafana:/var/lib/grafana -p 3000:3000 -e \
influxdb_host=someserver --add-host someserver:192.168.121.111 opnfv/barometer-grafana
Check your docker image is running
sudo docker ps
To make some changes when the container is running run:
sudo docker exec -ti <CONTAINER ID> /bin/bash
Connect to <host_ip>:3000 with a browser and log into grafana: admin/admin
If you wish to use pre-built barometer project’s VES and kafka images, you can pull the images from https://hub.docker.com/r/opnfv/barometer-ves/ and https://hub.docker.com/r/opnfv/barometer-kafka/
Note
If your preference is to build images locally please see sections `Build the Kafka Image`_ and `Build VES Image`_
$ docker pull opnfv/barometer-kafka
$ docker pull opnfv/barometer-ves
Note
If you have pulled the pre-built images there is no requirement to complete steps outlined in sections Build Kafka Docker Image and Build VES Docker Image and you can proceed directly to section Run Kafka Docker Image If you wish to run the docker images via Docker Compose proceed directly to section Docker Compose.
Build Kafka docker image:
$ cd barometer/docker/barometer-kafka
$ sudo docker build -t opnfv/barometer-kafka --build-arg http_proxy=`echo $http_proxy` \
--build-arg https_proxy=`echo $https_proxy` -f Dockerfile .
Note
In the above mentioned docker build command, http_proxy & https_proxy arguments needs
to be passed only if system is behind an HTTP or HTTPS proxy server.
Check the docker images:
$ sudo docker images
Output should contain a barometer image:
REPOSITORY TAG IMAGE ID CREATED SIZE
opnfv/barometer-kafka latest 05f2a3edd96b 3 hours ago 1.2GB
Build VES application docker image:
$ cd barometer/docker/barometer-ves
$ sudo docker build -t opnfv/barometer-ves --build-arg http_proxy=`echo $http_proxy` \
--build-arg https_proxy=`echo $https_proxy` -f Dockerfile .
Note
In the above mentioned docker build command, http_proxy & https_proxy arguments needs
to be passed only if system is behind an HTTP or HTTPS proxy server.
Check the docker images:
$ sudo docker images
Output should contain a barometer image:
REPOSITORY TAG IMAGE ID CREATED SIZE
opnfv/barometer-ves latest 05f2a3edd96b 3 hours ago 1.2GB
Note
Before running Kafka an instance of Zookeeper must be running for the Kafka broker to register with. Zookeeper can be running locally or on a remote platform. Kafka’s broker_id and address of its zookeeper instance can be configured by setting values for environmental variables ‘broker_id’ and ‘zookeeper_node’. In instance where ‘broker_id’ and/or ‘zookeeper_node’ is not set the default setting of broker_id=0 and zookeeper_node=localhost is used. In intance where Zookeeper is running on same node as Kafka and there is a one to one relationship between Zookeeper and Kafka, default setting can be used. The docker argument add-host adds hostname and IP address to /etc/hosts file in container
Run zookeeper docker image:
$ sudo docker run -tid --net=host -p 2181:2181 zookeeper:3.4.11
Run kafka docker image which connects with a zookeeper instance running on same node with a 1:1 relationship
$ sudo docker run -tid --net=host -p 9092:9092 opnfv/barometer-kafka
Run kafka docker image which connects with a zookeeper instance running on a node with IP address of 192.168.121.111 using broker ID of 1
$ sudo docker run -tid --net=host -p 9092:9092 --env broker_id=1 --env zookeeper_node=zookeeper --add-host \
zookeeper:192.168.121.111 opnfv/barometer-kafka
Note
VES application uses configuration file ves_app_config.conf from directory barometer/3rd_party/collectd-ves-app/ves_app/config/ and host.yaml file from barometer/3rd_party/collectd-ves-app/ves_app/yaml/ by default. If you wish to use a custom config file it should be mounted to mount point /opt/ves/config/ves_app_config.conf. To use an alternative yaml file from folder barometer/3rd_party/collectd-ves-app/ves_app/yaml the name of the yaml file to use should be passed as an additional command. If you wish to use a custom file the file should be mounted to mount point /opt/ves/yaml/ Please see examples below
Run VES docker image with default configuration
$ sudo docker run -tid --net=host opnfv/barometer-ves
Run VES docker image with guest.yaml files from barometer/3rd_party/collectd-ves-app/ves_app/yaml/
$ sudo docker run -tid --net=host opnfv/barometer-ves guest.yaml
Run VES docker image with using custom config and yaml files. In example below yaml/ folder cotains file named custom.yaml
$ sudo docker run -tid --net=host -v ${PWD}/custom.config:/opt/ves/config/ves_app_config.conf \
-v ${PWD}/yaml/:/opt/ves/yaml/ opnfv/barometer-ves custom.yaml
If you wish to use pre-built barometer project’s LocalAgent images, you can pull the images from https://hub.docker.com/r/opnfv/barometer-localagent/
Note
If your preference is to build images locally please see sections Build LocalAgent Docker Image
$ docker pull opnfv/barometer-localagent
Note
If you have pulled the pre-built images there is no requirement to complete steps outlined in sections Build LocalAgent Docker Image and you can proceed directly to section Run LocalAgent Docker Image If you wish to run the docker images via Docker Compose proceed directly to section Docker Compose.
Build LocalAgent docker image:
$ cd barometer/docker/barometer-dma
$ sudo docker build -t opnfv/barometer-dma --build-arg http_proxy=`echo $http_proxy` \
--build-arg https_proxy=`echo $https_proxy` -f Dockerfile .
Note
In the above mentioned docker build command, http_proxy & https_proxy arguments needs
to be passed only if system is behind an HTTP or HTTPS proxy server.
Check the docker images:
$ sudo docker images
Output should contain a barometer image:
REPOSITORY TAG IMAGE ID CREATED SIZE
opnfv/barometer-dma latest 2f14fbdbd498 3 hours ago 941 MB
Note
Before running LocalAgent, Redis must be running.
Run Redis docker image:
$ sudo docker run -tid -p 6379:6379 --name barometer-redis redis
Check your docker image is running
sudo docker ps
Run LocalAgent docker image with default configuration
$ cd barometer/docker/barometer-dma
$ sudo mkdir /etc/barometer-dma
$ sudo cp ../../src/dma/examples/config.toml /etc/barometer-dma/
$ sudo vi /etc/barometer-dma/config.toml
(edit amqp_password and os_password:OpenStack admin password)
$ sudo su -
(When there is no key for SSH access authentication)
# ssh-keygen
(Press Enter until done)
(Backup if necessary)
# cp ~/.ssh/authorized_keys ~/.ssh/authorized_keys_org
# cat ~/.ssh/authorized_keys_org ~/.ssh/id_rsa.pub \
> ~/.ssh/authorized_keys
# exit
$ sudo docker run -tid --net=host --name server \
-v /etc/barometer-dma:/etc/barometer-dma \
-v /root/.ssh/id_rsa:/root/.ssh/id_rsa \
-v /etc/collectd/collectd.conf.d:/etc/collectd/collectd.conf.d \
opnfv/barometer-dma /server
$ sudo docker run -tid --net=host --name infofetch \
-v /etc/barometer-dma:/etc/barometer-dma \
-v /var/run/libvirt:/var/run/libvirt \
opnfv/barometer-dma /infofetch
(Execute when installing the threshold evaluation binary)
$ sudo docker cp infofetch:/threshold ./
$ sudo ln -s ${PWD}/threshold /usr/local/bin/
On the node where you want to run influxdb + grafana or the node where you want to run the VES app zookeeper and Kafka containers together:
Note
The default configuration for all these containers is to run on the localhost. If this is not the model you want to use then please make the appropriate configuration changes before launching the docker containers.
$ sudo curl -L https://github.com/docker/compose/releases/download/1.17.0/docker-compose-`uname -s`-`uname -m` -o /usr/bin/docker-compose
Note
Use the latest Compose release number in the download command. The above command is an example, and it may become out-of-date. To ensure you have the latest version, check the Compose repository release page on GitHub.
$ sudo chmod +x /usr/bin/docker-compose
$ sudo docker-compose --version
Launch containers:
$ cd barometer/docker/compose/influxdb-grafana/
$ sudo docker-compose up -d
Check your docker images are running
$ sudo docker ps
Connect to <host_ip>:3000 with a browser and log into grafana: admin/admin
Launch containers:
$ cd barometer/docker/compose/ves/
$ sudo docker-compose up -d
Check your docker images are running
$ sudo docker ps
Containerized Compass uses five compass containers instead of a single VM.
Each container stands for a micro service and compass-core function separates into these five micro services:
- Compass-deck : RESTful API and DB Handlers for Compass
- Compass-tasks : Registered tasks and MQ modules for Compass
- Compass-cobbler : Cobbler container for Compass
- Compass-db : Database for Compass
- Compass-mq : Message Queue for Compass
Compass4nfv has several containers to satisfy OPNFV requirements:
- Compass-tasks-osa : compass-task’s adapter for deployment OpenStack via OpenStack-ansible
- Compass-tasks-k8s : compass-task’s adapter for deployment Kubernetes
- Compass-repo-osa-ubuntu : optional container to support OPNFV offfline installation via OpenStack-ansible
- Compass-repo-osa-centos : optional container to support OPNFV offfline installation via OpenStack-ansible
Picture below shows the new architecture of compass4nfv:
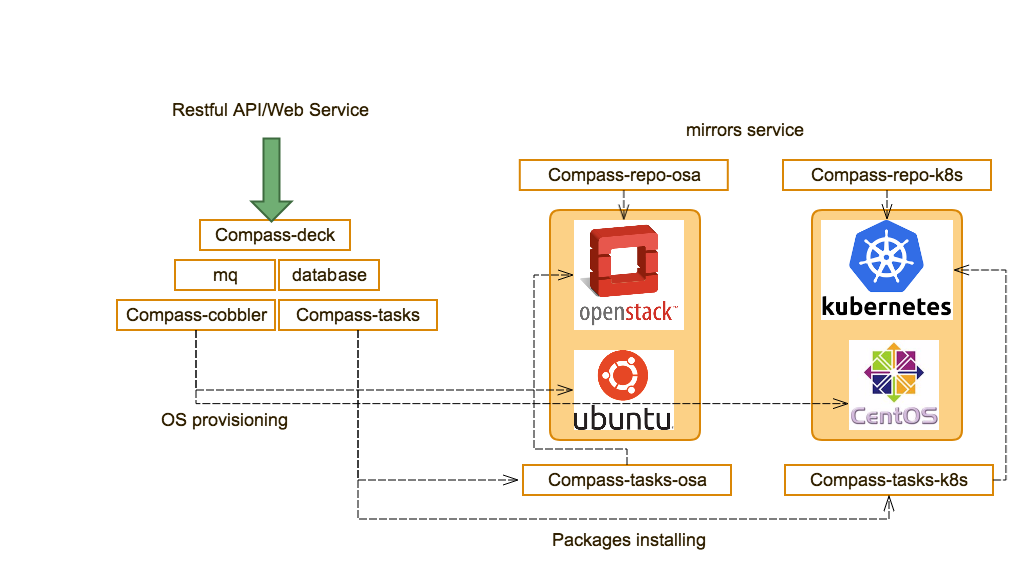
Fig 1. New Archietecture of Compass4nfv
This document describes how to install the Fraser release of OPNFV when using Compass4nfv as a deployment tool covering it’s limitations, dependencies and required system resources.
| OS only | OpenStack Liberty | OpenStack Mitaka | OpenStack Newton | OpenStack Ocata | OpenStack Pike | |
| CentOS 7 | yes | yes | yes | yes | no | yes |
| Ubuntu trusty | yes | yes | yes | no | no | no |
| Ubuntu xenial | yes | no | yes | yes | yes | yes |
| OpenStack Liberty | OpenStack Mitaka | OpenStack Newton | OpenStack Ocata | OpenStack Pike | |
| Virtual Deployment | Yes | Yes | Yes | Yes | Yes |
| Baremetal Deployment | Yes | Yes | Yes | Yes | Yes |
| HA | Yes | Yes | Yes | Yes | Yes |
| Ceph | Yes | Yes | Yes | Yes | Yes |
| SDN ODL/ONOS | Yes | Yes | Yes | Yes* | Yes* |
| Compute Node Expansion | Yes | Yes | Yes | No | No |
| Multi-Nic Support | Yes | Yes | Yes | Yes | Yes |
| Boot Recovery | Yes | Yes | Yes | Yes | Yes |
| SFC | No | No | Yes | Yes | Yes |
This document describes providing guidelines on how to install and configure the Danube release of OPNFV when using Compass as a deployment tool including required software and hardware configurations.
Installation and configuration of host OS, OpenStack, OpenDaylight, ONOS, Ceph etc. can be supported by Compass on Virtual nodes or Bare Metal nodes.
The audience of this document is assumed to have good knowledge in networking and Unix/Linux administration.
Before starting the installation of the Fraser release of OPNFV, some planning must be done.
First of all, The installation tarball is needed for deploying your OPNFV environment, it included packages of Compass, OpenStack, OpenDaylight, ONOS and so on.
The stable release tarball can be retrieved via OPNFV software download page
The daily build tarball can be retrieved via OPNFV artifacts repository:
http://artifacts.opnfv.org/compass4nfv.html
NOTE: Search the keyword “compass4nfv/Fraser” to locate the tarball.
E.g. compass4nfv/fraser/opnfv-2017-03-29_08-55-09.tar.gz
The name of tarball includes the time of tarball building, you can get the daily tarball according the building time. The git url and sha1 of Compass4nfv are recorded in properties files, According these, the corresponding deployment scripts can be retrieved.
To retrieve the repository of Compass4nfv on Jumphost use the following command:
NOTE: PLEASE DO NOT GIT CLONE COMPASS4NFV IN ROOT DIRECTORY(INCLUDE SUBFOLDERS).
To get stable/fraser release, you can use the following command:
If you have only 1 Bare Metal server, Virtual deployment is recommended. if more than or equal 3 servers, the Bare Metal deployment is recommended. The minimum number of servers for Bare metal deployment is 3, 1 for JumpServer(Jumphost), 1 for controller, 1 for compute.
The Jumphost requirements are outlined below:
Bare Metal nodes require:
Network requirements include:
The networks with(*) can be share one NIC(Default configuration) or use an exclusive NIC(Reconfigurated in network.yml).
In order to execute a deployment, one must gather the following information:
There are three configuration files a user needs to modify for a cluster deployment.
network_cfg.yaml for openstack networks on hosts.
dha file for host role, IPMI credential and host nic idenfitication (MAC address).
deploy.sh for os and openstack version.
network_cfg.yaml file describes networks configuration for openstack on hosts. It
specifies host network mapping and ip assignment of networks to be installed on hosts.
Compass4nfv includes a sample network_cfg.yaml under
compass4nfv/deploy/conf/network_cfg.yaml
There are three openstack networks to be installed: external, mgmt and storage. These three networks can be shared on one physical nic or on separate nics (multi-nic). The sample included in compass4nfv uses one nic. For multi-nic configuration, see multi-nic configuration.
**! All interface name in network_cfg.yaml must be identified in dha file by mac address !**
Compass4nfv will install networks on host as described in this configuration. It will look for physical nic on host by mac address from dha file and rename nic to the name with that mac address. Therefore, any network interface name that is not identified by mac address in dha file will not be installed correctly as compass4nfv cannot find the nic.
Configure provider network
provider_net_mappings:
- name: br-prv
network: physnet
interface: eth1
type: ovs
role:
- controller
- compute
The external nic in dha file must be named eth1 with mac address. If user uses a
different interface name in dha file, change eth1 to that name here.
Note: User cannot use eth0 for external interface name as install/pxe network is named as
such.
Configure openstack mgmt&storage network:
sys_intf_mappings:
- name: mgmt
interface: eth1
vlan_tag: 101
type: vlan
role:
- controller
- compute
- name: storage
interface: eth1
vlan_tag: 102
type: vlan
role:
- controller
- compute
Change vlan_tag of mgmt and storage to corresponding vlan tag configured on
switch.
Note: for virtual deployment, there is no need to modify mgmt&storage network.
If using multi-nic feature, i.e, separate nic for mgmt or storage network, user needs to
change name to desired nic name (need to match dha file). Please see multi-nic
configuration.
ip_settings section specifics ip assignment for openstack networks.
User can use default ip range for mgmt&storage network.
for external networks:
- name: external
ip_ranges:
- - "192.168.50.210"
- "192.168.50.220"
cidr: "192.168.50.0/24"
gw: "192.168.50.1"
role:
- controller
- compute
Provide at least number of hosts available ip for external IP range(these ips will be
assigned to each host). Provide actual cidr and gateway in cidr and gw fields.
configure public IP for horizon dashboard
public_vip:
ip: 192.168.50.240
netmask: "24"
interface: external
Provide an external ip in ip field. This ip cannot be within the ip range assigned to
external network configured in pervious section. It will be used for horizon address.
See section 6.2 (Vitual) and 7.2 (BareMetal) for graphs illustrating network topology.
The below file is the inventory template of deployment nodes:
“compass4nfv/deploy/conf/hardware_environment/huawei-pod1/dha.yml”
The “dha.yml” is a collectively name for “os-nosdn-nofeature-ha.yml os-ocl-nofeature-ha.yml os-odl_l2-moon-ha.yml etc”.
You can write your own IPMI IP/User/Password/Mac address/roles reference to it.
- name – Host name for deployment node after installation.
- ipmiVer – IPMI interface version for deployment node support. IPMI 1.0 or IPMI 2.0 is available.
- ipmiIP – IPMI IP address for deployment node. Make sure it can access from Jumphost.
- ipmiUser – IPMI Username for deployment node.
- ipmiPass – IPMI Password for deployment node.
- mac – MAC Address of deployment node PXE NIC.
- interfaces – Host NIC renamed according to NIC MAC addresses when OS provisioning.
- roles – Components deployed.
Set TYPE/FLAVOR and POWER TOOL
E.g. .. code-block:: yaml
TYPE: baremetal FLAVOR: cluster POWER_TOOL: ipmitool
Set ipmiUser/ipmiPass and ipmiVer
E.g.
ipmiUser: USER
ipmiPass: PASSWORD
ipmiVer: '2.0'
Assignment of different roles to servers
E.g. Openstack only deployment roles setting
hosts:
- name: host1
mac: 'F8:4A:BF:55:A2:8D'
interfaces:
- eth1: 'F8:4A:BF:55:A2:8E'
ipmiIp: 172.16.130.26
roles:
- controller
- ha
- name: host2
mac: 'D8:49:0B:DA:5A:B7'
interfaces:
- eth1: 'D8:49:0B:DA:5A:B8'
ipmiIp: 172.16.130.27
roles:
- compute
NOTE: THE ‘ha’ role MUST BE SELECTED WITH CONTROLLERS, EVEN THERE IS ONLY ONE CONTROLLER NODE.
E.g. Openstack and ceph deployment roles setting
hosts:
- name: host1
mac: 'F8:4A:BF:55:A2:8D'
interfaces:
- eth1: 'F8:4A:BF:55:A2:8E'
ipmiIp: 172.16.130.26
roles:
- controller
- ha
- ceph-adm
- ceph-mon
- name: host2
mac: 'D8:49:0B:DA:5A:B7'
interfaces:
- eth1: 'D8:49:0B:DA:5A:B8'
ipmiIp: 172.16.130.27
roles:
- compute
- ceph-osd
E.g. Openstack and ODL deployment roles setting
hosts:
- name: host1
mac: 'F8:4A:BF:55:A2:8D'
interfaces:
- eth1: 'F8:4A:BF:55:A2:8E'
ipmiIp: 172.16.130.26
roles:
- controller
- ha
- odl
- name: host2
mac: 'D8:49:0B:DA:5A:B7'
interfaces:
- eth1: 'D8:49:0B:DA:5A:B8'
ipmiIp: 172.16.130.27
roles:
- compute
E.g. Openstack and ONOS deployment roles setting
hosts:
- name: host1
mac: 'F8:4A:BF:55:A2:8D'
interfaces:
- eth1: 'F8:4A:BF:55:A2:8E'
ipmiIp: 172.16.130.26
roles:
- controller
- ha
- onos
- name: host2
mac: 'D8:49:0B:DA:5A:B7'
interfaces:
- eth1: 'D8:49:0B:DA:5A:B8'
ipmiIp: 172.16.130.27
roles:
- compute
Before deployment, there are some network configuration to be checked based on your network topology.Compass4nfv network default configuration file is “compass4nfv/deploy/conf/hardware_environment/huawei-pod1/network.yml”. This file is an example, you can customize by yourself according to specific network environment.
In this network.yml, there are several config sections listed following(corresponed to the ordre of the config file):
- name – provider network name.
- network – default as physnet, do not change it.
- interfaces – the NIC or Bridge attached by the Network.
- type – the type of the NIC or Bridge(vlan for NIC and ovs for Bridge, either).
- roles – all the possible roles of the host machines which connected by this network(mostly put both controller and compute).
- name – Network name.
- interfaces – the NIC or Bridge attached by the Network.
- vlan_tag – if type is vlan, add this tag before ‘type’ tag.
- type – the type of the NIC or Bridge(vlan for NIC and ovs for Bridge, either).
- roles – all the possible roles of the host machines which connected by this network(mostly put both controller and compute).
- name – network name corresponding the the network name in System Interface section one by one.
- ip_ranges – ip addresses range provided for this network.
- cidr – the IPv4 address and its associated routing prefix and subnet mask?
- gw – need to add this line only if network is external.
- roles – all the possible roles of the host machines which connected by this network(mostly put both controller and compute).
- ip – virtual or proxy ip address, must be in the same subnet with mgmt network but must not be in the range of mgmt network.
- netmask – the length of netmask
- interface – mostly mgmt.
- ip – virtual or proxy ip address, must be in the same subnet with external network but must not be in the range of external network.
- netmask – the length of netmask
- interface – mostly external.
- enable – must be True(if False, you need to set up provider network manually).
- network – leave it ext-net.
- type – the type of the ext-net above, such as flat or vlan.
- segment_id – when the type is vlan, this should be id of vlan.
- subnet – leave it ext-subnet.
- provider_network – leave it physnet.
- router – leave it router-ext.
- enable_dhcp – must be False.
- no_gateway – must be False.
- external_gw – same as gw in ip_settings.
- floating_ip_cidr – cidr for floating ip, see explanation in ip_settings.
- floating_ip_start – define range of floating ip with floating_ip_end(this defined range must not be included in ip range of external configured in ip_settings section).
- floating_ip_end – define range of floating ip with floating_ip_start.
The following figure shows the default network configuration.
+--+ +--+ +--+
| | | | | |
| | +------------+ | | | |
| +------+ Jumphost +------+ | | |
| | +------+-----+ | | | |
| | | | | | |
| | +------------+ +-----+ |
| | | | | |
| | +------------+ | | | |
| +------+ host1 +------+ | | |
| | +------+-----+ | | | |
| | | | | | |
| | +------------+ +-----+ |
| | | | | |
| | +------------+ | | | |
| +------+ host2 +------+ | | |
| | +------+-----+ | | | |
| | | | | | |
| | +------------+ +-----+ |
| | | | | |
| | +------------+ | | | |
| +------+ host3 +------+ | | |
| | +------+-----+ | | | |
| | | | | | |
| | +------------+ +-----+ |
| | | | | |
| | | | | |
+-++ ++-+ +-++
^ ^ ^
| | |
| | |
+-+-------------------------+ | |
| External Network | | |
+---------------------------+ | |
+-----------------------+---+ |
| IPMI Network | |
+---------------------------+ |
+-------------------------+-+
| PXE(Installation) Network |
+---------------------------+
The following figure shows the interfaces and nics of JumpHost and deployment nodes in huawei-pod1 network configuration(default one nic for openstack networks).
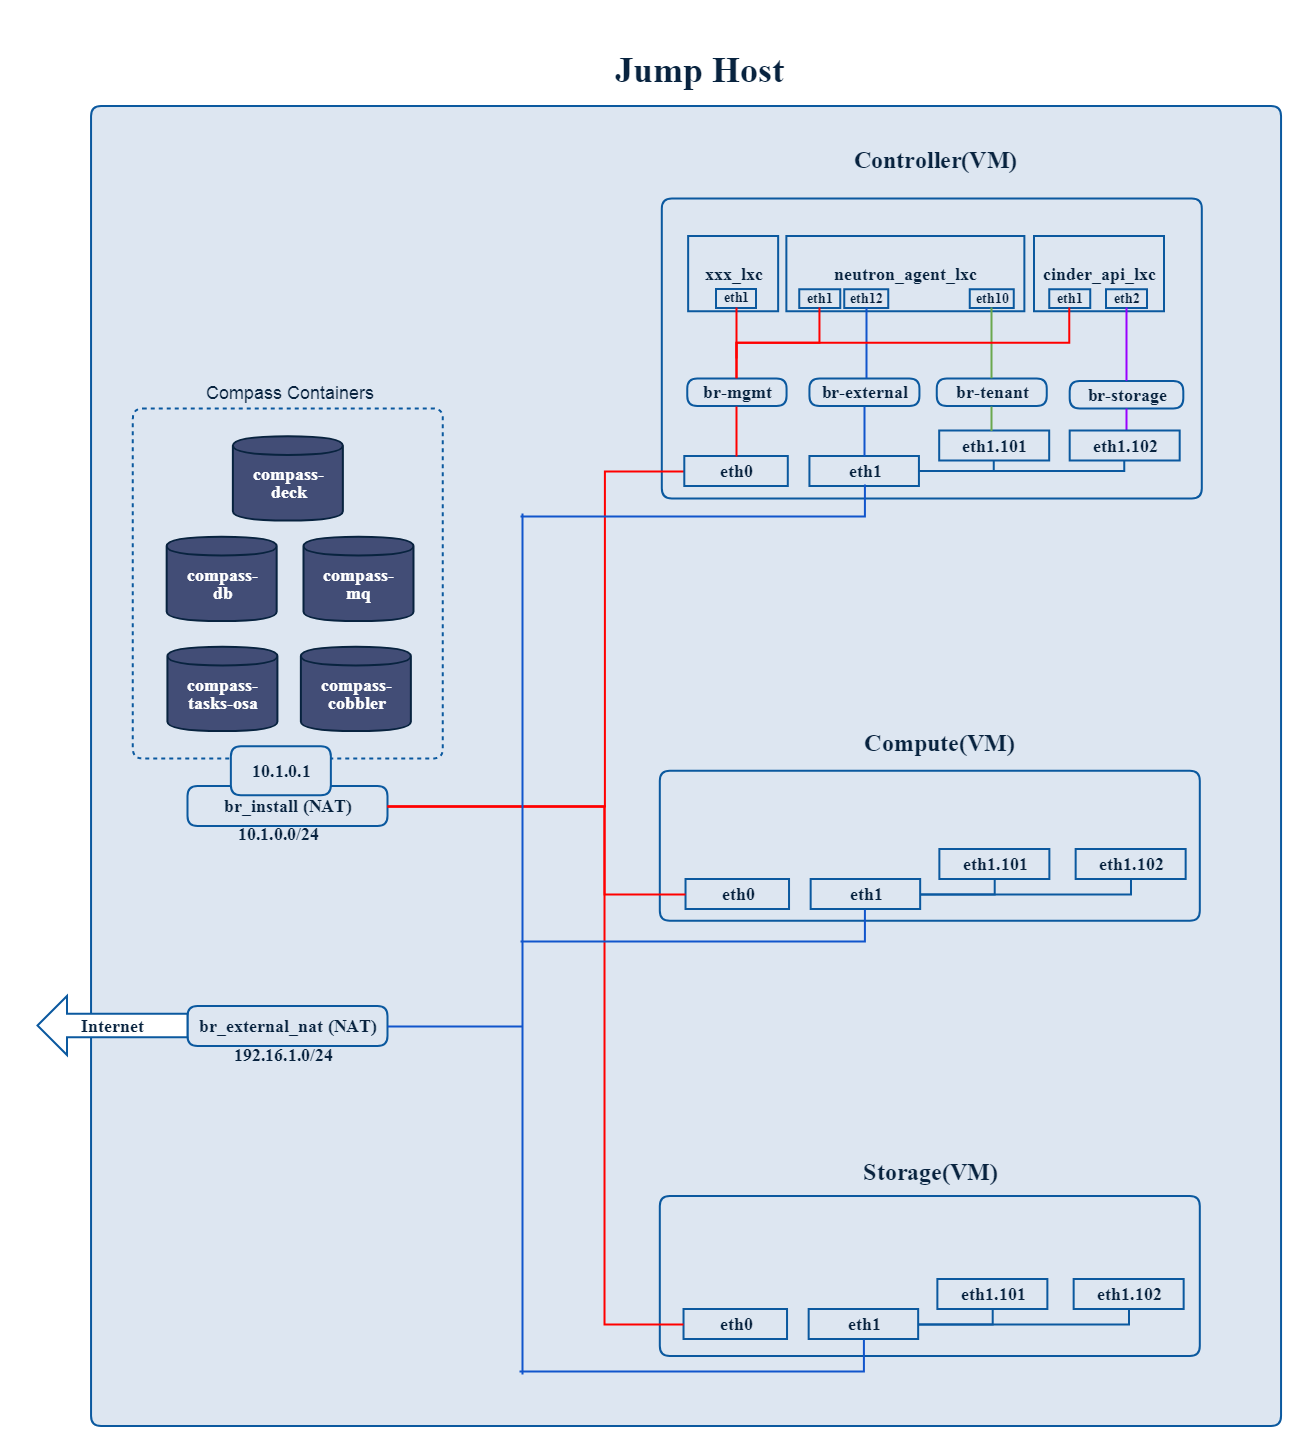
Fig 1. Single nic scenario
The following figure shows the interfaces and nics of JumpHost and deployment nodes in intel-pod8 network configuration(openstack networks are seperated by multiple NICs).
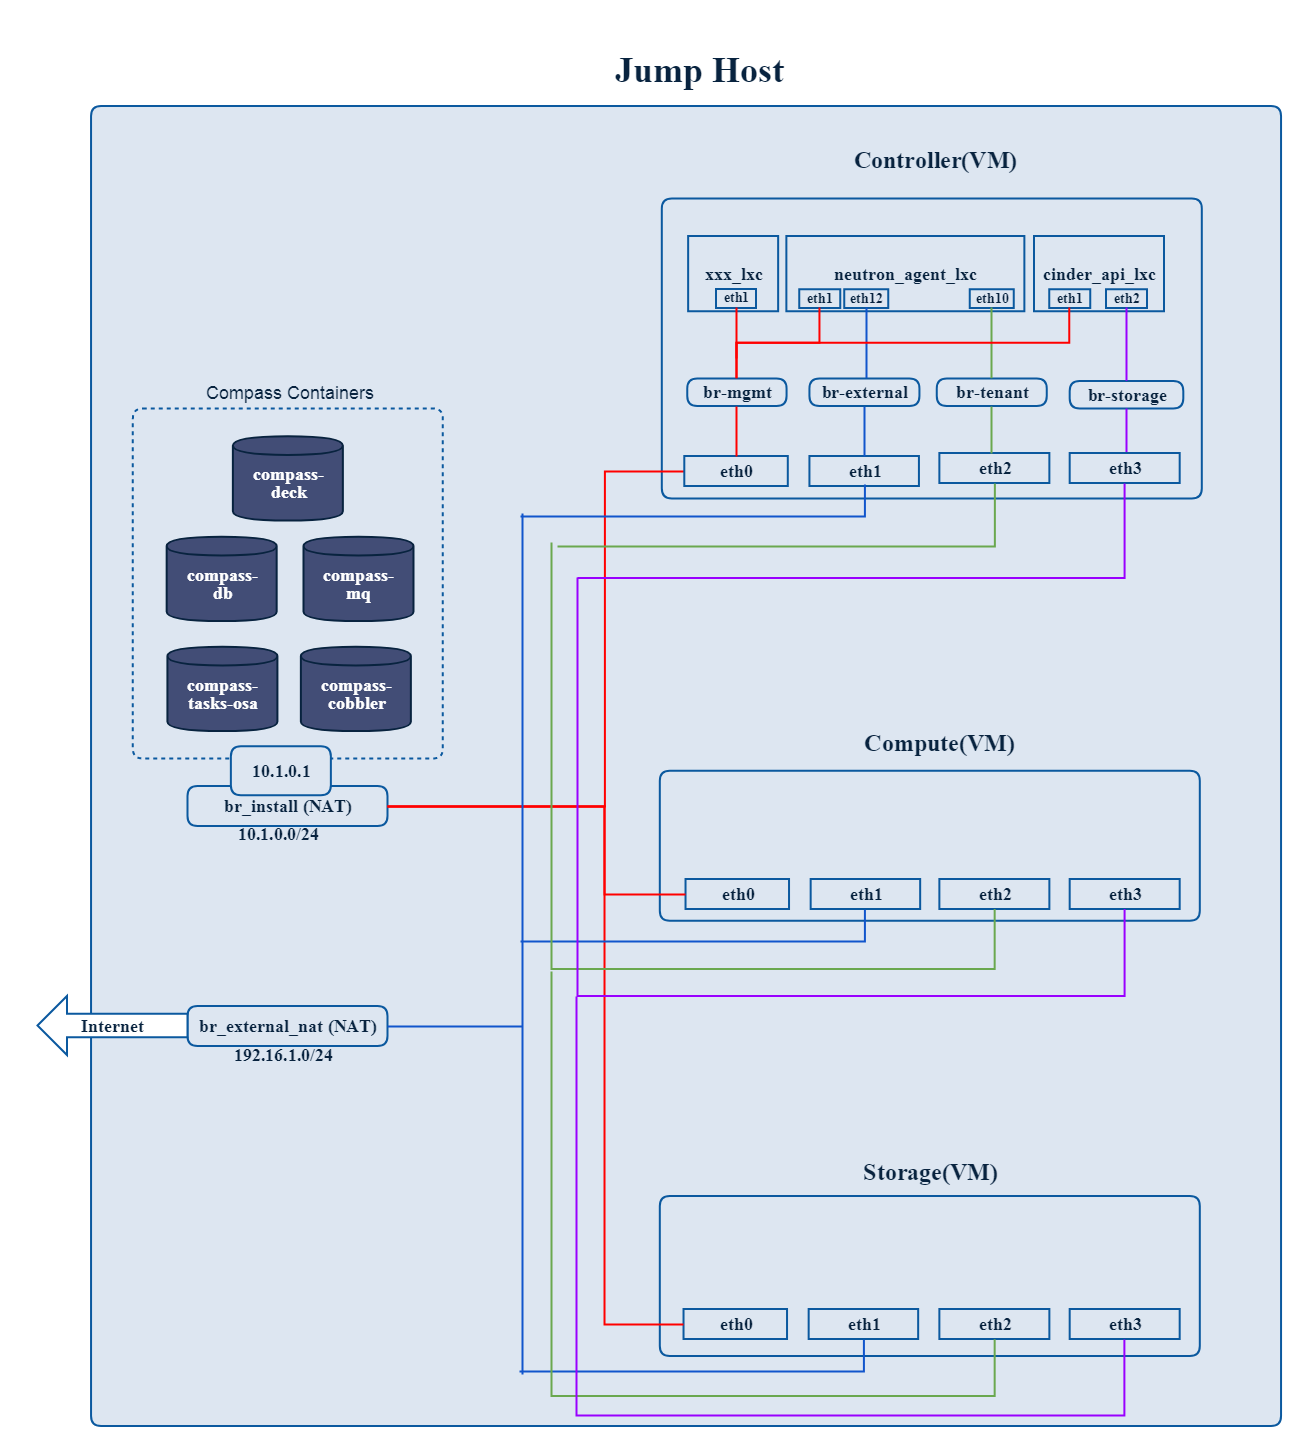
Fig 2. Multiple nics scenario
E.g.
# Set OS version for target hosts
# Ubuntu16.04 or CentOS7
export OS_VERSION=xenial
or
export OS_VERSION=centos7
1.2. Set tarball corresponding to your code
E.g.
# Set ISO image corresponding to your code
export ISO_URL=file:///home/compass/compass4nfv.tar.gz
E.g.
# Set hardware deploy jumpserver PXE NIC
# you need to comment out it when virtual deploy
export INSTALL_NIC=eth1
1.4. Set scenario that you want to deploy
E.g.
nosdn-nofeature scenario deploy sample
# DHA is your dha.yml's path
export DHA=./deploy/conf/hardware_environment/huawei-pod1/os-nosdn-nofeature-ha.yml
# NETWORK is your network.yml's path
export NETWORK=./deploy/conf/hardware_environment/huawei-pod1/network.yml
odl_l2-moon scenario deploy sample
# DHA is your dha.yml's path
export DHA=./deploy/conf/hardware_environment/huawei-pod1/os-odl_l2-moon-ha.yml
# NETWORK is your network.yml's path
export NETWORK=./deploy/conf/hardware_environment/huawei-pod1/network.yml
odl_l2-nofeature scenario deploy sample
# DHA is your dha.yml's path
export DHA=./deploy/conf/hardware_environment/huawei-pod1/os-odl_l2-nofeature-ha.yml
# NETWORK is your network.yml's path
export NETWORK=./deploy/conf/hardware_environment/huawei-pod1/network.yml
odl_l3-nofeature scenario deploy sample
# DHA is your dha.yml's path
export DHA=./deploy/conf/hardware_environment/huawei-pod1/os-odl_l3-nofeature-ha.yml
# NETWORK is your network.yml's path
export NETWORK=./deploy/conf/hardware_environment/huawei-pod1/network.yml
odl-sfc deploy scenario sample
# DHA is your dha.yml's path
export DHA=./deploy/conf/hardware_environment/huawei-pod1/os-odl-sfc-ha.yml
# NETWORK is your network.yml's path
export NETWORK=./deploy/conf/hardware_environment/huawei-pod1/network.yml
deploy.sh./deploy.sh
Only 1 command to try virtual deployment, if you have Internet access. Just Paste it and Run.
curl https://raw.githubusercontent.com/opnfv/compass4nfv/stable/fraser/quickstart.sh | bash
If you want to deploy noha with1 controller and 1 compute, run the following command
export SCENARIO=os-nosdn-nofeature-noha.yml
curl https://raw.githubusercontent.com/opnfv/compass4nfv/stable/fraser/quickstart.sh | bash
- VIRT_CPUS – the number of CPUs allocated per virtual machine.
- VIRT_MEM – the memory size(MB) allocated per virtual machine.
- VIRT_DISK – the disk size allocated per virtual machine.
export VIRT_CPUS=${VIRT_CPU:-4}
export VIRT_MEM=${VIRT_MEM:-16384}
export VIRT_DISK=${VIRT_DISK:-200G}
The below file is the inventory template of deployment nodes:
”./deploy/conf/vm_environment/huawei-virtual1/dha.yml”
The “dha.yml” is a collectively name for “os-nosdn-nofeature-ha.yml os-ocl-nofeature-ha.yml os-odl_l2-moon-ha.yml etc”.
You can write your own address/roles reference to it.
- name – Host name for deployment node after installation.
- roles – Components deployed.
Set TYPE and FLAVOR
E.g.
TYPE: virtual
FLAVOR: cluster
Assignment of different roles to servers
E.g. Openstack only deployment roles setting
hosts:
- name: host1
roles:
- controller
- ha
- name: host2
roles:
- compute
NOTE: IF YOU SELECT MUTIPLE NODES AS CONTROLLER, THE ‘ha’ role MUST BE SELECT, TOO.
E.g. Openstack and ceph deployment roles setting
hosts:
- name: host1
roles:
- controller
- ha
- ceph-adm
- ceph-mon
- name: host2
roles:
- compute
- ceph-osd
E.g. Openstack and ODL deployment roles setting
hosts:
- name: host1
roles:
- controller
- ha
- odl
- name: host2
roles:
- compute
E.g. Openstack and ONOS deployment roles setting
hosts:
- name: host1
roles:
- controller
- ha
- onos
- name: host2
roles:
- compute
The same with Baremetal Deployment.
E.g.
# Set OS version for target hosts
# Ubuntu16.04 or CentOS7
export OS_VERSION=xenial
or
export OS_VERSION=centos7
1.2. Set ISO image corresponding to your code
E.g.
# Set ISO image corresponding to your code
export ISO_URL=file:///home/compass/compass4nfv.tar.gz
1.3. Set scenario that you want to deploy
E.g.
nosdn-nofeature scenario deploy sample
# DHA is your dha.yml's path
export DHA=./deploy/conf/vm_environment/os-nosdn-nofeature-ha.yml
# NETWORK is your network.yml's path
export NETWORK=./deploy/conf/vm_environment/huawei-virtual1/network.yml
odl_l2-moon scenario deploy sample
# DHA is your dha.yml's path
export DHA=./deploy/conf/vm_environment/os-odl_l2-moon-ha.yml
# NETWORK is your network.yml's path
export NETWORK=./deploy/conf/vm_environment/huawei-virtual1/network.yml
odl_l2-nofeature scenario deploy sample
# DHA is your dha.yml's path
export DHA=./deploy/conf/vm_environment/os-odl_l2-nofeature-ha.yml
# NETWORK is your network.yml's path
export NETWORK=./deploy/conf/vm_environment/huawei-virtual1/network.yml
odl_l3-nofeature scenario deploy sample
# DHA is your dha.yml's path
export DHA=./deploy/conf/vm_environment/os-odl_l3-nofeature-ha.yml
# NETWORK is your network.yml's path
export NETWORK=./deploy/conf/vm_environment/huawei-virtual1/network.yml
odl-sfc deploy scenario sample
# DHA is your dha.yml's path
export DHA=./deploy/conf/vm_environment/os-odl-sfc-ha.yml
# NETWORK is your network.yml's path
export NETWORK=./deploy/conf/vm_environment/huawei-virtual1/network.yml
deploy.sh./deploy.sh
Currently Compass can deploy kubernetes as NFVI in 3+2 mode by default.
The following figure shows a typical architecture of Kubernetes.
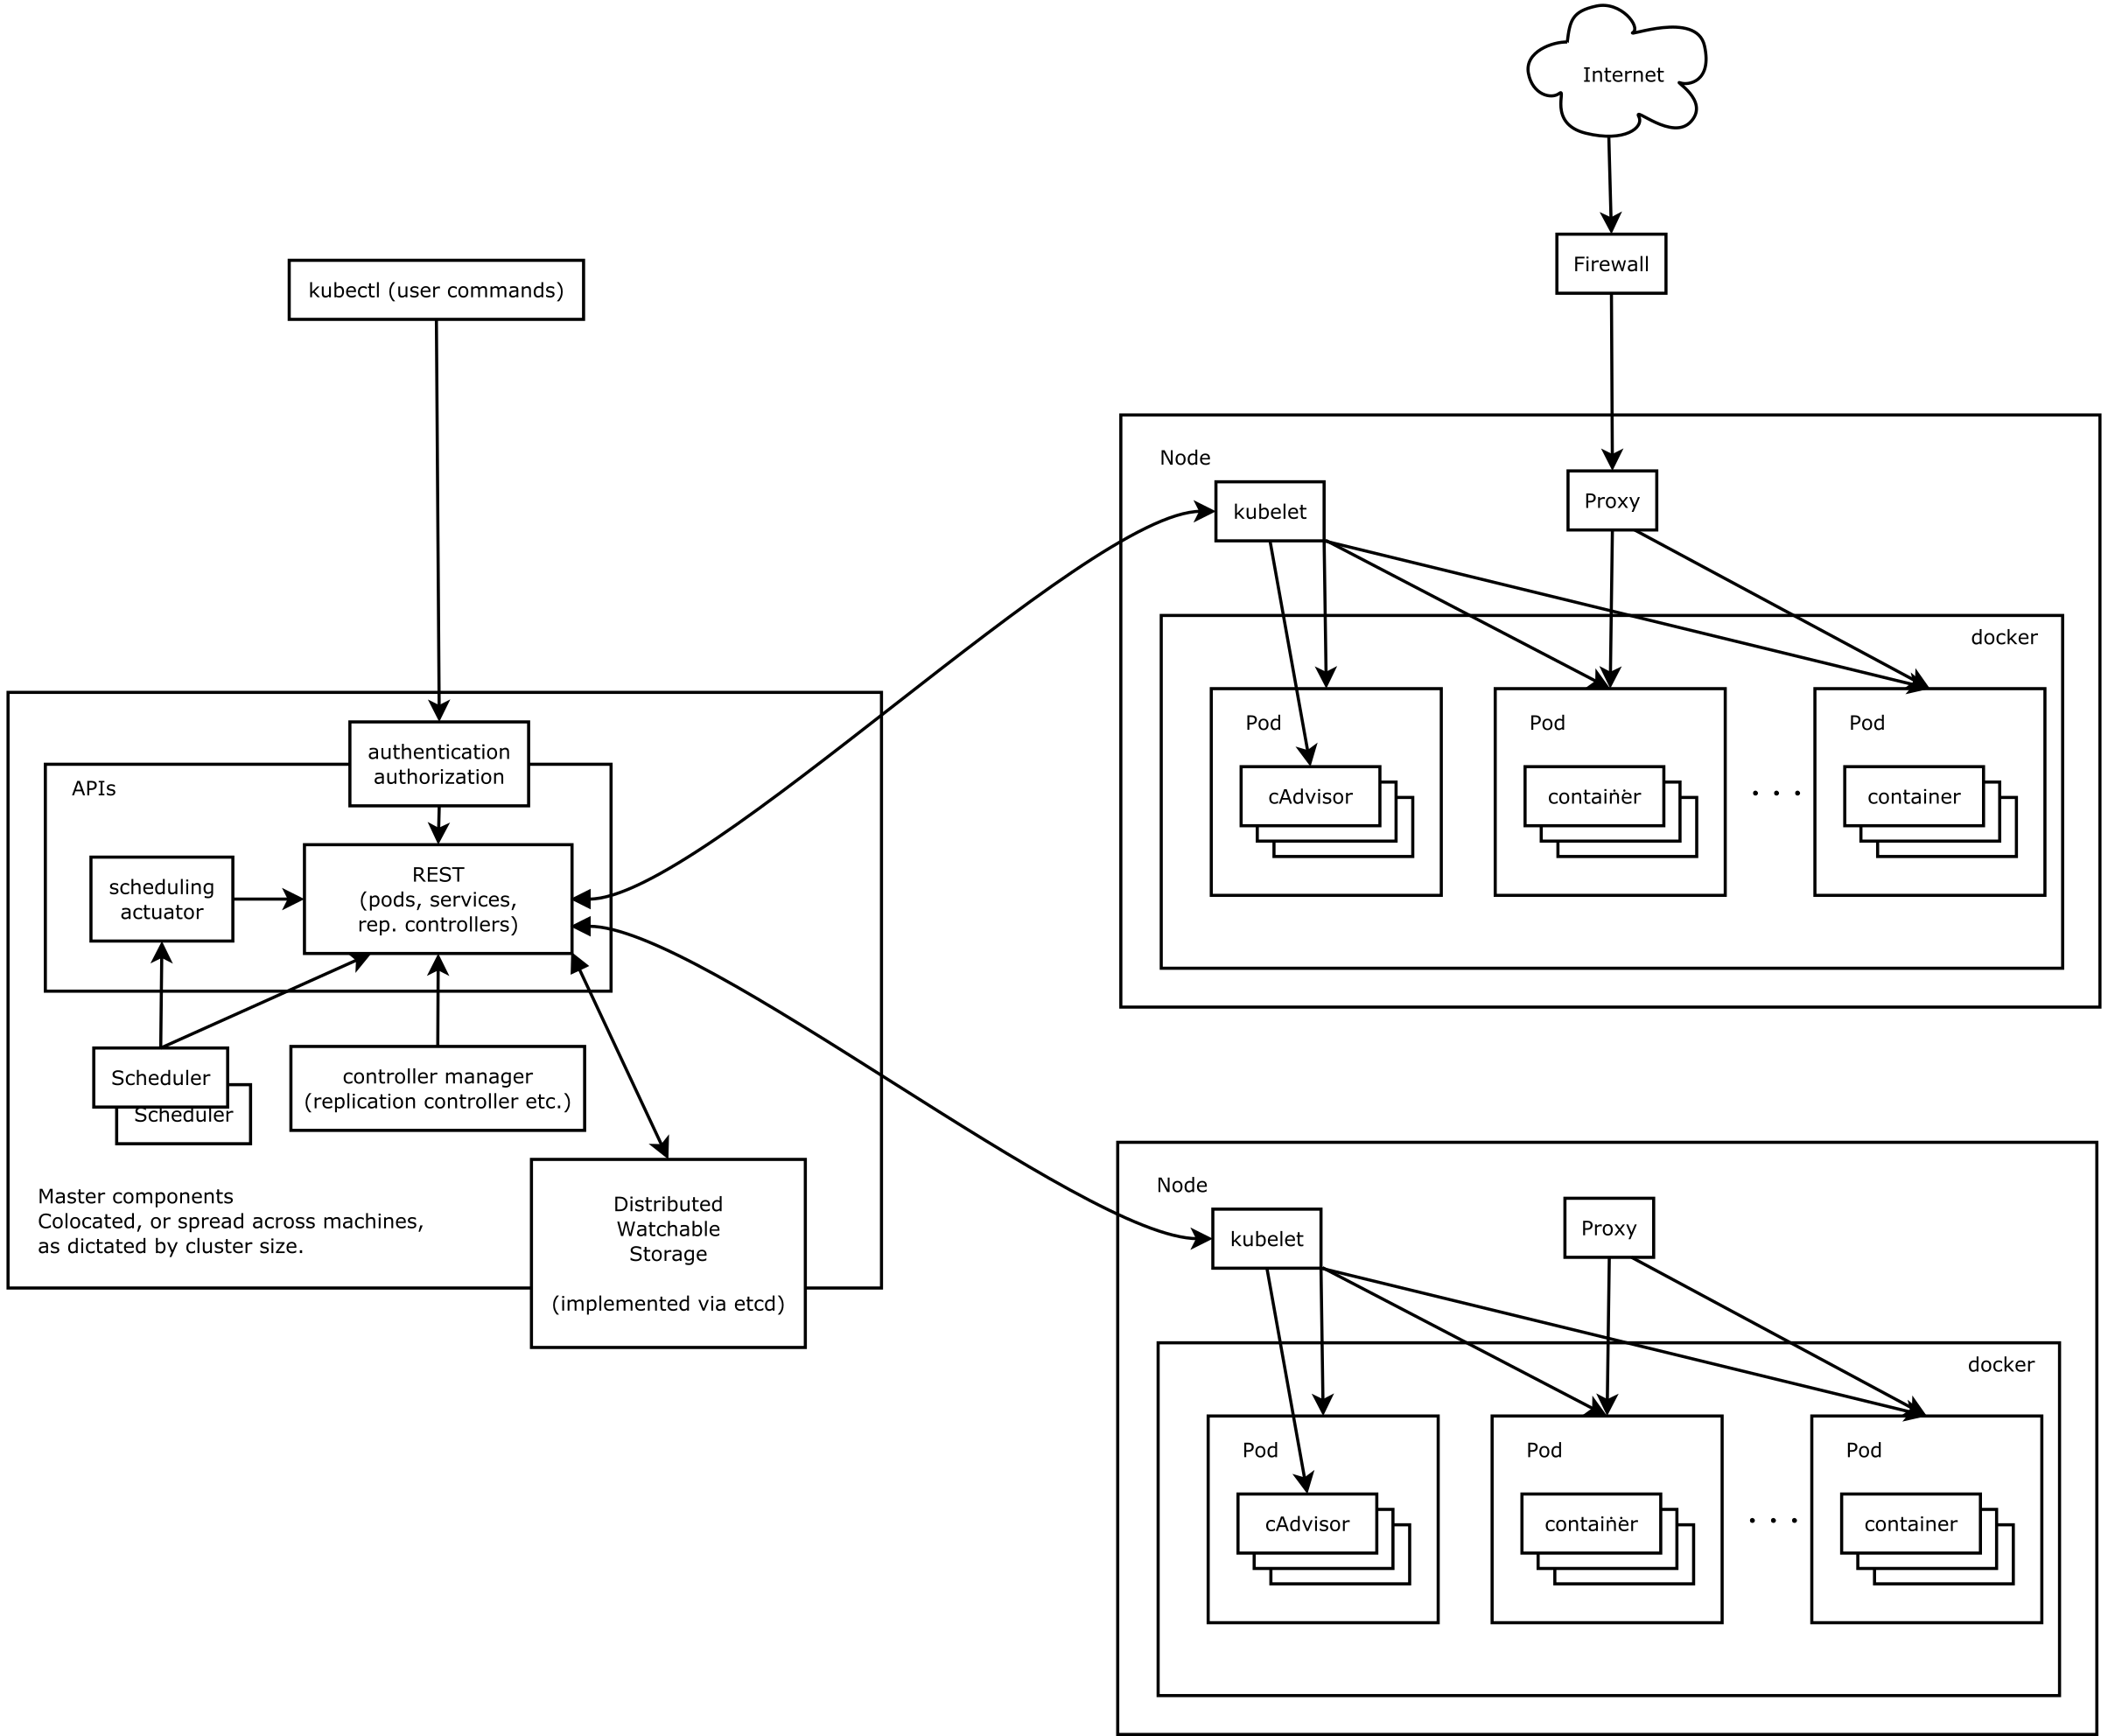
Fig 3. K8s architecture
Kube-apiserver exposes the Kubernetes API. It is the front-end for the Kubernetes control plane. It is designed to scale horizontally, that is, it scales by deploying more instances.
Etcd is used as Kubernetes’ backing store. All cluster data is stored here. Always have a backup plan for etcd’s data for your Kubernetes cluster.
Kube-controller-manager runs controllers, which are the background threads that handle routine tasks in the cluster. Logically, each controller is a separate process, but to reduce complexity, they are all compiled into a single binary and run in a single process.
These controllers include:
- Node Controller: Responsible for noticing and responding when nodes go down.
- Replication Controller: Responsible for maintaining the correct number of pods for every replication controller object in the system.
- Endpoints Controller: Populates the Endpoints object (that is, joins Services & Pods).
- Service Account & Token Controllers: Create default accounts and API access tokens for new namespaces.
Kube-scheduler watches newly created pods that have no node assigned, and selects a node for them to run on.
Kubelet is the primary node agent. It watches for pods that have been assigned to its node (either by apiserver or via local configuration file) and:
- Mounts the pod’s required volumes.
- Downloads the pod’s secrets.
- Runs the pod’s containers via docker (or, experimentally, rkt).
- Periodically executes any requested container liveness probes.
- Reports the status of the pod back to the rest of the system, by creating a mirror pod if necessary.
- Reports the status of the node back to the rest of the system.
Kube-proxy enables the Kubernetes service abstraction by maintaining network rules on the host and performing connection forwarding.
Docker is used for running containers.
A pod is a collection of containers and its storage inside a node of a Kubernetes cluster. It is possible to create a pod with multiple containers inside it. For example, keeping a database container and data container in the same pod.
The following figure shows the Kubernetes Networking in Compass configuration.
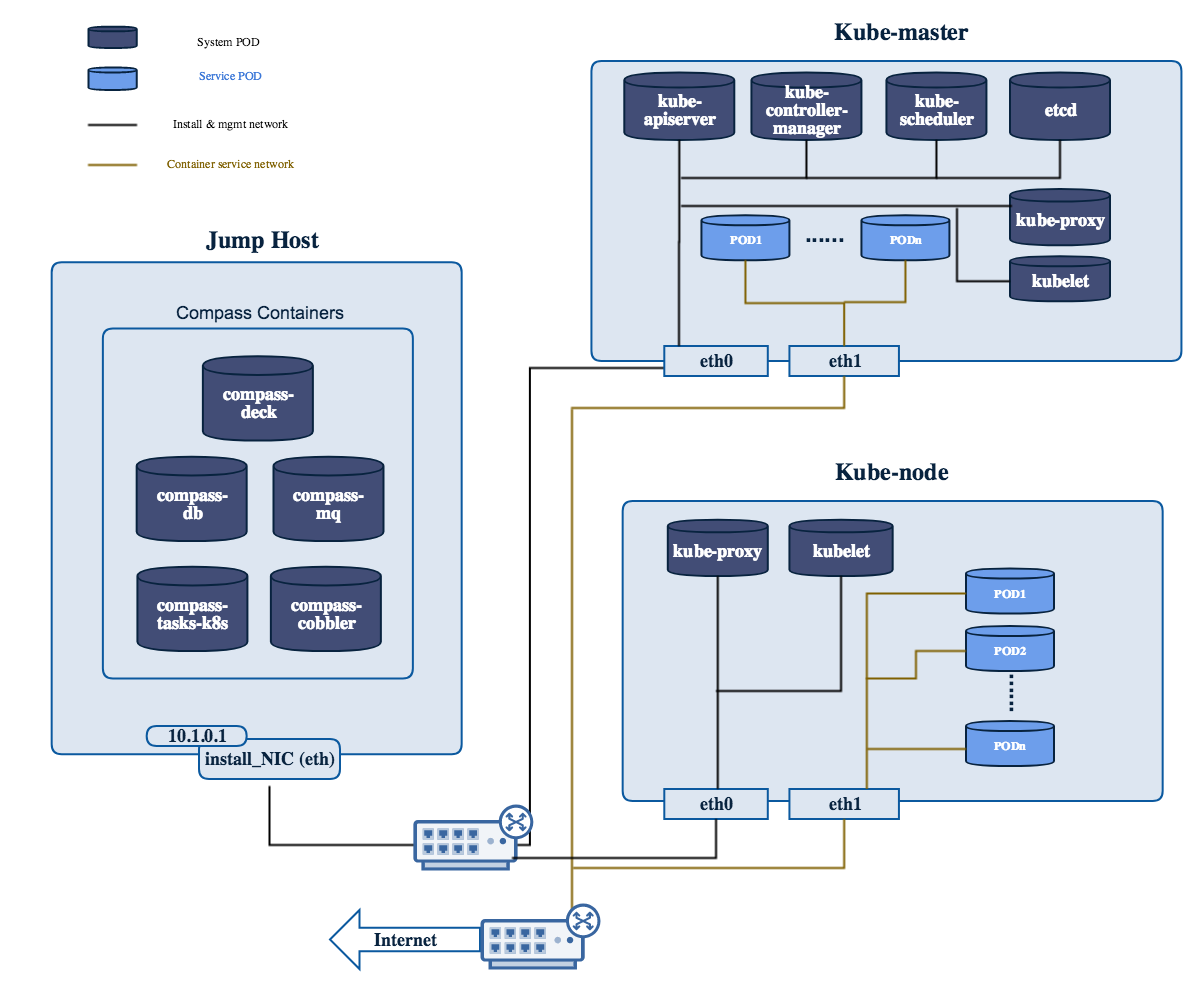
Fig 4. Kubernetes Networking in Compass
Only 1 command to try virtual deployment, if you have Internet access. Just Paste it and Run.
curl https://raw.githubusercontent.com/opnfv/compass4nfv/master/quickstart_k8s.sh | bash
If you want to deploy noha with1 controller and 1 compute, run the following command
export SCENARIO=k8-nosdn-nofeature-noha.yml
export VIRT_NUMBER=2
curl https://raw.githubusercontent.com/opnfv/compass4nfv/stable/fraser/quickstart_k8s.sh | bash
The below file is the inventory template of deployment nodes:
“compass4nfv/deploy/conf/hardware_environment/huawei-pod1/k8-nosdn-nofeature-ha.yml”
You can write your own IPMI IP/User/Password/Mac address/roles reference to it.
- name – Host name for deployment node after installation.
- ipmiVer – IPMI interface version for deployment node support. IPMI 1.0 or IPMI 2.0 is available.
- ipmiIP – IPMI IP address for deployment node. Make sure it can access from Jumphost.
- ipmiUser – IPMI Username for deployment node.
- ipmiPass – IPMI Password for deployment node.
- mac – MAC Address of deployment node PXE NIC.
- interfaces – Host NIC renamed according to NIC MAC addresses when OS provisioning.
- roles – Components deployed.
Set TYPE/FLAVOR and POWER TOOL
E.g. .. code-block:: yaml
TYPE: baremetal FLAVOR: cluster POWER_TOOL: ipmitool
Set ipmiUser/ipmiPass and ipmiVer
E.g.
ipmiUser: USER
ipmiPass: PASSWORD
ipmiVer: '2.0'
Assignment of different roles to servers
E.g. K8s only deployment roles setting
hosts:
- name: host1
mac: 'F8:4A:BF:55:A2:8D'
interfaces:
- eth1: 'F8:4A:BF:55:A2:8E'
ipmiIp: 172.16.130.26
roles:
- kube_master
- etcd
- name: host2
mac: 'D8:49:0B:DA:5A:B7'
interfaces:
- eth1: 'D8:49:0B:DA:5A:B8'
ipmiIp: 172.16.130.27
roles:
- kube_node
Before deployment, there are some network configuration to be checked based on your network topology.Compass4nfv network default configuration file is “compass4nfv/deploy/conf/hardware_environment/huawei-pod1/network.yml”. This file is an example, you can customize by yourself according to specific network environment.
In this network.yml, there are several config sections listed following(corresponed to the ordre of the config file):
- name – provider network name.
- network – default as physnet, do not change it.
- interfaces – the NIC or Bridge attached by the Network.
- type – the type of the NIC or Bridge(vlan for NIC and ovs for Bridge, either).
- roles – all the possible roles of the host machines which connected by this network(mostly put both controller and compute).
- name – Network name.
- interfaces – the NIC or Bridge attached by the Network.
- vlan_tag – if type is vlan, add this tag before ‘type’ tag.
- type – the type of the NIC or Bridge(vlan for NIC and ovs for Bridge, either).
- roles – all the possible roles of the host machines which connected by this network(mostly put both controller and compute).
- name – network name corresponding the the network name in System Interface section one by one.
- ip_ranges – ip addresses range provided for this network.
- cidr – the IPv4 address and its associated routing prefix and subnet mask?
- gw – need to add this line only if network is external.
- roles – all the possible roles of the host machines which connected by this network(mostly put both controller and compute).
- ip – virtual or proxy ip address, must be in the same subnet with mgmt network but must not be in the range of mgmt network.
- netmask – the length of netmask
- interface – mostly mgmt.
- ip – virtual or proxy ip address, must be in the same subnet with external network but must not be in the range of external network.
- netmask – the length of netmask
- interface – mostly external.
- enable – must be True(if False, you need to set up provider network manually).
- network – leave it ext-net.
- type – the type of the ext-net above, such as flat or vlan.
- segment_id – when the type is vlan, this should be id of vlan.
- subnet – leave it ext-subnet.
- provider_network – leave it physnet.
- router – leave it router-ext.
- enable_dhcp – must be False.
- no_gateway – must be False.
- external_gw – same as gw in ip_settings.
- floating_ip_cidr – cidr for floating ip, see explanation in ip_settings.
- floating_ip_start – define range of floating ip with floating_ip_end(this defined range must not be included in ip range of external configured in ip_settings section).
- floating_ip_end – define range of floating ip with floating_ip_start.
The following figure shows the default network configuration.
Fig 5. Kubernetes network configuration
E.g.
# Set OS version for target hosts
# Only CentOS7 supported now
export OS_VERSION=centos7
1.2. Set tarball corresponding to your code
E.g.
# Set ISO image corresponding to your code
export ISO_URL=file:///home/compass/compass4nfv.tar.gz
E.g.
# Set hardware deploy jumpserver PXE NIC
# you need to comment out it when virtual deploy
export INSTALL_NIC=eth1
1.4. K8s scenario that you want to deploy
E.g.
nosdn-nofeature scenario deploy sample
# DHA is your dha.yml's path
export DHA=./deploy/conf/hardware_environment/huawei-pod1/k8-nosdn-nofeature-ha.yml
# NETWORK is your network.yml's path
export NETWORK=./deploy/conf/hardware_environment/huawei-pod1/network.yml
deploy.sh./deploy.sh
Compass4nfv uses a repo docker container as distro and pip package source to deploy cluster and support complete offline deployment on a jumphost without access internet. Here is the offline deployment instruction:
E.g.
Export the compass4nfv.iso and jh_env_package.tar.gz path
# ISO_URL and JHPKG_URL should be absolute path
export ISO_URL=file:///home/compass/compass4nfv.iso
export JHPKG_URL=file:///home/compass/jh_env_package.tar.gz
export OFFLINE_DEPLOY=Enable
./deploy.sh
The below file is the inventory template of deployment nodes:
”./deploy/conf/hardware_environment/huawei-pod1/network.yml”
You need to edit the network.yml which you had edited the first deployment.
NOTE: External subnet’s ip_range should exclude the IPs those have already been used.
The below file is the inventory template of deployment nodes:
”./deploy/conf/hardware_environment/expansion-sample/hardware_cluster_expansion.yml”
You can write your own IPMI IP/User/Password/Mac address/roles reference to it.
- name – Host name for deployment node after installation.
- ipmiIP – IPMI IP address for deployment node. Make sure it can access from Jumphost.
- ipmiUser – IPMI Username for deployment node.
- ipmiPass – IPMI Password for deployment node.
- mac – MAC Address of deployment node PXE NIC .
Set TYPE/FLAVOR and POWER TOOL
E.g.
TYPE: baremetal
FLAVOR: cluster
POWER_TOOL: ipmitool
Set ipmiUser/ipmiPass and ipmiVer
E.g.
ipmiUser: USER
ipmiPass: PASSWORD
ipmiVer: '2.0'
Assignment of roles to servers
E.g. Only increase one compute node
hosts:
- name: host6
mac: 'E8:4D:D0:BA:60:45'
interfaces:
- eth1: '08:4D:D0:BA:60:44'
ipmiIp: 172.16.131.23
roles:
- compute
E.g. Increase two compute nodes
hosts:
- name: host6
mac: 'E8:4D:D0:BA:60:45'
interfaces:
- eth1: '08:4D:D0:BA:60:44'
ipmiIp: 172.16.131.23
roles:
- compute
- name: host6
mac: 'E8:4D:D0:BA:60:78'
interfaces:
- eth1: '08:4D:56:BA:60:83'
ipmiIp: 172.16.131.23
roles:
- compute
Edit network.yml and dha.yml file
You need to Edit network.yml and virtual_cluster_expansion.yml or hardware_cluster_expansion.yml. Edit the DHA and NETWORK envionment variables. External subnet’s ip_range and management ip should be changed as the first 6 IPs are already taken by the first deployment.
E.g.
--- network.yml 2017-02-16 20:07:10.097878150 +0800
+++ network-expansion.yml 2017-05-03 10:01:34.537379013 +0800
@@ -38,7 +38,7 @@
ip_settings:
- name: mgmt
ip_ranges:
- - - "172.16.1.1"
+ - - "172.16.1.6"
- "172.16.1.254"
cidr: "172.16.1.0/24"
role:
@@ -47,7 +47,7 @@
- name: storage
ip_ranges:
- - - "172.16.2.1"
+ - - "172.16.2.6"
- "172.16.2.254"
cidr: "172.16.2.0/24"
role:
@@ -56,7 +56,7 @@
- name: external
ip_ranges:
- - - "192.168.116.201"
+ - - "192.168.116.206"
- "192.168.116.221"
cidr: "192.168.116.0/24"
gw: "192.168.116.1"
E.g.
export EXPANSION="true"
export MANAGEMENT_IP_START="10.1.0.55"
export VIRT_NUMBER=1
export DEPLOY_FIRST_TIME="false"
2.2. Set scenario that you need to expansion
E.g.
# DHA is your dha.yml's path
export DHA=./deploy/conf/hardware_environment/expansion-sample/hardware_cluster_expansion.yml
# NETWORK is your network.yml's path
export NETWORK=./deploy/conf/hardware_environment/huawei-pod1/network.yml
deploy.sh./deploy.sh
This document describes how to integrate a feature (e.g. sdn, moon, kvm, sfc) into compass installer. Follow the steps below, you can achieve the goal.
Currently Ansible is the main packages installation plugin in the adapters of Compass4nfv, which is used to deploy all the roles listed in the playbooks. (More details about ansible and playbook can be achieved according to the Reference.) The mostly used playbook in compass4nfv is named “HA-ansible-multinodes.yml” located in “your_path_to_compass4nfv/compass4nfv/deploy/ adapters/ansible/openstack/”.
Before you add your role into the playbook, create your role under the directory of “your_path_to_compass4nfv/compass4nfv/deploy/adapters/ansible/roles/”. For example Fig 1 shows some roles currently existed in compass4nfv.
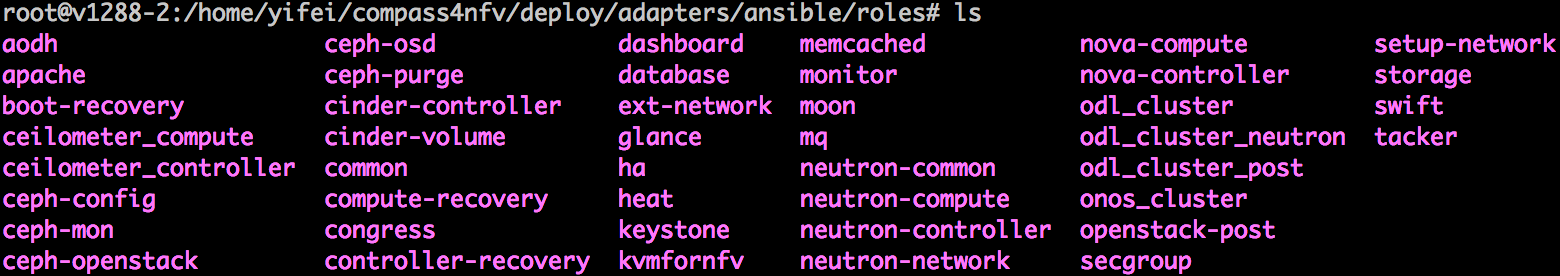
Fig 1. Existed roles in compass4nfv
Let’s take a look at “moon” and understand the construction of a role. Fig 2 below presents the tree of “moon”.
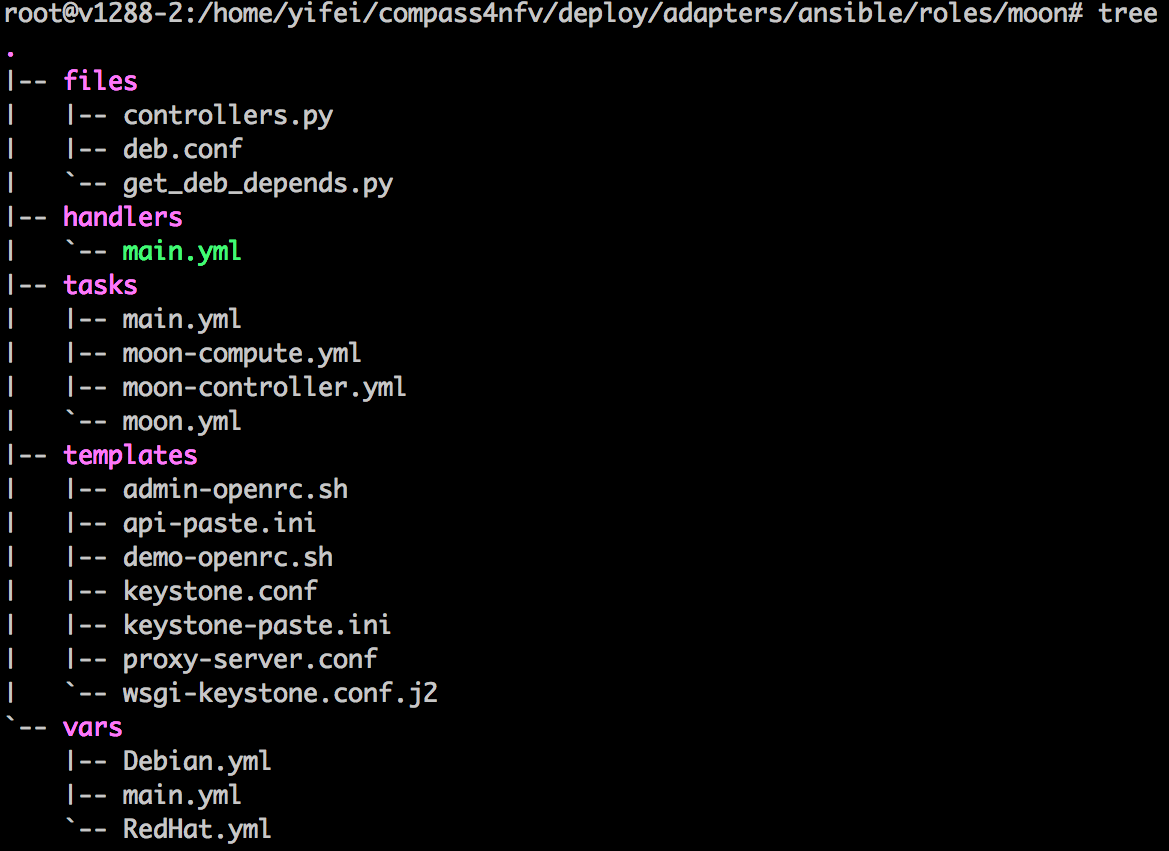
Fig 2. Tree of moon role
There are five directories in moon, which are files, handlers, tasks, templates and vars. Almost every role has such five directories.
For “files”, it is used to store the files you want to copy to the hosts without any modification. These files can be configuration files, code files and etc. Here in moon’s files directory, there are two python files and one configuration file. All of the three files will be copied to controller nodes for some purposes.
For “handlers”, it is used to store some operations frequently used in your tasks. For example, restart the service daemon.
For “tasks”, it is used to store the task yaml files. You need to add the yaml files including the tasks you write to deploy your role on the hosts. Please attention that a main.yml should be existed as the entrance of running tasks. In Fig 2, you can find that there are four yaml files in the tasks directory of moon. The main.yml is the entrance which will call the other three yaml files.
For “templates”, it is used to store the files that you want to replace some variables in them before copying to hosts. These variables are usually defined in “vars” directory. This can avoid hard coding.
For “vars”, it is used to store the yaml files in which the packages and variables are defined. The packages defined here are some generic debian or rpm packages. The script of making repo will scan the packages names here and download them into related PPA. For some special packages, section “Build packages for the feature” will introduce how to handle with special packages. The variables defined here are used in the files in “templates” and “tasks”.
Note: you can get the special packages in the tasks like this:
- name: get the special packages' http server
shell: awk -F'=' '/compass_server/ {print $2}' /etc/compass.conf
register: http_server
- name: download odl package
get_url:
url: "http://{{ http_server.stdout_lines[0] }}/packages/odl/{{ odl_pkg_url }}"
dest: /opt/
In the previous section, we have explained how to build the generic packages for your feature. In this section, we will talk about how to build the special packages used by your feature.
Fig 3. Features building directory in compass4nfv
Fig 3 shows the tree of “your_path_to_compass4nfv/compass4nfv/repo/features/”. Dockerfile is used to start a docker container to run the scripts in scripts directory. These scripts will download the special feature related packages into the container. What you need to do is to write a shell script to download or build the package you want. And then put the script into “your_path_to_compass4nfv/compass4nfv/repo/features/scripts/”. Attention that, you need to make a directory under /pkg. Take opendaylight as an example:
mkdir -p /pkg/odl
After downloading or building your feature packages, please copy all of your packages into the directory you made, e.g. /pkg/odl.
Note: If you have specail requirements for the container OS or kernel vesion, etc. Please contact us.
After all of these, come back to your_path_to_compass4nfv/compass4nfv/ directory, and run the command below:
./repo/make_repo.sh feature # To get special packages
./repo/make_repo.sh openstack # To get generic packages
When execution finished, you will get a tar package named packages.tar.gz under “your_path_to_compass4nfv/compass4nfv/work/repo/”. Your feature related packages have been archived in this tar package. And you will also get the PPA packages which includes the generic packages you defined in the role directory. The PPA packages are xenial-newton-ppa.tar.gz and centos7-newton-ppa.tar.gz, also in “your_path_to_compass4nfv/compass4nfv/work/repo/”.
Before you deploy a cluster with your feature installed, you need an ISO with feature packages, generic packages and role included. This section introduces how to build the ISO you want. What you need to do are two simple things:
Configure the build configuration file
The build configuration file is located in “your_path_to_compass4nfv/compass4nfv/build/”. There are lines in the file like this:
export APP_PACKAGE=${APP_PACKAGE:-$FEATURE_URL/packages.tar.gz}
export XENIAL_NEWTON_PPA=${XENIAL_NEWTON_PPA:-$PPA_URL/xenial-newton-ppa.tar.gz}
export CENTOS7_NEWTON_PPA=${CENTOS7_NEWTON_PPA:-$PPA_URL/centos7-newton-ppa.tar.gz}
Just replace the $FEATURE_URL and $PPA_URL to the directory where your packages.tar.gz located in. For example:
export APP_PACKAGE=${APP_PACKAGE:-file:///home/opnfv/compass4nfv/work/repo/packages.tar.gz}
export XENIAL_NEWTON_PPA=${XENIAL_NEWTON_PPA:-file:///home/opnfv/compass4nfv/work/repo/xenial-newton-ppa.tar.gz}
export CENTOS7_NEWTON_PPA=${CENTOS7_NEWTON_PPA:-file:///home/opnfv/compass4nfv/work/repo/centos7-newton-ppa.tar.gz}
Build the ISO
After the configuration, just run the command below to build the ISO you want for deployment.
./build.sh
Ansible documentation: http://docs.ansible.com/ansible/index.html>
To save time, currently, Daisy4NFV does not run deployment test in gate job which simply builds and uploads artifacts to low confidence level repo. The project deployment test is triggered on a daily basis. If the artifact passes the test, then it will be promoted to the high confidence level repo.
The low confidence level artifacts are bin files in http://artifacts.opnfv.org/daisy.html named like “daisy/opnfv-Gerrit-39495.bin”, while the high confidence level artifacts are named like “daisy/opnfv-2017-08-20_08-00-04.bin”.
The daily project deployment status can be found at
The status of Daisy4NFV’s CI/CD which running on OPNFV production CI environments(both B/M and VM) can be found at
https://build.opnfv.org/ci/job/daisy-os-nosdn-nofeature-ha-baremetal-daily-master/ https://build.opnfv.org/ci/job/daisy-os-odl-nofeature-ha-baremetal-daily-master/ https://build.opnfv.org/ci/job/daisy-os-nosdn-nofeature-ha-virtual-daily-master/ https://build.opnfv.org/ci/job/daisy-os-odl-nofeature-ha-virtual-daily-master/
Dashboard for taking a glance on CI health status in a more intuitive way can be found at
http://testresults.opnfv.org/reporting/functest/release/master/index-status-daisy.html
This document takes VM all-in-one environment as example to show what ci/deploy/deploy.sh really do.
6. In daisy vm, create cluster, update network and build PXE server for the bootstrap kernel. In short, be ready for discovering target nodes. These tasks are done by running the following command.
python /home/daisy/deploy/tempest.py –dha /home/daisy/labs/zte/virtual1/daisy/config/deploy.yml –network /home/daisy/labs/zte/virtual1/daisy/config/network.yml –cluster ‘yes’
9. In daisy vm, check if all-in-one vm was discovered, if it was, then update its network assignment and config OpenStack according to OPNFV scenario and setup PXE for OS installaion. These tasks are done by running the following command.
python /home/daisy/deploy/tempest.py –dha /home/daisy/labs/zte/virtual1/daisy/config/deploy.yml –network /home/daisy/labs/zte/virtual1/daisy/config/network.yml –host yes –isbare 0 –scenario os-nosdn-nofeature-noha
Note: Current host status: os_status is “init”.
11. In daisy vm, continue to intall OS by running the following command which for VM environment only.
python /home/daisy/deploy/tempest.py –dha /home/daisy/labs/zte/virtual1/daisy/config/deploy.yml –network /home/daisy/labs/zte/virtual1/daisy/config/network.yml –install ‘yes’
12. In daisy vm, run the following command to check OS intallation progress. /home/daisy/deploy/check_os_progress.sh -d 0 -n 1
Note: Current host status: os_status is “installing” during installation, then os_status becomes “active” after OS was succesfully installed.
14. In daisy vm, run the following command to check OpenStack/ODL/... intallation progress.
/home/daisy/deploy/check_openstack_progress.sh -n 1
2. Packet size should not exceed above 1500(MTU) bytes including UDP/IP header and should be align to 4 bytes. In future, MTU can be modified larger than 1500(Jumbo Frame) through cmd line option to enlarge the data throughput.
/* Packet header definition (align to 4 bytes) */ struct packet_ctl {
uint32_t seq; // packet seq number start from 0, unique in server life cycle. uint32_t crc; // checksum uint32_t data_size; // payload length uint8_t data[0];
};
/* Buffer info definition (align to 4 bytes) */ struct buffer_ctl {
uint32_t buffer_id; // buffer seq number start from 0, unique in server life cycle. uint32_t buffer_size; // payload total length of a buffer uint32_t packet_id_base; // seq number of the first packet in this buffer. uint32_t pkt_count; // number of packet in this buffer, 0 means EOF.
};
Signals such as the four below are 1 byte long, to simplify the receive process(since it cannot be spitted ).
#define CLIENT_READY 0x1 #define CLIENT_REQ 0x2 #define CLIENT_DONE 0x4 #define SERVER_SENT 0x8
Note: Please see the collaboration diagram for their meanings.
/* Retransmition Request Header (align to 4 bytes) */ struct request_ctl {
uint32_t req_count; // How many seqs below. uint32_t seqs[0]; // packet seqs.
};
void buffer_init(); // Init the buffer_ctl structure and all(say 1024) packet_ctl structures. Allocate buffer memory. long buffer_fill(int fd); // fill a buffer from fd, such as stdin long buffer_flush(int fd); // flush a buffer to fd, say stdout struct packet_ctl *packet_put(struct packet_ctl *new_pkt);// put a packet to a buffer and return a free memory slot for the next packet. struct packet_ctl *packet_get(uint32_t seq);// get a packet data in buffer by indicating the packet seq.
If children’s aaa() operation need to wait the parents’s init() to be done, then do it literally like this:
UDP Server TCP Server1 = spawn( )—-> TCP Server1
- init()
- TCP Server2 = spawn( )—–> TCP Server2
- V(sem)———————-> P(sem) // No child any more
V(sem)———————> P(sem) aaa() // No need to V(sem), for no child
aaa()
If parent’s send() operation need to wait the children’s ready() done, then do it literally too, but is a reverse way:
- UDP Server TCP Server1 TCP Server2
ready() ready() P(sem) <——————— V(sem)
P(sem) <—————— V(sem) send()
Note that the aaa() and ready() operations above run in parallel. If this is not the case due to race condition, the sequence above can be modified into this below:
- UDP Server TCP Server1 TCP Server2
- // No child any more
- ready()
P(sem) <——————— V(sem) ready()
P(sem) <——————- V(sem) send()
In order to implement such chained/zipper sync pattern, a pair of semaphores is needed between the parent and the child. One is used by child to wait parent , the other is used by parent to wait child. semaphore pair can be allocated by parent and pass the pointer to the child over spawn() operation such as pthread_create().
/* semaphore pair definition */ struct semaphores {
sem_t wait_parent; sem_t wait_child;
};
Then the semaphore pair can be recorded by threads by using the semlink struct below: struct semlink {
};
chained/zipper sync API:
void sl_wait_child(struct semlink *sl); void sl_release_child(struct semlink *sl); void sl_wait_parent(struct semlink *sl); void sl_release_parent(struct semlink *sl);
API usage is like this.
Thread1(root parent) Thread2(child) Thread3(grandchild) sl_wait_parent(noop op) sl_release_child
- +———->sl_wait_parent
- sl_release_child
- +———–> sl_wait_parent
- sl_release_parent
sl_wait_child <————-
- sl_release_parent
sl_wait_child <———— sl_release_parent(noop op)
API implementation:
void sl_wait_child(struct semlink *sl) {
- if (sl->this) {
- P(sl->this->wait_child);
}
}
void sl_release_child(struct semlink *sl) {
- if (sl->this) {
- V(sl->this->wait_parent);
}
}
void sl_wait_parent(struct semlink *sl) {
- if (sl->parent) {
- P(sl->parent->wait_parent);
}
}
void sl_release_parent(struct semlink *sl) {
- if (sl->parent) {
- V(sl->parent->wait_child);
}
}
See Collaboration Diagram
See Collaboration Diagram
/—————————————————————-/ V
^ | | –> S_SYNC — (clients ClIENT_READY) | | | –> S_SEND — (clients CLIENT_DONE) | | | V —————(bufferctl.pkt_count != 0)———————–+
V
exit() <— (bufferctl.pkt_count == 0)
TCP uses poll() to sync with client’s events as well as output event from itself, so that we can use non-block socket operations to reduce the latency. POLLIN means there are message from client and POLLOUT means we are ready to send message/retransmission packets to client.
poll main loop pseudo code: void check_clients(struct server_status_data *sdata) {
poll_events = poll(&(sdata->ds[1]), sdata->ccount - 1, timeout);
/* check all connected clients */ for (sdata->cindex = 1; sdata->cindex < sdata->ccount; sdata->cindex++) {
ds = &(sdata->ds[sdata->cindex]); if (!ds->revents) {
continue;}
- if (ds->revents & (POLLERR|POLLHUP|POLLNVAL)) {
- handle_error_event(sdata);
- } else if (ds->revents & (POLLIN|POLLPRI)) {
- handle_pullin_event(sdata); // may set POLLOUT into ds->events
- // to trigger handle_pullout_event().
- } else if (ds->revents & POLLOUT) {
- handle_pullout_event(sdata);
}
}
}
For TCP, since the message from client may not complete and send data may be also interrupted due to non-block fashion, there should be one send message queue and a receive message queue on the server side for each client (client do not use non-block operations).
TCP message queue definition:
};
TCP message queue item definition:
};
TCP message queue API:
// Allocate and init a queue. struct tcpq * tcpq_queue_init(void);
// Free a queue. void tcpq_queue_free(struct tcpq *q);
// Return queue length. long tcpq_queue_dsize(struct tcpq *q);
// queue new message to tail. void tcpq_queue_tail(struct tcpq *q, void *data, long size);
// queue message that cannot be sent currently back to queue head. void tcpq_queue_head(struct tcpq *q, void *data, long size);
// get one piece from queue head. void * tcpq_dequeue_head(struct tcpq *q, long *size);
// Serialize all pieces of a queue, and move it out of queue, to ease the further //operation on it. void * tcpq_dqueue_flat(struct tcpq *q, long *size);
// Serialize all pieces of a queue, do not move it out of queue, to ease the further //operation on it. void * tcpq_queue_flat_peek(struct tcpq *q, long *size);
This document compiles the release notes for the Fraser release of OPNFV when using Daisy as a deployment tool.
Before installing Daisy4NFV on jump server,you have to configure the daisy.conf file.Then put the right configured daisy.conf file in the /home/daisy_install/ dir.
When executing deploy.sh, before doing real deployment, Daisy utilizes Kolla’s service configuration functionality [1] to specify the following changes to the default OpenStack configuration which comes from Kolla as default.
a) If is it is a VM deployment, set virt_type=qemu amd cpu_mode=none for nova-compute.conf.
b) In nova-api.conf set default_floating_pool to the name of the external network which will be created by Daisy after deployment for nova-api.conf.
c) In heat-api.conf and heat-engine.conf, set deferred_auth_method to trusts and unset trusts_delegated_roles.
Those above changes are requirements of OPNFV or environment’s constraints. So it is not recommended to change them. But if the user wants to add more specific configurations to OpenStack services before doing real deployment, we suggest to do it in the same way as deploy.sh do. Currently, this means hacking into deploy/prepare.sh or deploy/prepare/execute.py then add config file as described in [1].
Notes: Suggest to pass the first deployment first, then reconfigure and deploy again.
After the first time of deployment of OpenStack, its configurations can also be changed and applied by using Kolla’s service configuration functionality [1]. But user has to issue Kolla’s command to do it in this release:
This document describes how to install the Fraser release of OPNFV when using Daisy4nfv as a deployment tool covering it’s limitations, dependencies and required resources.
| Date | Ver. | Author | Comment |
| 2017-02-07 | 0.0.1 | Zhijiang Hu (ZTE) | Initial version |
This document provides guidelines on how to install and configure the Fraser release of OPNFV when using Daisy as a deployment tool including required software and hardware configurations.
Installation and configuration of host OS, OpenStack etc. can be supported by Daisy on Virtual nodes and Bare Metal nodes.
The audience of this document is assumed to have good knowledge in networking and Unix/Linux administration.
Before starting the installation of the Fraser release of OPNFV, some plannings must be done.
First of all, the installation iso which includes packages of Daisy, OS, OpenStack, and so on is needed for deploying your OPNFV environment.
The stable release iso image can be retrieved via OPNFV software download page
The daily build iso image can be retrieved via OPNFV artifact repository:
http://artifacts.opnfv.org/daisy.html
NOTE: Search the keyword “daisy/Fraser” to locate the iso image.
E.g. daisy/opnfv-2017-10-06_09-50-23.iso
Download the iso file, then mount it to a specified directory and get the opnfv-*.bin from that directory.
The git url and sha512 checksum of iso image are recorded in properties files. According to these, the corresponding deployment scripts can be retrieved.
To retrieve the repository of Daisy on Jumphost use the following command:
To get stable Fraser release, you can use the following command:
If you have only 1 Bare Metal server, Virtual deployment is recommended. if you have more than 3 servers, the Bare Metal deployment is recommended. The minimum number of servers for each role in Bare metal deployment is listed below.
| Role | Number of Servers |
| Jump Host | 1 |
| Controller | 1 |
| Compute | 1 |
The Jumphost requirements are outlined below:
Bare Metal nodes require:
Network requirements include:
Note: All networks except OpenStack External Network can share one NIC(Default configuration) or use an exclusive NIC(Reconfigurated in network.yml).
In order to execute a deployment, one must gather the following information:
The below file is the inventory template of deployment nodes:
”./deploy/config/bm_environment/zte-baremetal1/deploy.yml”
You can write your own name/roles reference into it.
- name – Host name for deployment node after installation.
- roles – Components deployed. CONTROLLER_LB is for Controller,
COMPUTER is for Compute role. Currently only these two roles are supported. The first CONTROLLER_LB is also used for ODL controller. 3 hosts in inventory will be chosen to setup the Ceph storage cluster.
Set TYPE and FLAVOR
E.g.
TYPE: virtual
FLAVOR: cluster
Assignment of different roles to servers
E.g. OpenStack only deployment roles setting
hosts:
- name: host1
roles:
- CONTROLLER_LB
- name: host2
roles:
- COMPUTER
- name: host3
roles:
- COMPUTER
NOTE: For B/M, Daisy uses MAC address defined in deploy.yml to map discovered nodes to node items definition in deploy.yml, then assign role described by node item to the discovered nodes by name pattern. Currently, controller01, controller02, and controller03 will be assigned with Controler role while computer01, ‘computer02, computer03, and computer04 will be assigned with Compute role.
NOTE: For V/M, There is no MAC address defined in deploy.yml for each virtual machine. Instead, Daisy will fill that blank by getting MAC from “virsh dump-xml”.
Before deployment, there are some network configurations to be checked based on your network topology. The default network configuration file for Daisy is ”./deploy/config/bm_environment/zte-baremetal1/network.yml”. You can write your own reference into it.
The following figure shows the default network configuration.
+-B/M--------+------------------------------+
|Jumperserver+ |
+------------+ +--+ |
| | | |
| +-V/M--------+ | | |
| | Daisyserver+------+ | |
| +------------+ | | |
| | | |
+------------------------------------| |---+
| |
| |
+--+ | |
| | +-B/M--------+ | |
| +-------+ Controller +------+ |
| | | ODL(Opt.) | | |
| | | Network | | |
| | | CephOSD1 | | |
| | +------------+ | |
| | | |
| | | |
| | | |
| | +-B/M--------+ | |
| +-------+ Compute1 +------+ |
| | | CephOSD2 | | |
| | +------------+ | |
| | | |
| | | |
| | | |
| | +-B/M--------+ | |
| +-------+ Compute2 +------+ |
| | | CephOSD3 | | |
| | +------------+ | |
| | | |
| | | |
| | | |
+--+ +--+
^ ^
| |
| |
/---------------------------\ |
| External Network | |
\---------------------------/ |
/-----------------------+---\
| Installation Network |
| Public/Private API |
| Internet Access |
| Tenant Network |
| Storage Network |
| HeartBeat Network |
\---------------------------/
Note: For Flat External networks(which is used by default), a physical interface is needed on each compute node for ODL NetVirt recent versions. HeartBeat network is selected,and if it is configured in network.yml,the keepalived interface will be the heartbeat interface.
(2) Download latest bin file(such as opnfv-2017-06-06_23-00-04.bin) of daisy from http://artifacts.opnfv.org/daisy.html and change the bin file name(such as opnfv-2017-06-06_23-00-04.bin) to opnfv.bin. Check the https://build.opnfv.org/ci/job/daisy-os-odl-nofeature-ha-baremetal-daily-master/, and if the ‘snaps_health_check’ of functest result is ‘PASS’, you can use this verify-passed bin to deploy the openstack in your own environment
(3) Assumed cloned dir is $workdir, which laid out like below: [root@daisyserver daisy]# ls ci deploy docker INFO LICENSE requirements.txt templates tests tox.ini code deploy.log docs known_hosts setup.py test-requirements.txt tools Make sure the opnfv.bin file is in $workdir
(4) Enter into the $workdir, which laid out like below: [root@daisyserver daisy]# ls ci code deploy docker docs INFO LICENSE requirements.txt setup.py templates test-requirements.txt tests tools tox.ini Create folder of labs/zte/pod2/daisy/config in $workdir
(5) Move the ./deploy/config/bm_environment/zte-baremetal1/deploy.yml and ./deploy/config/bm_environment/zte-baremetal1/network.yml to labs/zte/pod2/daisy/config dir.
Note: If selinux is disabled on the host, please delete all xml files section of below lines in dir templates/physical_environment/vms/
- <seclabel type=’dynamic’ model=’selinux’ relabel=’yes’>
- <label>system_u:system_r:svirt_t:s0:c182,c195</label> <imagelabel>system_u:object_r:svirt_image_t:s0:c182,c195</imagelabel>
</seclabel>
(6) Config the bridge in jumperserver,make sure the daisy vm can connect to the targetnode,use the command below: brctl addbr br7 brctl addif br7 enp3s0f3(the interface for jumperserver to connect to daisy vm) ifconfig br7 10.20.7.1 netmask 255.255.255.0 up service network restart
(7) Run the script deploy.sh in daisy/ci/deploy/ with command: sudo ./ci/deploy/deploy.sh -L $(cd ./;pwd) -l zte -p pod2 -s os-nosdn-nofeature-noha
Note: The value after -L should be a absolute path which points to the directory which contents labs/zte/pod2/daisy/config directory. The value after -p parameter(pod2) comes from path “labs/zte/pod2” The value after -l parameter(zte) comes from path “labs/zte” The value after -s “os-nosdn-nofeature-ha” used for deploying multinode openstack The value after -s “os-nosdn-nofeature-noha” used for deploying all-in-one openstack
(8) When deployed successfully,the floating ip of openstack is 10.20.7.11, the login account is “admin” and the password is “keystone”
The below file is the inventory template of deployment nodes:
”./deploy/conf/vm_environment/zte-virtual1/deploy.yml”
You can write your own name/roles reference into it.
- name – Host name for deployment node after installation.
- roles – Components deployed.
Set TYPE and FLAVOR
E.g.
TYPE: virtual
FLAVOR: cluster
Assignment of different roles to servers
E.g. OpenStack only deployment roles setting
hosts:
- name: host1
roles:
- CONTROLLER_LB
- name: host2
roles:
- COMPUTER
NOTE: For B/M, Daisy uses MAC address defined in deploy.yml to map discovered nodes to node items definition in deploy.yml, then assign role described by node item to the discovered nodes by name pattern. Currently, controller01, controller02, and controller03 will be assigned with Controller role while computer01, computer02, computer03, and computer04 will be assigned with Compute role.
NOTE: For V/M, There is no MAC address defined in deploy.yml for each virtual machine. Instead, Daisy will fill that blank by getting MAC from “virsh dump-xml”.
E.g. OpenStack and ceph deployment roles setting
hosts:
- name: host1
roles:
- controller
- name: host2
roles:
- compute
Before deployment, there are some network configurations to be checked based on your network topology. The default network configuration file for Daisy is “daisy/deploy/config/vm_environment/zte-virtual1/network.yml”. You can write your own reference into it.
The following figure shows the default network configuration.
+-B/M--------+------------------------------+
|Jumperserver+ |
+------------+ +--+ |
| | | |
| +-V/M--------+ | | |
| | Daisyserver+------+ | |
| +------------+ | | |
| | | |
| +--+ | | |
| | | +-V/M--------+ | | |
| | +-------+ Controller +------+ | |
| | | | ODL(Opt.) | | | |
| | | | Network | | | |
| | | | Ceph1 | | | |
| | | +------------+ | | |
| | | | | |
| | | | | |
| | | | | |
| | | +-V/M--------+ | | |
| | +-------+ Compute1 +------+ | |
| | | | Ceph2 | | | |
| | | +------------+ | | |
| | | | | |
| | | | | |
| | | | | |
| | | +-V/M--------+ | | |
| | +-------+ Compute2 +------+ | |
| | | | Ceph3 | | | |
| | | +------------+ | | |
| | | | | |
| | | | | |
| | | | | |
| +--+ +--+ |
| ^ ^ |
| | | |
| | | |
| /---------------------------\ | |
| | External Network | | |
| \---------------------------/ | |
| /-----------------------+---\ |
| | Installation Network | |
| | Public/Private API | |
| | Internet Access | |
| | Tenant Network | |
| | Storage Network | |
| | HeartBeat Network | |
| \---------------------------/ |
+-------------------------------------------+
Note: For Flat External networks(which is used by default), a physical interface is needed on each compute node for ODL NetVirt recent versions. HeartBeat network is selected,and if it is configured in network.yml,the keepalived interface will be the heartbeat interface.
(1) Git clone the latest daisy4nfv code from opnfv: “git clone https://gerrit.opnfv.org/gerrit/daisy”, make sure the current branch is master
(2) Download latest bin file(such as opnfv-2017-06-06_23-00-04.bin) of daisy from http://artifacts.opnfv.org/daisy.html and change the bin file name(such as opnfv-2017-06-06_23-00-04.bin) to opnfv.bin. Check the https://build.opnfv.org/ci/job/daisy-os-odl-nofeature-ha-baremetal-daily-master/, and if the ‘snaps_health_check’ of functest result is ‘PASS’, you can use this verify-passed bin to deploy the openstack in your own environment
(3) Assumed cloned dir is $workdir, which laid out like below: [root@daisyserver daisy]# ls ci code deploy docker docs INFO LICENSE requirements.txt setup.py templates test-requirements.txt tests tools tox.ini Make sure the opnfv.bin file is in $workdir
(5) Move the deploy/config/vm_environment/zte-virtual1/deploy.yml and deploy/config/vm_environment/zte-virtual1/network.yml to labs/zte/virtual1/daisy/config dir.
Note: zte-virtual1 config files deploy openstack with five nodes(3 lb nodes and 2 computer nodes), if you want to deploy an all-in-one openstack, change the zte-virtual1 to zte-virtual2
Note: If selinux is disabled on the host, please delete all xml files section of below lines in dir templates/virtual_environment/vms/
- <seclabel type=’dynamic’ model=’selinux’ relabel=’yes’>
- <label>system_u:system_r:svirt_t:s0:c182,c195</label> <imagelabel>system_u:object_r:svirt_image_t:s0:c182,c195</imagelabel>
</seclabel>
(6) Run the script deploy.sh in daisy/ci/deploy/ with command: sudo ./ci/deploy/deploy.sh -L $(cd ./;pwd) -l zte -p virtual1 -s os-nosdn-nofeature-ha
Note: The value after -L should be an absolute path which points to the directory which includes labs/zte/virtual1/daisy/config directory. The value after -p parameter(virtual1) is got from labs/zte/virtual1/daisy/config/ The value after -l parameter(zte) is got from labs/ The value after -s “os-nosdn-nofeature-ha” used for deploying multinode openstack The value after -s “os-nosdn-nofeature-noha” used for deploying all-in-one openstack
(7) When deployed successfully,the floating ip of openstack is 10.20.11.11, the login account is “admin” and the password is “keystone”
Deployment may fail due to different kinds of reasons, such as Daisy VM creation error, target nodes failure during OS installation, or Kolla deploy command error. Different errors can be grouped into several error levels. We define Recovery Levels below to fulfill recover requirements in different error levels.
This level restart whole deployment again. Mainly to retry to solve errors such as Daisy VM creation failed. For example we use the following command to do virtual deployment(in the jump host):
sudo ./ci/deploy/deploy.sh -b ./ -l zte -p virtual1 -s os-nosdn-nofeature-ha
If command failed because of Daisy VM creation error, then redoing above command will restart whole deployment which includes rebuilding the daisy VM image and restarting Daisy VM.
If Daisy VM was created successfully, but bugs were encountered in Daisy code or software of target OS which prevent deployment from being done, in this case, the user or the developer does not want to recreate the Daisy VM again during next deployment process but just to modify some pieces of code in it. To achieve this, he/she can redo deployment by deleting all clusters and hosts first(in the Daisy VM):
source /root/daisyrc_admin
for i in `daisy cluster-list | awk -F "|" '{print $2}' | sed -n '4p' | tr -d " "`;do daisy cluster-delete $i;done
for i in `daisy host-list | awk -F "|" '{print $2}'| grep -o "[^ ]\+\( \+[^ ]\+\)*"|tail -n +2`;do daisy host-delete $i;done
Then, adjust deployment command as below and run it again(in the jump host):
sudo ./ci/deploy/deploy.sh -S -b ./ -l zte -p virtual1 -s os-nosdn-nofeature-ha
Pay attention to the “-S” argument above, it lets the deployment process to skip re-creating Daisy VM and use the existing one.
If both Daisy VM and target node’s OS are OK, but error ocurred when doing OpenStack deployment, then there is even no need to re-install target OS for the deployment retrying. In this level, all we need to do is just retry the Daisy deployment command as follows(in the Daisy VM):
source /root/daisyrc_admin
daisy uninstall <cluster-id>
daisy install <cluster-id>
This basically does kolla-ansible destruction and kolla-asnible deployment.
If previous deployment was failed during kolla-ansible deploy(you can confirm it by checking /var/log/daisy/api.log) or if previous deployment was successful but the default configration is not what you want and it is OK for you to destroy the OPNFV software stack and re-deploy it again, then you can try recovery level 3.
For example, in order to use external iSCSI storage, you are about to deploy iSCSI cinder backend which is not enabled by default. First, cleanup the previous deployment.
ssh into daisy node, then do:
[root@daisy daisy]# source /etc/kolla/admin-openrc.sh
[root@daisy daisy]# openstack server delete <all vms you created>
Note: /etc/kolla/admin-openrc.sh may not have existed if previous deployment was failed during kolla deploy.
[root@daisy daisy]# cd /home/kolla_install/kolla-ansible/
[root@daisy kolla-ansible]# ./tools/kolla-ansible destroy \
-i ./ansible/inventory/multinode --yes-i-really-really-mean-it
Then, edit /etc/kolla/globals.yml and append the follwoing line:
enable_cinder_backend_iscsi: "yes"
enable_cinder_backend_lvm: "no"
Then, re-deploy again:
[root@daisy kolla-ansible]# ./tools/kolla-ansible prechecks -i ./ansible/inventory/multinode
[root@daisy kolla-ansible]# ./tools/kolla-ansible deploy -i ./ansible/inventory/multinode
After successfully deploying, issue the following command to generate /etc/kolla/admin-openrc.sh file.
[root@daisy kolla-ansible]# ./tools/kolla-ansible post-deploy -i ./ansible/inventory/multinode
Finally, issue the following command to create necessary resources, and your environment are ready for running OPNFV functest.
[root@daisy kolla-ansible]# cd /home/daisy
[root@daisy daisy]# ./deploy/post.sh -n /home/daisy/labs/zte/virtual1/daisy/config/network.yml
Note: “zte/virtual1” in above path may vary in your environment.
Thanks to Kolla’s kolla-ansible upgrade function, Daisy can update OpenStack minor version as the follows:
1. Get new version file only from Daisy team. Since Daisy’s Kolla images are built by meeting the OPNFV requirements and have their own file packaging layout, Daisy requires user to always use Kolla image file built by Daisy team. Currently, it can be found at http://artifacts.opnfv.org/daisy/upstream, or please see this chapter for how to build your own image.
2. Put new version file into /var/lib/daisy/versionfile/kolla/, for example: /var/lib/daisy/versionfile/kolla/kolla-image-ocata-170811155446.tgz
3. Add version file to Daisy’s version management database then get the version ID.
[root@daisy ~]# source /root/daisyrc_admin
[root@daisy ~]# daisy version-add kolla-image-ocata-170811155446.tgz kolla
+-------------+--------------------------------------+
| Property | Value |
+-------------+--------------------------------------+
| checksum | None |
| created_at | 2017-08-28T06:45:25.000000 |
| description | None |
| id | 8be92587-34d7-43e8-9862-a5288c651079 |
| name | kolla-image-ocata-170811155446.tgz |
| owner | None |
| size | 0 |
| status | unused |
| target_id | None |
| type | kolla |
| updated_at | 2017-08-28T06:45:25.000000 |
| version | None |
+-------------+--------------------------------------+
[root@daisy ~]# daisy cluster-list
+--------------------------------------+-------------+...
| ID | Name |...
+--------------------------------------+-------------+...
| d4c1e0d3-c4b8-4745-aab0-0510e62f0ebb | clustertest |...
+--------------------------------------+-------------+...
[root@daisy ~]# daisy update d4c1e0d3-c4b8-4745-aab0-0510e62f0ebb --update-object kolla --version-id 8be92587-34d7-43e8-9862-a5288c651079
+----------+--------------+
| Property | Value |
+----------+--------------+
| status | begin update |
+----------+--------------+
6. Since step 5’s command is non-blocking, the user need to run the following command to get updating progress.
[root@daisy ~]# daisy host-list --cluster-id d4c1e0d3-c4b8-4745-aab0-0510e62f0ebb
...+---------------+-------------+-------------------------+
...| Role_progress | Role_status | Role_messages |
...+---------------+-------------+-------------------------+
...| 0 | updating | prechecking envirnoment |
...+---------------+-------------+-------------------------+
Notes. The above command returns many fields. User only have to take care about the Role_xxx fields in this case.
The following command will build Ocata Kolla image for Daisy based on Daisy’s fork of openstack/kolla project. This is also the method Daisy used for the Euphrates release.
The reason why here use fork of openstack/kolla project is to backport ODL support from pike branch to ocata branch.
cd ./ci
./kolla-build.sh
After building, the above command will put Kolla image into /tmp/kolla-build-output directory and the image version will be 4.0.2.
If you want to build an image which can update 4.0.2, run the following command:
cd ./ci
./kolla-build.sh -e 1
This time the image version will be 4.0.2.1 which is higher than 4.0.2 so that it can be used to replace the old version.
After successful deployment of openstack, daisy4nfv use Functest to test the api of openstack. You can follow below instruction to test the successfully deployed openstack on jumperserver.
1.docker pull opnfv/functest run ‘docker images’ command to make sure have the latest functest images.
2.docker run -ti –name functest -e INSTALLER_TYPE=”daisy”-e INSTALLER_IP=”10.20.11.2” -e NODE_NAME=”zte-vtest” -e DEPLOY_SCENARIO=”os-nosdn-nofeature-ha” -e BUILD_TAG=”jenkins-functest-daisy-virtual-daily-master-1259” -e DEPLOY_TYPE=”virt” opnfv/functest:latest /bin/bash Before run above command change below parameters: DEPLOY_SCENARIO: indicate the scenario DEPLOY_TYPE: virt/baremetal NODE_NAME: pod name INSTALLER_IP: daisy vm node ip
3.Log in the daisy vm node to get the /etc/kolla/admin-openrc.sh file, and write them in /home/opnfv/functest/conf/openstack.creds file of functest container.
4.Run command ‘functest env prepare’ to prepare the functest env.
5.Run command ‘functest testcase list’ to list all the testcase can be run.
6.Run command ‘functest testcase run testcase_name’ to run the testcase_name testcase of functest.
This Edge Cloud Requirement Document is used for eliciting telecom network Edge Cloud Requirements of OPNFV, where telecom network edge clouds are edge clouds deployed into the telecommunication infrastructure. Edge clouds deployed beyond the borders of telecommunication networks are outside of the scope of this document. This document will define high-level telecom network edge cloud goals, including service reqirements, sites conditions, and translate them into detailed requirements on edge cloud infrastructure components. Moreover, this document can be used as reference for edge cloud testing scenario design.
The following terminologies will be used in this document:
Core site(s): Sites that are far away from end users/ base stations, completely virtualized, and mainly host control domain services (e.g. telco services: HSS, MME, IMS, EPC, etc).
Edge site(s): Sites that are closer to end users/ base stations, and mainly host control and compute services.
E2E delay: time of the transmission process between the user equipment and the edge cloud site. It contains four parts: time of radio transmission, time of optical fiber transmission, time of GW forwarding, and time of VM forwarding.
BBU: Building Baseband Unit. It’s a centralized processing unit of radio signals. Together with RRU (Remote Radio Unit), it forms the distirbuted base station architecture. For example, a large stadium is usually separated into different districts. Each district would be provided with a RRU, which is close to user, to provide radio access. All RRUs would be linked to a BBU, which is located inside a remote site away from user and provide signal processing, using optical fiber.
BRAS: Broadband Remote Access Server. An Ethernet-centric IP edge router, and the aggregation point for the user traffic. It performs Ethernet aggregation and packets forwarding via IP/MPLS, and supports user management, access protocols termination, QoS and policy management, etc.
UPF: User Plane Function, which is a user plane gateway for user data transmission.
SAE-GW: SAE stands for System Architecture Evolution, which is the core network architecture of 3GPP’s LTE wireless communication standard. SAE-GW includes Serving Gateway and PDN Gateway. Serving Gateway (SGW) routes and forwards user data packets,and also acts as the mobility anchor for LTE and other 3GPP technologies. PDN Gateway (PGW) provides connectivity from the UE to external packet data networks by being the point of exit and entry of traffic for the UE.
SAE-GW related definition link: https://en.wikipedia.org/wiki/System_Architecture_Evolution
CPE: In telecommunications, a customer-premises equipment or customer-provided equipment (CPE) is any terminal and associated equipment located at a subscriber’s premises and connected with a carrier’s telecommunication circuit. CPE generally refers to devices such as telephones, routers, network switches, residential gateways (RG), home networking adapters and Internet access gateways that enable consumers to access communications service providers’ services and distribute them around their house via a local area network (LAN).
CPE definition: https://en.wikipedia.org/wiki/Customer-premises_equipment
enterprise vCPE: Usually CPE provides a number of network functions such as firewall, access control, policy management and discovering/connecting devices at home. enterprise vCPE stands for virtual CPE for enterprise, which is a software framework that virtualizes several CPE funcitons.
As space and power resources are limited in edge sites and edge usually has fewer number of servers (the number varies from a few to several dozens), it is unnecessary to deploy orchestrator or VNFM. The depolyed VIM (e.g.: OpenStack or Kubernetes) and SDN would be optimized for low resource usage to save resources for services. Resource optimisation of VIM and SDN have not been discussed yet, but basic functions such as VM lifecycle management and automatic network management should be persisted.
As there is no professional maintenance staff at edge, remote provisioning should be provided so that virtual resources of distributed edge sites can obtain unified orchestration and maintenance. Orchestrator together with OSS/BSS, EMS and VNFM should be deployed remotely in some central offices to reduce the difficulty and cost of management as well as increasing edge resource utilization ratio. Multi region OpenStack could be considered as one of the VIM solution.
With various applications running on edge, diverse resources, including VM, container and bare-metal could co-exist and form diverse resource pool. These resources should be managed by edge management components as well as core orchestration/management components.
Edge services usually require strict low latency, high bandwidth, and fast computing and processing ability. Acceleration technology should be used in edge to maintain good service performance. OpenStack should fully expose these acceleration capabilities to services. The usage of different acceleration technologies (including DPDK, SR-IOV, GPU, Smart NIC, FPGA and etc.) varies from service to service.
Related project about acceleration: https://wiki.openstack.org/wiki/Cyborg
Latency and distance to customer are taken as two main characters to separate different sites. The following figure shows three different sites.
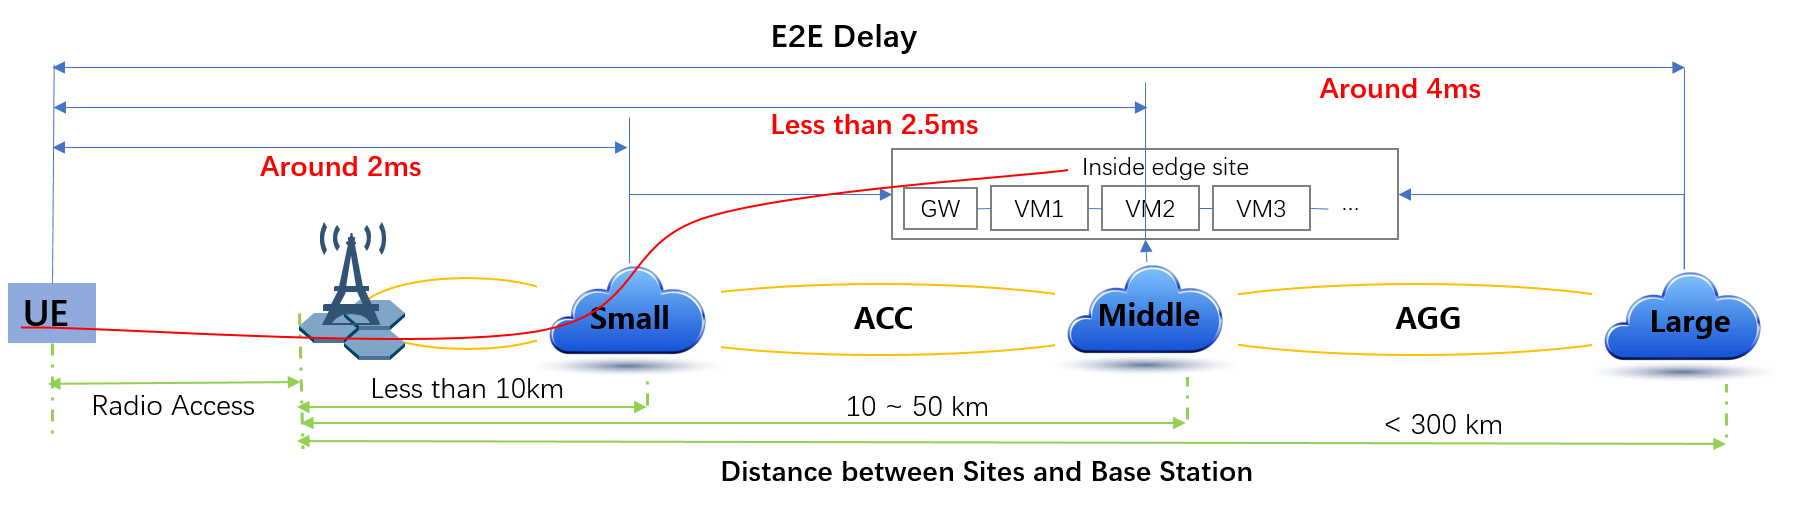
Based on requirements of telco related use cases and edge sites conditions, the edge structure has been summarized as the figure below.
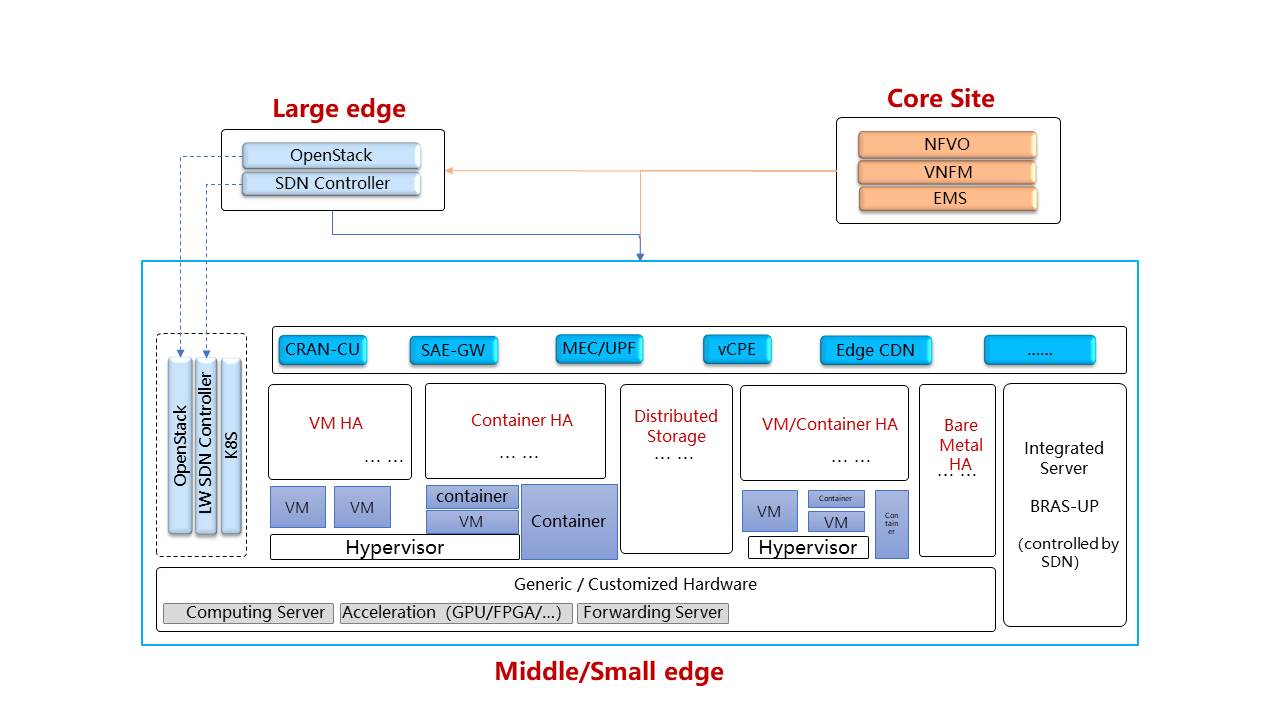
Customized server would be possible for edge because of limited space, power, temperature, vibration and etc. But if there were custom enclosures that can provide environmental controls, then non-customized server can be used, which is a cost tradeoff.
More derails: TBD
Hardware acceleration resources and acceleration software would be necessary for edge.
More details:TBD
Edge OpenStack would be in hierarchical structure. Remote provisioning like multi-region OpenStack would exist in large edge sites with professional maintenance staff and provide remote management on several middle/small edge sites. Middle and small edge sites would not only have their own resource management components to provide local resource and network management, but also under the remote provisioning of OpenStack in large edge sites.
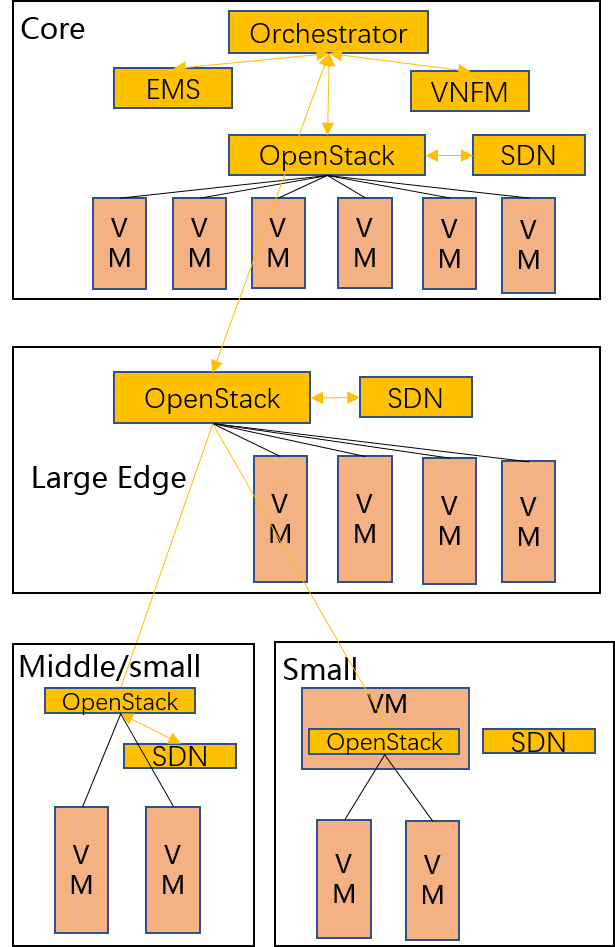
Optionally for large edge sites, OpenStack would be fully deployed. Its Keystone and Horizon would provide unified tenant and UI management for both itself and remote middle and small edge sites. In this case middle edge sites would have OpenStack with neccessary services like Nova, Neutron and Glance. While small edge site would use resource optimized weight OpenStack.
Other option is to use different instances of the same resource optimized OpenStack to control both large, medium and small edge sites.
More detalis: TBD
TBD
Orchestration and VNF lifecycle management: NFVO, VNFM, EMS exist in core cloud and provide remote lifecycle management.
More details: TBD
VM, container and bare-metal would exist as three different types of infrastructure resources. Which type of resources to use depends on services’ requirements and sites conditions. The introduction of container would be a future topic.
| Abstract: |
|---|
This document provides the users with the Installation Procedure to install OPNFV Gambia Release on IPv6-only Infrastructure.
This section provides instructions to install OPNFV on IPv6-only Infrastructure. All underlay networks and API endpoints will be IPv6-only except:
Except the limitations above, the use case scenario of the IPv6-only infrastructure includes:
Apex Installer:
# HA, Virtual deployment in OpenStack-only environment
./opnfv-deploy -v -d /etc/opnfv-apex/os-nosdn-nofeature-ha.yaml \
-n /etc/opnfv-apex/network_settings_v6.yaml
# HA, Bare Metal deployment in OpenStack-only environment
./opnfv-deploy -d /etc/opnfv-apex/os-nosdn-nofeature-ha.yaml \
-i <inventory file> -n /etc/opnfv-apex/network_settings_v6.yaml
# Non-HA, Virtual deployment in OpenStack-only environment
./opnfv-deploy -v -d /etc/opnfv-apex/os-nosdn-nofeature-noha.yaml \
-n /etc/opnfv-apex/network_settings_v6.yaml
# Non-HA, Bare Metal deployment in OpenStack-only environment
./opnfv-deploy -d /etc/opnfv-apex/os-nosdn-nofeature-noha.yaml \
-i <inventory file> -n /etc/opnfv-apex/network_settings_v6.yaml
# Note:
#
# 1. Parameter ""-v" is mandatory for Virtual deployment
# 2. Parameter "-i <inventory file>" is mandatory for Bare Metal deployment
# 2.1 Refer to https://git.opnfv.org/cgit/apex/tree/config/inventory for examples of inventory file
# 3. You can use "-n /etc/opnfv-apex/network_settings.yaml" for deployment in IPv4 infrastructure
Please NOTE that:
Apex Installer:
# HA, Virtual deployment in OpenStack with Open Daylight L3 environment
./opnfv-deploy -v -d /etc/opnfv-apex/os-odl-nofeature-ha.yaml \
-n /etc/opnfv-apex/network_settings_v6.yaml
# HA, Bare Metal deployment in OpenStack with Open Daylight L3 environment
./opnfv-deploy -d /etc/opnfv-apex/os-odl-nofeature-ha.yaml \
-i <inventory file> -n /etc/opnfv-apex/network_settings_v6.yaml
# Non-HA, Virtual deployment in OpenStack with Open Daylight L3 environment
./opnfv-deploy -v -d /etc/opnfv-apex/os-odl-nofeature-noha.yaml \
-n /etc/opnfv-apex/network_settings_v6.yaml
# Non-HA, Bare Metal deployment in OpenStack with Open Daylight L3 environment
./opnfv-deploy -d /etc/opnfv-apex/os-odl-nofeature-noha.yaml \
-i <inventory file> -n /etc/opnfv-apex/network_settings_v6.yaml
# Note:
#
# 1. Parameter ""-v" is mandatory for Virtual deployment
# 2. Parameter "-i <inventory file>" is mandatory for Bare Metal deployment
# 2.1 Refer to https://git.opnfv.org/cgit/apex/tree/config/inventory for examples of inventory file
# 3. You can use "-n /etc/opnfv-apex/network_settings.yaml" for deployment in IPv4 infrastructure
Please NOTE that:
There are 2 levels of testing to validate the deployment.
Underlay Testing is to validate that API endpoints are listening on IPv6 addresses. Currently, we are only considering the Underlay Testing for OpenStack API endpoints. The Underlay Testing for Open Daylight API endpoints is for future release.
The Underlay Testing for OpenStack API endpoints can be as simple as validating Keystone service, and as complete as validating each API endpoint. It is important to reuse Tempest API testing. Currently:
OS_AUTH_URL in overcloudrc during
installation process. For example:
export OS_AUTH_URL=http://[2001:db8::15]:5000/v2.0.
OS_AUTH_URL points to Keystone and Keystone catalog.OS_AUTH_URL is taken
from the environment and placed automatically in Tempest.conf.openstack catalog list will return IPv6 URL
endpoints for all the services in catalog, including Nova, Neutron, etc,
and covering public URLs, private URLs and admin URLs.overclourc, all the tests
will use that (including Tempest).Therefore Tempest API testing is reused to validate API endpoints are listening on IPv6 addresses as stated above. They are part of OpenStack default Smoke Tests, run in FuncTest and integrated into OPNFV’s CI/CD environment.
Overlay Testing is to validate that IPv6 is supported in tenant networks, subnets and routers. Both Tempest API testing and Tempest Scenario testing are used in our Overlay Testing.
Tempest API testing validates that the Neutron API supports the creation of IPv6 networks, subnets, routers, etc:
tempest.api.network.test_networks.BulkNetworkOpsIpV6Test.test_bulk_create_delete_network
tempest.api.network.test_networks.BulkNetworkOpsIpV6Test.test_bulk_create_delete_port
tempest.api.network.test_networks.BulkNetworkOpsIpV6Test.test_bulk_create_delete_subnet
tempest.api.network.test_networks.NetworksIpV6Test.test_create_update_delete_network_subnet
tempest.api.network.test_networks.NetworksIpV6Test.test_external_network_visibility
tempest.api.network.test_networks.NetworksIpV6Test.test_list_networks
tempest.api.network.test_networks.NetworksIpV6Test.test_list_subnets
tempest.api.network.test_networks.NetworksIpV6Test.test_show_network
tempest.api.network.test_networks.NetworksIpV6Test.test_show_subnet
tempest.api.network.test_networks.NetworksIpV6TestAttrs.test_create_update_delete_network_subnet
tempest.api.network.test_networks.NetworksIpV6TestAttrs.test_external_network_visibility
tempest.api.network.test_networks.NetworksIpV6TestAttrs.test_list_networks
tempest.api.network.test_networks.NetworksIpV6TestAttrs.test_list_subnets
tempest.api.network.test_networks.NetworksIpV6TestAttrs.test_show_network
tempest.api.network.test_networks.NetworksIpV6TestAttrs.test_show_subnet
tempest.api.network.test_ports.PortsIpV6TestJSON.test_create_port_in_allowed_allocation_pools
tempest.api.network.test_ports.PortsIpV6TestJSON.test_create_port_with_no_securitygroups
tempest.api.network.test_ports.PortsIpV6TestJSON.test_create_update_delete_port
tempest.api.network.test_ports.PortsIpV6TestJSON.test_list_ports
tempest.api.network.test_ports.PortsIpV6TestJSON.test_show_port
tempest.api.network.test_routers.RoutersIpV6Test.test_add_multiple_router_interfaces
tempest.api.network.test_routers.RoutersIpV6Test.test_add_remove_router_interface_with_port_id
tempest.api.network.test_routers.RoutersIpV6Test.test_add_remove_router_interface_with_subnet_id
tempest.api.network.test_routers.RoutersIpV6Test.test_create_show_list_update_delete_router
tempest.api.network.test_security_groups.SecGroupIPv6Test.test_create_list_update_show_delete_security_group
tempest.api.network.test_security_groups.SecGroupIPv6Test.test_create_show_delete_security_group_rule
tempest.api.network.test_security_groups.SecGroupIPv6Test.test_list_security_groups
Tempest Scenario testing validates some specific overlay IPv6 scenarios (i.e. use cases) as follows:
tempest.scenario.test_network_v6.TestGettingAddress.test_dhcp6_stateless_from_os
tempest.scenario.test_network_v6.TestGettingAddress.test_dualnet_dhcp6_stateless_from_os
tempest.scenario.test_network_v6.TestGettingAddress.test_dualnet_multi_prefix_dhcpv6_stateless
tempest.scenario.test_network_v6.TestGettingAddress.test_dualnet_multi_prefix_slaac
tempest.scenario.test_network_v6.TestGettingAddress.test_dualnet_slaac_from_os
tempest.scenario.test_network_v6.TestGettingAddress.test_multi_prefix_dhcpv6_stateless
tempest.scenario.test_network_v6.TestGettingAddress.test_multi_prefix_slaac
tempest.scenario.test_network_v6.TestGettingAddress.test_slaac_from_os
The above Tempest API testing and Scenario testing are quite comprehensive to validate overlay IPv6 tenant networks. They are part of OpenStack default Smoke Tests, run in FuncTest and integrated into OPNFV’s CI/CD environment.
| Abstract: |
|---|
This document provides the users with the Configuration Guide to set up a service VM as an IPv6 vRouter using OPNFV Gambia Release.
This section provides instructions to set up a service VM as an IPv6 vRouter using OPNFV Gambia Release installers. Because Open Daylight no longer supports L2-only option, and there is only limited support of IPv6 in L3 option of Open Daylight, setup of service VM as an IPv6 vRouter is only available under pure/native OpenStack environment. The deployment model may be HA or non-HA. The infrastructure may be bare metal or virtual environment.
The configuration will work only in OpenStack-only environment.
Depending on which installer will be used to deploy OPNFV, each environment may be deployed on bare metal or virtualized infrastructure. Each deployment may be HA or non-HA.
Refer to the previous installer configuration chapters, installations guide and release notes.
If you intend to set up a service VM as an IPv6 vRouter in OpenStack-only environment of OPNFV Gambia Release, please NOTE that:
OPNFV-NATIVE-INSTALL-1: To install OpenStack-only environment of OPNFV Gambia Release:
Apex Installer:
# HA, Virtual deployment in OpenStack-only environment
./opnfv-deploy -v -d /etc/opnfv-apex/os-nosdn-nofeature-ha.yaml \
-n /etc/opnfv-apex/network_setting.yaml
# HA, Bare Metal deployment in OpenStack-only environment
./opnfv-deploy -d /etc/opnfv-apex/os-nosdn-nofeature-ha.yaml \
-i <inventory file> -n /etc/opnfv-apex/network_setting.yaml
# Non-HA, Virtual deployment in OpenStack-only environment
./opnfv-deploy -v -d /etc/opnfv-apex/os-nosdn-nofeature-noha.yaml \
-n /etc/opnfv-apex/network_setting.yaml
# Non-HA, Bare Metal deployment in OpenStack-only environment
./opnfv-deploy -d /etc/opnfv-apex/os-nosdn-nofeature-noha.yaml \
-i <inventory file> -n /etc/opnfv-apex/network_setting.yaml
# Note:
#
# 1. Parameter ""-v" is mandatory for Virtual deployment
# 2. Parameter "-i <inventory file>" is mandatory for Bare Metal deployment
# 2.1 Refer to https://git.opnfv.org/cgit/apex/tree/config/inventory for examples of inventory file
# 3. You can use "-n /etc/opnfv-apex/network_setting_v6.yaml" for deployment in IPv6-only infrastructure
Compass Installer:
# HA deployment in OpenStack-only environment
export ISO_URL=file://$BUILD_DIRECTORY/compass.iso
export OS_VERSION=${{COMPASS_OS_VERSION}}
export OPENSTACK_VERSION=${{COMPASS_OPENSTACK_VERSION}}
export CONFDIR=$WORKSPACE/deploy/conf/vm_environment
./deploy.sh --dha $CONFDIR/os-nosdn-nofeature-ha.yml \
--network $CONFDIR/$NODE_NAME/network.yml
# Non-HA deployment in OpenStack-only environment
# Non-HA deployment is currently not supported by Compass installer
Fuel Installer:
# HA deployment in OpenStack-only environment
# Scenario Name: os-nosdn-nofeature-ha
# Scenario Configuration File: ha_heat_ceilometer_scenario.yaml
# You can use either Scenario Name or Scenario Configuration File Name in "-s" parameter
sudo ./deploy.sh -b <stack-config-uri> -l <lab-name> -p <pod-name> \
-s os-nosdn-nofeature-ha -i <iso-uri>
# Non-HA deployment in OpenStack-only environment
# Scenario Name: os-nosdn-nofeature-noha
# Scenario Configuration File: no-ha_heat_ceilometer_scenario.yaml
# You can use either Scenario Name or Scenario Configuration File Name in "-s" parameter
sudo ./deploy.sh -b <stack-config-uri> -l <lab-name> -p <pod-name> \
-s os-nosdn-nofeature-noha -i <iso-uri>
# Note:
#
# 1. Refer to http://git.opnfv.org/cgit/fuel/tree/deploy/scenario/scenario.yaml for scenarios
# 2. Refer to http://git.opnfv.org/cgit/fuel/tree/ci/README for description of
# stack configuration directory structure
# 3. <stack-config-uri> is the base URI of stack configuration directory structure
# 3.1 Example: http://git.opnfv.org/cgit/fuel/tree/deploy/config
# 4. <lab-name> and <pod-name> must match the directory structure in stack configuration
# 4.1 Example of <lab-name>: -l devel-pipeline
# 4.2 Example of <pod-name>: -p elx
# 5. <iso-uri> could be local or remote ISO image of Fuel Installer
# 5.1 Example: http://artifacts.opnfv.org/fuel/euphrates/opnfv-euphrates.1.0.iso
#
# Please refer to Fuel Installer's documentation for further information and any update
Joid Installer:
# HA deployment in OpenStack-only environment
./deploy.sh -o mitaka -s nosdn -t ha -l default -f ipv6
# Non-HA deployment in OpenStack-only environment
./deploy.sh -o mitaka -s nosdn -t nonha -l default -f ipv6
Please NOTE that:
OPNFV-NATIVE-INSTALL-2: Clone the following GitHub repository to get the configuration and metadata files
git clone https://github.com/sridhargaddam/opnfv_os_ipv6_poc.git \
/opt/stack/opnfv_os_ipv6_poc
Please NOTE that although Security Groups feature has been disabled automatically
through local.conf configuration file by some installers such as devstack, it is very likely
that other installers such as Apex, Compass, Fuel or Joid will enable Security
Groups feature after installation.
Please make sure that Security Groups are disabled in the setup
In order to disable Security Groups globally, please make sure that the settings in OPNFV-NATIVE-SEC-1 and OPNFV-NATIVE-SEC-2 are applied, if they are not there by default.
OPNFV-NATIVE-SEC-1: Change the settings in
/etc/neutron/plugins/ml2/ml2_conf.ini as follows, if they are not there by default
# /etc/neutron/plugins/ml2/ml2_conf.ini
[securitygroup]
enable_security_group = True
firewall_driver = neutron.agent.firewall.NoopFirewallDriver
[ml2]
extension_drivers = port_security
[agent]
prevent_arp_spoofing = False
OPNFV-NATIVE-SEC-2: Change the settings in /etc/nova/nova.conf as follows,
if they are not there by default.
# /etc/nova/nova.conf
[DEFAULT]
security_group_api = neutron
firewall_driver = nova.virt.firewall.NoopFirewallDriver
OPNFV-NATIVE-SEC-3: After updating the settings, you will have to restart the
Neutron and Nova services.
Please note that the commands of restarting Neutron and Nova would vary
depending on the installer. Please refer to relevant documentation of specific installers
OPNFV-NATIVE-SETUP-1: Now we assume that OpenStack multi-node setup is up and running. We have to source the tenant credentials in OpenStack controller node in this step. Please NOTE that the method of sourcing tenant credentials may vary depending on installers. For example:
Apex installer:
# On jump host, source the tenant credentials using /bin/opnfv-util provided by Apex installer
opnfv-util undercloud "source overcloudrc; keystone service-list"
# Alternatively, you can copy the file /home/stack/overcloudrc from the installer VM called "undercloud"
# to a location in controller node, for example, in the directory /opt, and do:
# source /opt/overcloudrc
Compass installer:
# source the tenant credentials using Compass installer of OPNFV
source /opt/admin-openrc.sh
Fuel installer:
# source the tenant credentials using Fuel installer of OPNFV
source /root/openrc
Joid installer:
# source the tenant credentials using Joid installer of OPNFV
source $HOME/joid_config/admin-openrc
devstack:
# source the tenant credentials in devstack
source openrc admin demo
Please refer to relevant documentation of installers if you encounter any issue.
OPNFV-NATIVE-SETUP-2: Download fedora22 image which would be used for vRouter
wget https://download.fedoraproject.org/pub/fedora/linux/releases/22/Cloud/x86_64/\
Images/Fedora-Cloud-Base-22-20150521.x86_64.qcow2
OPNFV-NATIVE-SETUP-3: Import Fedora22 image to glance
glance image-create --name 'Fedora22' --disk-format qcow2 --container-format bare \
--file ./Fedora-Cloud-Base-22-20150521.x86_64.qcow2
OPNFV-NATIVE-SETUP-4: This step is Informational. OPNFV Installer has taken care of this step during deployment. You may refer to this step only if there is any issue, or if you are using other installers.
We have to move the physical interface (i.e. the public network interface) to br-ex, including moving
the public IP address and setting up default route. Please refer to OS-NATIVE-SETUP-4 and
OS-NATIVE-SETUP-5 in our more complete instruction.
OPNFV-NATIVE-SETUP-5: Create Neutron routers ipv4-router and ipv6-router
which need to provide external connectivity.
neutron router-create ipv4-router
neutron router-create ipv6-router
OPNFV-NATIVE-SETUP-6: Create an external network/subnet ext-net using
the appropriate values based on the data-center physical network setup.
Please NOTE that you may only need to create the subnet of ext-net because OPNFV installers
should have created an external network during installation. You must use the same name of external
network that installer creates when you create the subnet. For example:
externalext-netadmin_floating_netext-netPlease refer to the documentation of installers if there is any issue
# This is needed only if installer does not create an external work
# Otherwise, skip this command "net-create"
neutron net-create --router:external ext-net
# Note that the name "ext-net" may work for some installers such as Compass and Joid
# Change the name "ext-net" to match the name of external network that an installer creates
neutron subnet-create --disable-dhcp --allocation-pool start=198.59.156.251,\
end=198.59.156.254 --gateway 198.59.156.1 ext-net 198.59.156.0/24
OPNFV-NATIVE-SETUP-7: Create Neutron networks ipv4-int-network1 and
ipv6-int-network2 with port_security disabled
neutron net-create ipv4-int-network1
neutron net-create ipv6-int-network2
OPNFV-NATIVE-SETUP-8: Create IPv4 subnet ipv4-int-subnet1 in the internal network
ipv4-int-network1, and associate it to ipv4-router.
neutron subnet-create --name ipv4-int-subnet1 --dns-nameserver 8.8.8.8 \
ipv4-int-network1 20.0.0.0/24
neutron router-interface-add ipv4-router ipv4-int-subnet1
OPNFV-NATIVE-SETUP-9: Associate the ext-net to the Neutron routers ipv4-router
and ipv6-router.
# Note that the name "ext-net" may work for some installers such as Compass and Joid
# Change the name "ext-net" to match the name of external network that an installer creates
neutron router-gateway-set ipv4-router ext-net
neutron router-gateway-set ipv6-router ext-net
OPNFV-NATIVE-SETUP-10: Create two subnets, one IPv4 subnet ipv4-int-subnet2 and
one IPv6 subnet ipv6-int-subnet2 in ipv6-int-network2, and associate both subnets to
ipv6-router
neutron subnet-create --name ipv4-int-subnet2 --dns-nameserver 8.8.8.8 \
ipv6-int-network2 10.0.0.0/24
neutron subnet-create --name ipv6-int-subnet2 --ip-version 6 --ipv6-ra-mode slaac \
--ipv6-address-mode slaac ipv6-int-network2 2001:db8:0:1::/64
neutron router-interface-add ipv6-router ipv4-int-subnet2
neutron router-interface-add ipv6-router ipv6-int-subnet2
OPNFV-NATIVE-SETUP-11: Create a keypair
nova keypair-add vRouterKey > ~/vRouterKey
OPNFV-NATIVE-SETUP-12: Create ports for vRouter (with some specific MAC address - basically for automation - to know the IPv6 addresses that would be assigned to the port).
neutron port-create --name eth0-vRouter --mac-address fa:16:3e:11:11:11 ipv6-int-network2
neutron port-create --name eth1-vRouter --mac-address fa:16:3e:22:22:22 ipv4-int-network1
OPNFV-NATIVE-SETUP-13: Create ports for VM1 and VM2.
neutron port-create --name eth0-VM1 --mac-address fa:16:3e:33:33:33 ipv4-int-network1
neutron port-create --name eth0-VM2 --mac-address fa:16:3e:44:44:44 ipv4-int-network1
OPNFV-NATIVE-SETUP-14: Update ipv6-router with routing information to subnet
2001:db8:0:2::/64
neutron router-update ipv6-router --routes type=dict list=true \
destination=2001:db8:0:2::/64,nexthop=2001:db8:0:1:f816:3eff:fe11:1111
OPNFV-NATIVE-SETUP-15: Boot Service VM (vRouter), VM1 and VM2
nova boot --image Fedora22 --flavor m1.small \
--user-data /opt/stack/opnfv_os_ipv6_poc/metadata.txt \
--availability-zone nova:opnfv-os-compute \
--nic port-id=$(neutron port-list | grep -w eth0-vRouter | awk '{print $2}') \
--nic port-id=$(neutron port-list | grep -w eth1-vRouter | awk '{print $2}') \
--key-name vRouterKey vRouter
nova list
# Please wait for some 10 to 15 minutes so that necessary packages (like radvd)
# are installed and vRouter is up.
nova console-log vRouter
nova boot --image cirros-0.3.4-x86_64-uec --flavor m1.tiny \
--user-data /opt/stack/opnfv_os_ipv6_poc/set_mtu.sh \
--availability-zone nova:opnfv-os-controller \
--nic port-id=$(neutron port-list | grep -w eth0-VM1 | awk '{print $2}') \
--key-name vRouterKey VM1
nova boot --image cirros-0.3.4-x86_64-uec --flavor m1.tiny
--user-data /opt/stack/opnfv_os_ipv6_poc/set_mtu.sh \
--availability-zone nova:opnfv-os-compute \
--nic port-id=$(neutron port-list | grep -w eth0-VM2 | awk '{print $2}') \
--key-name vRouterKey VM2
nova list # Verify that all the VMs are in ACTIVE state.
OPNFV-NATIVE-SETUP-16: If all goes well, the IPv6 addresses assigned to the VMs would be as shown as follows:
# vRouter eth0 interface would have the following IPv6 address:
# 2001:db8:0:1:f816:3eff:fe11:1111/64
# vRouter eth1 interface would have the following IPv6 address:
# 2001:db8:0:2::1/64
# VM1 would have the following IPv6 address:
# 2001:db8:0:2:f816:3eff:fe33:3333/64
# VM2 would have the following IPv6 address:
# 2001:db8:0:2:f816:3eff:fe44:4444/64
OPNFV-NATIVE-SETUP-17: Now we need to disable eth0-VM1, eth0-VM2,
eth0-vRouter and eth1-vRouter port-security
for port in eth0-VM1 eth0-VM2 eth0-vRouter eth1-vRouter
do
neutron port-update --no-security-groups $port
neutron port-update $port --port-security-enabled=False
neutron port-show $port | grep port_security_enabled
done
OPNFV-NATIVE-SETUP-18: Now we can SSH to VMs. You can execute the following command.
# 1. Create a floatingip and associate it with VM1, VM2 and vRouter (to the port id that is passed).
# Note that the name "ext-net" may work for some installers such as Compass and Joid
# Change the name "ext-net" to match the name of external network that an installer creates
neutron floatingip-create --port-id $(neutron port-list | grep -w eth0-VM1 | \
awk '{print $2}') ext-net
neutron floatingip-create --port-id $(neutron port-list | grep -w eth0-VM2 | \
awk '{print $2}') ext-net
neutron floatingip-create --port-id $(neutron port-list | grep -w eth1-vRouter | \
awk '{print $2}') ext-net
# 2. To know / display the floatingip associated with VM1, VM2 and vRouter.
neutron floatingip-list -F floating_ip_address -F port_id | grep $(neutron port-list | \
grep -w eth0-VM1 | awk '{print $2}') | awk '{print $2}'
neutron floatingip-list -F floating_ip_address -F port_id | grep $(neutron port-list | \
grep -w eth0-VM2 | awk '{print $2}') | awk '{print $2}'
neutron floatingip-list -F floating_ip_address -F port_id | grep $(neutron port-list | \
grep -w eth1-vRouter | awk '{print $2}') | awk '{print $2}'
# 3. To ssh to the vRouter, VM1 and VM2, user can execute the following command.
ssh -i ~/vRouterKey fedora@<floating-ip-of-vRouter>
ssh -i ~/vRouterKey cirros@<floating-ip-of-VM1>
ssh -i ~/vRouterKey cirros@<floating-ip-of-VM2>
If everything goes well, ssh will be successful and you will be logged into those VMs.
Run some commands to verify that IPv6 addresses are configured on eth0 interface.
OPNFV-NATIVE-SETUP-19: Show an IPv6 address with a prefix of 2001:db8:0:2::/64
ip address show
OPNFV-NATIVE-SETUP-20: ping some external IPv6 address, e.g. ipv6-router
ping6 2001:db8:0:1::1
If the above ping6 command succeeds, it implies that vRouter was able to successfully forward the IPv6 traffic
to reach external ipv6-router.
Congratulations, you have completed the setup of using a service VM to act as an IPv6 vRouter.
You have validated the setup based on the instruction in previous sections. If you want to further
test your setup, you can ping6 among VM1, VM2, vRouter and ipv6-router.
This setup allows further open innovation by any 3rd-party.
Refer to the relevant testing guides, results, and release notes of Yardstick Project.
| Abstract: |
|---|
This section provides the users with:
The gap analysis serves as feature specific user guides and references when as a user you may leverage the IPv6 feature in the platform and need to perform some IPv6 related operations.
The IPv6 Setup in Container Networking serves as feature specific user guides and references when as a user you may want to explore IPv6 in Docker container environment. The use of NDP Proxying is explored to connect IPv6-only containers to external network. The Docker IPv6 simple cluster topology is studied with two Hosts, each with 2 Docker containers. Docker IPv6 NAT topic is also explored.
For more information, please find Neutron’s IPv6 document for Queens Release.
This section provides users with IPv6 gap analysis regarding feature requirement with OpenStack Neutron in Queens Official Release. The following table lists the use cases / feature requirements of VIM-agnostic IPv6 functionality, including infrastructure layer and VNF (VM) layer, and its gap analysis with OpenStack Neutron in Queens Official Release.
Please NOTE that in terms of IPv6 support in OpenStack Neutron, there is no difference between Queens release and prior, e.g. Pike and Ocata, releases.
| Use Case / Requirement | Supported in Queens | Notes |
|---|---|---|
| All topologies work in a multi-tenant environment | Yes | The IPv6 design is following the Neutron tenant networks model; dnsmasq is being used inside DHCP network namespaces, while radvd is being used inside Neutron routers namespaces to provide full isolation between tenants. Tenant isolation can be based on VLANs, GRE, or VXLAN encapsulation. In case of overlays, the transport network (and VTEPs) must be IPv4 based as of today. |
| IPv6 VM to VM only | Yes | It is possible to assign IPv6-only addresses to VMs. Both switching (within VMs on the same tenant network) as well as east/west routing (between different networks of the same tenant) are supported. |
| IPv6 external L2 VLAN directly attached to a VM | Yes | IPv6 provider network model; RA messages from upstream (external) router are forwarded into the VMs |
IPv6 subnet routed via L3 agent to an external IPv6 network
|
|
Configuration is enhanced since Kilo to allow easier setup of the upstream gateway, without the user being forced to create an IPv6 subnet for the external network. |
Ability for a NIC to support both IPv4 and IPv6 (dual stack) address.
|
|
Dual-stack is supported in Neutron with the addition of
Multiple IPv6 Prefixes Blueprint |
Support IPv6 Address assignment modes.
|
|
|
| Ability to create a port on an IPv6 DHCPv6 Stateful subnet and assign a specific IPv6 address to the port and have it taken out of the DHCP address pool. | Yes | |
| Ability to create a port with fixed_ip for a SLAAC/DHCPv6-Stateless Subnet. | No | The following patch disables this operation: https://review.openstack.org/#/c/129144/ |
| Support for private IPv6 to external IPv6 floating IP; Ability to specify floating IPs via Neutron API (REST and CLI) as well as via Horizon, including combination of IPv6/IPv4 and IPv4/IPv6 floating IPs if implemented. | Rejected | Blueprint proposed in upstream and got rejected. General expectation is to avoid NAT with IPv6 by assigning GUA to tenant VMs. See https://review.openstack.org/#/c/139731/ for discussion. |
| Provide IPv6/IPv4 feature parity in support for pass-through capabilities (e.g., SR-IOV). | To-Do | The L3 configuration should be transparent for the SR-IOV
implementation. SR-IOV networking support introduced in Juno based
on the sriovnicswitch ML2 driver is expected to work with IPv4
and IPv6 enabled VMs. We need to verify if it works or not. |
| Additional IPv6 extensions, for example: IPSEC, IPv6 Anycast, Multicast | No | It does not appear to be considered yet (lack of clear requirements) |
| VM access to the meta-data server to obtain user data, SSH keys, etc. using cloud-init with IPv6 only interfaces. | No | This is currently not supported. Config-drive or dual-stack IPv4 / IPv6 can be used as a workaround (so that the IPv4 network is used to obtain connectivity with the metadata service). The following blog How to Use Config-Drive for Metadata with IPv6 Network provides a neat summary on how to use config-drive for metadata with IPv6 network. |
| Full support for IPv6 matching (i.e., IPv6, ICMPv6, TCP, UDP) in security groups. Ability to control and manage all IPv6 security group capabilities via Neutron/Nova API (REST and CLI) as well as via Horizon. | Yes | Both IPTables firewall driver and OVS firewall driver support IPv6 Security Group API. |
| During network/subnet/router create, there should be an option to allow user to specify the type of address management they would like. This includes all options including those low priority if implemented (e.g., toggle on/off router and address prefix advertisements); It must be supported via Neutron API (REST and CLI) as well as via Horizon | Yes | Two new Subnet attributes were introduced to control IPv6 address assignment options:
|
| Security groups anti-spoofing: Prevent VM from using a source IPv6/MAC address which is not assigned to the VM | Yes | |
| Protect tenant and provider network from rogue RAs | Yes | When using a tenant network, Neutron is going to automatically handle the filter rules to allow connectivity of RAs to the VMs only from the Neutron router port; with provider networks, users are required to specify the LLA of the upstream router during the subnet creation, or otherwise manually edit the security-groups rules to allow incoming traffic from this specific address. |
| Support the ability to assign multiple IPv6 addresses to an interface; both for Neutron router interfaces and VM interfaces. | Yes | |
| Ability for a VM to support a mix of multiple IPv4 and IPv6 networks, including multiples of the same type. | Yes | |
| IPv6 Support in “Allowed Address Pairs” Extension | Yes | |
| Support for IPv6 Prefix Delegation. | Yes | Partial support in Queens |
| Distributed Virtual Routing (DVR) support for IPv6 | No | In Queens DVR implementation, IPv6 works. But all the IPv6 ingress/ egress traffic is routed via the centralized controller node, i.e. similar to SNAT traffic. A fully distributed IPv6 router is not yet supported in Neutron. |
| VPNaaS | Yes | VPNaaS supports IPv6. But this feature is not extensively tested. |
| FWaaS | Yes | |
| BGP Dynamic Routing Support for IPv6 Prefixes | Yes | BGP Dynamic Routing supports peering via IPv6 and advertising IPv6 prefixes. |
| VxLAN Tunnels with IPv6 endpoints. | Yes | Neutron ML2/OVS supports configuring local_ip with IPv6 address so that VxLAN tunnels are established with IPv6 addresses. This feature requires OVS 2.6 or higher version. |
| IPv6 First-Hop Security, IPv6 ND spoofing | Yes | |
| IPv6 support in Neutron Layer3 High Availability (keepalived+VRRP). | Yes |
This section provides users with IPv6 gap analysis regarding feature requirement with Open Daylight Oxygen Official Release. The following table lists the use cases / feature requirements of VIM-agnostic IPv6 functionality, including infrastructure layer and VNF (VM) layer, and its gap analysis with Open Daylight Oxygen Official Release.
Open Daylight Oxygen Status
In Open Daylight Oxygen official release, the legacy Old Netvirt identified by feature
odl-ovsdb-openstack is deprecated and no longer supported. The New Netvirt
identified by feature odl-netvirt-openstack is used.
Two new features are supported in Open Daylight Oxygen official release:
| Use Case / Requirement | Supported in ODL Oxygen | Notes |
|---|---|---|
| REST API support for IPv6 subnet creation in ODL | Yes | Yes, it is possible to create IPv6 subnets in ODL using Neutron REST API. For a network which has both IPv4 and IPv6 subnets, ODL mechanism driver will send the port information which includes IPv4/v6 addresses to ODL Neutron northbound API. When port information is queried, it displays IPv4 and IPv6 addresses. |
IPv6 Router support in ODL:
|
Yes | |
IPv6 Router support in ODL:
|
Yes | |
IPv6 Router support in ODL:
|
NO | This feature is targeted for Flourine Release. In ODL Oxygen Release, RFE “IPv6 Inter-DC L3 North-South Connectivity Using L3VPN Provider Network Types” Spec [1] is merged. But the code patch has not been merged yet. On the other hand, “IPv6 Cluster Support” is available in Oxygen Release [2]. Basically, existing IPv6 features were enhanced to work in a three node ODL Clustered Setup. |
IPAM: Support for IPv6 Address assignment modes.
|
Yes | ODL IPv6 Router supports all the IPv6 Address assignment modes along with Neutron DHCP Agent. |
| When using ODL for L2 forwarding/tunneling, it is compatible with IPv6. | Yes | |
| Full support for IPv6 matching (i.e. IPv6, ICMPv6, TCP, UDP) in security groups. Ability to control and manage all IPv6 security group capabilities via Neutron/Nova API (REST and CLI) as well as via Horizon | Yes | |
| Shared Networks support | Yes | |
| IPv6 external L2 VLAN directly attached to a VM. | Yes | Targeted for Flourine Release |
| ODL on an IPv6 only Infrastructure. | Yes | Deploying OpenStack with ODL on an IPv6 only infrastructure where the API endpoints are all IPv6 addresses. |
| VxLAN Tunnels with IPv6 Endpoints | Yes | |
| IPv6 L3VPN Dual Stack with Single router | Yes | Refer to “Dual Stack VM support in OpenDaylight” Spec [3]. |
| IPv6 Inter Data Center using L3VPNs | Yes | Refer to “IPv6 Inter-DC L3 North-South connectivity using L3VPN provider network types” Spec [4]. |
| [1] | https://docs.opendaylight.org/projects/netvirt/en/stable-fluorine/specs/oxygen/ipv6-interdc-l3vpn.html |
| [2] | http://git.opendaylight.org/gerrit/#/c/66707/ |
| [3] | (1, 2) https://docs.opendaylight.org/projects/netvirt/en/stable-oxygen/specs/l3vpn-dual-stack-vms.html |
| [4] | (1, 2) https://docs.opendaylight.org/projects/netvirt/en/stable-oxygen/specs/ipv6-interdc-l3vpn.html |
This document is the summary of how to use IPv6 with Docker.
The defualt Docker container uses 172.17.0.0/24 subnet with 172.17.0.1 as gateway. So IPv6 network needs to be enabled and configured before we can use it with IPv6 traffic.
We will describe how to use IPv6 in Docker in the following 5 sections:
Step 3.1.1: Download Docker (CE) on your system from “this link” [1].
For Ubuntu 16.04 Xenial x86_64, please refer to “Docker CE for Ubuntu” [2].
Step 3.1.2: Refer to “this link” [3] to install Docker CE on Xenial.
Step 3.1.3: Once you installed the docker, you can verify the standalone default bridge nework as follows:
$ docker network ls
NETWORK ID NAME DRIVER SCOPE
b9e92f9a8390 bridge bridge local
74160ae686b9 host host local
898fbb0a0c83 my_bridge bridge local
57ac095fdaab none null local
Note that:
# This will have docker0 default bridge details showing
# ipv4 172.17.0.1/16 and
# ipv6 fe80::42:4dff:fe2f:baa6/64 entries
$ ip addr show
11: docker0: <BROADCAST,MULTICAST,UP,LOWER_UP> mtu 1500 qdisc noqueue state UP group default
link/ether 02:42:4d:2f:ba:a6 brd ff:ff:ff:ff:ff:ff
inet 172.17.0.1/16 scope global docker0
valid_lft forever preferred_lft forever
inet6 fe80::42:4dff:fe2f:baa6/64 scope link
valid_lft forever preferred_lft forever
Thus we see here a simple defult ipv4 networking for docker. Inspect and verify that IPv6 address is not listed here showing its enabled but not used by default docker0 bridge.
You can create user defined bridge network using command like my_bridge
below with other than default, e.g. 172.18.0.0/24 here. Note that --ipv6
is not specified yet
$ sudo docker network create \
--driver=bridge \
--subnet=172.18.0.0/24 \
--gaeway= 172.18.0.1 \
my_bridge
$ docker network inspect bridge
[
{
"Name": "bridge",
"Id": "b9e92f9a839048aab887081876fc214f78e8ce566ef5777303c3ef2cd63ba712",
"Created": "2017-10-30T23:32:15.676301893-07:00",
"Scope": "local",
"Driver": "bridge",
"EnableIPv6": false,
"IPAM": {
"Driver": "default",
"Options": null,
"Config": [
{
"Subnet": "172.17.0.0/16",
"Gateway": "172.17.0.1"
}
]
},
"Internal": false,
"Attachable": false,
"Ingress": false,
"ConfigFrom": {
"Network": ""
},
"ConfigOnly": false,
"Containers": {
"ea76bd4694a8073b195dd712dd0b070e80a90e97b6e2024b03b711839f4a3546": {
"Name": "registry",
"EndpointID": "b04dc6c5d18e3bf4e4201aa8ad2f6ad54a9e2ea48174604029576e136b99c49d",
"MacAddress": "02:42:ac:11:00:02",
"IPv4Address": "172.17.0.2/16",
"IPv6Address": ""
}
},
"Options": {
"com.docker.network.bridge.default_bridge": "true",
"com.docker.network.bridge.enable_icc": "true",
"com.docker.network.bridge.enable_ip_masquerade": "true",
"com.docker.network.bridge.host_binding_ipv4": "0.0.0.0",
"com.docker.network.bridge.name": "docker0",
"com.docker.network.driver.mtu": "1500"
},
"Labels": {}
}
]
$ sudo docker network inspect my_bridge
[
{
"Name": "my_bridge",
"Id": "898fbb0a0c83acc0593897f5af23b1fe680d38b804b0d5a4818a4117ac36498a",
"Created": "2017-07-16T17:59:55.388151772-07:00",
"Scope": "local",
"Driver": "bridge",
"EnableIPv6": false,
"IPAM": {
"Driver": "default",
"Options": {},
"Config": [
{
"Subnet": "172.18.0.0/16",
"Gateway": "172.18.0.1"
}
]
},
"Internal": false,
"Attachable": false,
"Ingress": false,
"ConfigFrom": {
"Network": ""
},
"ConfigOnly": false,
"Containers": {},
"Options": {},
"Labels": {}
}
]
You can note that IPv6 is not enabled here yet as seen through network inspect. Since we have only IPv4 installed with Docker, we will move to enable IPv6 for Docker in the next step.
Verifyig IPv6 with Docker involves the following steps:
Step 3.2.1: Enable ipv6 support for Docker
In the simplest term, the first step is to enable IPv6 on Docker on Linux hosts. Please refer to “this link” [5]:
/etc/docker/daemon.jsonipv6 key to true.{{{ "ipv6": true }}}
Save the file.
Step 3.2.1.1: Set up IPv6 addressing for Docker in daemon.json
If you need IPv6 support for Docker containers, you need to enable the option
on the Docker daemon daemon.json and reload its configuration, before
creating any IPv6 networks or assigning containers IPv6 addresses.
When you create your network, you can specify the --ipv6 flag to enable
IPv6. You can’t selectively disable IPv6 support on the default bridge network.
Step 3.2.1.2: Enable forwarding from Docker containers to the outside world
By default, traffic from containers connected to the default bridge network is not forwarded to the outside world. To enable forwarding, you need to change two settings. These are not Docker commands and they affect the Docker host’s kernel.
$ sysctl net.ipv4.conf.all.forwarding=1
$ sudo iptables -P FORWARD ACCEPT
These settings do not persist across a reboot, so you may need to add them to a start-up script.
Step 3.2.1.3: Use the default bridge network
The default bridge network is considered a legacy detail of Docker and is not recommended for production use. Configuring it is a manual operation, and it has technical shortcomings.
Step 3.2.1.4: Connect a container to the default bridge network
If you do not specify a network using the --network flag, and you do
specify a network driver, your container is connected to the default bridge
network by default. Containers connected to the default bridge network can
communicate, but only by IP address, unless they are linked using the legacy
--link flag.
Step 3.2.1.5: Configure the default bridge network
To configure the default bridge network, you specify options in daemon.json.
Here is an example of daemon.json with several options specified. Only
specify the settings you need to customize.
{
"bip": "192.168.1.5/24",
"fixed-cidr": "192.168.1.5/25",
"fixed-cidr-v6": "2001:db8::/64",
"mtu": 1500,
"default-gateway": "10.20.1.1",
"default-gateway-v6": "2001:db8:abcd::89",
"dns": ["10.20.1.2","10.20.1.3"]
}
Restart Docker for the changes to take effect.
Step 3.2.1.6: Use IPv6 with the default bridge network
If you configure Docker for IPv6 support (see Step 2.1.1), the default bridge network is also configured for IPv6 automatically. Unlike user-defined bridges, you cannot selectively disable IPv6 on the default bridge.
Step 3.2.1.7: Reload the Docker configuration file
$ systemctl reload docker
Step 3.2.1.8: You can now create networks with the --ipv6 flag and assign
containers IPv6 addresses.
Step 3.2.1.9: Verify your host and docker networks
$ docker ps
CONTAINER ID IMAGE COMMAND CREATED STATUS PORTS NAMES
ea76bd4694a8 registry:2 "/entrypoint.sh /e..." x months ago Up y months 0.0.0.0:4000->5000/tcp registry
$ docker network ls
NETWORK ID NAME DRIVER SCOPE
b9e92f9a8390 bridge bridge local
74160ae686b9 host host local
898fbb0a0c83 my_bridge bridge local
57ac095fdaab none null local
Step 3.2.1.10: Edit /etc/docker/daemon.json and set the ipv6 key to true.
{
"ipv6": true
}
Save the file.
Step 3.2.1.11: Reload the Docker configuration file.
$ sudo systemctl reload docker
Step 3.2.1.12: You can now create networks with the --ipv6 flag and
assign containers IPv6 addresses using the --ip6 flag.
$ sudo docker network create --ipv6 --driver bridge alpine-net--fixed-cidr-v6 2001:db8:1/64
# "docker network create" requires exactly 1 argument(s).
# See "docker network create --help"
Earlier, user was allowed to create a network, or start the daemon, without
specifying an IPv6 --subnet, or --fixed-cidr-v6 respectively, even when
using the default builtin IPAM driver, which does not support auto allocation
of IPv6 pools. In another word, it was an incorrect configurations, which had
no effect on IPv6 stuff. It was a no-op.
A fix cleared that so that Docker will now correctly consult with the IPAM driver to acquire an IPv6 subnet for the bridge network, when user did not supply one.
If the IPAM driver in use is not able to provide one, network creation would fail (in this case the default bridge network).
So what you see now is the expected behavior. You need to remove the --ipv6
flag when you start the daemon, unless you pass a --fixed-cidr-v6 pool. We
should probably clarify this somewhere.
The above was found on following Docker.
$ docker info
Containers: 27
Running: 1
Paused: 0
Stopped: 26
Images: 852
Server Version: 17.06.1-ce-rc1
Storage Driver: aufs
Root Dir: /var/lib/docker/aufs
Backing Filesystem: extfs
Dirs: 637
Dirperm1 Supported: false
Logging Driver: json-file
Cgroup Driver: cgroupfs
Plugins:
Volume: local
Network: bridge host macvlan null overlay
Log: awslogs fluentd gcplogs gelf journald json-file logentries splunk syslog
Swarm: inactive
Runtimes: runc
Default Runtime: runc
Init Binary: docker-init
containerd version: 6e23458c129b551d5c9871e5174f6b1b7f6d1170
runc version: 810190ceaa507aa2727d7ae6f4790c76ec150bd2
init version: 949e6fa
Security Options:
apparmor
seccomp
Profile: default
Kernel Version: 3.13.0-88-generic
Operating System: Ubuntu 16.04.2 LTS
OSType: linux
Architecture: x86_64
CPUs: 4
Total Memory: 11.67GiB
Name: aatiksh
ID: HS5N:T7SK:73MD:NZGR:RJ2G:R76T:NJBR:U5EJ:KP5N:Q3VO:6M2O:62CJ
Docker Root Dir: /var/lib/docker
Debug Mode (client): false
Debug Mode (server): false
Registry: https://index.docker.io/v1/
Experimental: false
Insecure Registries:
127.0.0.0/8
Live Restore Enabled: false
Step 3.2.2: Check the network drivers
Among the 4 supported drivers, we will be using “User-Defined Bridge Network” [6].
Step 3.3.1: Creating IPv6 user-defined subnet.
Let’s create a Docker with IPv6 subnet:
$ sudo docker network create \
--ipv6 \
--driver=bridge \
--subnet=172.18.0.0/16 \
--subnet=fcdd:1::/48 \
--gaeway= 172.20.0.1 \
my_ipv6_bridge
# Error response from daemon:
cannot create network 8957e7881762bbb4b66c3e2102d72b1dc791de37f2cafbaff42bdbf891b54cc3 (br-8957e7881762): conflicts with network
no matching subnet for range 2002:ac14:0000::/48
# try changing to ip-addess-range instead of subnet for ipv6.
# networks have overlapping IPv4
NETWORK ID NAME DRIVER SCOPE
b9e92f9a8390 bridge bridge local
74160ae686b9 host host local
898fbb0a0c83 my_bridge bridge local
57ac095fdaab none null local
no matching subnet for gateway 172.20.01
# So finally making both as subnet and gateway as 172.20.0.1 works
$ sudo docker network create \
--ipv6 \
--driver=bridge \
--subnet=172.20.0.0/16 \
--subnet=2002:ac14:0000::/48 \
--gateway=172.20.0.1 \
my_ipv6_bridge
898fbb0a0c83acc0593897f5af23b1fe680d38b804b0d5a4818a4117ac36498a (br-898fbb0a0c83):
Since lxdbridge used the ip range on the system there was a conflict. This brings us to question how do we assign IPv6 and IPv6 address for our solutions.
For best practices, please refer to “Best Practice Document” [7].
Use IPv6 Calcualtor at “this link” [8].
To avoid overlaping IP’s, let’s use the .20 in our design:
$ sudo docker network create \
--ipv6 \
--driver=bridge \
--subnet=172.20.0.0/24 \
--subnet=2002:ac14:0000::/48
--gateway=172.20.0.1
my_ipv6_bridge
# created ...
052da268171ce47685fcdb68951d6d14e70b9099012bac410c663eb2532a0c87
$ docker network ls
NETWORK ID NAME DRIVER SCOPE
b9e92f9a8390 bridge bridge local
74160ae686b9 host host local
898fbb0a0c83 my_bridge bridge local
052da268171c my_ipv6_bridge bridge local
57ac095fdaab none null local
# Note the first 16 digits is used here as network id from what we got
# whaen we created it.
$ docker network inspect my_ipv6_bridge
[
{
"Name": "my_ipv6_bridge",
"Id": "052da268171ce47685fcdb68951d6d14e70b9099012bac410c663eb2532a0c87",
"Created": "2018-03-16T07:20:17.714212288-07:00",
"Scope": "local",
"Driver": "bridge",
"EnableIPv6": true,
"IPAM": {
"Driver": "default",
"Options": {},
"Config": [
{
"Subnet": "172.20.0.0/16",
"Gateway": "172.20.0.1"
},
{
"Subnet": "2002:ac14:0000::/48"
}
]
},
"Internal": false,
"Attachable": false,
"Ingress": false,
"ConfigFrom": {
"Network": ""
},
"ConfigOnly": false,
"Containers": {},
"Options": {},
"Labels": {}
}
]
Note that:
Testing the solution and topology:
$ sudo docker run hello-world
Hello from Docker!
This message shows that your installation appears to be working correctly.
To generate this message, Docker took the following steps:
To try something more ambitious, you can run an Ubuntu container with:
$ docker run -it ubuntu bash
root@62b88b030f5a:/# ls
bin dev home lib64 mnt proc run srv tmp var
boot etc lib media opt root sbin sys usr
On terminal it appears that the docker is functioning normally.
Let’s now push to see if we can use the my_ipv6_bridge network.
Please refer to “User-Defined Bridge Network” [9].
When you create a new container, you can specify one or more --network
flags. This example connects a Nginx container to the my-net network. It
also publishes port 80 in the container to port 8080 on the Docker host, so
external clients can access that port. Any other container connected to the
my-net network has access to all ports on the my-nginx container, and vice
versa.
$ docker create --name my-nginx \
--network my-net \
--publish 8080:80 \
nginx:latest
To connect a running container to an existing user-defined bridge, use the
docker network connect command. The following command connects an
already-running my-nginx container to an already-existing my_ipv6_bridge
network:
$ docker network connect my_ipv6_bridge my-nginx
Now we have connected the IPv6-enabled network to mynginx conatiner. Let’s
start and verify its IP Address:
$ docker ps
CONTAINER ID IMAGE COMMAND CREATED STATUS PORTS NAMES
df1df6ed3efb alpine "ash" 4 hours ago Up 4 hours alpine1
ea76bd4694a8 registry:2 "/entrypoint.sh /e..." 9 months ago Up 4 months 0.0.0.0:4000->5000/tcp registry
The nginx:latest image is not runnung, so let’s start and log into it.
$ docker images | grep latest
REPOSITORY TAG IMAGE ID CREATED SIZE
nginx latest 73acd1f0cfad 2 days ago 109MB
alpine latest 3fd9065eaf02 2 months ago 4.15MB
swaggerapi/swagger-ui latest e0b4f5dd40f9 4 months ago 23.6MB
ubuntu latest d355ed3537e9 8 months ago 119MB
hello-world latest 1815c82652c0 9 months ago 1.84kB
Now we do find the nginx and let`s run it
$ docker run -i -t nginx:latest /bin/bash
root@bc13944d22e1:/# ls
bin dev home lib64 mnt proc run srv tmp var
boot etc lib media opt root sbin sys usr
root@bc13944d22e1:/#
Open another terminal and check the networks and verify that IPv6 address is listed on the container:
$ docker ps
CONTAINER ID IMAGE COMMAND CREATED STATUS PORTS NAMES
bc13944d22e1 nginx:latest "/bin/bash" About a minute ago Up About a minute 80/tcp loving_hawking
df1df6ed3efb alpine "ash" 4 hours ago Up 4 hours alpine1
ea76bd4694a8 registry:2 "/entrypoint.sh /e..." 9 months ago Up 4 months 0.0.0.0:4000->5000/tcp registry
$ ping6 bc13944d22e1
# On 2nd termoinal
$ docker network ls
NETWORK ID NAME DRIVER SCOPE
b9e92f9a8390 bridge bridge local
74160ae686b9 host host local
898fbb0a0c83 my_bridge bridge local
052da268171c my_ipv6_bridge bridge local
57ac095fdaab none null local
$ ip addr
1: lo: <LOOPBACK,UP,LOWER_UP> mtu 65536 qdisc noqueue state UNKNOWN group default
link/loopback 00:00:00:00:00:00 brd 00:00:00:00:00:00
inet 127.0.0.1/8 scope host lo
valid_lft forever preferred_lft forever
inet6 ::1/128 scope host
valid_lft forever preferred_lft forever
2: eno1: <BROADCAST,MULTICAST,UP,LOWER_UP> mtu 1500 qdisc pfifo_fast state UP group default qlen 1000
link/ether 8c:dc:d4:6e:d5:4b brd ff:ff:ff:ff:ff:ff
inet 10.0.0.80/24 brd 10.0.0.255 scope global dynamic eno1
valid_lft 558367sec preferred_lft 558367sec
inet6 2601:647:4001:739c:b80a:6292:1786:b26/128 scope global dynamic
valid_lft 86398sec preferred_lft 86398sec
inet6 fe80::8edc:d4ff:fe6e:d54b/64 scope link
valid_lft forever preferred_lft forever
11: docker0: <BROADCAST,MULTICAST,UP,LOWER_UP> mtu 1500 qdisc noqueue state UP group default
link/ether 02:42:4d:2f:ba:a6 brd ff:ff:ff:ff:ff:ff
inet 172.17.0.1/16 scope global docker0
valid_lft forever preferred_lft forever
inet6 fe80::42:4dff:fe2f:baa6/64 scope link
valid_lft forever preferred_lft forever
20: br-052da268171c: <BROADCAST,MULTICAST,UP,LOWER_UP> mtu 1500 qdisc noqueue state UP group default
link/ether 02:42:5e:19:55:0d brd ff:ff:ff:ff:ff:ff
inet 172.20.0.1/16 scope global br-052da268171c
valid_lft forever preferred_lft forever
inet6 2002:ac14::1/48 scope global
valid_lft forever preferred_lft forever
inet6 fe80::42:5eff:fe19:550d/64 scope link
valid_lft forever preferred_lft forever
inet6 fe80::1/64 scope link
valid_lft forever preferred_lft forever
Note that on the 20th entry we have the br-052da268171c with IPv6
inet6 2002:ac14::1/48 scope global, which belongs to root@bc13944d22e1.
At this time we have been able to provide a simple Docker with IPv6 solution.
If another route needs to be added to nginx, you need to modify the routes:
# using ip route commands
$ ip r
default via 10.0.0.1 dev eno1 proto static metric 100
default via 10.0.0.1 dev wlan0 proto static metric 600
10.0.0.0/24 dev eno1 proto kernel scope link src 10.0.0.80
10.0.0.0/24 dev wlan0 proto kernel scope link src 10.0.0.38
10.0.0.0/24 dev eno1 proto kernel scope link src 10.0.0.80 metric 100
10.0.0.0/24 dev wlan0 proto kernel scope link src 10.0.0.38 metric 600
10.0.8.0/24 dev lxdbr0 proto kernel scope link src 10.0.8.1
169.254.0.0/16 dev lxdbr0 scope link metric 1000
172.17.0.0/16 dev docker0 proto kernel scope link src 172.17.0.1
172.18.0.0/16 dev br-898fbb0a0c83 proto kernel scope link src 172.18.0.1
172.20.0.0/16 dev br-052da268171c proto kernel scope link src 172.20.0.1
192.168.99.0/24 dev vboxnet1 proto kernel scope link src 192.168.99.1
If the routes are correctly updated you should be able to see nginx web
page on link http://172.20.0.0.1
We now have completed the exercise.
To disconnect a running container from a user-defined bridge, use the
docker network disconnect command. The following command disconnects the
my-nginx container from the my-net network.
$ docker network disconnect my_ipv6_bridge my-nginx
The IPv6 Docker we used is for demo purpose only. For real production we need to follow one of the IPv6 solutions we have come across.
“This link” [10] discusses the details of the use of nftables which
is nextgen iptables, and tries to build production worthy Docker for IPv6
usage.
| [1] | https://www.docker.com/community-edition#/download |
| [2] | https://store.docker.com/editions/community/docker-ce-server-ubuntu |
| [3] | https://docs.docker.com/install/linux/docker-ce/ubuntu/#install-docker-ce-1 |
| [4] | https://docs.docker.com/network/network-tutorial-host/#other-networking-tutorials |
| [5] | https://docs.docker.com/config/daemon/ipv6/ |
| [6] | https://docs.docker.com/network/ |
| [7] | (1, 2) https://networkengineering.stackexchange.com/questions/119/ipv6-address-space-layout-best-practices |
| [8] | http://www.gestioip.net/cgi-bin/subnet_calculator.cgi |
| [9] | https://docs.docker.com/network/bridge/#use-ipv6-with-the-default-bridge-network |
| [10] | https://stephank.nl/p/2017-06-05-ipv6-on-production-docker.html |
ICMP is a control protocol that is considered to be an integral part of IP, although it is architecturally layered upon IP, i.e., it uses IP to carry its data end-to-end just as a transport protocol like TCP or UDP does. ICMP provides error reporting, congestion reporting, and first-hop gateway redirection.
To communicate on its directly-connected network, a host must implement the communication protocol used to interface to that network. We call this a link layer or media-access layer protocol.
IPv4 uses ARP for link and MAC address discovery. In contrast IPv6 uses ICMPv6 though Neighbor Discovery Protocol (NDP). NDP defines five ICMPv6 packet types for the purpose of router solicitation, router advertisement, neighbor solicitation, neighbor advertisement, and network redirects. Refer RFC 122 & 3122.
Contrasting with ARP, NDP includes Neighbor Unreachability Detection (NUD), thus, improving robustness of packet delivery in the presence of failing routers or links, or mobile nodes. As long as hosts were using single network interface, the isolation between local network and remote network was simple. With requirements of multihoming for hosts with multiple interfaces and multiple destination packet transfers, the complications of maintaining all routing to remote gateways has disappeared.
To add container network to local network and IPv6 link local networks and virtual or logical routing on hosts, the complexity is now exponential. In order to maintain simplicity of end hosts (physical, virtual or containers), just maintaining sessions and remote gateways (routers), and maintaining routes independent of session state is still desirable for scaling internet connected end hosts.
For more details, please refer to [1].
IPv6-only containers will need to fully depend on NDP proxying.
If your Docker host is the only part of an IPv6 subnet but does not have an IPv6 subnet assigned, you can use NDP Proxying to connect your containers to the internet via IPv6.
If the host with IPv6 address 2001:db8::c001 is part of the subnet
2001:db8::/64, and your IaaS provider allows you to configure the IPv6
addresses 2001:db8::c000 to 2001:db8::c00f, your network configuration may
look like the following:
$ ip -6 addr show
1: lo: <LOOPBACK,UP,LOWER_UP> mtu 65536
inet6 ::1/128 scope host
valid_lft forever preferred_lft forever
2: eth0: <BROADCAST,MULTICAST,UP,LOWER_UP> mtu 1500 qlen 1000
inet6 2001:db8::c001/64 scope global
valid_lft forever preferred_lft forever
inet6 fe80::601:3fff:fea1:9c01/64 scope link
valid_lft forever preferred_lft forever
To split up the configurable address range into two subnets
2001:db8::c000/125 and 2001:db8::c008/125, use the following daemon.json
settings.
{
"ipv6": true,
"fixed-cidr-v6": "2001:db8::c008/125"
}
The first subnet will be used by non-Docker processes on the host, and the second will be used by Docker.
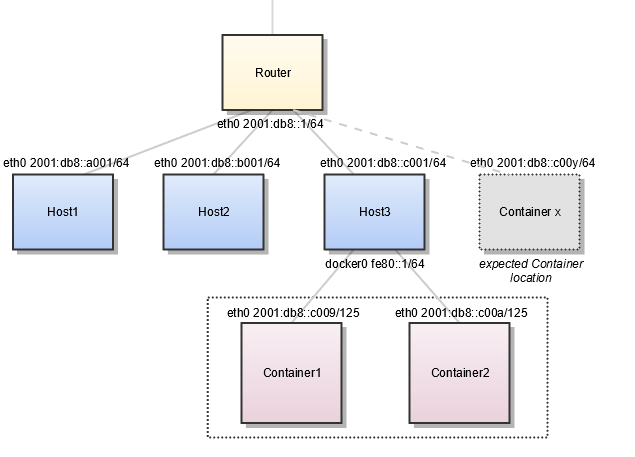
Figure: Using NDP Proxying
For more details, please refer to [2].
Using external switches or routers allows you to enable IPv6 communication between containers on different hosts. We have two physical hosts: Host1 & Host2, and we will study here two scenarios: one with Switch and the other one with router on the top of hierarchy, connecting those 2 hosts. Both hosts host a pair of containers in a cluster. The contents are borrowed from article [1] below, which can be used on any Linux distro (CentOS, Ubuntu, OpenSUSE etc) with latest kernel. A sample testing is pointed in the blog article [2] as a variation using ESXi & older Ubuntu 14.04.
Using routable IPv6 addresses allows you to realize communication between containers on different hosts. Let’s have a look at a simple Docker IPv6 cluster example:
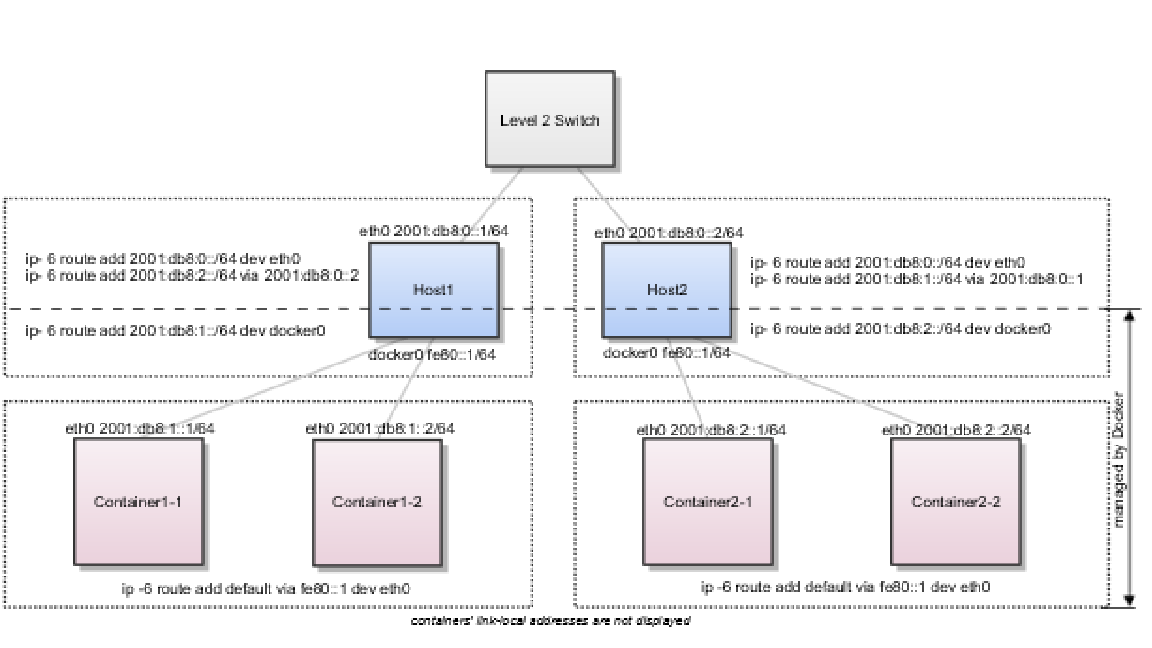
Figure 1: An Docker IPv6 Cluster Example
The Docker hosts are in the 2001:db8:0::/64 subnet. Host1 is configured to
provide addresses from the 2001:db8:1::/64 subnet to its containers. It has
three routes configured:
2001:db8:0::/64 via eth02001:db8:1::/64 via docker02001:db8:2::/64 via Host2 with IP 2001:db8:0::2Host1 also acts as a router on OSI layer 3. When one of the network clients
tries to contact a target that is specified in Host1’s routing table, Host1
will forward the traffic accordingly. It acts as a router for all networks it
knows: 2001:db8::/64, 2001:db8:1::/64, and 2001:db8:2::/64.
On Host2, we have nearly the same configuration. Host2’s containers will get
IPv6 addresses from 2001:db8:2::/64. Host2 has three routes configured:
2001:db8:0::/64 via eth02001:db8:2::/64 via docker02001:db8:1::/64 via Host1 with IP 2001:db8:0::1The difference to Host1 is that the network 2001:db8:2::/64 is directly
attached to Host2 via its docker0 interface, whereas Host2 reaches
2001:db8:1::/64 via Host1’s IPv6 address 2001:db8:0::1.
This way every container can contact every other container. The containers Container1-* share the same subnet and contact each other directly. The traffic between Container1-* and Container2-* will be routed via Host1 and Host2 because those containers do not share the same subnet.
In a switched environment every host must know all routes to every subnet. You always must update the hosts’ routing tables once you add or remove a host to the cluster.
Every configuration in the diagram that is shown below the dashed line across hosts is handled by Dockeri, such as the docker0 bridge IP address configuration, the route to the Docker subnet on the host, the container IP addresses and the routes on the containers. The configuration above the line across hosts is up to the user and can be adapted to the individual environment.
In a routed network environment, you replace the layer 2 switch with a layer 3 router. Now the hosts just must know their default gateway (the router) and the route to their own containers (managed by Docker). The router holds all routing information about the Docker subnets. When you add or remove a host to this environment, you just must update the routing table in the router instead of on every host.
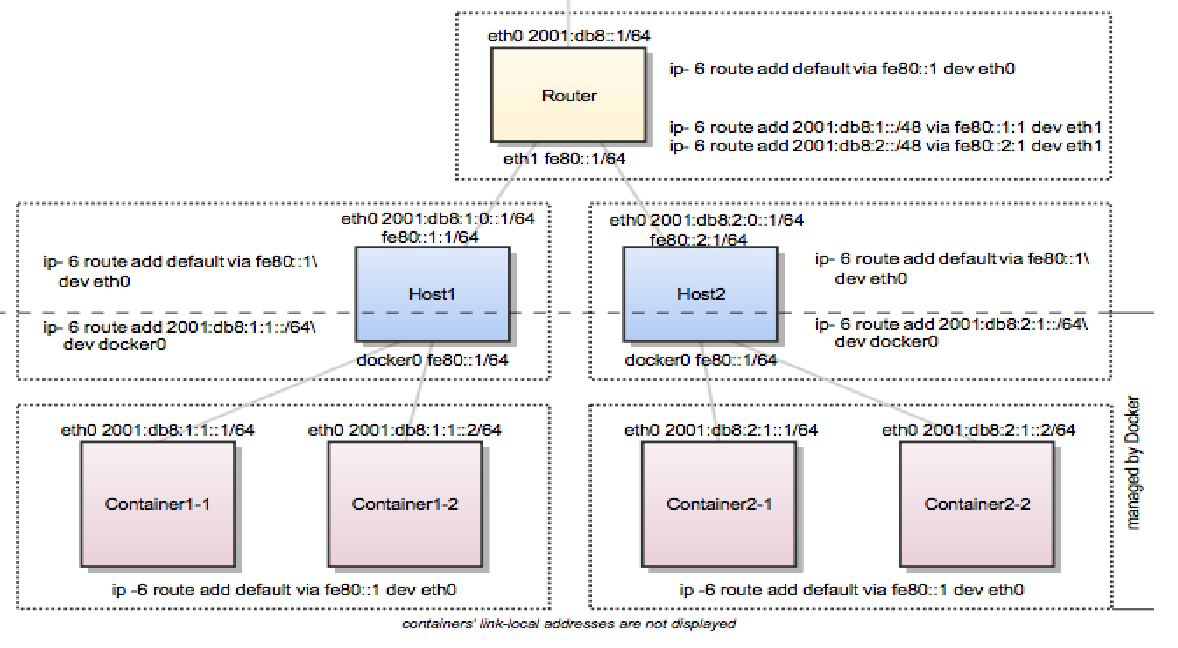
Figure 2: A Routed Network Environment
In this scenario, containers of the same host can communicate directly with each other. The traffic between containers on different hosts will be routed via their hosts and the router. For example, packet from Container1-1 to Container2-1 will be routed through Host1, Router, and Host2 until it arrives at Container2-1.
To keep the IPv6 addresses short in this example a /48 network is assigned
to every host. The hosts use a /64 subnet of this for its own services and
one for Docker. When adding a third host, you would add a route for the subnet
2001:db8:3::/48 in the router and configure Docker on Host3 with
--fixed-cidr-v6=2001:db8:3:1::/64.
Remember the subnet for Docker containers should at least have a size of
/80. This way an IPv6 address can end with the container’s MAC address and
you prevent NDP neighbor cache invalidation issues in the Docker layer. So if
you have a /64 for your whole environment, use /76 subnets for the
hosts and /80 for the containers. This way you can use 4096 hosts with 16
/80 subnets each.
Every configuration in the diagram that is visualized below the dashed line across hosts is handled by Docker, such as the docker0 bridge IP address configuration, the route to the Docker subnet on the host, the container IP addresses and the routes on the containers. The configuration above the line across hosts is up to the user and can be adapted to the individual environment.
Initially Docker was not created with IPv6 in mind. It was added later. As a result, there are still several unresolved issues as to how IPv6 should be used in a containerized world.
Currently, you can let Docker give each container an IPv6 address from your (public) pool, but this has disadvantages (Refer to [1]):
IPv6 for Docker can (depending on your setup) be pretty much unusable and completely inconsistent with the way how IPv4 works. Docker images are mostly designed with IPv4 NAT in mind. NAT provides a layer of security allowing only published ports through. Letting container link to user-defined networks provide inter-container communication. This does not go hand in hand with the way Docker IPv6 works, requiring image maintainers to rethink/adapt their images with IPv6 in mind.
So why not try resolve above issues by managing ip6tables to setup IPv6 NAT
for your containers, like how it is done by the Docker daemon for IPv4. This
requires a locally reserved address like we do for private IP in IPv4. These
are called in IPv6 as local unicast Ipv6 address. Let’s first understand IPv6
addressing scheme.
We note that there are 3 types of IPv6 addresses, and all use last or least significant 64 bits as Interface ID derived by splitting 48-bit MAC address into 24 bits + 24 bits and insert an FE00 hexadecimal number in between those two and inverting the most significant bit to create an equivalent 64-bit MAC called EUI-64 bit. Refer to [2] for details.
1. Global Unicast Address
This is equivalent to IPv4’s public address with always 001 as Most Significant bits of Global Routing Prefix. Subnets are 16 opposed to 8 bits in IPv4.
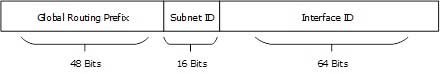
2. Link-Local Address
Link-local addresses are used for communication among IPv6 hosts on a link (broadcast segment) only. These addresses are not routable. This address always starts with FE80. These are used for generating IPv6 addresses and 48 bits following FE80 are always set to 0. Interface ID is usual EUI-64 generated from MAC address on the NIC.

3. Unique-Local Address
This type of IPv6 address is globally unique & used only in site local communication. The second half of this address contain Interface ID and the first half is divided among Prefix, Local Bit, Global ID and Subnet ID.
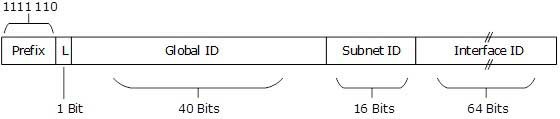
Prefix is always set to 1111 110. L bit, is set to 1 if the address is locally assigned. So far, the meaning of L bit to 0 is not defined. Therefore, Unique Local IPv6 address always starts with ‘FD’.
IPv6 addresses of all types are assigned to interfaces, not nodes (hosts). An IPv6 unicast address refers to a single interface. Since each interface belongs to a single node (host), any of that node’s interfaces’ unicast addresses may be used as an identifier for the node(host). For IPv6 NAT we prefer site scope to be within site scope using unique local address, so that they remain private within the organization.
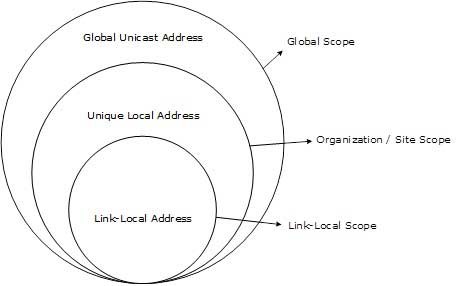
Figure 1: Scope of IPv6 Unicast Addresses
Based on the IPv6 scope now question arises as what is needed to be mapped to what? Is it IPv6 to IPv4 or IPv6 to IPv6 with post? Thus, we land up with are we talking NAT64 with dual stack or just NAT66. Is it a standard that is agreed upon in IETF RFCs? Dwelling into questions bring us back to should we complicate life with another docker-ipv6nat?
The conclusion is simple: it is not worth it and it is highly recommended that you go through the blog listed below [3].
As IPv6 Project team in OPNFV, we recommend that IPv6 NAT is not worth the effort and should be discouraged. As part of our conclusion, we recommend that please do not use IPv6 NAT for containers for any NFV use cases.
This document will explain how to install the Fraser release of OPNFV with JOID including installing JOID, configuring JOID for your environment, and deploying OPNFV with different SDN solutions in HA, or non-HA mode.
JOID as Juju OPNFV Infrastructure Deployer allows you to deploy different combinations of OpenStack release and SDN solution in HA or non-HA mode. For OpenStack, JOID currently supports Ocata and Pike. For SDN, it supports Openvswitch, OpenContrail, OpenDayLight, and ONOS. In addition to HA or non-HA mode, it also supports deploying from the latest development tree.
JOID heavily utilizes the technology developed in Juju and MAAS.
Juju is a state-of-the-art, open source modelling tool for operating software in the cloud. Juju allows you to deploy, configure, manage, maintain, and scale cloud applications quickly and efficiently on public clouds, as well as on physical servers, OpenStack, and containers. You can use Juju from the command line or through its beautiful GUI. (source: Juju Docs)
MAAS is Metal As A Service. It lets you treat physical servers like virtual machines (instances) in the cloud. Rather than having to manage each server individually, MAAS turns your bare metal into an elastic cloud-like resource. Machines can be quickly provisioned and then destroyed again as easily as you can with instances in a public cloud. ... In particular, it is designed to work especially well with Juju, the service and model management service. It’s a perfect arrangement: MAAS manages the machines and Juju manages the services running on those machines. (source: MAAS Docs)
The MAAS server is installed and configured on Jumphost with Ubuntu 16.04 LTS server with access to the Internet. Another VM is created to be managed by MAAS as a bootstrap node for Juju. The rest of the resources, bare metal or virtual, will be registered and provisioned in MAAS. And finally the MAAS environment details are passed to Juju for use.
Minimum 2 Networks:
JOID supports multiple isolated networks for data as well as storage based on your network requirement for OpenStack.
No DHCP server should be up and configured. Configure gateways only on eth0 and eth1 networks to access the network outside your lab.
The Jumphost requirements are outlined below:
Besides Jumphost, a minimum of 5 physical servers for bare metal environment.
NOTE: Above configuration is minimum. For better performance and usage of the OpenStack, please consider higher specs for all nodes.
Make sure all servers are connected to top of rack switch and configured accordingly.
Before proceeding, make sure that your hardware infrastructure satisfies the Setup Requirements.
Make sure you have at least two networks configured:
You may configure other networks, e.g. for data or storage, based on your network options for Openstack.
Install Ubuntu 16.04 (Xenial) LTS server on Jumphost (one of the physical nodes).
Tip
Use ubuntu as username as password, as this matches the MAAS
credentials installed later.
During the OS installation, install the OpenSSH server package to allow SSH connections to the Jumphost.
If the data size of the image is too big or slow (e.g. when mounted through a slow virtual console), you can also use the Ubuntu mini ISO. Install packages: standard system utilities, basic Ubuntu server, OpenSSH server, Virtual Machine host.
If you have issues with blank console after booting, see
this SO answer and set
nomodeset, (removing quiet splash can also be useful to see log
during booting) either through console in recovery mode or via SSH (if
installed).
Install git and bridge-utils packages
sudo apt install git bridge-utils
Configure bridges for each network to be used.
Example /etc/network/interfaces file:
source /etc/network/interfaces.d/*
# The loopback network interface (set by Ubuntu)
auto lo
iface lo inet loopback
# Admin network interface
iface eth0 inet manual
auto brAdmin
iface brAdmin inet static
bridge_ports eth0
address 10.5.1.1
netmask 255.255.255.0
# Ext. network for floating IPs
iface eth1 inet manual
auto brExt
iface brExt inet static
bridge_ports eth1
address 10.5.15.1
netmask 255.255.255.0
Note
If you choose to use the separate network for management, public, data and storage, then you need to create bridge for each interface. In case of VLAN tags, use the appropriate network on Jumphost depending on the VLAN ID on the interface.
Note
Both of the networks need to have Internet connectivity. If only one
of your interfaces has Internet access, you can setup IP forwarding.
For an example how to accomplish that, see the script in Nokia pod 1
deployment (labconfig/nokia/pod1/setup_ip_forwarding.sh).
All configuration for the JOID deployment is specified in a labconfig.yaml
file. Here you describe all your physical nodes, their roles in OpenStack,
their network interfaces, IPMI parameters etc. It’s also where you configure
your OPNFV deployment and MAAS networks/spaces.
You can find example configuration files from already existing nodes in the
repository.
First of all, download JOID to your Jumphost. We recommend doing this in your home directory.
git clone https://gerrit.opnfv.org/gerrit/p/joid.git
Tip
You can select the stable version of your choice by specifying the git branch, for example:
git clone -b stable/fraser https://gerrit.opnfv.org/gerrit/p/joid.git
Create a directory in joid/labconfig/<company_name>/<pod_number>/ and
create or copy a labconfig.yaml configuration file to that directory.
For example:
# All JOID actions are done from the joid/ci directory
cd joid/ci
mkdir -p ../labconfig/your_company/pod1
cp ../labconfig/nokia/pod1/labconfig.yaml ../labconfig/your_company/pod1/
Example labconfig.yaml configuration file:
lab:
location: your_company
racks:
- rack: pod1
nodes:
- name: rack-1-m1
architecture: x86_64
roles: [network,control]
nics:
- ifname: eth0
spaces: [admin]
mac: ["12:34:56:78:9a:bc"]
- ifname: eth1
spaces: [floating]
mac: ["12:34:56:78:9a:bd"]
power:
type: ipmi
address: 192.168.10.101
user: admin
pass: admin
- name: rack-1-m2
architecture: x86_64
roles: [compute,control,storage]
nics:
- ifname: eth0
spaces: [admin]
mac: ["23:45:67:89:ab:cd"]
- ifname: eth1
spaces: [floating]
mac: ["23:45:67:89:ab:ce"]
power:
type: ipmi
address: 192.168.10.102
user: admin
pass: admin
- name: rack-1-m3
architecture: x86_64
roles: [compute,control,storage]
nics:
- ifname: eth0
spaces: [admin]
mac: ["34:56:78:9a:bc:de"]
- ifname: eth1
spaces: [floating]
mac: ["34:56:78:9a:bc:df"]
power:
type: ipmi
address: 192.168.10.103
user: admin
pass: admin
- name: rack-1-m4
architecture: x86_64
roles: [compute,storage]
nics:
- ifname: eth0
spaces: [admin]
mac: ["45:67:89:ab:cd:ef"]
- ifname: eth1
spaces: [floating]
mac: ["45:67:89:ab:ce:f0"]
power:
type: ipmi
address: 192.168.10.104
user: admin
pass: admin
- name: rack-1-m5
architecture: x86_64
roles: [compute,storage]
nics:
- ifname: eth0
spaces: [admin]
mac: ["56:78:9a:bc:de:f0"]
- ifname: eth1
spaces: [floating]
mac: ["56:78:9a:bc:df:f1"]
power:
type: ipmi
address: 192.168.10.105
user: admin
pass: admin
floating-ip-range: 10.5.15.6,10.5.15.250,10.5.15.254,10.5.15.0/24
ext-port: "eth1"
dns: 8.8.8.8
opnfv:
release: d
distro: xenial
type: noha
openstack: pike
sdncontroller:
- type: nosdn
storage:
- type: ceph
disk: /dev/sdb
feature: odl_l2
spaces:
- type: admin
bridge: brAdmin
cidr: 10.5.1.0/24
gateway:
vlan:
- type: floating
bridge: brExt
cidr: 10.5.15.0/24
gateway: 10.5.15.1
vlan:
Once you have prepared the configuration file, you may begin with the automatic MAAS deployment.
This section will guide you through the MAAS deployment. This is the first of two JOID deployment steps.
Note
For all the commands in this document, please do not use a root user
account to run but instead use a non-root user account. We recommend using
the ubuntu user as described above.
If you have already enabled maas for your environment and installed it then there is no need to enabled it again or install it. If you have patches from previous MAAS install, then you can apply them here.
Pre-installed MAAS without using the 03-maasdeploy.sh script is not
supported. We strongly suggest to use 03-maasdeploy.sh script to deploy
the MAAS and JuJu environment.
With the labconfig.yaml configuration file ready, you can start the MAAS
deployment. In the joid/ci directory, run the following command:
# in joid/ci directory
./03-maasdeploy.sh custom <absolute path of config>/labconfig.yaml
If you prefer, you can also host your labconfig.yaml file remotely and JOID
will download it from there. Just run
# in joid/ci directory
./03-maasdeploy.sh custom http://<web_site_location>/labconfig.yaml
This step will take approximately 30 minutes to a couple of hours depending on your environment. This script will do the following:
Already during deployment, once MAAS is installed, configured and launched,
you can visit the MAAS Web UI and observe the progress of the deployment.
Simply open the IP of your jumphost in a web browser and navigate to the
/MAAS directory (e.g. http://10.5.1.1/MAAS in our example). You can
login with username ubuntu and password ubuntu. In the Nodes page,
you can see the bootstrap node and the bare metal servers and their status.
Hint
If you need to re-run this step, first undo the performed actions by running
# in joid/ci
./cleanvm.sh
./cleanmaas.sh
# now you can run the ./03-maasdeploy.sh script again
This section will guide you through the Juju an OPNFV deployment. This is the second of two JOID deployment steps.
JOID allows you to deploy different combinations of OpenStack and SDN solutions in HA or no-HA mode. For OpenStack, it supports Pike and Ocata. For SDN, it supports Open vSwitch, OpenContrail, OpenDaylight and ONOS (Open Network Operating System). In addition to HA or no-HA mode, it also supports deploying the latest from the development tree (tip).
To deploy OPNFV on the previously deployed MAAS system, use the deploy.sh
script. For example:
# in joid/ci directory
./deploy.sh -d xenial -m openstack -o pike -s nosdn -f none -t noha -l custom
The above command starts an OPNFV deployment with Ubuntu Xenial (16.04) distro,
OpenStack model, Pike version of OpenStack, Open vSwitch (and no other SDN),
no special features, no-HA OpenStack mode and with custom labconfig. I.e. this
corresponds to the os-nosdn-nofeature-noha OPNFV deployment scenario.
Note
You can see the usage info of the script by running
./deploy.sh --help
Possible script arguments are as follows.
Ubuntu distro to deploy
[-d <trusty|xenial>]
trusty: Ubuntu 16.04.xenial: Ubuntu 17.04.Model to deploy
[-m <openstack|kubernetes>]
JOID introduces two various models to deploy.
openstack: Openstack, which will be used for KVM/LXD
container-based workloads.kubernetes: Kubernetes model will be used for docker-based
workloads.Version of Openstack deployed
[-o <pike|ocata>]
pike: Pike version of OpenStack.ocata: Ocata version of OpenStack.SDN controller
[-s <nosdn|odl|opencontrail|onos|canal>]
nosdn: Open vSwitch only and no other SDN.odl: OpenDayLight Boron version.opencontrail: OpenContrail SDN.onos: ONOS framework as SDN.cana;: canal CNI plugin for kubernetes.Feature to deploy (comma separated list)
[-f <lxd|dvr|sfc|dpdk|ipv6|none>]
none: No special feature will be enabled.ipv6: IPv6 will be enabled for tenant in OpenStack.lxd: With this feature hypervisor will be LXD rather than KVM.dvr: Will enable distributed virtual routing.dpdk: Will enable DPDK feature.sfc: Will enable sfc feature only supported with ONOS deployment.lb: Load balancing in case of Kubernetes will be enabled.ceph: Ceph storage Kubernetes will be enabled.Mode of Openstack deployed
[-t <noha|ha|tip>]
noha: No High Availability.ha: High Availability.tip: The latest from the development tree.Where to deploy
[-l <custom|default|...>]
custom: For bare metal deployment where labconfig.yaml was provided
externally and not part of JOID package.default: For virtual deployment where installation will be done on
KVM created using 03-maasdeploy.sh.Architecture
[-a <amd64|ppc64el|aarch64>]
amd64: Only x86 architecture will be used. Future version will
support arm64 as well.This step may take up to a couple of hours, depending on your configuration, internet connectivity etc. You can check the status of the deployment by running this command in another terminal:
watch juju status --format tabular
Hint
If you need to re-run this step, first undo the performed actions by running
# in joid/ci
./clean.sh
# now you can run the ./deploy.sh script again
Following OPNFV scenarios can be deployed using JOID. Separate yaml bundle will be created to deploy the individual scenario.
| Scenario | Owner | Known Issues |
|---|---|---|
| os-nosdn-nofeature-ha | Joid | |
| os-nosdn-nofeature-noha | Joid | |
| os-odl_l2-nofeature-ha | Joid | Floating ips are not working on this deployment. |
| os-nosdn-lxd-ha | Joid | Yardstick team is working to support. |
| os-nosdn-lxd-noha | Joid | Yardstick team is working to support. |
| os-onos-nofeature-ha | ONOSFW | |
| os-onos-sfc-ha | ONOSFW | |
| k8-nosdn-nofeature-noha | Joid | No support from Functest and Yardstick |
| k8-nosdn-lb-noha | Joid | No support from Functest and Yardstick |
By default debug is enabled in script and error messages will be printed on ssh terminal where you are running the scripts.
Logs are indispensable when it comes time to troubleshoot. If you want to see
all the service unit deployment logs, you can run juju debug-log in another
terminal. The debug-log command shows the consolidated logs of all Juju agents
(machine and unit logs) running in the environment.
To view a single service unit deployment log, use juju ssh to access to the
deployed unit. For example to login into nova-compute unit and look for
/var/log/juju/unit-nova-compute-0.log for more info:
ubuntu@R4N4B1:~$ juju ssh nova-compute/0
Warning: Permanently added '172.16.50.60' (ECDSA) to the list of known hosts.
Warning: Permanently added '3-r4n3b1-compute.maas' (ECDSA) to the list of known hosts.
Welcome to Ubuntu 16.04.1 LTS (GNU/Linux 3.13.0-77-generic x86_64)
* Documentation: https://help.ubuntu.com/
<skipped>
Last login: Tue Feb 2 21:23:56 2016 from bootstrap.maas
ubuntu@3-R4N3B1-compute:~$ sudo -i
root@3-R4N3B1-compute:~# cd /var/log/juju/
root@3-R4N3B1-compute:/var/log/juju# ls
machine-2.log unit-ceilometer-agent-0.log unit-ceph-osd-0.log unit-neutron-contrail-0.log unit-nodes-compute-0.log unit-nova-compute-0.log unit-ntp-0.log
root@3-R4N3B1-compute:/var/log/juju#
Note
By default Juju will add the Ubuntu user keys for authentication into the deployed server and only ssh access will be available.
Once you resolve the error, go back to the jump host to rerun the charm hook with
$ juju resolved --retry <unit>
If you would like to start over, run
juju destroy-environment <environment name> to release the resources, then
you can run deploy.sh again.
To access of any of the nodes or containers, use
juju ssh <service name>/<instance id>
For example:
juju ssh openstack-dashboard/0
juju ssh nova-compute/0
juju ssh neutron-gateway/0
You can see the available nodes and containers by running
juju status
All charm log files are available under /var/log/juju.
If you have questions, you can join the JOID channel #opnfv-joid on
Freenode.
The following are the common issues we have collected from the community:
The right variables are not passed as part of the deployment procedure.
./deploy.sh -o pike -s nosdn -t ha -l custom -f none
If you have not setup MAAS with 03-maasdeploy.sh then the
./clean.sh command could hang, the juju status command may hang
because the correct MAAS API keys are not mentioned in cloud listing for
MAAS.
_Solution_: Please make sure you have an MAAS cloud listed using juju clouds and the correct MAAS API key has been added.
Deployment times out: use the command juju status and make sure all
service containers receive an IP address and they are executing code.
Ensure there is no service in the error state.
In case the cleanup process hangs,run the juju destroy-model command manually.
Direct console access via the OpenStack GUI can be quite helpful if you
need to login to a VM but cannot get to it over the network.
It can be enabled by setting the console-access-protocol in the
nova-cloud-controller to vnc. One option is to directly edit the
juju-deployer bundle and set it there prior to deploying OpenStack.
nova-cloud-controller:
options:
console-access-protocol: vnc
To access the console, just click on the instance in the OpenStack GUI and select the Console tab.
The virtual deployment of JOID is very simple and does not require any special configuration. To deploy a virtual JOID environment follow these few simple steps:
Install a clean Ubuntu 16.04 (Xenial) server on the machine. You can use the tips noted in the first step of the Jumphost installation and configuration for bare metal deployment. However, no specialized configuration is needed, just make sure you have Internet connectivity.
Run the MAAS deployment for virtual deployment without customized labconfig file:
# in joid/ci directory
./03-maasdeploy.sh
Run the Juju/OPNFV deployment with your desired configuration parameters,
but with -l default -i 1 for virtual deployment. For example to deploy
the Kubernetes model:
# in joid/ci directory
./deploy.sh -d xenial -s nosdn -t noha -f none -m kubernetes -l default -i 1
Now you should have a working JOID deployment with three virtual nodes. In case of any issues, refer to the Troubleshoot section.
Once Juju deployment is complete, use juju status to verify that all
deployed units are in the _Ready_ state.
Find the OpenStack dashboard IP address from the juju status output, and
see if you can login via a web browser. The domain, username and password are
admin_domain, admin and openstack.
Optionally, see if you can log in to the Juju GUI. Run juju gui to see the
login details.
If you deploy OpenDaylight, OpenContrail or ONOS, find the IP address of the web UI and login. Please refer to each SDN bundle.yaml for the login username/password.
Note
If the deployment worked correctly, you can get easier access to the web
dashboards with the setupproxy.sh script described in the next section.
MAAS, Juju and OpenStack/Kubernetes all come with their own web-based dashboards. However, they might be on private networks and require SSH tunnelling to see them. To simplify access to them, you can use the following script to configure the Apache server on Jumphost to work as a proxy to Juju and OpenStack/Kubernetes dashboards. Furthermore, this script also creates JOID deployment homepage with links to these dashboards, listing also their access credentials.
Simply run the following command after JOID has been deployed.
# run in joid/ci directory
# for OpenStack model:
./setupproxy.sh openstack
# for Kubernetes model:
./setupproxy.sh kubernetes
You can also use the -v argument for more verbose output with xtrace.
After the script has finished, it will print out the addresses and credentials to the dashboards. You can also find the JOID deployment homepage if you open the Jumphost’s IP address in your web browser.
At the end of the deployment, the admin-openrc with OpenStack login
credentials will be created for you. You can source the file and start
configuring OpenStack via CLI.
. ~/joid_config/admin-openrc
The script openstack.sh under joid/ci can be used to configure the
OpenStack after deployment.
./openstack.sh <nosdn> custom xenial pike
Below commands are used to setup domain in heat.
juju run-action heat/0 domain-setup
Upload cloud images and creates the sample network to test.
joid/juju/get-cloud-images
joid/juju/joid-configure-openstack
The script k8.sh under joid/ci would be used to show the Kubernetes
workload and create sample pods.
./k8.sh
At the end of the deployment, the admin-openrc with OpenStack login
credentials will be created for you. You can source the file and start
configuring OpenStack via CLI.
cat ~/joid_config/admin-openrc
export OS_USERNAME=admin
export OS_PASSWORD=openstack
export OS_TENANT_NAME=admin
export OS_AUTH_URL=http://172.16.50.114:5000/v2.0
export OS_REGION_NAME=RegionOne
We have prepared some scripts to help your configure the OpenStack cloud that you just deployed. In each SDN directory, for example joid/ci/opencontrail, there is a ‘scripts’ folder where you can find the scripts. These scripts are created to help you configure a basic OpenStack Cloud to verify the cloud. For more information on OpenStack Cloud configuration, please refer to the OpenStack Cloud Administrator Guide: http://docs.openstack.org/user-guide-admin/. Similarly, for complete SDN configuration, please refer to the respective SDN administrator guide.
Each SDN solution requires slightly different setup. Please refer to the README
in each SDN folder. Most likely you will need to modify the openstack.sh
and cloud-setup.sh scripts for the floating IP range, private IP network,
and SSH keys. Please go through openstack.sh, glance.sh and
cloud-setup.sh and make changes as you see fit.
Let’s take a look at those for the Open vSwitch and briefly go through each script so you know what you need to change for your own environment.
$ ls ~/joid/juju
configure-juju-on-openstack get-cloud-images joid-configure-openstack
Let’s first look at openstack.sh. First there are 3 functions defined,
configOpenrc(), unitAddress(), and unitMachine().
configOpenrc() {
cat <<-EOF
export SERVICE_ENDPOINT=$4
unset SERVICE_TOKEN
unset SERVICE_ENDPOINT
export OS_USERNAME=$1
export OS_PASSWORD=$2
export OS_TENANT_NAME=$3
export OS_AUTH_URL=$4
export OS_REGION_NAME=$5
EOF
}
unitAddress() {
if [[ "$jujuver" < "2" ]]; then
juju status --format yaml | python -c "import yaml; import sys; print yaml.load(sys.stdin)[\"services\"][\"$1\"][\"units\"][\"$1/$2\"][\"public-address\"]" 2> /dev/null
else
juju status --format yaml | python -c "import yaml; import sys; print yaml.load(sys.stdin)[\"applications\"][\"$1\"][\"units\"][\"$1/$2\"][\"public-address\"]" 2> /dev/null
fi
}
unitMachine() {
if [[ "$jujuver" < "2" ]]; then
juju status --format yaml | python -c "import yaml; import sys; print yaml.load(sys.stdin)[\"services\"][\"$1\"][\"units\"][\"$1/$2\"][\"machine\"]" 2> /dev/null
else
juju status --format yaml | python -c "import yaml; import sys; print yaml.load(sys.stdin)[\"applications\"][\"$1\"][\"units\"][\"$1/$2\"][\"machine\"]" 2> /dev/null
fi
}
The function configOpenrc() creates the OpenStack login credentials, the function unitAddress() finds the IP address of the unit, and the function unitMachine() finds the machine info of the unit.
create_openrc() {
keystoneIp=$(keystoneIp)
if [[ "$jujuver" < "2" ]]; then
adminPasswd=$(juju get keystone | grep admin-password -A 5 | grep value | awk '{print $2}' 2> /dev/null)
else
adminPasswd=$(juju config keystone | grep admin-password -A 5 | grep value | awk '{print $2}' 2> /dev/null)
fi
configOpenrc admin $adminPasswd admin http://$keystoneIp:5000/v2.0 RegionOne > ~/joid_config/admin-openrc
chmod 0600 ~/joid_config/admin-openrc
}
This finds the IP address of the keystone unit 0, feeds in the OpenStack admin credentials to a new file name ‘admin-openrc’ in the ‘~/joid_config/’ folder and change the permission of the file. It’s important to change the credentials here if you use a different password in the deployment Juju charm bundle.yaml.
neutron net-show ext-net > /dev/null 2>&1 || neutron net-create ext-net \
--router:external=True \
--provider:network_type flat \
--provider:physical_network physnet1
neutron subnet-show ext-subnet > /dev/null 2>&1 || neutron subnet-create ext-net \
--name ext-subnet --allocation-pool start=$EXTNET_FIP,end=$EXTNET_LIP \
--disable-dhcp --gateway $EXTNET_GW $EXTNET_NET
This section will create the ext-net and ext-subnet for defining the for floating ips.
openstack congress datasource create nova "nova" \
--config username=$OS_USERNAME \
--config tenant_name=$OS_TENANT_NAME \
--config password=$OS_PASSWORD \
--config auth_url=http://$keystoneIp:5000/v2.0
This section will create the congress datasource for various services. Each service datasource will have entry in the file.
folder=/srv/data/
sudo mkdir $folder || true
if grep -q 'virt-type: lxd' bundles.yaml; then
URLS=" \
http://download.cirros-cloud.net/0.3.4/cirros-0.3.4-x86_64-lxc.tar.gz \
http://cloud-images.ubuntu.com/xenial/current/xenial-server-cloudimg-amd64-root.tar.gz "
else
URLS=" \
http://cloud-images.ubuntu.com/precise/current/precise-server-cloudimg-amd64-disk1.img \
http://cloud-images.ubuntu.com/trusty/current/trusty-server-cloudimg-amd64-disk1.img \
http://cloud-images.ubuntu.com/xenial/current/xenial-server-cloudimg-amd64-disk1.img \
http://mirror.catn.com/pub/catn/images/qcow2/centos6.4-x86_64-gold-master.img \
http://cloud.centos.org/centos/7/images/CentOS-7-x86_64-GenericCloud.qcow2 \
http://download.cirros-cloud.net/0.3.4/cirros-0.3.4-x86_64-disk.img "
fi
for URL in $URLS
do
FILENAME=${URL##*/}
if [ -f $folder/$FILENAME ];
then
echo "$FILENAME already downloaded."
else
wget -O $folder/$FILENAME $URL
fi
done
This section of the file will download the images to jumphost if not found to be used with openstack VIM.
Note
The image downloading and uploading might take too long and time out. In this case, use juju ssh glance/0 to log in to the glance unit 0 and run the script again, or manually run the glance commands.
source ~/joid_config/admin-openrc
First, source the the admin-openrc file.
Upload the images into Glance to be used for creating the VM.
# adjust tiny image
nova flavor-delete m1.tiny
nova flavor-create m1.tiny 1 512 8 1
Adjust the tiny image profile as the default tiny instance is too small for Ubuntu.
# configure security groups
neutron security-group-rule-create --direction ingress --ethertype IPv4 --protocol icmp --remote-ip-prefix 0.0.0.0/0 default
neutron security-group-rule-create --direction ingress --ethertype IPv4 --protocol tcp --port-range-min 22 --port-range-max 22 --remote-ip-prefix 0.0.0.0/0 default
Open up the ICMP and SSH access in the default security group.
# import key pair
keystone tenant-create --name demo --description "Demo Tenant"
keystone user-create --name demo --tenant demo --pass demo --email demo@demo.demo
nova keypair-add --pub-key id_rsa.pub ubuntu-keypair
Create a project called ‘demo’ and create a user called ‘demo’ in this project. Import the key pair.
# configure external network
neutron net-create ext-net --router:external --provider:physical_network external --provider:network_type flat --shared
neutron subnet-create ext-net --name ext-subnet --allocation-pool start=10.5.8.5,end=10.5.8.254 --disable-dhcp --gateway 10.5.8.1 10.5.8.0/24
This section configures an external network ‘ext-net’ with a subnet called ‘ext-subnet’. In this subnet, the IP pool starts at 10.5.8.5 and ends at 10.5.8.254. DHCP is disabled. The gateway is at 10.5.8.1, and the subnet mask is 10.5.8.0/24. These are the public IPs that will be requested and associated to the instance. Please change the network configuration according to your environment.
# create vm network
neutron net-create demo-net
neutron subnet-create --name demo-subnet --gateway 10.20.5.1 demo-net 10.20.5.0/24
This section creates a private network for the instances. Please change accordingly.
neutron router-create demo-router
neutron router-interface-add demo-router demo-subnet
neutron router-gateway-set demo-router ext-net
This section creates a router and connects this router to the two networks we just created.
# create pool of floating ips
i=0
while [ $i -ne 10 ]; do
neutron floatingip-create ext-net
i=$((i + 1))
done
Finally, the script will request 10 floating IPs.
This script can be used to do juju bootstrap on openstack so that Juju can be used as model tool to deploy the services and VNF on top of openstack using the JOID.
By default, running the script ./03-maasdeploy.sh will automatically create the KVM VMs on a single machine and configure everything for you.
if [ ! -e ./labconfig.yaml ]; then
virtinstall=1
labname="default"
cp ../labconfig/default/labconfig.yaml ./
cp ../labconfig/default/deployconfig.yaml ./
Please change joid/ci/labconfig/default/labconfig.yaml accordingly. The MAAS deployment script will do the following: 1. Create bootstrap VM. 2. Install MAAS on the jumphost. 3. Configure MAAS to enlist and commission VM for Juju bootstrap node.
Later, the 03-massdeploy.sh script will create three additional VMs and register them into the MAAS Server:
if [ "$virtinstall" -eq 1 ]; then
sudo virt-install --connect qemu:///system --name $NODE_NAME --ram 8192 --cpu host --vcpus 4 \
--disk size=120,format=qcow2,bus=virtio,io=native,pool=default \
$netw $netw --boot network,hd,menu=off --noautoconsole --vnc --print-xml | tee $NODE_NAME
nodemac=`grep "mac address" $NODE_NAME | head -1 | cut -d '"' -f 2`
sudo virsh -c qemu:///system define --file $NODE_NAME
rm -f $NODE_NAME
maas $PROFILE machines create autodetect_nodegroup='yes' name=$NODE_NAME \
tags='control compute' hostname=$NODE_NAME power_type='virsh' mac_addresses=$nodemac \
power_parameters_power_address='qemu+ssh://'$USER'@'$MAAS_IP'/system' \
architecture='amd64/generic' power_parameters_power_id=$NODE_NAME
nodeid=$(maas $PROFILE machines read | jq -r '.[] | select(.hostname == '\"$NODE_NAME\"').system_id')
maas $PROFILE tag update-nodes control add=$nodeid || true
maas $PROFILE tag update-nodes compute add=$nodeid || true
fi
If your bare metal servers support IPMI, they can be discovered and enlisted automatically by the MAAS server. You need to configure bare metal servers to PXE boot on the network interface where they can reach the MAAS server. With nodes set to boot from a PXE image, they will start, look for a DHCP server, receive the PXE boot details, boot the image, contact the MAAS server and shut down.
During this process, the MAAS server will be passed information about the node, including the architecture, MAC address and other details which will be stored in the database of nodes. You can accept and commission the nodes via the web interface. When the nodes have been accepted the selected series of Ubuntu will be installed.
Juju and MAAS together allow you to assign different roles to servers, so that hardware and software can be configured according to their roles. We have briefly mentioned and used this feature in our example. Please visit Juju Machine Constraints https://jujucharms.com/docs/stable/charms-constraints and MAAS tags https://maas.ubuntu.com/docs/tags.html for more information.
When you have limited access policy in your environment, for example, when only the Jump Host has Internet access, but not the rest of the servers, we provide tools in JOID to support the offline installation.
The following package set is provided to those wishing to experiment with a ‘disconnected from the internet’ setup when deploying JOID utilizing MAAS. These instructions provide basic guidance as to how to accomplish the task, but it should be noted that due to the current reliance of MAAS and DNS, that behavior and success of deployment may vary depending on infrastructure setup. An official guided setup is in the roadmap for the next release:
Get the packages from here: https://launchpad.net/~thomnico/+archive/ubuntu/ubuntu-cloud-mirrors
Note
The mirror is quite large 700GB in size, and does not mirror SDN repo/ppa.
Additionally to make juju use a private repository of charms instead of using an external location are provided via the following link and configuring environments.yaml to use cloudimg-base-url: https://github.com/juju/docs/issues/757
./deploy.sh -o pike -s nosdn -t ha -l custom -f none -d xenial -m openstack
./deploy.sh -l custom -f none -m kubernetes
./deploy.sh -l custom -f lb -m kubernetes
./deploy.sh -s ovn -l custom -f lb -m kubernetes
./deploy.sh -o pike -s ocl -t ha -l custom -f none -d xenial -m openstack
./deploy.sh -s canal -l custom -f lb -m kubernetes
./deploy.sh -l custom -f lb,ceph -m kubernetes
This document will explain how to install OPNFV Fraser with JOID including installing JOID, configuring JOID for your environment, and deploying OPNFV with different SDN solutions in HA, or non-HA mode. Prerequisites include
NOTE: Above configuration is minimum. For better performance and usage of the OpenStack, please consider higher specs for all nodes.
Make sure all servers are connected to top of rack switch and configured accordingly. No DHCP server should be up and configured. Configure gateways only on eth0 and eth1 networks to access the network outside your lab.
JOID as Juju OPNFV Infrastructure Deployer allows you to deploy different combinations of OpenStack release and SDN solution in HA or non-HA mode. For OpenStack, JOID supports Juno and Liberty. For SDN, it supports Openvswitch, OpenContrail, OpenDayLight, and ONOS. In addition to HA or non-HA mode, it also supports deploying from the latest development tree.
JOID heavily utilizes the technology developed in Juju and MAAS. Juju is a state-of-the-art, open source, universal model for service oriented architecture and service oriented deployments. Juju allows you to deploy, configure, manage, maintain, and scale cloud services quickly and efficiently on public clouds, as well as on physical servers, OpenStack, and containers. You can use Juju from the command line or through its powerful GUI. MAAS (Metal-As-A-Service) brings the dynamism of cloud computing to the world of physical provisioning and Ubuntu. Connect, commission and deploy physical servers in record time, re-allocate nodes between services dynamically, and keep them up to date; and in due course, retire them from use. In conjunction with the Juju service orchestration software, MAAS will enable you to get the most out of your physical hardware and dynamically deploy complex services with ease and confidence.
For more info on Juju and MAAS, please visit https://jujucharms.com/ and http://maas.ubuntu.com.
The MAAS server is installed and configured on Jumphost with Ubuntu 16.04 LTS with access to the Internet. Another VM is created to be managed by MAAS as a bootstrap node for Juju. The rest of the resources, bare metal or virtual, will be registered and provisioned in MAAS. And finally the MAAS environment details are passed to Juju for use.
We will use 03-maasdeploy.sh to automate the deployment of MAAS clusters for use as a Juju provider. MAAS-deployer uses a set of configuration files and simple commands to build a MAAS cluster using virtual machines for the region controller and bootstrap hosts and automatically commission nodes as required so that the only remaining step is to deploy services with Juju. For more information about the maas-deployer, please see https://launchpad.net/maas-deployer.
Let’s get started on the Jump Host node.
The MAAS server is going to be installed and configured on a Jumphost machine. We need to create bridges on the Jump Host prior to setting up the MAAS.
NOTE: For all the commands in this document, please do not use a ‘root’ user account to run. Please create a non root user account. We recommend using the ‘ubuntu’ user.
Install the bridge-utils package on the Jump Host and configure a minimum of two bridges, one for the Admin network, the other for the Public network:
$ sudo apt-get install bridge-utils
$ cat /etc/network/interfaces
# This file describes the network interfaces available on your system
# and how to activate them. For more information, see interfaces(5).
# The loopback network interface
auto lo
iface lo inet loopback
iface p1p1 inet manual
auto brAdm
iface brAdm inet static
address 172.16.50.51
netmask 255.255.255.0
bridge_ports p1p1
iface p1p2 inet manual
auto brPublic
iface brPublic inet static
address 10.10.15.1
netmask 255.255.240.0
gateway 10.10.10.1
dns-nameservers 8.8.8.8
bridge_ports p1p2
NOTE: If you choose to use separate networks for management, data, and storage, then you need to create a bridge for each interface. In case of VLAN tags, make the appropriate network on jump-host depend upon VLAN ID on the interface.
NOTE: The Ethernet device names can vary from one installation to another. Please change the Ethernet device names according to your environment.
MAAS has been integrated in the JOID project. To get the JOID code, please run
$ sudo apt-get install git
$ git clone https://gerrit.opnfv.org/gerrit/p/joid.git
To set up your own environment, create a directory in joid/ci/maas/<company name>/<pod number>/ and copy an existing JOID environment over. For example:
$ cd joid/ci
$ mkdir -p ../labconfig/myown/pod
$ cp ../labconfig/cengn/pod2/labconfig.yaml ../labconfig/myown/pod/
Now let’s configure labconfig.yaml file. Please modify the sections in the labconfig as per your lab configuration.
## Change the name of the lab you want maas name will get firmat as per location and rack name ## location: myown racks: - rack: pod
# Define one network and control and two control, compute and storage # and rest for compute and storage for backward compaibility. again # server with more disks should be used for compute and storage only. nodes: # DCOMP4-B, 24cores, 64G, 2disk, 4TBdisk - name: rack-2-m1
architecture: x86_64 roles: [network,control] nics: - ifname: eth0
spaces: [admin] mac: [“0c:c4:7a:3a:c5:b6”]
- ifname: eth1 spaces: [floating] mac: [“0c:c4:7a:3a:c5:b7”]
- power:
- type: ipmi address: <bmc ip> user: <bmc username> pass: <bmc password>
## repeate the above section for number of hardware nodes you have it.
release: d distro: xenial type: noha openstack: pike sdncontroller: - type: nosdn storage: - type: ceph
disk: /dev/sdb
feature: odl_l2
spaces: - type: admin
bridge: brAdm cidr: 10.120.0.0/24 gateway: 10.120.0.254 vlan:
Next we will use the 03-maasdeploy.sh in joid/ci to kick off maas deployment.
Now run the 03-maasdeploy.sh script with the environment you just created
~/joid/ci$ ./03-maasdeploy.sh custom ../labconfig/mylab/pod/labconfig.yaml
This will take approximately 30 minutes to couple of hours depending on your environment. This script will do the following: 1. Create 1 VM (KVM). 2. Install MAAS on the Jumphost. 3. Configure MAAS to enlist and commission a VM for Juju bootstrap node. 4. Configure MAAS to enlist and commission bare metal servers. 5. Download and load 16.04 images to be used by MAAS.
When it’s done, you should be able to view the MAAS webpage (in our example http://172.16.50.2/MAAS) and see 1 bootstrap node and bare metal servers in the ‘Ready’ state on the nodes page.
During the installation process, please carefully review the error messages.
Join IRC channel #opnfv-joid on freenode to ask question. After the issues are resolved, re-running 03-maasdeploy.sh will clean up the VMs created previously. There is no need to manually undo what’s been done.
JOID allows you to deploy different combinations of OpenStack release and SDN solution in HA or non-HA mode. For OpenStack, it supports Juno and Liberty. For SDN, it supports Open vSwitch, OpenContrail, OpenDaylight and ONOS (Open Network Operating System). In addition to HA or non-HA mode, it also supports deploying the latest from the development tree (tip).
The deploy.sh script in the joid/ci directoy will do all the work for you. For example, the following deploys OpenStack Pike with OpenvSwitch in a HA mode.
~/joid/ci$ ./deploy.sh -o pike -s nosdn -t ha -l custom -f none -m openstack
The deploy.sh script in the joid/ci directoy will do all the work for you. For example, the following deploys Kubernetes with Load balancer on the pod.
~/joid/ci$ ./deploy.sh -m openstack -f lb
Take a look at the deploy.sh script. You will find we support the following for each option:
[-s]
nosdn: Open vSwitch.
odl: OpenDayLight Lithium version.
opencontrail: OpenContrail.
onos: ONOS framework as SDN.
[-t]
noha: NO HA mode of OpenStack.
ha: HA mode of OpenStack.
tip: The tip of the development.
[-o]
ocata: OpenStack Ocata version.
pike: OpenStack Pike version.
[-l]
default: For virtual deployment where installation will be done on KVM created using ./03-maasdeploy.sh
custom: Install on bare metal OPNFV defined by labconfig.yaml
[-f]
none: no special feature will be enabled.
ipv6: IPv6 will be enabled for tenant in OpenStack.
dpdk: dpdk will be enabled.
lxd: virt-type will be lxd.
dvr: DVR will be enabled.
lb: Load balancing in case of Kubernetes will be enabled.
[-d]
xenial: distro to be used is Xenial 16.04
[-a]
amd64: Only x86 architecture will be used. Future version will support arm64 as well.
[-m]
openstack: Openstack model will be deployed.
kubernetes: Kubernetes model will be deployed.
The script will call 01-bootstrap.sh to bootstrap the Juju VM node, then it will call 02-deploybundle.sh with the corrosponding parameter values.
./02-deploybundle.sh $opnfvtype $openstack $opnfvlab $opnfvsdn $opnfvfeature $opnfvdistro
Python script GenBundle.py would be used to create bundle.yaml based on the template defined in the config_tpl/juju2/ directory.
By default debug is enabled in the deploy.sh script and error messages will be printed on the SSH terminal where you are running the scripts. It could take an hour to a couple of hours (maximum) to complete.
You can check the status of the deployment by running this command in another terminal:
$ watch juju status --format tabular
This will refresh the juju status output in tabular format every 2 seconds.
Next we will show you what Juju is deploying and to where, and how you can modify based on your own needs.
The magic behind Juju is a collection of software components called charms. They contain all the instructions necessary for deploying and configuring cloud-based services. The charms publicly available in the online Charm Store represent the distilled DevOps knowledge of experts.
A bundle is a set of services with a specific configuration and their corresponding relations that can be deployed together in a single step. Instead of deploying a single service, they can be used to deploy an entire workload, with working relations and configuration. The use of bundles allows for easy repeatability and for sharing of complex, multi-service deployments.
For OPNFV, we have created the charm bundles for each SDN deployment. They are stored in each directory in ~/joid/ci.
We use Juju to deploy a set of charms via a yaml configuration file. You can find the complete format guide for the Juju configuration file here: http://pythonhosted.org/juju-deployer/config.html
In the ‘services’ subsection, here we deploy the ‘Ubuntu Xenial charm from the charm store,’ You can deploy the same charm and name it differently such as the second service ‘nodes-compute.’ The third service we deploy is named ‘ntp’ and is deployed from the NTP Trusty charm from the Charm Store. The NTP charm is a subordinate charm, which is designed for and deployed to the running space of another service unit.
The tag here is related to what we define in the deployment.yaml file for the MAAS. When ‘constraints’ is set, Juju will ask its provider, in this case MAAS, to provide a resource with the tags. In this case, Juju is asking one resource tagged with control and one resource tagged with compute from MAAS. Once the resource information is passed to Juju, Juju will start the installation of the specified version of Ubuntu.
In the next subsection, we define the relations between the services. The beauty of Juju and charms is you can define the relation of two services and all the service units deployed will set up the relations accordingly. This makes scaling out a very easy task. Here we add the relation between NTP and the two bare metal services.
Once the relations are established, Juju considers the deployment complete and moves to the next.
juju deploy bundles.yaml
It will start the deployment , which will retry the section,
nova-cloud-controller:
branch: lp:~openstack-charmers/charms/trusty/nova-cloud-controller/next
num_units: 1
options:
network-manager: Neutron
to:
- "lxc:nodes-api=0"
We define a service name ‘nova-cloud-controller,’ which is deployed from the next branch of the nova-cloud-controller Trusty charm hosted on the Launchpad openstack-charmers team. The number of units to be deployed is 1. We set the network-manager option to ‘Neutron.’ This 1-service unit will be deployed to a LXC container at service ‘nodes-api’ unit 0.
To find out what other options there are for this particular charm, you can go to the code location at http://bazaar.launchpad.net/~openstack-charmers/charms/trusty/nova-cloud-controller/next/files and the options are defined in the config.yaml file.
Once the service unit is deployed, you can see the current configuration by running juju get:
$ juju config nova-cloud-controller
You can change the value with juju config, for example:
$ juju config nova-cloud-controller network-manager=’FlatManager’
Charms encapsulate the operation best practices. The number of options you need to configure should be at the minimum. The Juju Charm Store is a great resource to explore what a charm can offer you. Following the nova-cloud-controller charm example, here is the main page of the recommended charm on the Charm Store: https://jujucharms.com/nova-cloud-controller/trusty/66
If you have any questions regarding Juju, please join the IRC channel #opnfv-joid on freenode for JOID related questions or #juju for general questions.
Once juju-deployer is complete, use juju status –format tabular to verify that all deployed units are in the ready state.
Find the Openstack-dashboard IP address from the juju status output, and see if you can login via a web browser. The username and password is admin/openstack.
Optionally, see if you can log in to the Juju GUI. The Juju GUI is on the Juju bootstrap node, which is the second VM you define in the 03-maasdeploy.sh file. The username and password is admin/admin.
If you deploy OpenDaylight, OpenContrail or ONOS, find the IP address of the web UI and login. Please refer to each SDN bundle.yaml for the login username/password.
Logs are indispensable when it comes time to troubleshoot. If you want to see all the service unit deployment logs, you can run juju debug-log in another terminal. The debug-log command shows the consolidated logs of all Juju agents (machine and unit logs) running in the environment.
To view a single service unit deployment log, use juju ssh to access to the deployed unit. For example to login into nova-compute unit and look for /var/log/juju/unit-nova-compute-0.log for more info.
$ juju ssh nova-compute/0
Example:
ubuntu@R4N4B1:~$ juju ssh nova-compute/0
Warning: Permanently added '172.16.50.60' (ECDSA) to the list of known hosts.
Warning: Permanently added '3-r4n3b1-compute.maas' (ECDSA) to the list of known hosts.
Welcome to Ubuntu 16.04.1 LTS (GNU/Linux 3.13.0-77-generic x86_64)
* Documentation: https://help.ubuntu.com/
<skipped>
Last login: Tue Feb 2 21:23:56 2016 from bootstrap.maas
ubuntu@3-R4N3B1-compute:~$ sudo -i
root@3-R4N3B1-compute:~# cd /var/log/juju/
root@3-R4N3B1-compute:/var/log/juju# ls
machine-2.log unit-ceilometer-agent-0.log unit-ceph-osd-0.log unit-neutron-contrail-0.log unit-nodes-compute-0.log unit-nova-compute-0.log unit-ntp-0.log
root@3-R4N3B1-compute:/var/log/juju#
NOTE: By default Juju will add the Ubuntu user keys for authentication into the deployed server and only ssh access will be available.
Once you resolve the error, go back to the jump host to rerun the charm hook with:
$ juju resolved --retry <unit>
If you would like to start over, run juju destroy-environment <environment name> to release the resources, then you can run deploy.sh again.
The following are the common issues we have collected from the community:
./deploy.sh -o pike -s nosdn -t ha -l custom -f none
If you have setup maas not with 03-maasdeploy.sh then the ./clean.sh command could hang, the juju status command may hang because the correct MAAS API keys are not mentioned in cloud listing for MAAS. Solution: Please make sure you have an MAAS cloud listed using juju clouds. and the correct MAAS API key has been added.
use the command juju status –format=tabular and make sure all service containers receive an IP address and they are executing code. Ensure there is no service in the error state.
In case the cleanup process hangs,run the juju destroy-model command manually.
Direct console access via the OpenStack GUI can be quite helpful if you need to login to a VM but cannot get to it over the network.
It can be enabled by setting the console-access-protocol in the nova-cloud-controller to vnc. One option is to directly edit the juju-deployer bundle and set it there prior to deploying OpenStack.
nova-cloud-controller:
options:
console-access-protocol: vnc
To access the console, just click on the instance in the OpenStack GUI and select the Console tab.
At the end of the deployment, the admin-openrc with OpenStack login credentials will be created for you. You can source the file and start configuring OpenStack via CLI.
~/joid_config$ cat admin-openrc
export OS_USERNAME=admin
export OS_PASSWORD=openstack
export OS_TENANT_NAME=admin
export OS_AUTH_URL=http://172.16.50.114:5000/v2.0
export OS_REGION_NAME=RegionOne
We have prepared some scripts to help your configure the OpenStack cloud that you just deployed. In each SDN directory, for example joid/ci/opencontrail, there is a ‘scripts’ folder where you can find the scripts. These scripts are created to help you configure a basic OpenStack Cloud to verify the cloud. For more information on OpenStack Cloud configuration, please refer to the OpenStack Cloud Administrator Guide: http://docs.openstack.org/user-guide-admin/. Similarly, for complete SDN configuration, please refer to the respective SDN administrator guide.
Each SDN solution requires slightly different setup. Please refer to the README in each SDN folder. Most likely you will need to modify the openstack.sh and cloud-setup.sh scripts for the floating IP range, private IP network, and SSH keys. Please go through openstack.sh, glance.sh and cloud-setup.sh and make changes as you see fit.
Let’s take a look at those for the Open vSwitch and briefly go through each script so you know what you need to change for your own environment.
~/joid/juju$ ls
configure-juju-on-openstack get-cloud-images joid-configure-openstack
Let’s first look at ‘openstack.sh’. First there are 3 functions defined, configOpenrc(), unitAddress(), and unitMachine().
configOpenrc() {
cat <<-EOF
export SERVICE_ENDPOINT=$4
unset SERVICE_TOKEN
unset SERVICE_ENDPOINT
export OS_USERNAME=$1
export OS_PASSWORD=$2
export OS_TENANT_NAME=$3
export OS_AUTH_URL=$4
export OS_REGION_NAME=$5
EOF
}
unitAddress() {
if [[ "$jujuver" < "2" ]]; then
juju status --format yaml | python -c "import yaml; import sys; print yaml.load(sys.stdin)[\"services\"][\"$1\"][\"units\"][\"$1/$2\"][\"public-address\"]" 2> /dev/null
else
juju status --format yaml | python -c "import yaml; import sys; print yaml.load(sys.stdin)[\"applications\"][\"$1\"][\"units\"][\"$1/$2\"][\"public-address\"]" 2> /dev/null
fi
}
unitMachine() {
if [[ "$jujuver" < "2" ]]; then
juju status --format yaml | python -c "import yaml; import sys; print yaml.load(sys.stdin)[\"services\"][\"$1\"][\"units\"][\"$1/$2\"][\"machine\"]" 2> /dev/null
else
juju status --format yaml | python -c "import yaml; import sys; print yaml.load(sys.stdin)[\"applications\"][\"$1\"][\"units\"][\"$1/$2\"][\"machine\"]" 2> /dev/null
fi
}
The function configOpenrc() creates the OpenStack login credentials, the function unitAddress() finds the IP address of the unit, and the function unitMachine() finds the machine info of the unit.
create_openrc() {
keystoneIp=$(keystoneIp)
if [[ "$jujuver" < "2" ]]; then
adminPasswd=$(juju get keystone | grep admin-password -A 7 | grep value | awk '{print $2}' 2> /dev/null)
else
adminPasswd=$(juju config keystone | grep admin-password -A 7 | grep value | awk '{print $2}' 2> /dev/null)
fi
configOpenrc admin $adminPasswd admin http://$keystoneIp:5000/v2.0 RegionOne > ~/joid_config/admin-openrc
chmod 0600 ~/joid_config/admin-openrc
}
This finds the IP address of the keystone unit 0, feeds in the OpenStack admin credentials to a new file name ‘admin-openrc’ in the ‘~/joid_config/’ folder and change the permission of the file. It’s important to change the credentials here if you use a different password in the deployment Juju charm bundle.yaml.
neutron net-show ext-net > /dev/null 2>&1 || neutron net-create ext-net \
--router:external=True \
--provider:network_type flat \
--provider:physical_network physnet1
This section will create the ext-net and ext-subnet for defining the for floating ips.
openstack congress datasource create nova "nova" \
--config username=$OS_USERNAME \
--config tenant_name=$OS_TENANT_NAME \
--config password=$OS_PASSWORD \
--config auth_url=http://$keystoneIp:5000/v2.0
This section will create the congress datasource for various services. Each service datasource will have entry in the file.
folder=/srv/data/
sudo mkdir $folder || true
if grep -q 'virt-type: lxd' bundles.yaml; then
URLS=" \
http://download.cirros-cloud.net/0.3.4/cirros-0.3.4-x86_64-lxc.tar.gz \
http://cloud-images.ubuntu.com/xenial/current/xenial-server-cloudimg-amd64-root.tar.gz "
else
URLS=" \
http://cloud-images.ubuntu.com/precise/current/precise-server-cloudimg-amd64-disk1.img \
http://cloud-images.ubuntu.com/trusty/current/trusty-server-cloudimg-amd64-disk1.img \
http://cloud-images.ubuntu.com/xenial/current/xenial-server-cloudimg-amd64-disk1.img \
http://mirror.catn.com/pub/catn/images/qcow2/centos6.4-x86_64-gold-master.img \
http://cloud.centos.org/centos/7/images/CentOS-7-x86_64-GenericCloud.qcow2 \
http://download.cirros-cloud.net/0.3.4/cirros-0.3.4-x86_64-disk.img "
fi
for URL in $URLS
do
FILENAME=${URL##*/}
if [ -f $folder/$FILENAME ];
then
echo "$FILENAME already downloaded."
else
wget -O $folder/$FILENAME $URL
fi
done
This section of the file will download the images to jumphost if not found to be used with openstack VIM.
NOTE: The image downloading and uploading might take too long and time out. In this case, use juju ssh glance/0 to log in to the glance unit 0 and run the script again, or manually run the glance commands.
source ~/joid_config/admin-openrc
First, source the the admin-openrc file.
upload the images into glane to be used for creating the VM.
# adjust tiny image
nova flavor-delete m1.tiny
nova flavor-create m1.tiny 1 512 8 1
Adjust the tiny image profile as the default tiny instance is too small for Ubuntu.
# configure security groups
neutron security-group-rule-create --direction ingress --ethertype IPv4 --protocol icmp --remote-ip-prefix 0.0.0.0/0 default
neutron security-group-rule-create --direction ingress --ethertype IPv4 --protocol tcp --port-range-min 22 --port-range-max 22 --remote-ip-prefix 0.0.0.0/0 default
Open up the ICMP and SSH access in the default security group.
# import key pair
keystone tenant-create --name demo --description "Demo Tenant"
keystone user-create --name demo --tenant demo --pass demo --email demo@demo.demo
nova keypair-add --pub-key id_rsa.pub ubuntu-keypair
Create a project called ‘demo’ and create a user called ‘demo’ in this project. Import the key pair.
# configure external network
neutron net-create ext-net --router:external --provider:physical_network external --provider:network_type flat --shared
neutron subnet-create ext-net --name ext-subnet --allocation-pool start=10.5.8.5,end=10.5.8.254 --disable-dhcp --gateway 10.5.8.1 10.5.8.0/24
This section configures an external network ‘ext-net’ with a subnet called ‘ext-subnet’. In this subnet, the IP pool starts at 10.5.8.5 and ends at 10.5.8.254. DHCP is disabled. The gateway is at 10.5.8.1, and the subnet mask is 10.5.8.0/24. These are the public IPs that will be requested and associated to the instance. Please change the network configuration according to your environment.
# create vm network
neutron net-create demo-net
neutron subnet-create --name demo-subnet --gateway 10.20.5.1 demo-net 10.20.5.0/24
This section creates a private network for the instances. Please change accordingly.
neutron router-create demo-router
neutron router-interface-add demo-router demo-subnet
neutron router-gateway-set demo-router ext-net
This section creates a router and connects this router to the two networks we just created.
# create pool of floating ips
i=0
while [ $i -ne 10 ]; do
neutron floatingip-create ext-net
i=$((i + 1))
done
Finally, the script will request 10 floating IPs.
This script can be used to do juju bootstrap on openstack so that Juju can be used as model tool to deploy the services and VNF on top of openstack using the JOID.
By default, running the script ./03-maasdeploy.sh will automatically create the KVM VMs on a single machine and configure everything for you.
if [ ! -e ./labconfig.yaml ]; then
virtinstall=1
labname="default"
cp ../labconfig/default/labconfig.yaml ./
cp ../labconfig/default/deployconfig.yaml ./
Please change joid/ci/labconfig/default/labconfig.yaml accordingly. The MAAS deployment script will do the following: 1. Create bootstrap VM. 2. Install MAAS on the jumphost. 3. Configure MAAS to enlist and commission VM for Juju bootstrap node.
Later, the 03-massdeploy.sh script will create three additional VMs and register them into the MAAS Server:
if [ "$virtinstall" -eq 1 ]; then
sudo virt-install --connect qemu:///system --name $NODE_NAME --ram 8192 --cpu host --vcpus 4 \
--disk size=120,format=qcow2,bus=virtio,io=native,pool=default \
$netw $netw --boot network,hd,menu=off --noautoconsole --vnc --print-xml | tee $NODE_NAME
nodemac=`grep "mac address" $NODE_NAME | head -1 | cut -d '"' -f 2`
sudo virsh -c qemu:///system define --file $NODE_NAME
rm -f $NODE_NAME
maas $PROFILE machines create autodetect_nodegroup='yes' name=$NODE_NAME \
tags='control compute' hostname=$NODE_NAME power_type='virsh' mac_addresses=$nodemac \
power_parameters_power_address='qemu+ssh://'$USER'@'$MAAS_IP'/system' \
architecture='amd64/generic' power_parameters_power_id=$NODE_NAME
nodeid=$(maas $PROFILE machines read | jq -r '.[] | select(.hostname == '\"$NODE_NAME\"').system_id')
maas $PROFILE tag update-nodes control add=$nodeid || true
maas $PROFILE tag update-nodes compute add=$nodeid || true
fi
If your bare metal servers support IPMI, they can be discovered and enlisted automatically by the MAAS server. You need to configure bare metal servers to PXE boot on the network interface where they can reach the MAAS server. With nodes set to boot from a PXE image, they will start, look for a DHCP server, receive the PXE boot details, boot the image, contact the MAAS server and shut down.
During this process, the MAAS server will be passed information about the node, including the architecture, MAC address and other details which will be stored in the database of nodes. You can accept and commission the nodes via the web interface. When the nodes have been accepted the selected series of Ubuntu will be installed.
Juju and MAAS together allow you to assign different roles to servers, so that hardware and software can be configured according to their roles. We have briefly mentioned and used this feature in our example. Please visit Juju Machine Constraints https://jujucharms.com/docs/stable/charms-constraints and MAAS tags https://maas.ubuntu.com/docs/tags.html for more information.
When you have limited access policy in your environment, for example, when only the Jump Host has Internet access, but not the rest of the servers, we provide tools in JOID to support the offline installation.
The following package set is provided to those wishing to experiment with a ‘disconnected from the internet’ setup when deploying JOID utilizing MAAS. These instructions provide basic guidance as to how to accomplish the task, but it should be noted that due to the current reliance of MAAS and DNS, that behavior and success of deployment may vary depending on infrastructure setup. An official guided setup is in the roadmap for the next release:
NOTE: The mirror is quite large 700GB in size, and does not mirror SDN repo/ppa.
Since OPNFV board expanded its scope to include NFV MANO last year, several upstream open source projects have been created to develop MANO solutions. Each solution has demonstrated its unique value in specific area. Open-Orchestrator (OPEN-O) project is one of such communities. Opera seeks to develop requirements for OPEN-O MANO support in the OPNFV reference platform, with the plan to eventually integrate OPEN-O in OPNFV as a non-exclusive upstream MANO. The project will definitely benefit not only OPNFV and Open-O, but can be referenced by other MANO integration as well. In particular, this project is basically use case driven. Based on that, it will focus on the requirement of interfaces/data models for integration among various components and OPNFV platform. The requirement is designed to support integration among Open-O as NFVO with Juju as VNFM and OpenStack as VIM.
Currently OPNFV has already included upstream OpenStack as VIM, and Juju and Tacker have been being considered as gVNFM by different OPNFV projects. OPEN-O as NFVO part of MANO will interact with OpenStack and Juju. The key items required for the integration can be described as follows.
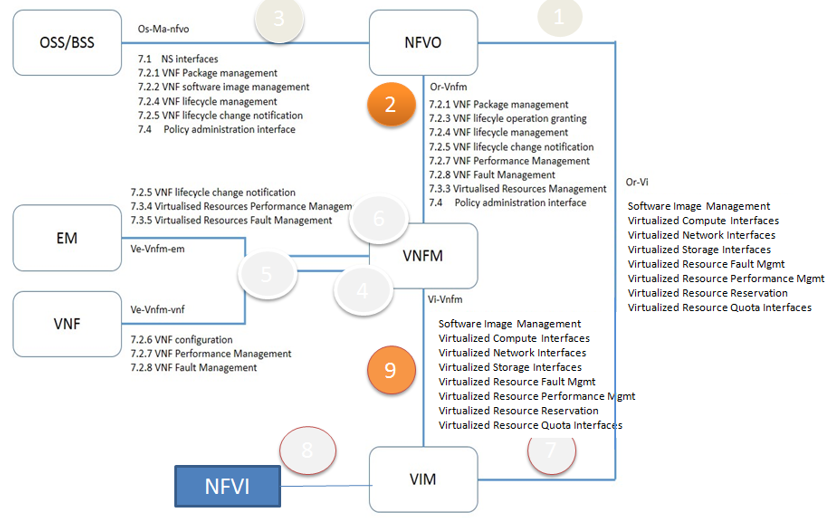
Fig 1. Key Item for Integration
OPEN-O includes various components for OPNFV MANO integration. The initial release of integration will be focusing on NFV-O, Common service and Common TOSCA. Other components of Open-O will be gradually integrated to OPNFV reference platform in later release.
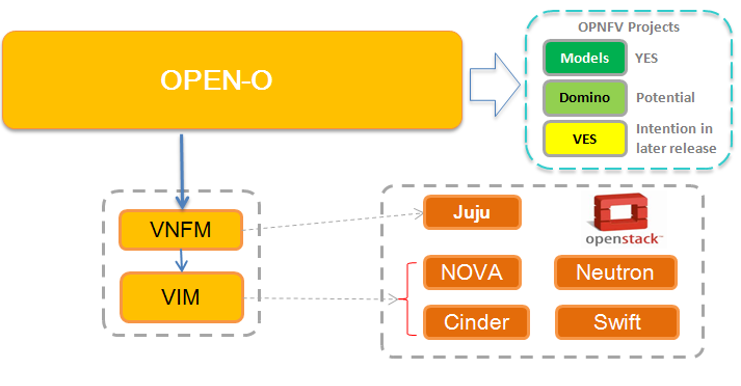
Fig 2. Deploy Overview
based on which test cases will be created and aligned with Open-O first release for OPNFV D release.
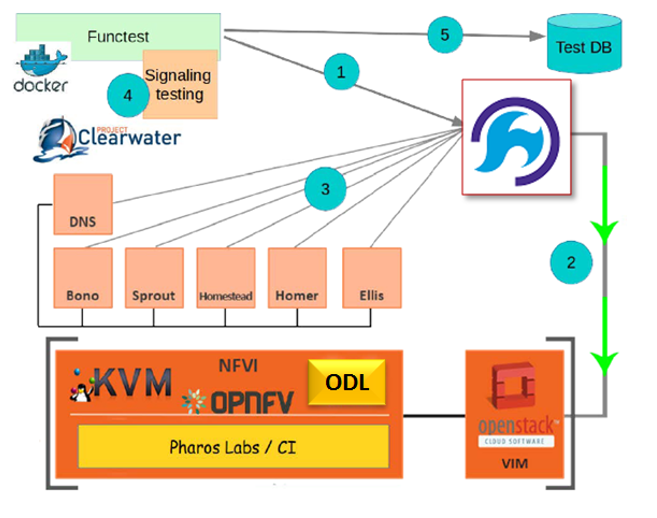
Fig 3. vIMS Deploy
This document describes how to install Open-O in an OpenStack deployed environment using Opera project.
| Date | Ver. | Author | Comment |
| 2017-02-16 | 0.0.1 | Harry Huang (HUAWEI) | First draft |
This document providing guidelines on how to deploy a working Open-O environment using opera project.
The audience of this document is assumed to have good knowledge in OpenStack and Linux.
There are some preconditions before starting the Opera deployment
OpenStack should be deployed before opera deploy.
Retrieve the repository of Opera using the following command:
After opera deployment, Open-O dockers will be launched on local server as orchestrator and juju vm will be launched on OpenStack as VNFM.
Add the admin openrc file of your local openstack into opera/conf directory with the name of admin-openrc.sh.
Set openo_version to specify Open-O version.
Set openo_ip to specify an external ip to access Open-O services. (leave the value unset will use local server’s external ip)
Set ports in openo_docker_net to specify Open-O’s exposed service ports.
Set enable_sdno to specify if use Open-O ‘s sdno services. (set this value false will not launch Open-O sdno dockers and reduce deploy duration)
Set vnf_type to specify the vnf type need to be deployed. (currently only support clearwater deployment, leave this unset will not deploy any vnf)
./opera_launch.sh
Add the admin openrc file of your local openstack into opera/conf directory with the name of admin-openrc.sh.
Set openo_version to specify Open-O version.
Set openo_ip to specify an external ip to access Open-O services. (leave the value unset will use local server’s external ip)
Set ports in openo_docker_net to specify Open-O’s exposed service ports.
Set enable_sdno to specify if use Open-O ‘s sdno services. (set this value false will not launch Open-O sdno dockers and reduce deploy duration)
Set vnf_type to specify the vnf type need to be deployed. (currently only support clearwater deployment, leave this unset will not deploy any vnf)
Define Scenario OS-NOSDN-OPENO-HA and Integrate OPEN-O M Release with OPNFV D Release (with OpenStack Newton)
Integrate vIMS test scripts to FuncTest
Scenario name: os-nosdn-openo-ha
Deployment: OpenStack + Open-O + JuJu
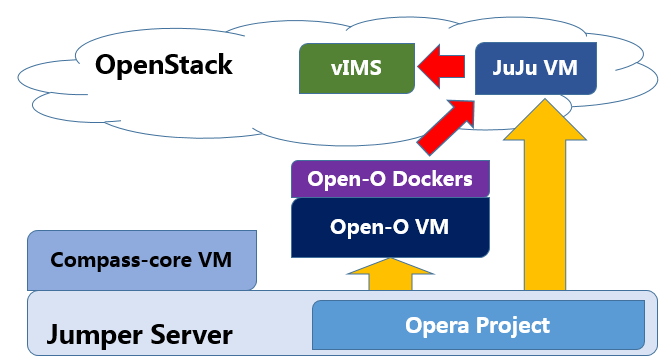
Fig 1. Deploy Overview
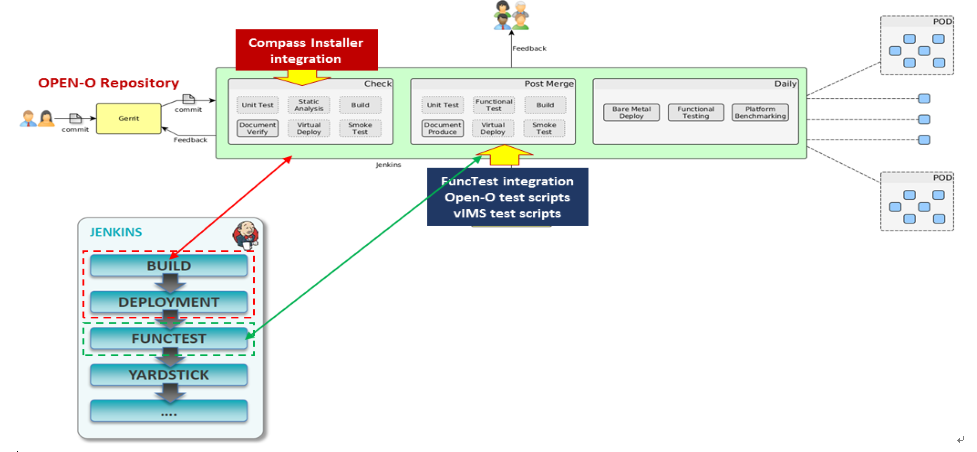
Fig 2. Opera Ci
based on which test cases will be created and aligned with Open-O first release for OPNFV D release.

Fig 3. vIMS Deploy
Compass to deploy scenario of os-nosdn-openo-noha
Automate OPEN-O installation (deployment) process
Automate JuJu installation process
Create vIMS TOSCA blueprint (for vIMS deployment)
Integrate scripts of step 2,3,4,5 with OPNFV CD Jenkins Job
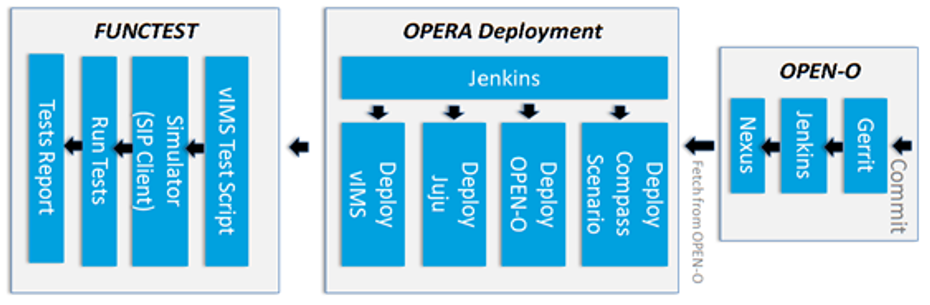
Fig 4. Functest
Please follow the below installation steps to install tosca2heat submodule in parser.
Step 1: Clone the parser project.
git clone https://gerrit.opnfv.org/gerrit/parser
Step 2: Install the heat-translator sub project.
# uninstall pre-installed tosca-parser
pip uninstall -y heat-translator
# change directory to heat-translator
cd parser/tosca2heat/heat-translator
# install requirements
pip install -r requirements.txt
# install heat-translator
python setup.py install
Step 3: Install the tosca-parser sub project.
# uninstall pre-installed tosca-parser
pip uninstall -y tosca-parser
# change directory to tosca-parser
cd parser/tosca2heat/tosca-parser
# install requirements
pip install -r requirements.txt
# install tosca-parser
python setup.py install
Notes: It must uninstall pre-installed tosca-parser and heat-translator before install the two components, and install heat-translator before installing tosca-parser, which is sure to use the OPNFV version of tosca-parser and heat-translator other than openstack’s components.
Parser yang2tosca requires the following to be installed.
Step 1: Clone the parser project.
git clone https://gerrit.opnfv.org/gerrit/parser
Step 2: Clone pyang tool or download the zip file from the following link.
git clone https://github.com/mbj4668/pyang.git
OR
wget https://github.com/mbj4668/pyang/archive/master.zip
Step 3: Change directory to the downloaded directory and run the setup file.
cd pyang
python setup.py
Please follow the below installation link. http://lxml.de/installation.html
Please follow the below installation steps to install parser - POLICY2TOSCA.
Step 1: Clone the parser project.
git clone https://gerrit.opnfv.org/gerrit/parser
Step 2: Install the policy2tosca module.
cd parser/policy2tosca
python setup.py install
In the present release, verigraph requires that the following software is also installed:
Please follow the below installation steps to install verigraph.
Step 1: Clone the parser project.
git clone https://gerrit.opnfv.org/gerrit/parser
Step 2: Go to the verigraph directory.
cd parser/verigraph
Step3: Set up the execution environment, based on your operating system.
VeriGraph deployment on Apache Tomcat (Windows):
C:\Program Files\Java\jdk1.8.XYY);C:\Program Files\Java\apache-tomcat-8.0.30);%CATALINA_HOME%\conf\tomcat-users.xml and under the tomcat-users tag place,
initialize an user with roles “tomcat, manager-gui, manager-script”. An example is the following
content: xml <role rolename="tomcat"/> <role rolename="role1"/> <user username="tomcat"
password="tomcat" roles="tomcat,manager-gui"/> <user username="both" password="tomcat"
roles="tomcat,role1"/> <user username="role1" password="tomcat" roles="role1"/>name="tomcatUsername" value="tomcat" and name="tomcatPassword"
value="tomcat" the values set in ‘tomcat-users’). Set server.location property to the
directory where you installed Apache (e.g. C:\Program Files\Java\apache-tomcat-8.0.30);VeriGraph deployment on Apache Tomcat (Unix):
sudo nano ~/.bashrcexport CATALINA_HOME='/path/to/apache/tomcat/folder'
export JRE_HOME='/path/to/jdk/folder'
export JDK_HOME='/path/to/jdk/folder'exec bash$CATALINA_HOME\conf\tomcat-users.xml and under
the tomcat-users tag place, initialize an user with roles
“tomcat, manager-gui, manager-script”. An example is the following content:
xml <role rolename="tomcat"/> <role rolename="role1"/> <user username="tomcat"
password="tomcat" roles="tomcat,manager-gui"/> <user username="both" password="tomcat"
roles="tomcat,role1"/> <user username="role1" password="tomcat" roles="role1"/>name="tomcatUsername"
value="tomcat" and name="tomcatPassword" value="tomcat" the values set in ‘tomcat-users’).
Set server.location property to the directory where you installed Apache
(e.g. C:\Program Files\Java\apache-tomcat-8.0.30);Step4a: Deploy Verigraph in Tomcat.
ant -f build.xml deployWS
Use the Ant script build.xml to manage Verigraph webservice with the following targets:
Step4b: Deploy Verigraph with gRPC interface.
ant -f build.xml generate-binding
ant -f gRPC-build.xml run-server
Use the Ant script gRPC-build.xml to manage Verigraph with the following targets:
In the present release, apigateway requires that the following software is also installed:
Please follow the below installation steps to install apigateway submodule in parser.
Step 1: Clone the parser project.
git clone https://gerrit.opnfv.org/gerrit/parser
Step 2: Install the apigateway submodule.
# change directory to apigateway
cd parser/apigateway
# install requirements
pip install -r requirements.txt
# install apigateway
python setup.py install
Notes: In release D, apigateway submodule is only initial framework code, and more feature will be provided in the next release.
Parser can be configured with any installer in current OPNFV, it only depends on openstack.
For parser, there is not specific pre-configuration activities.
For parser, there is not hardware configuration needed for any current feature.
For parser, there is not specific configure on openstack.
Add a brief introduction to the methods of validating the installation according to this specific installer or feature.
Describe specific post installation activities performed by the OPNFV deployment pipeline including testing activities and reports. Refer to the relevant testing guides, results, and release notes.
note: this section should be singular and derived from the test projects once we have one test suite to run for all deploy tools. This is not the case yet so each deploy tool will need to provide (hopefully very simillar) documentation of this.
Describe any deploy tool or feature specific scripts, tests or procedures that should be carried out on the deployment post install and configuration in this section.
Describe any component specific validation procedures necessary for your deployment tool in this section.
There only one way to call nfv-heattranslator service: CLI.
Step 1: Change directory to where the tosca yaml files are present, example is below with vRNC definiton.
cd parser/tosca2heat/tosca-parser/toscaparser/extensions/nfv/tests/data/vRNC/Definitions
Step 2: Run the python command heat-translator with the TOSCA yaml file as an input option.
heat-translator --template-file=<input file> --template-type=tosca
--outpurt-file=<output hot file>
Example:
heat-translator --template-file=vRNC.yaml \
--template-type=tosca --output-file=vRNC_hot.yaml
Notes: nfv-heattranslator will call class of ToscaTemplate in nfv-toscaparser firstly to validate and parse input yaml file, then tranlate the file into hot file.
There are three ways to call nfv-toscaparser service, Python Lib ,CLI and REST API.
Using cli, which is used to validate tosca simple based service template. It can be used as:
tosca-parser --template-file=<path to the YAML template> [--nrpv] [--debug]
tosca-parser --template-file=<path to the CSAR zip file> [--nrpv] [--debug]
tosca-parser --template-file=<URL to the template or CSAR> [--nrpv] [--debug]
options:
--nrpv Ignore input parameter validation when parse template.
--debug debug mode for print more details other than raise exceptions when errors happen
Using api, which is used to parse and get the result of service template. it can be used as:
ToscaTemplate(path=None, parsed_params=None, a_file=True, yaml_dict_tpl=None,
sub_mapped_node_template=None,
no_required_paras_valid=False, debug=False )
Using RESTfual API, which are listed as following:
PATH: /v1/template_versions METHOD: GET Decription: Lists all supported tosca template versions.
Response Codes
Success 200 - OK Request was successful.
Error
400 - Bad Request Some content in the request was invalid. 404 - Not Found The requested resource could not be found. 500 - Internal Server Error Something went wrong inside the service. This should not happen usually. If it does happen, it means the server has experienced some serious problems.
Request Parameters
No
Response Parameters
PATH: /v1/validate METHOD: POST Decription: Validate a service template.
Response Codes Success 200 - OK Request was successful.
Error
400 - Bad Request Some content in the request was invalid. 500 - Internal Server Error Something went wrong inside the service. This should not happen usually.
If it does happen, it means the server has experienced some serious problems.
Request Parameters environment (Optional) object A JSON environment for the template service. environment_files (Optional) object An ordered list of names for environment files found in the files dict. files (Optional) object Supplies the contents of files referenced in the template or the environment.
}
... } ignore_errors (Optional) string List of comma separated error codes to ignore. show_nested (Optional) boolean Set to true to include nested template service in the list. template (Optional) object The service template on which to perform the operation.
} This parameter is required only when you omit the template_url parameter. If you specify both parameters, this value overrides thetemplate_url parameter value.
template_url (Optional) string A URI to the location containing the service template on which to perform the operation. See the description of the template parameter for information about the expected template content located at the URI. This parameter is only required when you omit the template parameter. If you specify both parameters, this parameter is ignored.
Request Example {
“template_url”: “/PATH_TO_TOSCA_TEMPLATES/HelloWord_Instance.csar”
}
Response Parameters Description string The description specified in the template. Error Information (Optional) string Error information
PATH: /v1/validate METHOD: POST Decription: Validate a service template. Response Code: same as “Validates a service template” Request Parameters: same as “Validates a service template” Response Parameters Description string The description specified in the template. Input parameters object Input parameter list. Service Template object Service template body Output parameters object Input parameter list. Error Information (Optional) string Error information
Step 1: Change directory to where the scripts are present.
cd parser/yang2tosca
Step 3: Run the python script “parser.py” with the YANG file as an input option.
python parser.py -n "YANG filename"
Example:
python parser.py -n example.yaml
cat "YANG filename_tosca.yaml"
Example:
cat example_tosca.yaml
Step 1: To see a list of commands available.
policy2tosca --help
Step 2: To see help for an individual command, include the command name on the command line
policy2tosca help <service>
Step 3: To inject/remove policy types/policy definitions provide the TOSCA file as input to policy2tosca command line.
policy2tosca <service> [arguments]
Example:
policy2tosca add-definition \
--policy_name rule2 --policy_type tosca.policies.Placement.Geolocation \
--description "test description" \
--properties region:us-north-1,region:us-north-2,min_inst:2 \
--targets VNF2,VNF4 \
--metadata "map of strings" \
--triggers "1,2,3,4" \
--source example.yaml
Step 4: Verify the TOSCA YAMl updated with the injection/removal executed.
cat "<source tosca file>"
Example:
cat example_tosca.yaml
VeriGraph is accessible via both a RESTful API and a gRPC interface.
REST API
Step 1. Change directory to where the service graph examples are present
cd parser/verigraph/examples
Step 2. Use a REST client (e.g., cURL) to send a POST request (whose body is one of the JSON file in the directory)
curl -X POST -d @<file_name>.json http://<server_address>:<server_port>/verify/api/graphs
--header "Content-Type:application/json"
Step 3. Use a REST client to send a GET request to check a reachability-based property between two nodes of the service graph created in the previous step.
curl -X GET http://<server_addr>:<server_port>/verify/api/graphs/<graphID>/
policy?source=<srcNodeID>&destination=<dstNodeID>&type=<propertyType>
where:
reachability, isolation or traversalStep 4. the output is a JSON with the overall result of the verification process and the partial result for each path that connects the source and destination nodes in the service graph.
gRPC API
VeriGraph exposes a gRPC interface that is self-descriptive by its Protobuf file
(parser/verigraph/src/main/proto/verigraph.proto). In the current release, Verigraph
misses a module that receives service graphs in format of JSON and sends the proper
requests to the gRPC server. A testing client has been provided to have an example of how
to create a service graph using the gRPC interface and to trigger the verification step.
cd parser/verigraph
#Client souce code in ``parser/verigraph/src/it/polito/verigraph/grpc/client/Client.java``
ant -f buildVeriGraph_gRPC.xml run-client
The BGPVPN feature enables creation of BGP VPNs on the Neutron API according to the OpenStack BGPVPN blueprint at Neutron Extension for BGP Based VPN.
In a nutshell, the blueprint defines a BGPVPN object and a number of ways how to associate it with the existing Neutron object model, as well as a unique definition of the related semantics. The BGPVPN framework supports a backend driver model with currently available drivers for Bagpipe, OpenContrail, Nuage and OpenDaylight. The OPNFV scenario makes use of the OpenDaylight driver and backend implementation through the ODL NetVirt project.
An overview of the SDNVPN Test is depicted here. A more detailed description of each test case can be found at SDNVPN Testing.
Test Case 1: VPN provides connectivity between subnets, using network association
Name: VPN connecting Neutron networks and subnets Description: VPNs provide connectivity across Neutron networks and subnets if configured accordingly. Test setup procedure:Set up VM1 and VM2 on Node1 and VM3 on Node2, all having ports in the same Neutron Network N1
Moreover all ports have 10.10.10/24 addresses (this subnet is denoted SN1 in the following) Set up VM4 on Node1 and VM5 on Node2, both having ports in Neutron Network N2 Moreover all ports have 10.10.11/24 addresses (this subnet is denoted SN2 in the following)
Test Case 2: Tenant separation
Name: Using VPNs for tenant separation Description: Using VPNs to isolate tenants so that overlapping IP address ranges can be used
Test Case 3: Data Center Gateway integration
Name: Data Center Gateway integration Description: Investigate the peering functionality of BGP protocol, using a Zrpcd/Quagga router and OpenDaylight Controller
Test Case 4: VPN provides connectivity between subnets using router association
Name: VPN connecting Neutron networks and subnets using router association Description: VPNs provide connectivity across Neutron networks and subnets if configured accordingly.
Test Case 7 - Network associate a subnet with a router attached to a VPN and verify floating IP functionality (disabled, because of ODL Bug 6962)
A test for https://bugs.opendaylight.org/show_bug.cgi?id=6962
Test Case 8 - Router associate a subnet with a router attached to a VPN and verify floating IP functionality
Test Case 9 - Check fail mode in OVS br-int interfaces
This testcase checks if the fail mode is always ‘secure’. To accomplish it, a check is performed on all OVS br-int interfaces, for all OpenStack nodes. The testcase is considered as successful if all OVS br-int interfaces have fail_mode=secure
Test Case 10 - Check the communication between a group of VMs
This testcase investigates if communication between a group of VMs is interrupted upon deletion and creation of VMs inside this group.
Testcase 11: test Opendaylight resync and group_add_mod feature mechanisms
This is testcase to test Opendaylight resync and group_add_mod feature functionalities
Testcase 12: Test Resync mechanism between Opendaylight and OVS This is the testcase to validate flows and groups are programmed correctly after resync which is triggered by OVS del-controller/set-controller commands and adding/remove iptables drop rule on OF port 6653.
Testcase 13: Test ECMP (Equal-cost multi-path routing) for the extra route
This testcase validates spraying behavior in OvS when an extra route is configured such that it can be reached from two nova VMs in the same network.
This document provides an overview of how to work with the SDN VPN features in OPNFV.
For the details of using OpenStack BGPVPN API, please refer to the documentation at http://docs.openstack.org/developer/networking-bgpvpn/.
In the example we will show a BGPVPN associated to 2 neutron networks. The BGPVPN will have the import and export routes in the way that it imports its own Route. The outcome will be that vms sitting on these two networks will be able to have a full L3 connectivity.
Some defines:
net_1="Network1"
net_2="Network2"
subnet_net1="10.10.10.0/24"
subnet_net2="10.10.11.0/24"
Create neutron networks and save network IDs:
neutron net-create --provider:network_type=local $net_1
export net_1_id=`echo "$rv" | grep " id " |awk '{print $4}'`
neutron net-create --provider:network_type=local $net_2
export net_2_id=`echo "$rv" | grep " id " |awk '{print $4}'`
Create neutron subnets:
neutron subnet-create $net_1 --disable-dhcp $subnet_net1
neutron subnet-create $net_2 --disable-dhcp $subnet_net2
Create BGPVPN:
neutron bgpvpn-create --route-distinguishers 100:100 --route-targets 100:2530 --name L3_VPN
Start VMs on both networks:
nova boot --flavor 1 --image <some-image> --nic net-id=$net_1_id vm1
nova boot --flavor 1 --image <some-image> --nic net-id=$net_2_id vm2
The VMs should not be able to see each other.
Associate to Neutron networks:
neutron bgpvpn-net-assoc-create L3_VPN --network $net_1_id
neutron bgpvpn-net-assoc-create L3_VPN --network $net_2_id
Now the VMs should be able to ping each other
Check neutron logs on the controller:
tail -f /var/log/neutron/server.log |grep -E "ERROR|TRACE"
Check Opendaylight logs:
tail -f /opt/opendaylight/data/logs/karaf.log
Restart Opendaylight:
service opendaylight restart
The SDNVPN scenarios can be deployed as a bare-metal or a virtual environment on a single host.
Hardware requirements for bare-metal deployments of the OPNFV infrastructure are specified by the Pharos project. The Pharos project provides an OPNFV hardware specification for configuring your hardware at: http://artifacts.opnfv.org/pharos/docs/pharos-spec.html.
To perform a virtual deployment of an OPNFV scenario on a single host, that host has to meet the hardware requirements outlined in the <missing spec>.
When ODL is used as an SDN Controller in an OPNFV virtual deployment, ODL is running on the OpenStack Controller VMs. It is therefore recommended to increase the amount of resources for these VMs.
Our recommendation is to have 2 additional virtual cores and 8GB additional virtual memory on top of the normally recommended configuration.
Together with the commonly used recommendation this sums up to:
6 virtual CPU cores
16 GB virtual memory
The installation section below has more details on how to configure this.
Before starting the installation of the os-odl-bgpnvp scenario some preparation of the machine that will host the Fuel VM must be done.
To be able to run the installation of the basic OPNFV fuel installation the Jumphost (or the host which serves the VMs for the virtual deployment) needs to install the following packages:
sudo apt-get install -y git make curl libvirt-bin libpq-dev qemu-kvm \
qemu-system tightvncserver virt-manager sshpass \
fuseiso genisoimage blackbox xterm python-pip \
python-git python-dev python-oslo.config \
python-pip python-dev libffi-dev libxml2-dev \
libxslt1-dev libffi-dev libxml2-dev libxslt1-dev \
expect curl python-netaddr p7zip-full
sudo pip install GitPython pyyaml netaddr paramiko lxml scp \
python-novaclient python-neutronclient python-glanceclient \
python-keystoneclient debtcollector netifaces enum
To be able to install the scenario os-odl-bgpvpn one can follow the way CI is deploying the scenario. First of all the opnfv-fuel repository needs to be cloned:
git clone ssh://<user>@gerrit.opnfv.org:29418/fuel
To check out a specific version of OPNFV, checkout the appropriate branch:
cd fuel
git checkout stable/gambia
Now download the corresponding OPNFV Fuel ISO into an appropriate folder from the website https://www.opnfv.org/software/downloads/release-archives
Have in mind that the fuel repo version needs to map with the downloaded artifact. Note: it is also possible to build the Fuel image using the tools found in the fuel git repository, but this is out of scope of the procedure described here. Check the Fuel project documentation for more information on building the Fuel ISO.
This section describes the installation of the os-odl-bgpvpn-ha or os-odl-bgpvpn-noha OPNFV reference platform stack across a server cluster or a single host as a virtual deployment.
dea.yaml and dha.yaml need to be copied and changed according to the lab-name/host where you deploy. Copy the full lab config from:
cp <path-to-opnfv-fuel-repo>/deploy/config/labs/devel-pipeline/elx \
<path-to-opnfv-fuel-repo>/deploy/config/labs/devel-pipeline/<your-lab-name>
Add at the bottom of dha.yaml
disks:
fuel: 100G
controller: 100G
compute: 100G
define_vms:
controller:
vcpu:
value: 4
memory:
attribute_equlas:
unit: KiB
value: 16388608
currentMemory:
attribute_equlas:
unit: KiB
value: 16388608
Check if the default settings in dea.yaml are in line with your intentions and make changes as required.
We describe several alternative procedures in the following. First, we describe several methods that are based on the deploy.sh script, which is also used by the OPNFV CI system. It can be found in the Fuel repository.
In addition, the SDNVPN feature can also be configured manually in the Fuel GUI. This is described in the last subsection.
Before starting any of the following procedures, go to
cd <opnfv-fuel-repo>/ci
The following command will deploy the high-availability flavor of SDNVPN scenario os-odl-bgpvpn-ha in a fully automatic way, i.e. all installation steps (Fuel server installation, configuration, node discovery and platform deployment) will take place without any further prompt for user input.
sudo bash ./deploy.sh -b file://<path-to-opnfv-fuel-repo>/config/ -l devel-pipeline -p <your-lab-name> -s os-odl_l2-bgpvpn-ha -i file://<path-to-fuel-iso>
The following command will deploy the SDNVPN scenario in its non-high-availability flavor (note the different scenario name for the -s switch). Otherwise it does the same as described above.
sudo bash ./deploy.sh -b file://<path-to-opnfv-fuel-repo>/config/ -l devel-pipeline -p <your-lab-name> -s os-odl_l2-bgpvpn-noha -i file://<path-to-fuel-iso>
A useful alternative to the full automatic procedure is to only autodeploy the Fuel host and to run host selection, role assignment and SDNVPN scenario configuration manually.
sudo bash ./deploy.sh -b file://<path-to-opnfv-fuel-repo>/config/ -l devel-pipeline -p <your-lab-name> -s os-odl_l2-bgpvpn-ha -i file://<path-to-fuel-iso> -e
With -e option the installer does not launch environment deployment, so a user can do some modification before the scenario is really deployed. Another interesting option is the -f option which deploys the scenario using an existing Fuel host.
The result of this installation is a fuel sever with the right config for BGPVPN. Now the deploy button on fuel dashboard can be used to deploy the environment. It is as well possible to do the configuration manuell.
If a Fuel server is already provided but the fuel plugins for Opendaylight, Openvswitch and BGPVPN are not provided install them by:
cd /opt/opnfv/
fuel plugins --install fuel-plugin-ovs-*.noarch.rpm
fuel plugins --install opendaylight-*.noarch.rpm
fuel plugins --install bgpvpn-*.noarch.rpm
If plugins are installed and you want to update them use –force flag.
Now the feature can be configured. Create a new environment with “Neutron with ML2 plugin” and in there “Neutron with tunneling segmentation”. Go to Networks/Settings/Other and check “Assign public network to all nodes”. This is required for features such as floating IP, which require the Compute hosts to have public interfaces. Then go to settings/other and check “OpenDaylight plugin”, “Use ODL to manage L3 traffic”, “BGPVPN plugin” and set the OpenDaylight package version to “5.2.0-1”. Then you should be able to check “BGPVPN extensions” in OpenDaylight plugin section.
Now the deploy button on fuel dashboard can be used to deploy the environment.
For Virtual Apex deployment a host with Centos 7 is needed. This installation was tested on centos-release-7-2.1511.el7.centos.2.10.x86_64 however any other Centos 7 version should be fine.
Download the Apex repo from opnfv gerrit and checkout stable/gambia:
git clone ssh://<user>@gerrit.opnfv.org:29418/apex
cd apex
git checkout stable/gambia
In apex/contrib you will find simple_deploy.sh:
#!/bin/bash
set -e
apex_home=$( cd "$( dirname "${BASH_SOURCE[0]}" )" && pwd )/../
export CONFIG=$apex_home/build
export LIB=$apex_home/lib
export RESOURCES=$apex_home/.build/
export PYTHONPATH=$PYTHONPATH:$apex_home/lib/python
$apex_home/ci/dev_dep_check.sh || true
$apex_home/ci/clean.sh
pushd $apex_home/build
make clean
make undercloud
make overcloud-opendaylight
popd
pushd $apex_home/ci
echo "All further output will be piped to $PWD/nohup.out"
(nohup ./deploy.sh -v -n $apex_home/config/network/network_settings.yaml -d $apex_home/config/deploy/os-odl_l3-nofeature-noha.yaml &)
tail -f nohup.out
popd
This script will:
Edit the script and change the scenario to os-odl-bgpvpn-noha.yaml. More scenraios can be found: ./apex/config/deploy/
Execute the script in a own screen process:
yum install -y screen
screen -S deploy
bash ./simple_deploy.sh
Determin the mac address of the undercloud vm:
# virsh domiflist undercloud
-> Default network
Interface Type Source Model MAC
-------------------------------------------------------
vnet0 network default virtio 00:6a:9d:24:02:31
vnet1 bridge admin virtio 00:6a:9d:24:02:33
vnet2 bridge external virtio 00:6a:9d:24:02:35
# arp -n |grep 00:6a:9d:24:02:31
192.168.122.34 ether 00:6a:9d:24:02:31 C virbr0
# ssh stack@192.168.122.34
-> no password needed (password stack)
List overcloud deployment info:
# source stackrc
# # Compute and controller:
# nova list
# # Networks
# neutron net-list
List overcloud openstack info:
# source overcloudrc
# nova list
# ...
On the undercloud:
# . stackrc
# nova list
# ssh heat-admin@<ip-of-host>
-> there is no password the user has direct sudo rights.
This document provides an overview of how to work with the SDN VPN features in OPNFV.
For the details of using OpenStack BGPVPN API, please refer to the documentation at http://docs.openstack.org/developer/networking-bgpvpn/.
In the example we will show a BGPVPN associated to 2 neutron networks. The BGPVPN will have the import and export routes in the way that it imports its own Route. The outcome will be that vms sitting on these two networks will be able to have a full L3 connectivity.
Some defines:
net_1="Network1"
net_2="Network2"
subnet_net1="10.10.10.0/24"
subnet_net2="10.10.11.0/24"
Create neutron networks and save network IDs:
neutron net-create --provider:network_type=local $net_1
export net_1_id=`echo "$rv" | grep " id " |awk '{print $4}'`
neutron net-create --provider:network_type=local $net_2
export net_2_id=`echo "$rv" | grep " id " |awk '{print $4}'`
Create neutron subnets:
neutron subnet-create $net_1 --disable-dhcp $subnet_net1
neutron subnet-create $net_2 --disable-dhcp $subnet_net2
Create BGPVPN:
neutron bgpvpn-create --route-distinguishers 100:100 --route-targets 100:2530 --name L3_VPN
Start VMs on both networks:
nova boot --flavor 1 --image <some-image> --nic net-id=$net_1_id vm1
nova boot --flavor 1 --image <some-image> --nic net-id=$net_2_id vm2
The VMs should not be able to see each other.
Associate to Neutron networks:
neutron bgpvpn-net-assoc-create L3_VPN --network $net_1_id
neutron bgpvpn-net-assoc-create L3_VPN --network $net_2_id
Now the VMs should be able to ping each other
Check neutron logs on the controller:
tail -f /var/log/neutron/server.log |grep -E "ERROR|TRACE"
Check Opendaylight logs:
tail -f /opt/opendaylight/data/logs/karaf.log
Restart Opendaylight:
service opendaylight restart
This section defines requirements for the initial OPNFV SFC implementation, including those requirements driving upstream project enhancements.
Deploy a complete SFC solution by integrating OpenDaylight SFC with OpenStack in an OPNFV environment.
These are the Fraser specific requirements:
1 The supported Service Chaining encapsulation will be NSH VXLAN-GPE.
2 The version of OVS used must support NSH.
3 The SF VM life cycle will be managed by the Tacker VNF Manager.
4 The supported classifier is OpenDaylight NetVirt.
6 Tacker will use the networking-sfc API to configure ODL
7 ODL will use flow based tunnels to create the VXLAN-GPE tunnels
These requirements are out of the scope of the Fraser release.
1 Dynamic movement of SFs across multiple Compute nodes.
2 Load Balancing across multiple SFs
3 Support of a different MANO component apart from Tacker
This document provides information on how to install the OpenDaylight SFC features in OPNFV with the use of os_odl-sfc-(no)ha scenario.
For details of the scenarios and their provided capabilities refer to the scenario description documents:
The SFC feature enables creation of Service Fuction Chains - an ordered list of chained network funcions (e.g. firewalls, NAT, QoS)
The SFC feature in OPNFV is implemented by 3 major components:
The SFC scenarios can be deployed on a bare-metal OPNFV cluster or on a virtual environment on a single host.
Hardware requirements for bare-metal deployments of the OPNFV infrastructure are given by the Pharos project. The Pharos project provides an OPNFV hardware specification for configuring your hardware: http://artifacts.opnfv.org/pharos/docs/pharos-spec.html
SFC scenarios can be deployed using APEX installer and xci utility. Check the requirements from those in order to be able to deploy the OPNFV-SFC:
Apex: https://wiki.opnfv.org/display/apex/Apex XCI: https://wiki.opnfv.org/display/INF/XCI+Developer+Sandbox
The OPNFV SFC feature will create service chains, classifiers, and create VMs for Service Functions, allowing for client traffic intended to be sent to a server to first traverse the provisioned service chain.
The Service Chain creation consists of configuring the OpenDaylight SFC feature. This configuration will in-turn configure Service Function Forwarders to route traffic to Service Functions. A Service Function Forwarder in the context of OPNFV SFC is the “br-int” OVS bridge on an Open Stack compute node.
The classifier(s) consist of configuring the OpenDaylight Netvirt feature. Netvirt is a Neutron backend which handles the networking for VMs. Netvirt can also create simple classification rules (5-tuples) to send specific traffic to a pre-configured Service Chain. A common example of a classification rule would be to send all HTTP traffic (tcp port 80) to a pre-configured Service Chain.
Service Function VM creation is performed via a VNF Manager. Currently, OPNFV SFC is integrated with OpenStack Tacker, which in addition to being a VNF Manager, also orchestrates the SFC configuration. In OPNFV SFC Tacker creates service chains, classification rules, creates VMs in OpenStack for Service Functions, and then communicates the relevant configuration to OpenDaylight SFC.
The OPNFV SFC feature can be deployed with either the “os-odl-sfc-ha” or the “os-odl-sfc-noha” scenario. SFC usage for both of these scenarios is the same.
As previously mentioned, Tacker is used as a VNF Manager and SFC Orchestrator. All the configuration necessary to create working service chains and classifiers can be performed using the Tacker command line. Refer to the Tacker walkthrough (step 3 and onwards) for more information.
Refer to the Tacker walkthrough for Tacker usage guidelines and examples.
The OPNFV Service Function Chaining (SFC) project aims to provide the ability to define an ordered list of a network services (e.g. firewalls, NAT, QoS). These services are then “stitched” together in the network to create a service chain. This project provides the infrastructure to install the upstream ODL SFC implementation project in an NFV environment.
Definitions of most terms used here are provided in the IETF SFC Architecture RFC. Additional terms specific to the OPNFV SFC project are defined below.
| Abbreviation | Term |
|---|---|
| NS | Network Service |
| NFVO | Network Function Virtualization Orchestrator |
| NF | Network Function |
| NSH | Network Services Header (Service chaining encapsulation) |
| ODL | OpenDaylight SDN Controller |
| RSP | Rendered Service Path |
| SDN | Software Defined Networking |
| SF | Service Function |
| SFC | Service Function Chain(ing) |
| SFF | Service Function Forwarder |
| SFP | Service Function Path |
| VNF | Virtual Network Function |
| VNFM | Virtual Network Function Manager |
| VNF-FG | Virtual Network Function Forwarding Graph |
| VIM | Virtual Infrastructure Manager |
This section outlines the Danube use cases driving the initial OPNFV SFC implementation.
This use case is targeted on creating simple Service Chains using Firewall Service Functions. As can be seen in the following diagram, 2 service chains are created, each through a different Service Function Firewall. Service Chain 1 will block HTTP, while Service Chain 2 will block SSH.
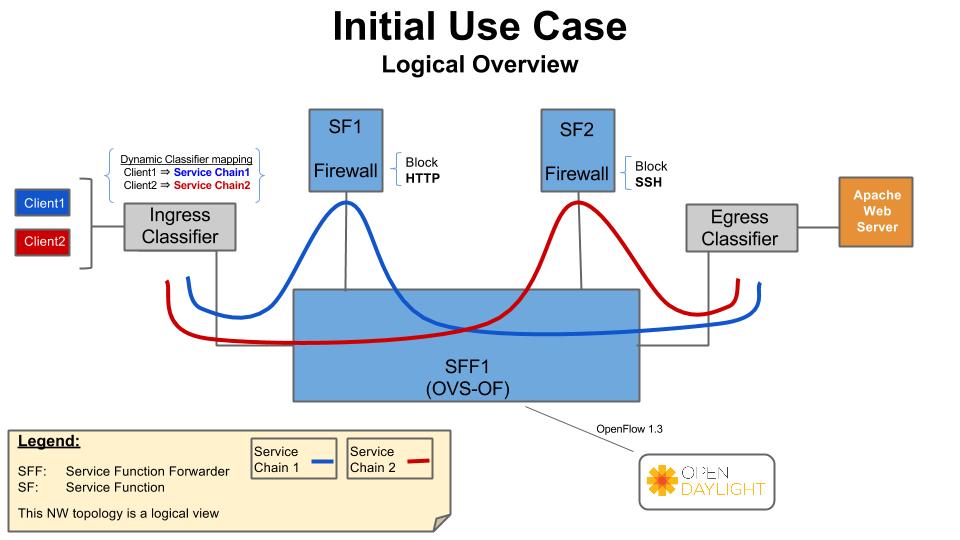
This use case creates two service functions, and a chain that makes the traffic flow through both of them. More information is available in the OPNFV-SFC wiki:
https://wiki.opnfv.org/display/sfc/Functest+SFC-ODL+-+Test+2
This section describes the architectural approach to incorporating the upstream OpenDaylight (ODL) SFC project into the OPNFV Danube platform.
A Service Function (SF) is a Function that provides services to flows traversing a Service Chain. Examples of typical SFs include: Firewall, NAT, QoS, and DPI. In the context of OPNFV, the SF will be a Virtual Network Function. The SFs receive data packets from a Service Function Forwarder.
The Service Function Forwarder (SFF) is the core element used in Service Chaining. It is an OpenFlow switch that, in the context of OPNFV, is hosted in an OVS bridge. In OPNFV there will be one SFF per Compute Node that will be hosted in the “br-int” OpenStack OVS bridge.
The responsibility of the SFF is to steer incoming packets to the corresponding Service Function, or to the SFF in the next compute node. The flows in the SFF are programmed by the OpenDaylight SFC SDN Controller.
Service Chains are defined in the OpenDaylight SFC Controller using the following constructs:
Service Chaining Encapsulation encapsulates traffic sent through the Service Chaining domain to facilitate easier steering of packets through Service Chains. If no Service Chaining Encapsulation is used, then packets much be classified at every hop of the chain, which would be slow and would not scale well.
In ODL SFC, Network Service Headers (NSH) is used for Service Chaining encapsulation. NSH is an IETF specification that uses 2 main header fields to facilitate packet steering, namely:
NSH also has metadata fields, but that’s beyond the scope of this architecture.
In ODL SFC, NSH packets are encapsulated in VXLAN-GPE.
A classifier is the entry point into Service Chaining. The role of the classifier is to map incoming traffic to Service Chains. In ODL SFC, this mapping is performed by matching the packets and encapsulating the packets in a VXLAN-GPE NSH tunnel.
The packet matching is specific to the classifier implementation, but can be as simple as an ACL, or can be more complex by using PCRF information or DPI.
In OPNFV SFC, a VNF Manager is needed to spin-up VMs for Service Functions. It has been decided to use the OpenStack Tacker VNF Mgr to spin-up and manage the life cycle of the SFs. Tacker will receive the ODL SFC configuration, manage the SF VMs, and forward the configuration to ODL SFC. The following sequence diagram details the interactions with the VNF Mgr:
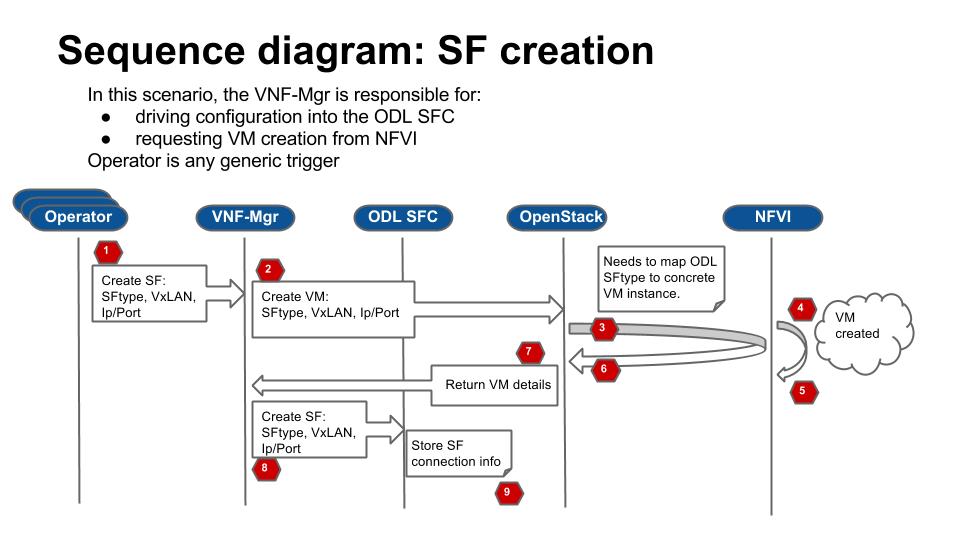
The following image details the Network Topology used in OPNFV Danube SFC:
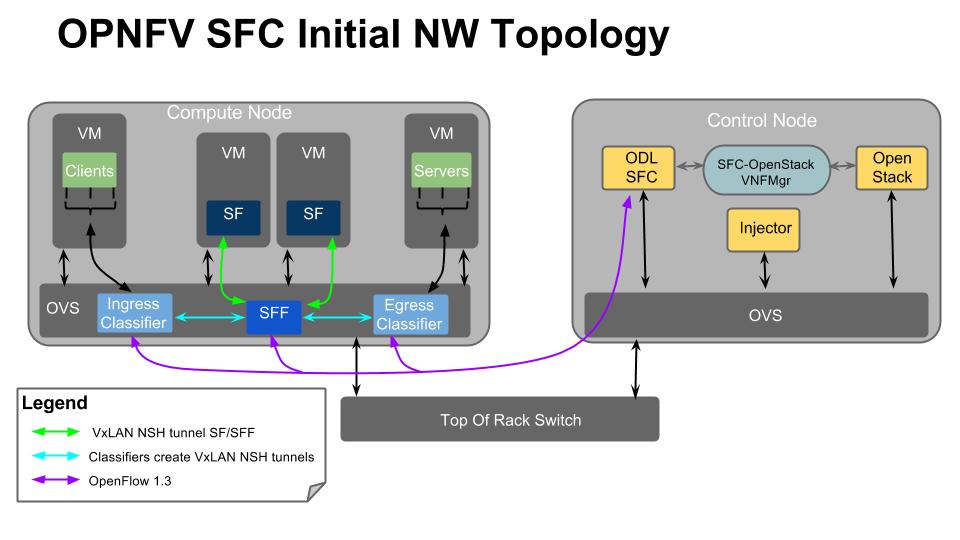
OPNFV develops, operates, and maintains infrastructure which is used by the OPNFV Community for development, integration, and testing purposes. OPNFV Infrastructure Working Group (Infra WG) oversees the OPNFV Infrastructure, ensures it is kept in a state which serves the community in best possible way and always up to date.
Infra WG is working towards a model whereby we have a seamless pipeline for handing resource requests from the OPNFV community for both development and Continuous Integration perspectives. Automation of requests and integration to existing automation tools is a primary driver in reaching this model. In the Infra WG, we imagine a model where the Infrastructure Requirements that are specified by a Feature, Installer or otherrelevant projects within OPNFV are requested, provisioned, used, reported on and subsequently torn down with no (or minimal) user intervention at the physical/infrastructure level.
Objectives of the Infra WG are
The details of what is provided as part of the infrastructure can be seen in following chapters.
TBD
Please see the details of CI from the chapters below.
Please see the details of XCI from the chapters below.
Copyright (c) 2017 Koren Lev (Cisco Systems), Yaron Yogev (Cisco Systems) and others All rights reserved. This program and the accompanying materials are made available under the terms of the Apache License, Version 2.0 which accompanies this distribution, and is available at http://www.apache.org/licenses/LICENSE-2.0

Virtual and Physical networking low level details and inter-connections, dependencies in OpenStack, Docker or Kubernetes environments are currently invisible and abstracted, by design, so data is not exposed through any API or UI.
During virtual networking failures, troubleshooting takes substantial amount of time due to manual discovery and analysis.
Maintenance work needs to happen in the data center, virtual and physical networking (controlled or not) are impacted.
Most of the times, the impact of any of the above scenarios is catastrophic.
Project “Calipso” tries to illuminate complex virtual networking with real time operational state visibility for large and highly distributed Virtual Infrastructure Management (VIM).
Customer needs during maintenance:
Visualize the networking topology, easily pinpointing the location needed for maintenance and show the impact of maintenance work needed in that location.
Administrator can plan ahead easily and report up his command chain the detailed impact – Calipso substantially lower the admin time and overhead needed for that reporting.
Customer need during troubleshooting:
Visualize and pinpointing the exact location of the failure in the networking chain, using a suspected ‘focal point’ (ex: a VM that cannot communicate).
Monitor the networking location and alerting till the problem is resolved. Calipso also covers pinpointing the root cause.
Calipso is for multiple distributions/plugins and many virtual environment variances:
We built a fully tested unified model to deal with many variances.
Supporting in initial release: VPP, OVS, LXB with all type drivers possible, onto 5 different OS distributions, totaling to more than 60 variances (see Calipso-model guide).
New classes per object, link and topology can be programmed (see development guide).
Detailed Monitoring:
Calipso provides visible insights using smart discovery and virtual topological representation in graphs, with monitoring per object in the graph inventory to reduce error vectors and troubleshooting, maintenance cycles for VIM operators and administrators.
We believe that Stability is driven by accurate Visibility.
Table of Contents
Calipso.io Product Description and Value 1
1 About 4
1.1 Project Description 4
2 Main modules 5
2.1 High level module descriptions 5
2.2 High level functionality 5
3 Customer Requirements 6
3.1 Releases and Distributions 7
Calipso interfaces with the virtual infrastructure (like OpenStack) through API, DB and CLI adapters, discovers the specific distribution/plugins in-use, their versions and based on that collects detailed data regarding running objects in the underlying workers and processes running on the different hosts. Calipso analyzes the inventory for inter-relationships and keeps them in a common and highly adaptive data model.
Calipso then represents the inter-connections as real-time topologies using automatic updates per changes in VIM, monitors the related objects and analyzes the data for impact and root-cause analysis.
This is done with the objective to lower and potentially eliminate complexity and lack of visibility from the VIM layers as well as to offer a common and coherent representation of all physical and virtual network components used under the VIM, all exposed through an API.
Calipso is developed to work with different OpenStack flavors, plugins and installers.
Calipso is developed to save network admins discovery and troubleshooting cycles of the networking aspects. Calipso helps estimate the impact of several micro failure in the infrastructure to allow appropriate resolutions.
Calipso focuses on scenarios, which requires VIM/OpenStack maintenance and troubleshooting enhancements using operations dashboards i.e. connectivity, topology and related stats – as well as their correlation.
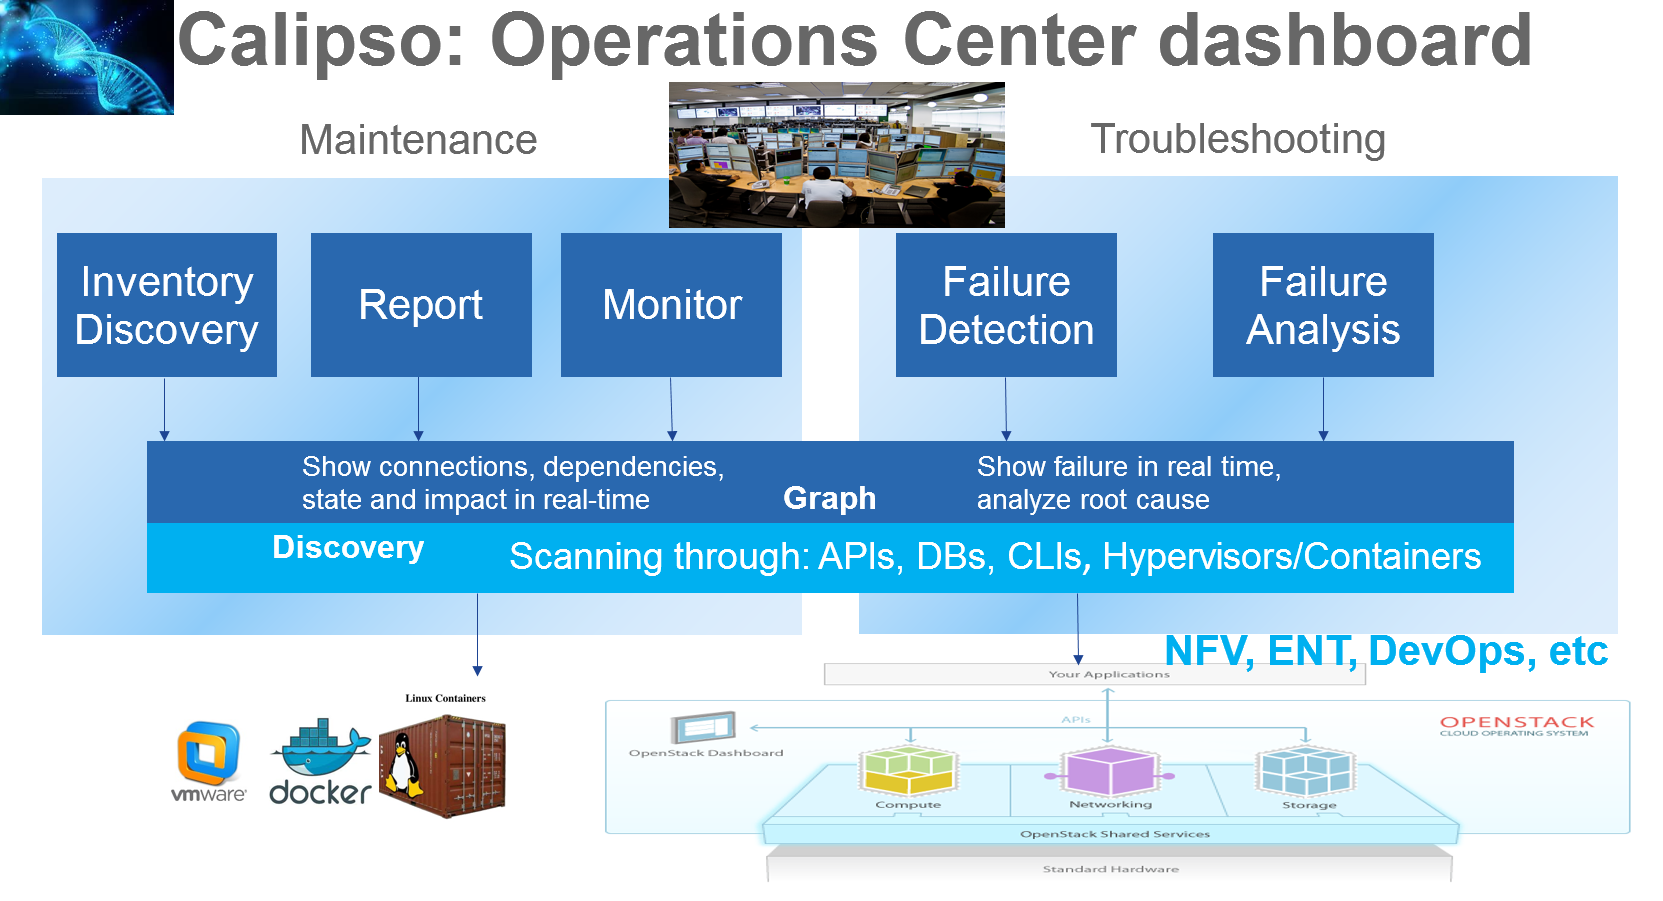
Main modules
Calipso modules included with initial release:
For Monitoring we are planning to utilize the work done by ‘Sensu’ and ‘Barometer’.
The project also develops required enhancements to individual components in OpenStack like Neutron, Telemetry API and the different OpenStack monitoring agents in order to provide a baseline for “Operations APIs”.
Scanning:
Calipso uses API, Database and Command-Line adapters for interfacing with the Cloud infrastructure to logically discover every networking component and it’s relationships with others, building a smart topology and inventory.
Automated setup:
Calipso uses Sensu framework for Monitoring. It automatically deploys and configures the necessary configuration files on all hosts, writes customized checks and handlers to setup monitoring per inventory object.
Modeled analysis:
Calipso uses a unique logical model to help facilitate the topology discovery, analysis of inter-connections and dependencies. Impact Analysis is embedded, other types of analysis is possible through a plugin framework.
Visualization:
Using its unique dependency model calipso visualize topological inventory and monitoring results, in a highly customizable and modeled UI framework
Monitoring:
After collecting the data, from processes and workers provisioned by the cloud management systems, calipso dynamically checks for health and availability, as a baseline for SLA monitoring.
Reporting:
Calipso allows networking administrators to operate, plan for maintenance or troubleshooting and provides an easy to use hierarchical representation of all the virtual networking components.
We identified an operational challenge: lack of visibility that leads to limited stability.
The lack of operational tooling coupled with the reality of deployment tools really needs to get solved to decrease the complexity as well as assist not only deploying but also supporting OpenStack and other cloud stacks.
Calispo integrates well with installers like Apex to offer enhanced day 2 operations.
Calipso is distributed for enterprises - ‘S’ release, through calipso.io, and for service providers - ‘P’ release, through OPNFV.
Copyright (c) 2017 Koren Lev (Cisco Systems), Yaron Yogev (Cisco Systems) and others All rights reserved. This program and the accompanying materials are made available under the terms of the Apache License, Version 2.0 which accompanies this distribution, and is available at http://www.apache.org/licenses/LICENSE-2.0
Project “Calipso” tries to illuminate complex virtual networking with real time operational state visibility for large and highly distributed Virtual Infrastructure Management (VIM).
Calipso provides visible insights using smart discovery and virtual topological representation in graphs, with monitoring per object in the graph inventory to reduce error vectors and troubleshooting, maintenance cycles for VIM operators and administrators.
Calipso model, described in this document, was built for multi-environment and many VIM variances, the model was tested successfully (as of Aug 27th) against 60 different VIM variances (Distributions, Versions, Networking Drivers and Types).
Table of Contents
Calipso.io Administration Guide 1
1 Environments config 3
2 UI overview 5
2.1 User management 7
2.2 Logging in and out 8
2.3 Messaging check 9
2.4 Adding a new environment 9
3 Preparing an environment for scanning 10
3.1 Where to deploy Calipso application 10
3.2 Environment setup 10
3.3 Filling the environment config data 11
3.4 Testing the connections 11
4 Links and Cliques 12
4.1 Adding environment clique_types 13
5 Environment scanning 14
5.1 UI scanning request 14
5.2 UI scan schedule request 16
5.3 API scanning request 17
5.4 CLI scanning in the calipso-scan container 18
5.4.1 Clique Scanning 19
5.4.2 Viewing results 20
6 Editing or deleting environments 20
7 Event-based scanning 21
7.1 Enabling event-based scanning 21
7.2 Event-based handling details 22
8 ACI scanning 34
9 Monitoring enablement 36
10 Modules data flows 38
Environment is defined as a certain type of Virtual Infrastructure facility the runs under a single unified Management (like an OpenStack facility).
Everything in Calipso application rely on environments config, this is maintained in the “environments_config” collection in the mongo Calipso DB.
Environment configs are pushed down to Calipso DB either through UI or API (and only in OPNFV case Calipso provides an automated program to build all needed environments_config parameters for an ‘Apex’ distribution automatically).
When scanning and discovering items Calipso uses this configuration document for successful scanning results, here is an example of an environment config document:
**{ **
**“name”: “DEMO-ENVIRONMENT-SCHEME”, **
**“enable_monitoring”: true, **
**“last_scanned”: “filled-by-scanning”, **
**“app_path”: “/home/scan/calipso_prod/app”, **
**“type”: “environment”, **
**“distribution”: “Mirantis”, **
**“distribution_version”: “8.0”, **
**“mechanism_drivers”: [“OVS”], **
“type_drivers”: “vxlan”
**“operational”: “stopped”, **
**“listen”: true, **
**“scanned”: false, **
“configuration”: [
{
**“name”: “OpenStack”, **
**“port”:”5000”, **
**“user”: “adminuser”, **
**“pwd”: “dummy_pwd”, **
**“host”: “10.0.0.1”, **
“admin_token”: “dummy_token”
**}, **
{
**“name”: “mysql”, **
**“pwd”: “dummy_pwd”, **
**“host”: “10.0.0.1”, **
**“port”: “3307”, **
“user”: “mysqluser”
**}, **
{
**“name”: “CLI”, **
**“user”: “sshuser”, **
**“host”: “10.0.0.1”, **
“pwd”: “dummy_pwd”
**}, **
{
**“name”: “AMQP”, **
**“pwd”: “dummy_pwd”, **
**“host”: “10.0.0.1”, **
**“port”: “5673”, **
“user”: “rabbitmquser”
**}, **
{
**“name”: “Monitoring”, **
**“ssh_user”: “root”, **
**“server_ip”: “10.0.0.1”, **
**“ssh_password”: “dummy_pwd”, **
**“rabbitmq_pass”: “dummy_pwd”, **
**“rabbitmq_user”: “sensu”, **
**“rabbitmq_port”: “5671”, **
**“provision”: “None”, **
**“env_type”: “production”, **
**“ssh_port”: “20022”, **
**“config_folder”: “/local_dir/sensu_config”, **
**“server_name”: “sensu_server”, **
**“type”: “Sensu”, **
“api_port”: NumberInt(4567)
**}, **
{
**“name”: “ACI”, **
**“user”: “admin”, **
**“host”: “10.1.1.104”, **
“pwd”: “dummy_pwd”
}
**], **
**“user”: “wNLeBJxNDyw8G7Ssg”, **
“auth”: {
“view-env”: [
“wNLeBJxNDyw8G7Ssg”
**], **
“edit-env”: [
“wNLeBJxNDyw8G7Ssg”
]
**}, **
}
Here is a brief explanation of the purpose of major keys in this environment configuration doc:
Distribution: captures type of VIM, used for scanning of objects, links and cliques.
Distribution_version: captures version of VIM distribution, used for scanning of objects, links and cliques.
Mechanism_driver: captures virtual switch type used by the VIM, used for scanning of objects, links and cliques.
Type_driver: captures virtual switch tunneling type used by the switch, used for scanning of objects, links and cliques.
Listen: defines whether or not to use Calipso listener against the VIM BUS for updating inventory in real-time from VIM events.
Scanned: defines whether or not Calipso ran a full and a successful scan against this environment.
Last_scanned: end time of last scan.
Operational: defines whether or not VIM environment endpoints are up and running.
Enable_monitoring: defines whether or not Calipso should deploy monitoring of the inventory objects running inside all environment hosts.
Configuration-OpenStack: defines credentials for OpenStack API endpoints access.
Configuration-mysql: defines credentials for OpenStack DB access.
Configuration-CLI: defines credentials for servers CLI access.
Configuration-AMQP: defines credentials for OpenStack BUS access.
Configuration-Monitoring: defines credentials and setup for Calipso sensu server (see monitoring-guide for details).
Configuration-ACI: defines credentials for ACI switched management API, if exists.
User and auth: used for UI authorizations to view and edit this environment.
App-path: defines the root directory of the scanning application.
* This guide will help you understand how-to add new environment through the provided Calispo UI module and then how-to use this environment (and potentially many others) for scanning and real-time inventories collection.
Cloud administrator can use the Calipso UI for he’s daily tasks. Once Calipso containers are running (see quickstart-guide) the UI will be available at:
http://server-ip:80 , default login credentials: admin/123456.
Before logging in, while at the main landing page, a generic information is provided.
Post login, at the main dashboard you can click on “Get started” and view a short guide for using some of the basic UI functions, available at: server-ip/getstarted.
The main areas of interest are shown in the following screenshot:
Main areas on UI:
Main areas details:
Navigation Tree(1): Hierarchy searching through the inventory using objects and parents details, to lookup a focal point of interest for graphing or data gathering.
Main functions (2): Jumping between highest level dashboard (all environments), specific environment and some generic help is provided in this area.
Environment Summary (3): The central area where the data is exposed, either through graph or through widget-attribute-listing.
Search engine (4): Finding interesting focal points faster through basic object naming lookups, then clicking on results to get transferred directly to that specific object dashboard. Searches are conducted across all environments.
More settings (5): In this area the main collections of data are exposed, like scans, schedules, messaging, clique_types, link_types and others.
Graph or Data toggle (6): When focusing on a certain focal point, this button allows changing from a graph-view to simple data-view per request, if no graph is available for a certain object the data-view is used by default, if information is missing try this button first to make sure the correct view is chosen.
The first place an administrator might use is the user’s configurations, this is where a basic RBAC is provided for authorizing access to the UI functions. Use the ‘settings’ button and choose ‘users’ to access:
Editing the admin user password is allowed here:
Note:
The ‘admin’ user is allowed all functions on all environments, you shouldn’t change this behavior and you should never delete this user, or you’ll need re-install Calipso.
Adding new user is provided when clicking the “Create new user” option:
Creating a new user:
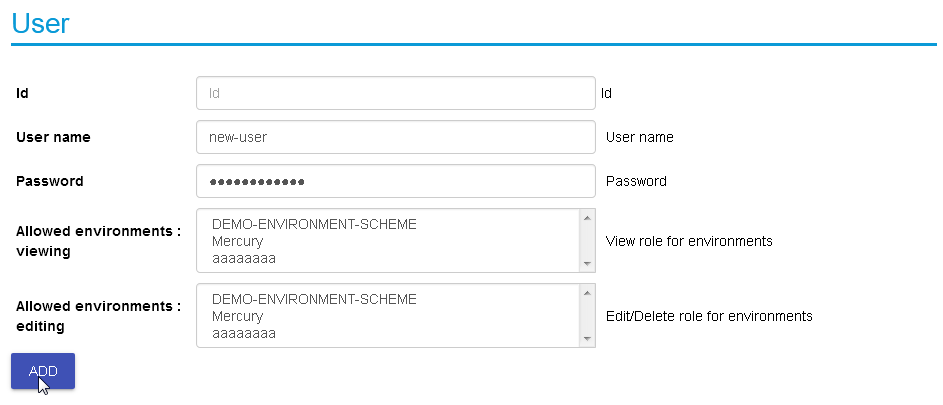
Before environments are configured there is not a lot of options here, once environments are defined (one or more), users can be allowed to edit or view-only those environments.Logging in and out
To logout and re-login with different user credentials you can click the username option and choose to sign out:
When calispo-scan and calipso-listen containers are running, they provide basic messages on their processes status, this should be exposed thorough the messaging system up to the UI, to validate this choose ‘messages’ from the settings button:
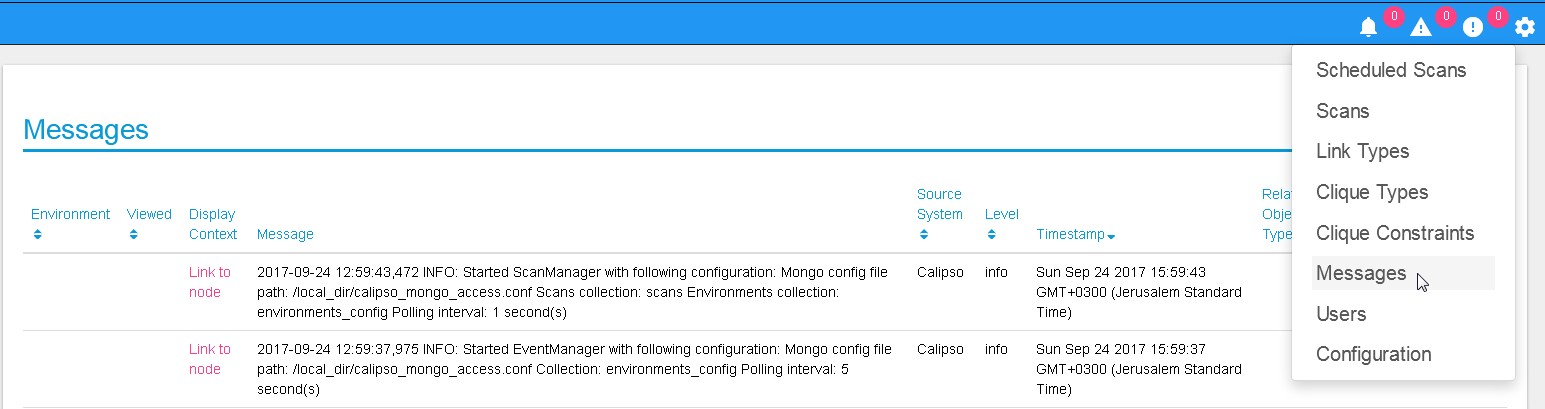
As explained above, environment configuration is the pre requisite for any Calipso data gathering, goto “My Environments” -> and “Add new Environment” to start building the environment configuration scheme:
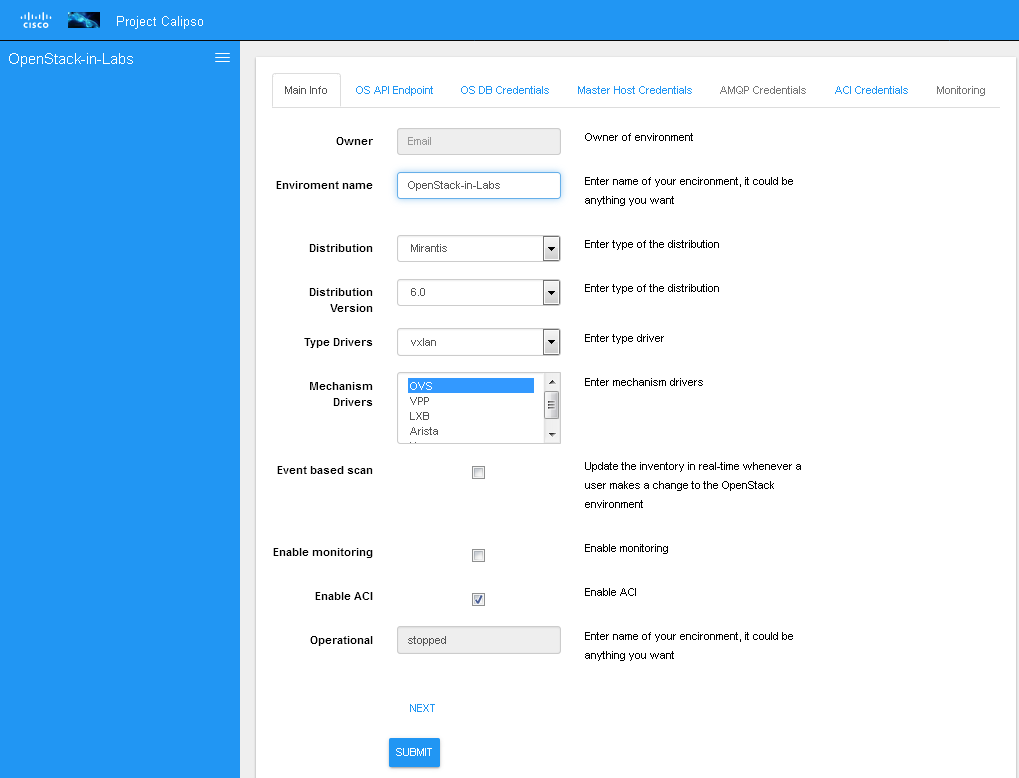
Note: this is automated with OPNFV apex distro, where Calipso auto-discovers all credentials
Some preparation is needed for allowing Calipso to successfully gather data from the underlying systems running in the virtual infrastructure environment. This chapter explain the basic requirements and provide recommendations.
Calipso application replaces the manual discovery steps typically done by the administrator on every maintenance and troubleshooting cycles, It needs to have the administrators privileges and is most accurate when placed on one of the controllers or a“jump server” deployed as part of the cloud virtual infrastructure, Calipso calls this server a “Master host”.
Consider Calipso as yet another cloud infrastructure module, similar to neutron, nova.
Per supported distributions we recommend installing the Calipso application at:
The following steps should be taken to enable Calispo’s scanner and listener to connect to the environment controllers and compute hosts:
OpenStack API endpoints : Remote access user accessible from the master host with the required credentials and allows typical ports: 5000, 35357, 8777, 8773, 8774, 8775, 9696
OpenStack DB (MariaDB or MySQL): Remote access user accessible from the master host to ports 3306 or 3307 allowed access to all Databases as read-only.
Master host SSH access: Remote access user with sudo privileges accessible from the master host through either user/pass or rsa keys, the master host itself should then be allowed access using rsa-keys (password-less) to all other infrastructure hosts, all allowing to run sudo CLI commands over tty, when commands entered from the master host source itself.
AMQP message BUS (like Rabbitmq): allowed remote access from the master host to listen for all events generated using a guest account with a password.
Physical switch controller (like ACI): admin user/pass accessed from master host.
Note: The current lack of operational toolsets like Calipso forces the use of the above scanning methods, the purpose of Calipso is to deploy its scanning engine as an agent on all environment hosts, in such scenario the requirements above might be deprecated and the scanning itself can be made more efficient.
As explained in chapter 1 above, environment configuration is the pre requisite and all data required is modeled as described. See api-guide for details on submitting those details through calispo api module. When using the UI module, follow the sections tabs and fill the needed data per help messages and the explanations in chapter 1.
Only the AMQP, Monitoring and ACI sections in environment_config documents are optional, per the requirements detailed below on this guide.
Before submitting the environment_config document it is wise to test the connections. Each section tab in the environment configuration has an optional butting for testing the connection tagged “test connection”. When this button is clicked, a check is made to make sure all needed data is entered correctly, then a request is sent down to mongoDB to the “connection_tests” collection. Then the calispo scanning module will make the required test and will push back a response message alerting whether or not this connection is possible with the provided details and credentials.
Test connection per configuration section:
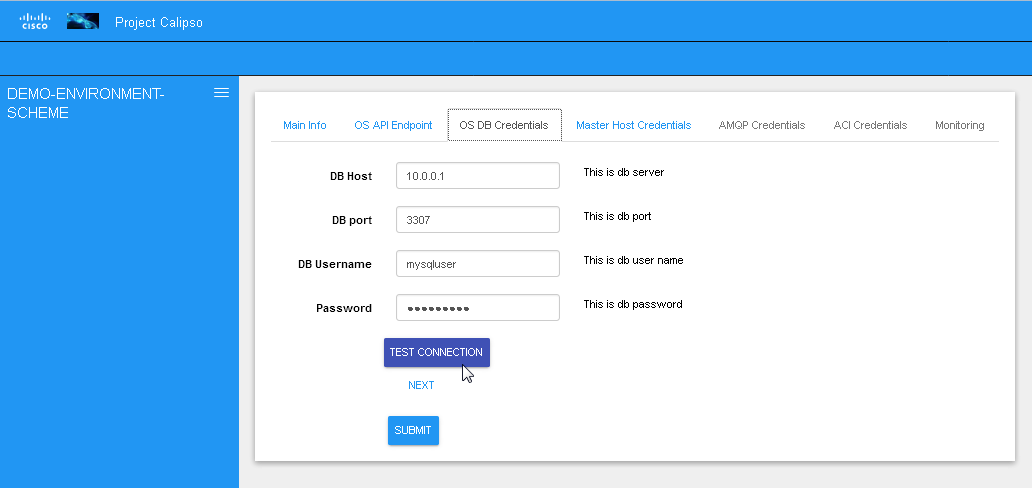
With the above tool, the administrator can be assured that Calipso scanning will be successful and the results will be an accurate representation of the state of he’s live environment.
A very powerful capability in Calipso allows it to be very adaptive and support many variances of VIM environments, this capability lies in its objects, links and cliques models enabling the scanning of data and analysis of inter-connections and creation of many types of topology graphs..
Please refer to calipso-model document for more details.
The UI allows viewing and editing of Link types and Clique types through the settings options:
Link types:
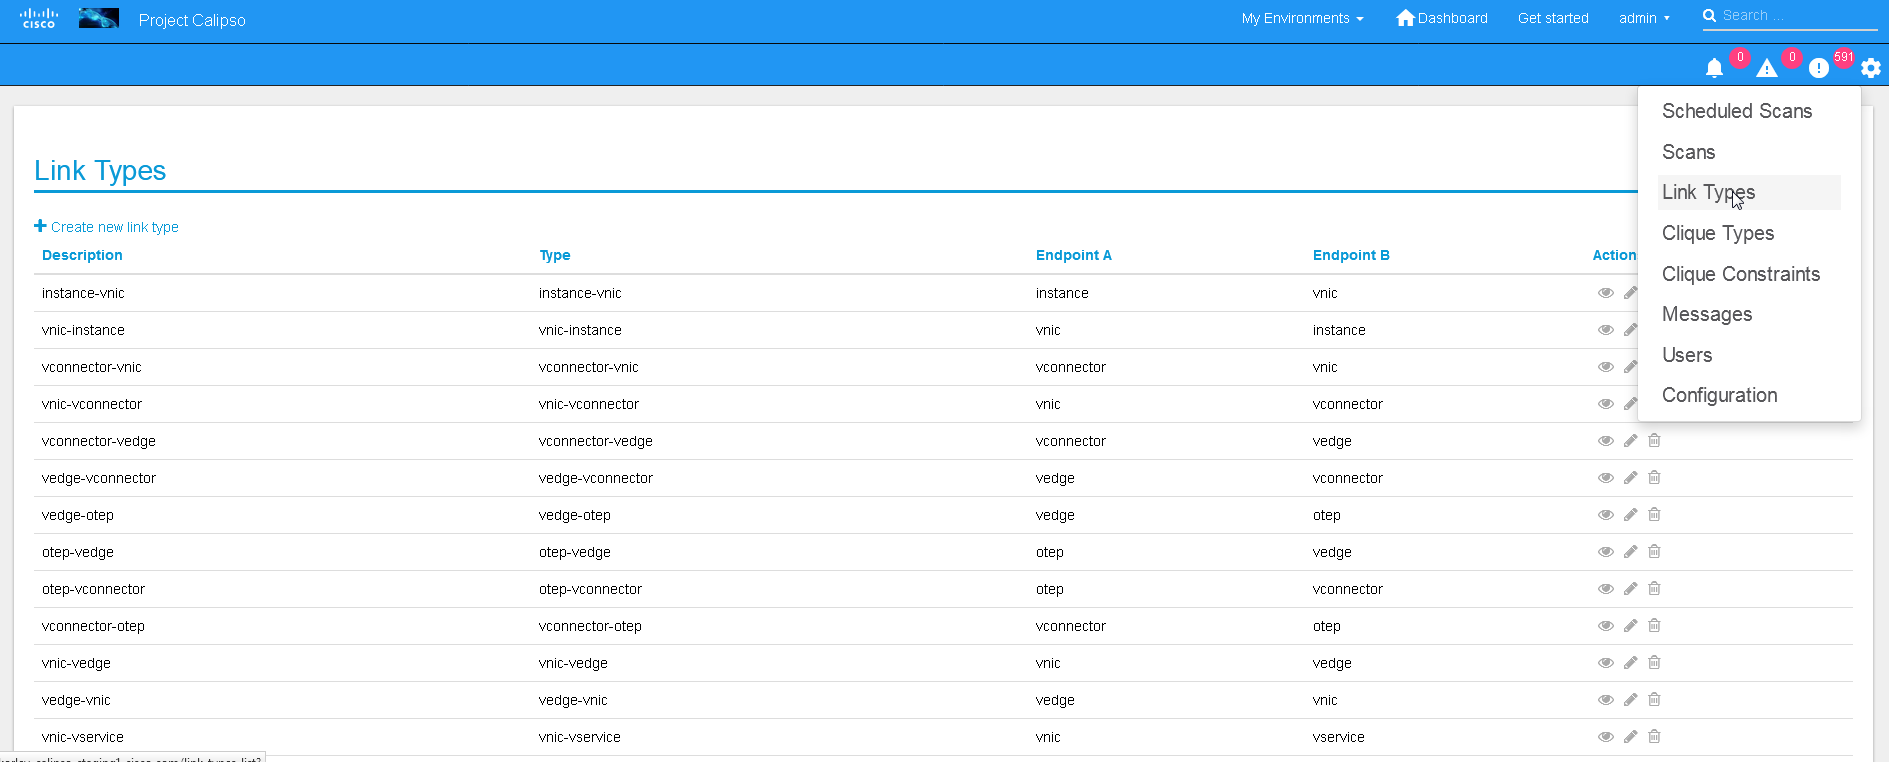
Note:
We currently recommend not to add nor edit the Link types pre-built in Calipso’s latest release (allowed only for the ‘admin’ user), as it is tested and proven to support more than 60 popular VIM variances.
An administrator might choose to define several environment specific Clique types for creating favorite graphs using the focal_point objects and link_types lists already built-in:
Adding environment clique_types
Use either the API or the UI to define specific environment clique_types.
For adding clique_types, use settings menu and choose “Create new clique type” option, then provide a specific environment name (per previous environment configurations), define a focal_point (like: instance, or other object types) and a list of resulted link_types to include in the final topology graph. Refer to calipso-model document for more details.
Clique_types are needed for accurate graph buildup, before sending a scan request.
Several defaults are provided with each new Calipso release.
Clique types:
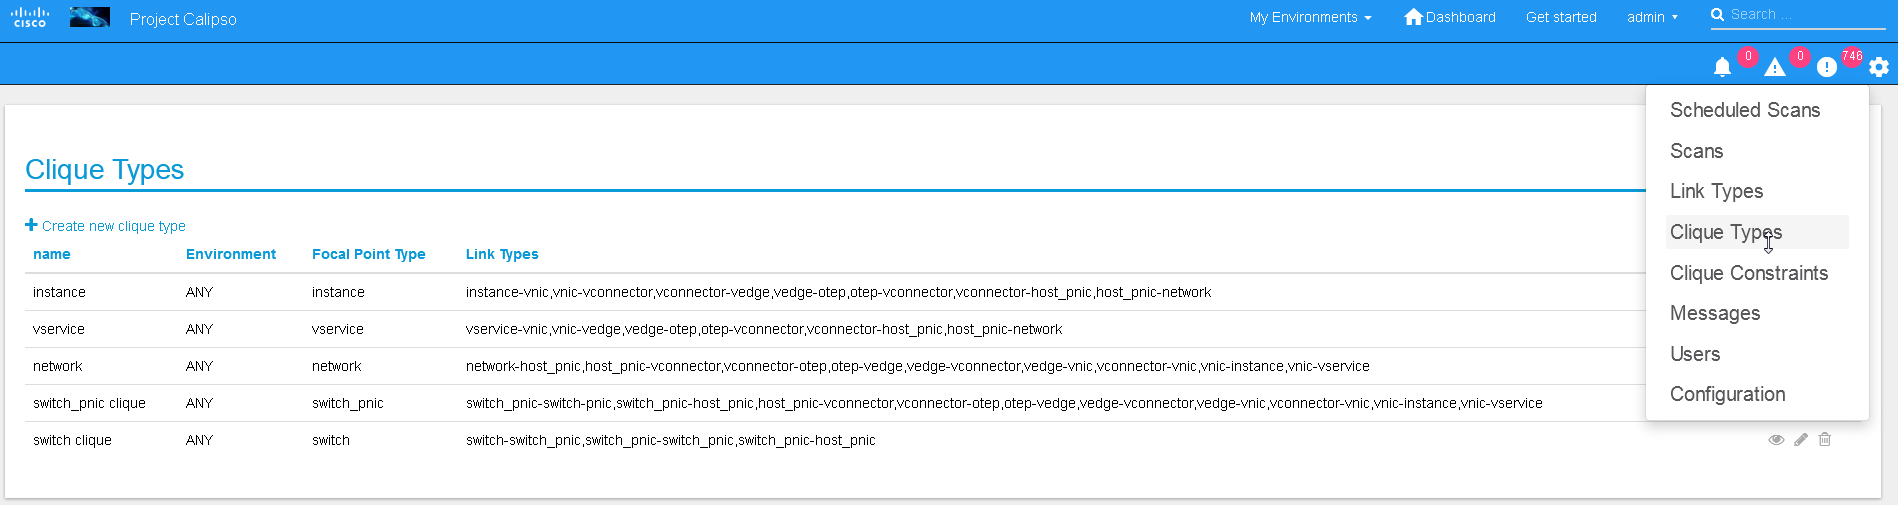
Note: ask calipso developers for recommended clique_types (pre-built in several Calipso deployments), per distribution variance, fully tested by Calipso developers:
Once environment is setup correctly, environment_config data is filled and tested, scanning can start. This is can be done with the following four options:
UI scanning request
UI scan schedule request
API scanning or scheduling request.
CLI scanning in the calipso-scan container.
The following sections with describe those scanning options.
This can be accomplished after environment configuration has been submitted, the environment name will be listed under “My environment” and the administrator can choose it from the list and login to the specific environment dashboard:
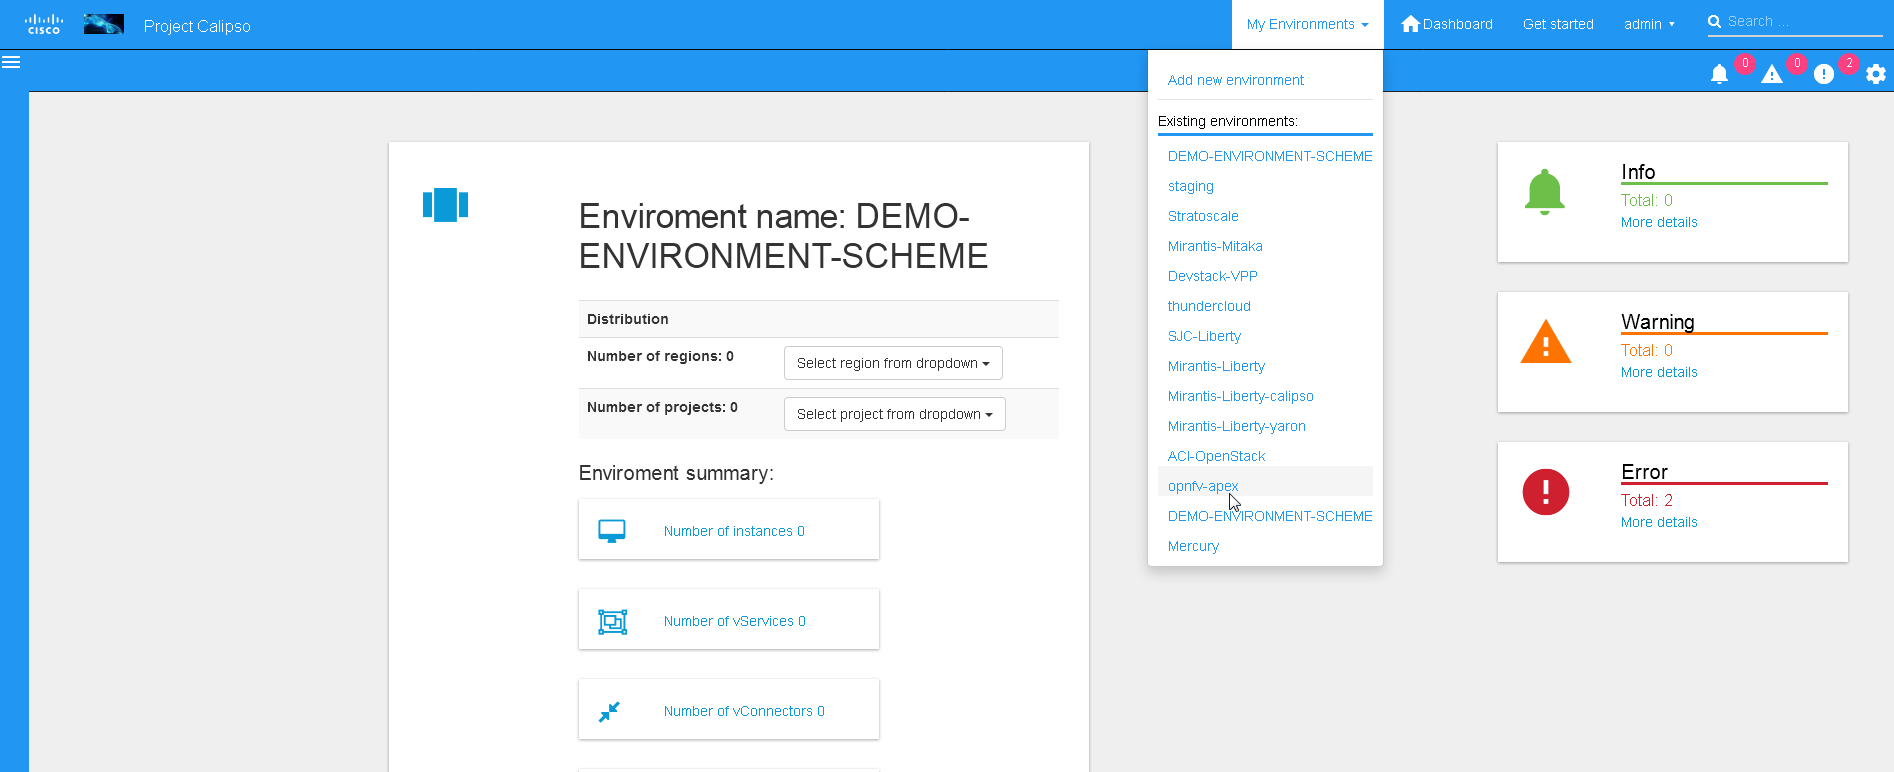
Onces inside a specific environment dashboard the administrator can click the scanning button the go into scanning request wizards:
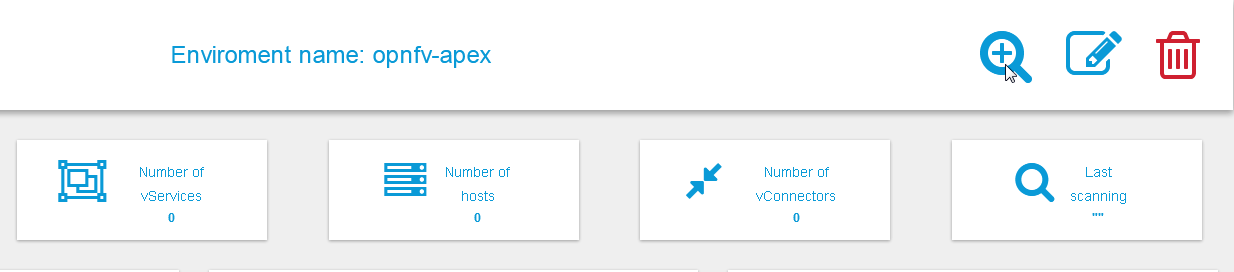
In most cases, the only step needed to send a scanning request is to use all default options and click the “Submit” button:
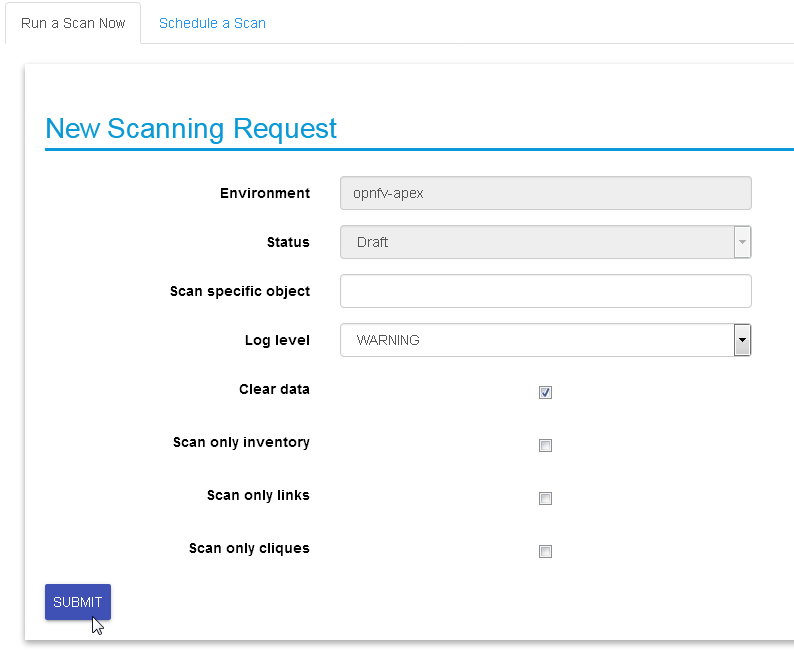
Scanning request will propagate into the “scans” collection and will be handled by scan_manager in the calipso-scan container.
Scan options:
Log level: determines the level and details of the scanning logs.
Clear data: empty historical inventories related to that specific environment, before scanning.
Only inventory: creates inventory objects without analyzing for links.
Only links: create links from pre-existing inventory, does not build graph topologies.
Only Cliques: create graph topologies from pre-existing inventory and links.
Scanning can be used periodically to dynamically update the inventories per changes in the underlying virtual environment infrastructure. This can be defined using scan scheduling and can be combined with the above one time scanning request.
Scheduled scans has the same options as in single scan request, while choosing a specific environment to schedule on and providing frequency details, timer is counted from the submission time, scan scheduling requests are propagated to the “scheduled_scans” collection in the Calispo mongoDB and handled by scan_manager in the calispo-scan container.
Follow api-guide for details on submitting scanning request through Calipso API.
When using the UI for scanning messages are populated in the “Messages” menu item and includes several details for successful scanning and some alerts. When more detailed debugging of the scanning process is needed, administrator can login directly to the calispo-scan container and run the scanning manually using CLI:
Login to calispo-scan container running on the installed host:
ssh scan@localhost –p 3002 , using default-password: ‘scan’
Move to the calipso scan application location:
cd /home/scan/calipso_prod/app/discover
Run the scan.py application with the basic default options:
python3 ./scan.py -m /local_dir/calipso_mongo_access.conf -e Mirantis-8
Default options: -m points to the default location of mongoDB access details, -e points to the specific environment name, as submitted to mongoDB through UI or API.
Other optional scanning parameters, can be used for detailed debugging:
The scan.py script is located in directory app/discover in the Calipso repository.To show the help information, run scan.py with –help option, here is the results:
Usage: scan.py [-h] [-c [CGI]] [-m [MONGO_CONFIG]] [-e [ENV]] [-t [TYPE]]
[-y [INVENTORY]] [-s] [-i [ID]] [-p [PARENT_ID]]
[-a [PARENT_TYPE]] [-f [ID_FIELD]] [-l [LOGLEVEL]]
[–inventory_only] [–links_only] [–cliques_only] [–clear]
Optional arguments:
-h, –help show this help message and exit
-c [CGI], –cgi [CGI]
read argument from CGI (true/false) (default: false)
-m [MONGO_CONFIG], –mongo_config [MONGO_CONFIG]
name of config file with MongoDB server access details
-e [ENV], –env [ENV]
name of environment to scan (default: WebEX-
-t [TYPE], –type [TYPE]
type of object to scan (default: environment)
-y [INVENTORY], –inventory [INVENTORY]
name of inventory collection (default: ‘inventory’)
-s, –scan_self scan changes to a specific object (default: False)
-i [ID], –id [ID] ID of object to scan (when scan_self=true)
-p [PARENT_ID], –parent_id [PARENT_ID]
ID of parent object (when scan_self=true)
-a [PARENT_TYPE], –parent_type [PARENT_TYPE]
type of parent object (when scan_self=true)
-f [ID_FIELD], –id_field [ID_FIELD]
name of ID field (when scan_self=true) (default: ‘id’,
use ‘name’ for projects)
-l [LOGLEVEL], –loglevel [LOGLEVEL]
logging level (default: ‘INFO’)
–inventory_only do only scan to inventory (default: False)
–links_only do only links creation (default: False)
–cliques_only do only cliques creation (default: False)
–clear clear all data prior to scanning (default: False)
A simple scan.py run will look, by default, for a local MongoDB server. Assuming running this from within the scan container running, the administrator needs to point it to use the specific MongoDB server. This is done using the Mongo access config file created by the installer (see install-guide for details):
./scan.py -m your\_mongo\_access.confEnvironment needs to be specified explicitly, no default environment is used by scanner.
By default, the inventory collection, named ‘inventory’, along with the accompanying collections: ”links”, “cliques”, “clique_types” and “clique_constraints” are used to place initial scanning data results.
As a more granular scan example, for debugging purposes, using environment “RDO-packstack-Mitaka”, pointing scanning results to an inventory collection named “RDO”:The accompanying collections will be automatically created and renamed accordingly:“RDO_links”, “RDO_cliques”, “RDO_clique_types” and “RDO_clique_constraints”.Another parameter in use here is –clear, which is good for development: it clears all the previous data from the data collections (inventory, links & cliques).
scan.py -m your_mongo_access.conf -e RDO-packstack-Mitaka -y RDO –clear
Log level will provide the necessary details for cases of scan debugging.
For creating cliques based on the discovered objects and links, clique_types must be defined for the given environment (or a default “ANY” environment clique_types will be used)A clique type specifies the link types used in building a clique (graph topology) for a specific focal point object type.For example, it can define that for instance objects we want to have the following link types:
instance-vnic
vnic-vconnector
vconnector-vedge
vedge-host_pnic
host_pnic-network
See calipso-model guide for more details on cliques and links.
As in many cases the same clique types are used, we can simply copy the clique_types documents from an existing clique_types collection. For example, using MongoChef:
Click the existing clique types collection
Right click the results area
Choose export
Click ‘next’ all the time (JSON format, to clipboard)
Select JSON format and “Overwrite document with the same _id”
Right click the target collection
Choose import, then JSON and clipboard
name of your collection’s name. For example, you create a collection named your_test, then your clique types collection’s name must be your_test_clique_types.
Now run scan.py again to have it create cliques-only from that data.
Scan results are written into the collections in the ‘Calispo’ DB on the MongoDB database.
In our example, we use the MongoDB database server on “install-hostname”http://korlev-osdna-devtest.cisco.com/, so we can connect to it by Mongo client, such as Mongochef and investigate the specific collections for details.
Inside a specific environment dashboard optional buttons are available for deleting and editing the environment configurations:
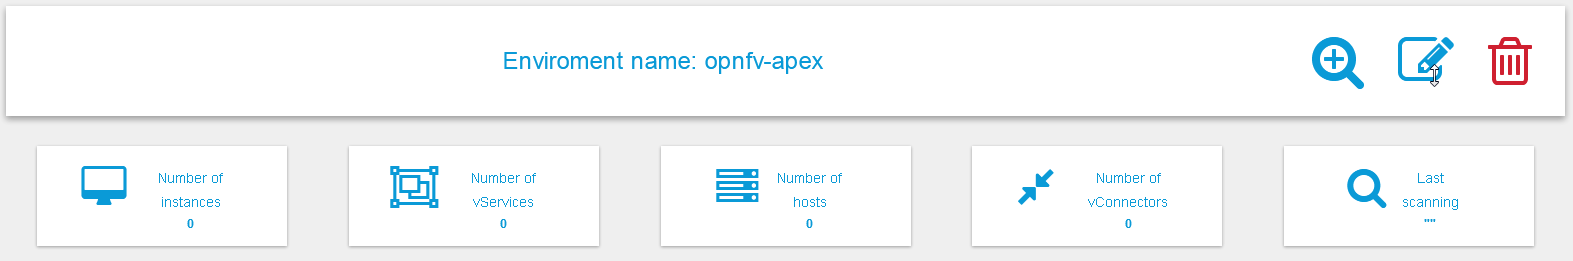
Note: Deleting an environment does not empty the inventories of previous scan results, this can be accomplished in future scans when using the –clear options.
For dynamic discovery and real-time updates of the inventories Calipso also provides event-based scanning with event_manager application in the calipso-listen container.
Event_manager listens to the VIM AMQP BUS and based on the events updates the inventories and also kickoff automatic scanning of a specific object and its dependencies.
Per environment, administrator can define the option of event-based scanning, using either UI or API to configure that parameter in the specific environment configuration:
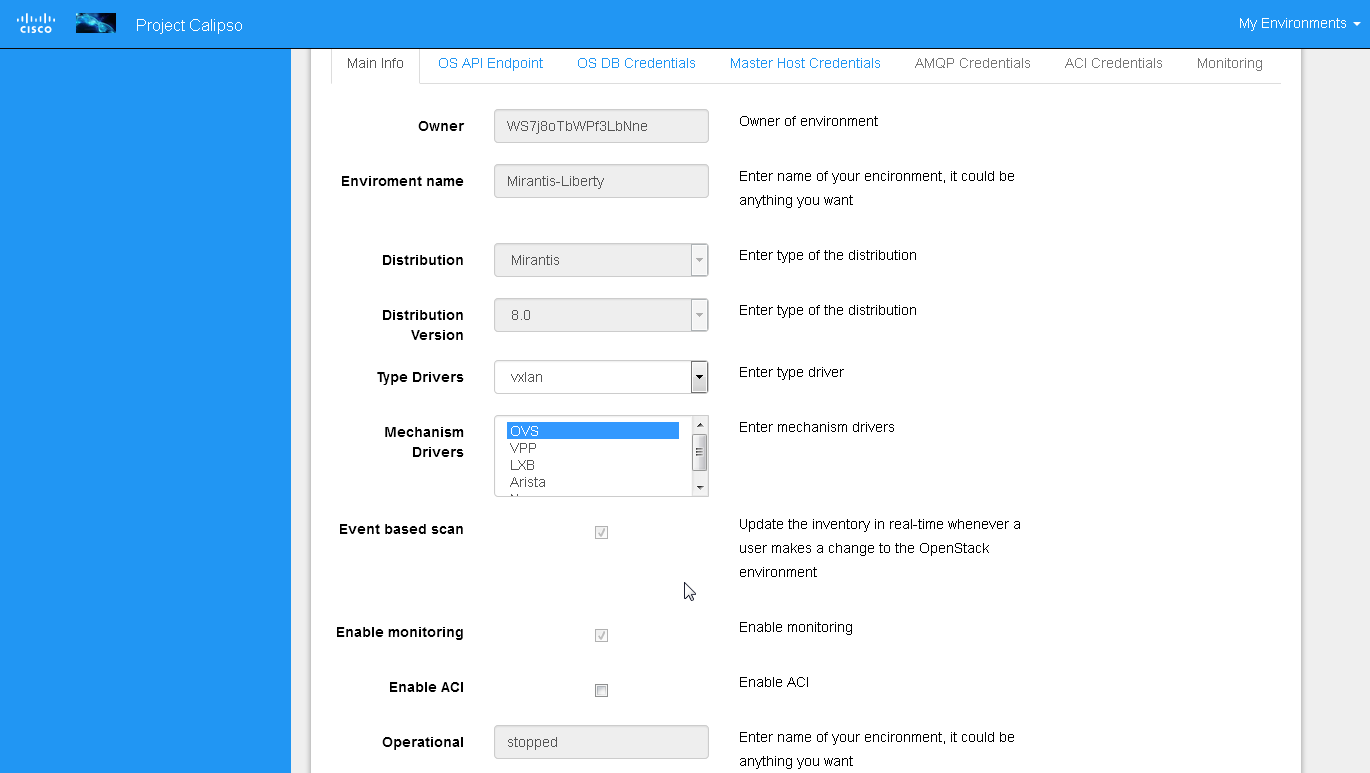
In cases where event-based scanning is not supported for a specific distribution variance the checkbox for event based scan will be grayed out. When checked, the AMQP section becomes mandatory.
This behavior is maintained through the “supported_environments” collection and explained in more details in the calipso-model document.
The event-based scanning module needs more work to adapt to the changes in any specific distribution variance, this is where we would like some community support to help us maintain data without the need for full or partial scanning through scheduling.
The following diagram illustrates event-based scanning module functions on top of the regular scanning module functions:
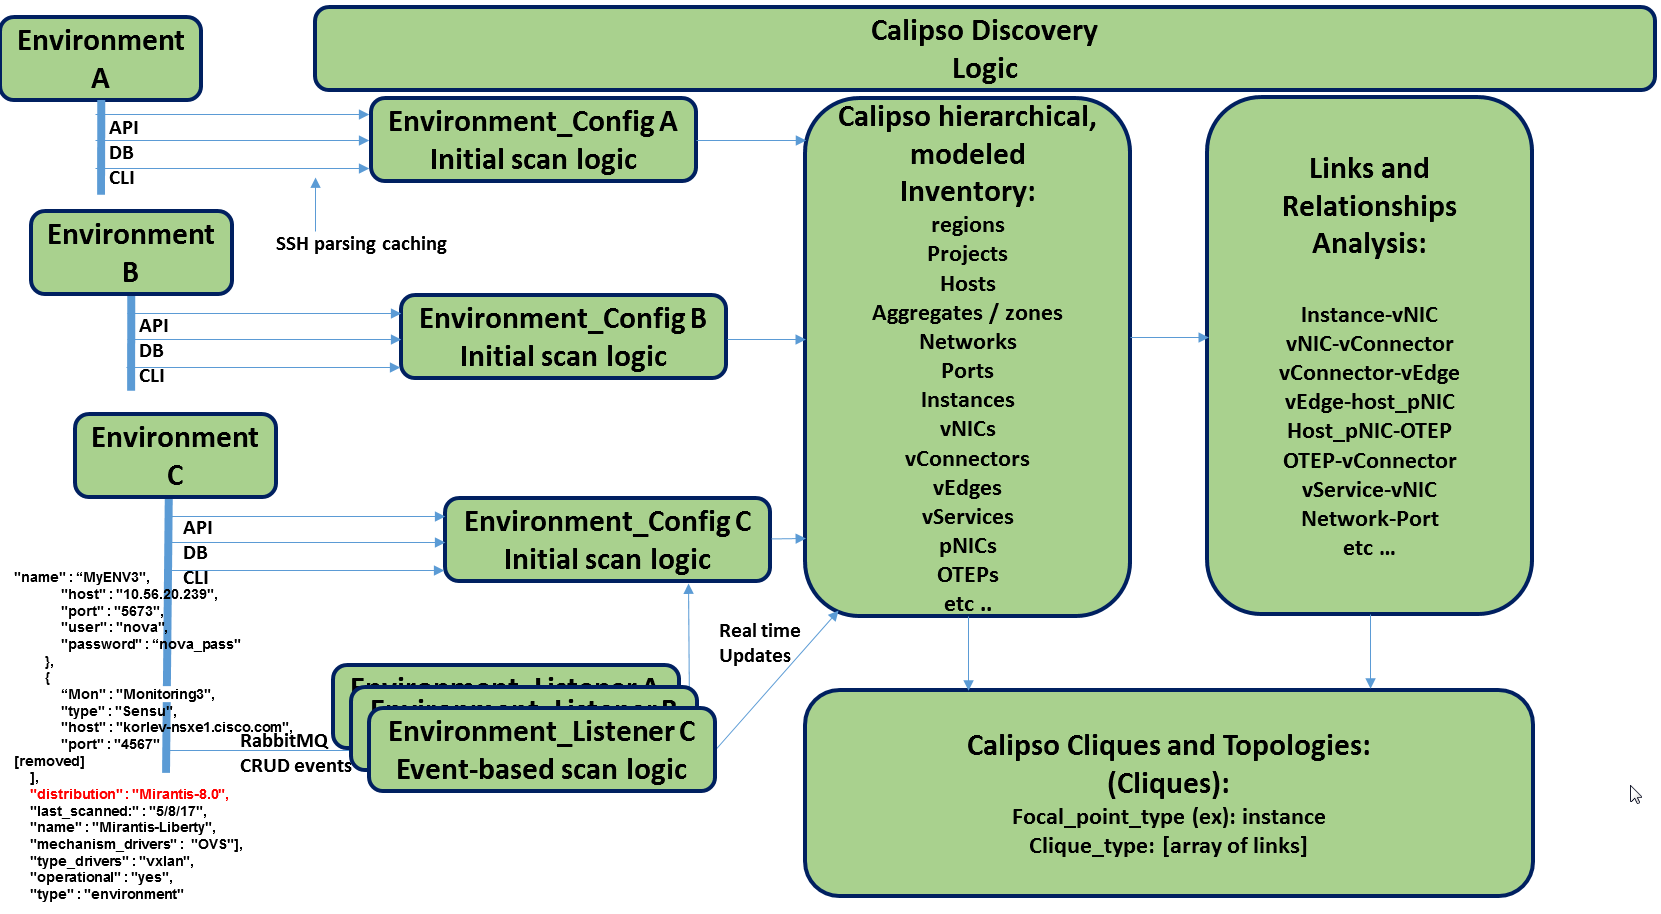
In the following tables, some of the current capabilities of event-handling and event-based scanning in Calipso are explained: (NOTE: see pdf version of this guide for better tables view)
| # | Event name | AMQP event | Handler | Workflow | Scans | Notes |
|---|---|---|---|---|---|---|
| Instance | ||||||
| 1 | Create Instance | compute.instance.create.end | EventInstanceAdd |
|
Yes {by object id: 2,
links: 1,
cliques: 1,
from queue: ?}
|
|
| 2 | Update Instance | compute.instance.rebuild.end compute.instance.update |
EventInstanceUpdate |
|
Yes (if #1 is used) No (otherwise) |
The only fields that are updated: name, object_name and name_path |
| 3 | Delete Instance | compute.instance.delete.end | EventInstanceDelete (EventDeleteBase) |
|
No | delete_handler() is expanded later |
| Instance Lifecycle | ||||||
| 4 | Instance Down | compute.instance.shutdown.start compute.instance.power_off.start compute.instance.suspend.start |
Not implemented | |||
| 5 | Instance Up | compute.instance.power_on.end compute.instance.suspend.end |
Not implemented | |||
| Region | ||||||
| 6 | Add Region | servergroup.create | Not implemented | |||
| 7 | Update Region | servergroup.update servergroup.addmember |
Not implemented | |||
| 8 | Delete Region | servergroup.delete | Not implemented | |||
| Network | ||||||
| 9 | Add Network | network.create.end | EventNetworkAdd |
|
No | |
| 10 | Update Network | network.update.end | EventNetworkUpdate |
|
No | The only fields that are updated: name, object_name, name_path and admin_state_up |
| 11 | Delete Network | network.delete.end | EventNetworkDelete (EventDeleteBase) |
|
No | delete_handler() is expanded later |
| Subnet | ||||||
| 12 | Add Subnet | subnet.create.end | EventSubnetAdd |
|
Yes {cliques: 1} |
|
| 13 | Update Subnet | subnet.update.end | EventSubnetUpdate |
4.1. Add dhcp document 4.2. Make sure ApiAccess.regions is not empty 4.3. Add port document 4.4. If port has been added, add vnic document, add links and scan cliques.
5.1. Delete dhcp document 5.2. Delete port binding to dhcp server if exists
|
Yes {cliques: 1} (only if dhcp status has switched to True) |
|
| 14 | Delete Subnet | subnet.delete.end | EventSubnetDelete |
and remove itself from network_document[‘subnets’]
|
No | |
| Port | ||||||
| 15 | Create Port | port.create.end | EventPortAdd |
|
Yes {cliques: 1} (only if ‘compute’ is in port[‘device_owner’] and instance_root is not None (see steps 3 and 6)) |
|
| 16 | Update Port | port.update.end | EventPortUpdate |
|
No | |
| 17 | Delete Port | port.delete.end | EventPortDelete (EventDeleteBase) |
3.1. Get instance document for the port from db. If it doesn’t exist, to step 4. 3.2. Remove port from network_info of instance 3.3. If it was the last port for network in instance doc, remove network from the doc 3.4. If port’s mac_address is equal to instance_doc’s one, then fetch an instance with the same id as instance_doc using ApiFetchHostInstances fetcher. If instance exists and ‘mac_address’ not in instance, set instance_doc’s mac_address to None 3.5. Save instance_docs in db
|
No | delete_handler() is expanded later |
| Router | ||||||
| 18 | Add Router | router.create.end | EventRouterAdd |
3.1. Add router document (with network) to db 3.2. Add children documents: 3.3. If no ports folder exists for this router, create one 3.4. Add router port to db 3.5. Add vnics folder for router to db 3.6. If port was successfully added (3.4), try to add vnic document for router to db two times (??) 3.7. If port wasn’t successfully added, try adding vnics_folder again (???) (*note 1*) 3.8. If step 3.7 returned False (*Note 2*), try to add vnic_document again (??)
|
Yes {cliques: 1} |
|
| 19 | Update Router | router.update.end | EventRouterUpdate |
3.1. If router_doc has a ‘gw_port_id’ key, delete relevant port. 3.2. If router_doc has a ‘network’: 3.2.1. If a port was deleted on step 3.1, remove its ‘network_id’ from router_doc[‘network’] 3.2.2. Delete related links
4.1. Add new network id to router_doc networks 4.2. Use CliFetchHostVservice to fetch gateway port and update it in router_doc 4.3. Add children documents for router (see #18 steps 3.2-3.8) 4.4. Add relevant links
|
Yes {cliques: 1} | |
| 20 | Delete Router | router.delete.end | EventRouterDelete (EventDeleteBase) |
|
No | delete_handler() is expanded later |
| Router Interface | ||||||
| 21 | Add Router Interface | router.interface.create | EventInterfaceAdd |
6.1. If router_doc is an empty type, log an error and continue to step 7 (*Note 1*) 6.2. Add new network id to router_doc network list 6.3. If gateway port is in both router_doc and db, continue to step 6.7 6.4. Fetch router using CliFetchHostVservice, set gateway port in router_doc to the one from fetched router 6.5. Add gateway port to db 6.6. Add vnic document for router. If unsuccessful, try again after a small delay 6.7. Update router_id in db
|
Yes {cliques: 1} |
|
| 22 | Delete Router Interface | router.interface.delete | EventInterfaceDelete |
|
No | |
For dynamic discovery and real-time updates of physical switches and connections between physical switches ports and host ports (pNICs), Calispo provides an option to integrate with the Cisco data center switches controller called “ACI APIC”.
This is an optional parameter and once checked details on the ACI server and API credentials needs to be provided:
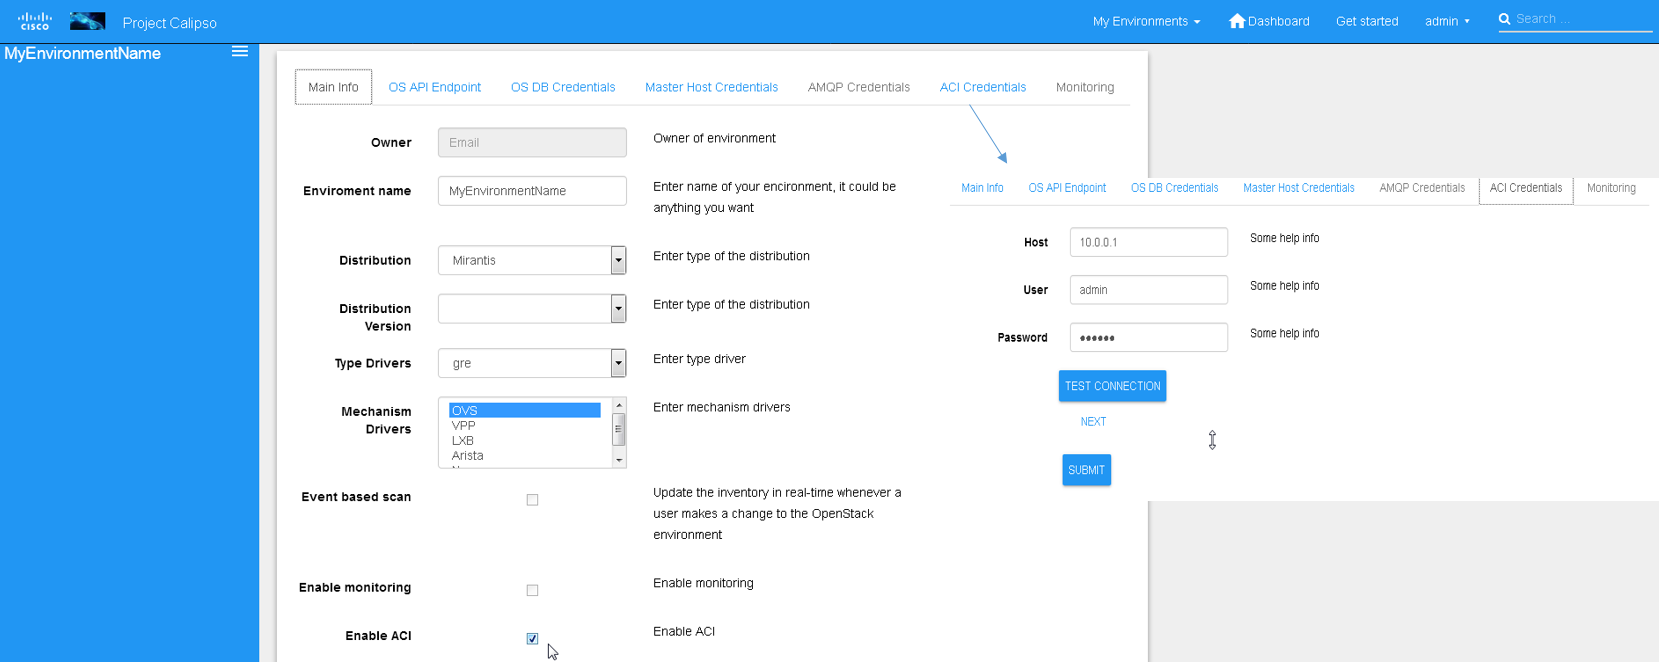
The results of this integration (when ACI switches are used in that specific VIM environment) are extremely valuable as it maps out and monitors virtual-to-physical connectivity across the entire data center environment, both internal and external.
Example graph generated in such environments:
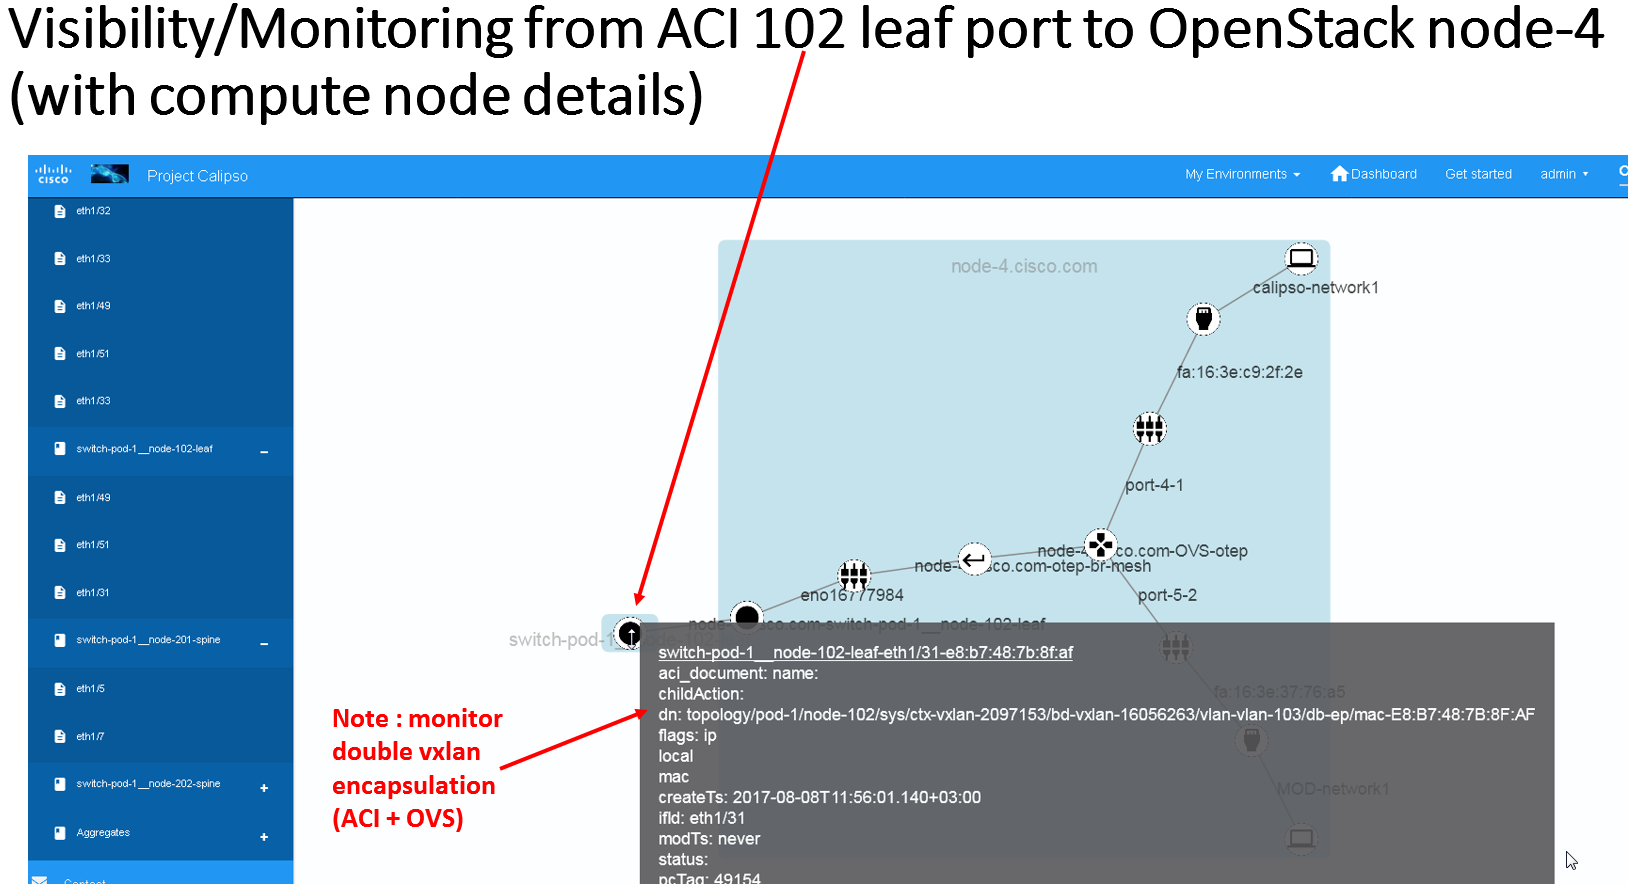
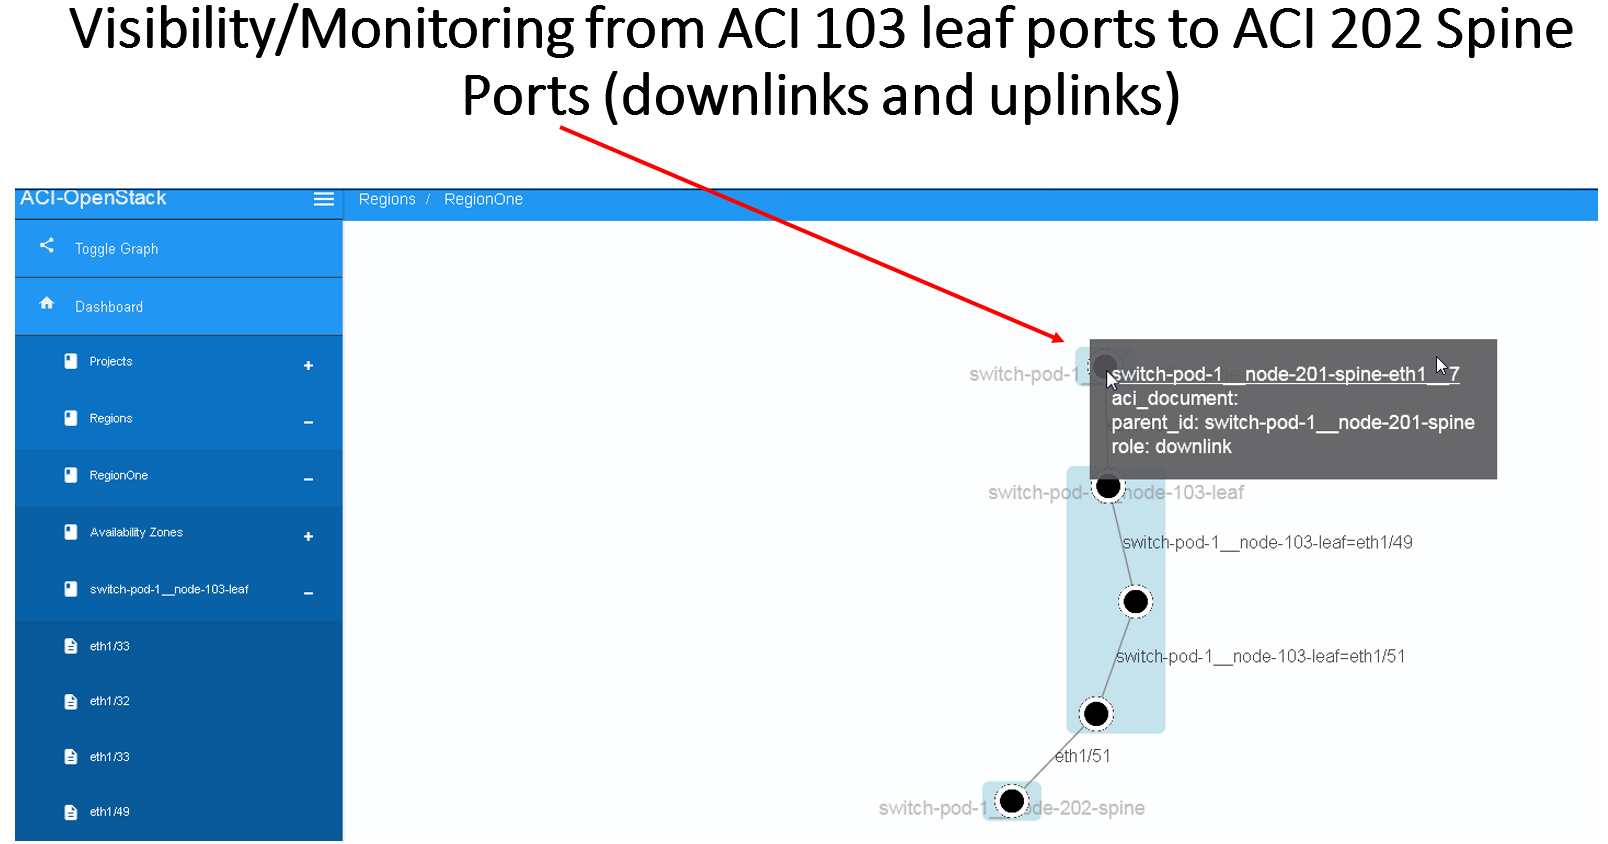
For dynamic discovery of real-time statuses and states of physical and virtual components and thier connections Calispo provides an option to automatically integrate with the Sensu framework, customized and adapted from the Calispo model and design concepts. Follow the monitoring-guide for details on this optional module.
Enabling Monitoring through UI, using environment configuration wizard:
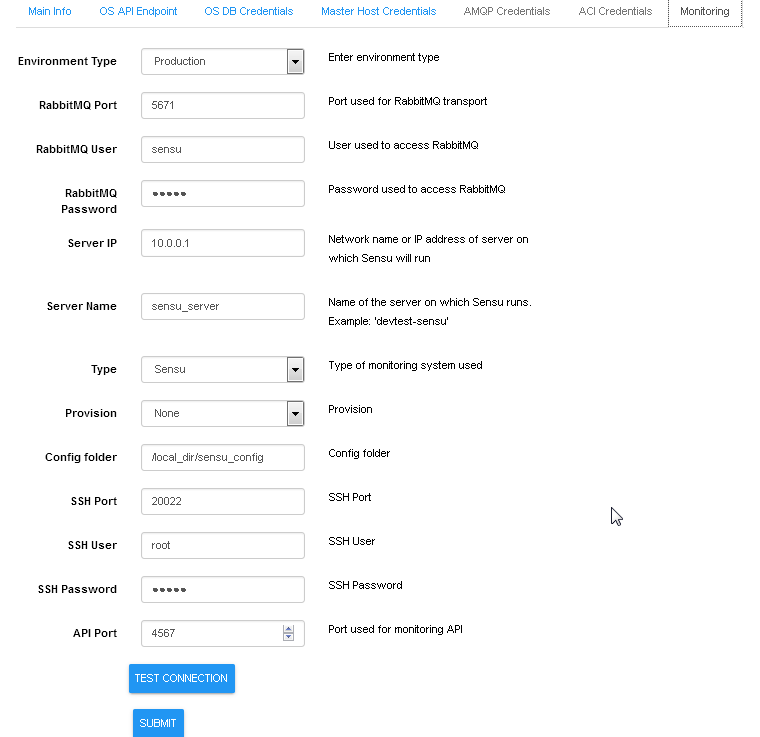
Modules data flows
Calipso modules/containers and the VIM layers have some inter-dependencies, illustrated in the following diagram:
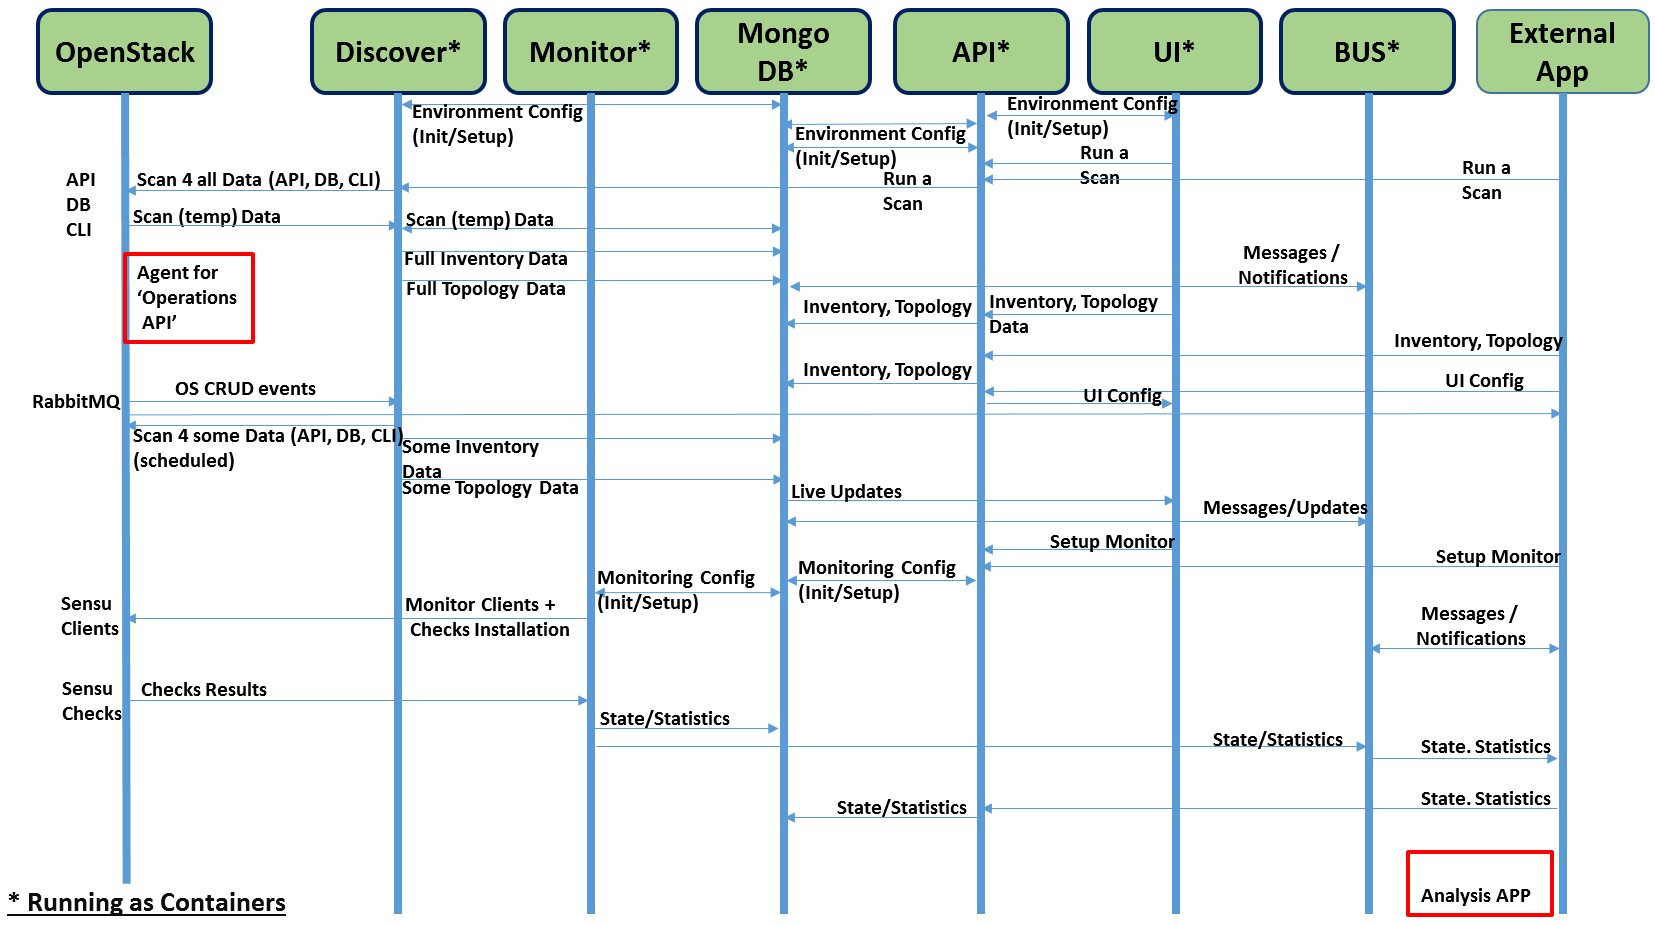
Copyright (c) 2017 Koren Lev (Cisco Systems), Yaron Yogev (Cisco Systems) and others All rights reserved. This program and the accompanying materials are made available under the terms of the Apache License, Version 2.0 which accompanies this distribution, and is available at http://www.apache.org/licenses/LICENSE-2.0
Project “Calipso” tries to illuminate complex virtual networking with real time operational state visibility for large and highly distributed Virtual Infrastructure Management (VIM).
We believe that Stability is driven by accurate Visibility.
Calipso provides visible insights using smart discovery and virtual topological representation in graphs, with monitoring per object in the graph inventory to reduce error vectors and troubleshooting, maintenance cycles for VIM operators and administrators.
Table of Contents
Calipso.io API Guide 1
1 Pre Requisites 3
1.1 Calipso API container 3
2 Overview 3
2.1 Introduction 3
2.2 HTTP Standards 4
2.3 Calipso API module Code 4
3 Starting the Calipso API server 4
3.1 Authentication 4
3.2 Database 5
3.3 Running the API Server 5
4 Using the Calipso API server 6
4.1 Authentication 6
4.2 Messages 9
4.3 Inventory 14
4.4 Links 17
4.5 Cliques 20
4.6 Clique_types 23
4.7 Clique_constraints 26
4.8 Scans 29
4.9 Scheduled_scans 32
4.10 Constants 35
4.11 Monitoring_Config_Templates 37
4.12 Aggregates 39
4.13 Environment_configs 42
Calipso’s main application is written with Python3.5 for Linux Servers, tested successfully on Centos 7.3 and Ubuntu 16.04. When running using micro-services many of the required software packages and libraries are delivered per micro service, including the API module case. In a monolithic case dependencies are needed.
Here is a list of the required software packages for the API, and the official supported steps required to install them:
Python3.5.x for Linux : https://docs.python.org/3.5/using/unix.html#on-linux
Pip for Python3 : https://docs.python.org/3/installing/index.html
Python3 packages to install using pip3 :
falcon (1.1.0)
pymongo (3.4.0)
gunicorn (19.6.0)
ldap3 (2.1.1)
setuptools (34.3.2)
python3-dateutil (2.5.3-2)
bcrypt (3.1.1)
You should use pip3 python package manager to install the specific version of the library. Calipso project uses Python 3, so package installation should look like this:
pip3 install falcon==1.1.0
The versions of the Python packages specified above are the ones that were used in the development of the API, other versions might also be compatible.
This document describes how to setup Calipso API container for development against the API.
The Calipso API provides access to the Calipso data stored in the MongoDB.
Calispo API uses falcon (https://falconframework.org) web framework and gunicorn (http://gunicorn.org) WSGI server.
The authentication of the Calipso API is based on LDAP (Lightweight Directory Access Protocol). It can therefore interface with any directory servers which implements the LDAP protocol, e.g. OpenLDAP, Active Directory etc. Calipso app offers and uses the LDAP built-in container by default to make sure this integration is fully tested, but it is possible to interface to other existing directories.
The Calipso API supports standard HTTP methods described here: https://www.w3.org/Protocols/rfc2616/rfc2616-sec9.html.At present two types of operations are supported: GET (retrieve data) and POST (create a new data object).
Clipso API code is currently located in opnfv repository.
Run the following command to get the source code:
git clone **https://git.opnfv.org/calipso/**
The source code of the API is located in the app/api directory sub-tree.
Calipso API uses LDAP as the protocol to implement the authentication, so you can use any LDAP directory server as the authentication backend, like OpenLDAP and Microsoft AD. You can edit the ldap.conf file which is located in app/config directory to configure LDAP server options (see details in quickstart-guide):
# url for connecting to the LDAP server (customize to your own as needed):url ldap_url# LDAP attribute mapped to user id, must not be a multivalued attributes:user_id_attribute CN# LDAP attribute mapped to user password:user_pass_attribute userPassword# LDAP objectclass for useruser_objectclass inetOrgPerson# Search base for usersuser_tree_dn OU=Employees,OU=Example Users,DC=exmaple,DC=comquery_scope one# Valid options for tls_req_cert are demand, never, and allowtls_req_cert demand# CA certificate file path for communicating with LDAP servers.tls_cacertfile ca_cert_file_pathgroup_member_attribute memberCalipso currently implements the basic authentication, the client send the query request with its username and password in the auth header, if the user can be bound to the LDAP server, authentication succeeds otherwise fails. Other methods will be supported in future releases.
Calipso API query for and retrieves data from MongoDB container, the data in the MongoDB comes from the results of Calipso scanning, monitoring or the user inputs from the API. All modules of a single Calipso instance of the application must point to the same MongoDB used by the scanning and monitoring modules. Installation and testing of mongoDB is covered in install-guide and quickstart-guide.
The entry point (initial command) running the Calipso API application is the server.py script in the app/api directory. Options for running the API server can be listed using: python3 server.py –help. Here is the current options available:
-m [MONGO_CONFIG], –mongo_config [MONGO_CONFIG]name of config file with mongo access details–ldap_config [LDAP_CONFIG]name of the config file with ldap server configdetails-l [LOGLEVEL], –loglevel [LOGLEVEL] logging level (default: ‘INFO’)-b [BIND], –bind [BIND]binding address of the API server (default: 127.0.0.1:8000)-y [INVENTORY], –inventory [INVENTORY]name of inventory collection (default: ‘inventory’)For testing, you can simply run the API server by:
python3 app/api/server.py
This will start a HTTP server listening on http://localhost:8000, if you want to change the binding address of the server, you can run it using this command:
python3 server.py –bind ip_address/server_name:port_number
You can also use your own configuration files for LDAP server and MongoDB, just add –mongo_config and –ldap_config options in your command:
python3 server.py –mongo_config your_mongo_config_file_path –ldap_config your_ldap_config_file_path
—inventory option is used to set the collection names the server uses for the API, as per the quickstart-guide this will default to /local_dir/calipso_mongo_access.conf and /local_dir/ldap.conf mounted inside the API container.
Notes: the –inventory argument can only change the collection names of the inventory, links, link_types, clique_types, clique_constraints, cliques, constants and scans collections, names of the monitoring_config_templates, environments_config and messages collections will remain at the root level across releases.
The following covers the currently available requests and responses on the Calipso API
POST /auth/tokens
Description: get token with password and username or a valid token.
Normal response code: 201
Error response code: badRequest(400), unauthorized(401)
Request
| Name | In | Type | Description |
|---|---|---|---|
| auth(Mandatory) | body | object | An auth object that contains the authentication information |
| methods(Mandatory) | body | array | The authentication methods. For password authentication, specify password, for token authentication, specify token. |
| credentials(Optional) | body | object | Credentials object which contains the username and password, it must be provided when getting the token with user credentials. |
| token(Optional) | body | string | The token of the user, it must be provided when getting the user with an existing valid token. |
Response
| Name | In | Type | Description |
|---|---|---|---|
| token | body | string | Token for the user. |
| issued-at | body | string | The date and time when the token was issued. the date and time format follows *ISO 8610*: YYYY-MM-DDThh:mm:ss.sss+hhmm |
| expires_at | body | string | The date and time when the token expires. the date and time format follows *ISO 8610*: YYYY-MM-DDThh:mm:ss.sss+hhmm |
| method | body | string | The method which achieves the token. |
** Examples**
Get token with credentials:
Post *http://korlev-osdna-staging1.cisco.com:8000/auth/tokens*
Get token with token
post http://korlev-calipso-staging1.cisco.com:8000/auth/tokens
DELETE /auth/tokens
Description: delete token with a valid token.
Normal response code: 200
Error response code: badRequest(400), unauthorized(401)
Request
| Name | In | Type | Description |
|---|---|---|---|
| X-Auth-Token | header | string | A valid authentication token that is doing to be deleted. |
Response
200 OK will be returned when the delete succeed
GET /messages
Description: get message details with environment name and message id, or get a list of messages with filters except id.
Normal response code: 200
Error response code: badRequest(400), unauthorized(401), notFound(404)
Request
| Name | In | Type | Description |
|---|---|---|---|
| env_name(Mandatory) | query | string | Environment name of the messages. e.g. “Mirantis-Liberty-API”. |
| id (Optional) | query | string | ID of the message. |
| source_system (Optional) | query | string | Source system of the message, e.g. “OpenStack”. |
| start_time (Optional) | query | string | Start time of the messages, when this parameter is specified, the messages after that time will be returned, the date and time format follows *ISO 8610: * YYYY-MM-DDThh:mm:ss.sss+hhmm The +hhmm value, if included, returns the time zone as an offset from UTC, For example, 2017-01-25T09:45:33.000-0500. If you omit the time zone, the UTC time is assumed. |
| end_time (Optional) | query | string | End time of the message, when this parameter is specified, the messages before that time will be returned, the date and time format follows *ISO 8610*: YYYY-MM-DDThh:mm:ss.sss+hhmm The +hhmm value, if included, returns the time zone as an offset from UTC, For example, 2017-01-25T09:45:33.000-0500. If you omit the time zone, the UTC time is assumed. |
| level (Optional) | query | string | The severity of the messages, we accept the severities strings described in *RFC 5424*, possible values are “panic”, “alert”, “crit”, “error”, “warn”, “notice”, “info” and “debug”. |
| related_object (Optional) | query | string | ID of the object related to the message. |
| related_object_type (Optional) | query | string | Type of the object related to the message, possible values are “vnic”, “vconnector”, “vedge”, “instance”, “vservice”, “host_pnic”, “network”, “port”, “otep” and “agent”. |
| page (Optional) | query | int | Which page will to be returned, the default is first page, if the page is larger than the maximum page of the query, and it will return an empty result set (Page start from 0). |
| page_size (Optional) | query | int | Size of each page, the default is 1000. |
Response
| Name | In | Type | Description |
|---|---|---|---|
| environment | body | string | Environment name of the message. |
| id | body | string | ID of the message. |
| _id | body | string | MongoDB ObjectId of the message. |
| timestamp | body | string | Timestamp of message. |
| viewed | body | boolean | Indicates whether the message has been viewed. |
| display_context | body | string | The content which will be displayed. |
| message | body | object | Message object. |
| source_system | body | string | Source system of the message, e.g. “OpenStack”. |
| level | body | string | The severity of the message. |
| related_object | body | string | Related object of the message. |
| related_object_type | body | string | Type of the related object. |
| messages | body | array | List of message ids which match the filters. |
Examples
Example Get Messages
Request:
Response:
{”level”: “info”,”environment”: “Mirantis-Liberty”,”id”: “3c64fe31-ca3b-49a3-b5d3-c485d7a452e7”,”source_system”: “OpenStack”},{”level”: “info”,”environment”: “Mirantis-Liberty”,”id”: “c7071ec0-04db-4820-92ff-3ed2b916738f”,”source_system”: “OpenStack”},
Example Get Message Details
Request
Response
GET /inventory** **
Description: get object details with environment name and id of the object, or get a list of objects with filters except id.
Normal response code: 200
Error response code: badRequest(400), unauthorized(401), notFound(404)
Request
| Name | In | Type | Description |
|---|---|---|---|
| env_name (Mandatory) | query | string | Environment of the objects. e.g. “Mirantis-Liberty-API”. |
| id (Optional) | query | string | ID of the object. e.g. “*node-2.cisco.com*”. |
| parent_id (Optional) | query | string | ID of the parent object. e.g. “nova”. |
| id_path (Optional) | query | string | ID path of the object. e.g. “/Mirantis-Liberty-API/Mirantis-Liberty-API-regions/RegionOne/RegionOne-availability_zones/nova/*node-2.cisco.com*”. |
| parent_path (Optional) | query | string | ID path of the parent object. “/Mirantis-Liberty-API/Mirantis-Liberty-API-regions/RegionOne/RegionOne-availability_zones/nova”. |
| sub_tree (Optional) | query | boolean | If it is true and the parent_path is specified, it will return the whole sub-tree of that parent object which includes the parent itself, If it is false and the parent_path is specified, it will only return the siblings of that parent (just the children of that parent node), the default value of sub_tree is false. |
| page (Optional) | query | int | Which page is to be returned, the default is the first page, if the page is larger than the maximum page of the query, it will return an empty set, (page starts from 0). |
| page_size (Optional) | query | int | Size of each page, the default is 1000. |
Response
| Name | In | Type | Description |
|---|---|---|---|
| environment | body | string | Environment name of the object. |
| id | body | string | ID of the object. |
| _id | body | string | MongoDB ObjectId of the object. |
| type | body | string | Type of the object. |
| parent_type | body | string | Type of the parent object. |
| parent_id | body | string | ID of the parent object. |
| name_path | body | string | Name path of the object. |
| last_scanned | body | string | Time of last scanning. |
| name | body | string | Name of the object. |
| id_path | body | string | ID path of the object. |
| objects | body | array | The list of object IDs that match the filters. |
Examples
Example Get Objects
Request
Response
{
“objects”: [
{”id”: “Mirantis-Liberty-regions”,”name”: “Regions”,”name_path”: “/Mirantis-Liberty/Regions”},{”id”: “Mirantis-Liberty-projects”,”name”: “Projects”,”name_path”: “/Mirantis-Liberty/Projects”}]
}
Examples Get Object Details
Request
Response
GET /links
Description: get link details with environment name and id of the link, or get a list of links with filters except id
Normal response code: 200
Error response code: badRequest(400), unauthorized(401), notFound(404)
Request
| Name | In | Type | Description |
|---|---|---|---|
| env_name (Mandatory) | query | string | Environment of the links. e.g. “Mirantis-Liberty-API”. |
| id (Optional) | query | string | ID of the link, it must be a string which can be converted to MongoDB ObjectId. |
| host (Optional) | query | string | Host of the link. e.g. “*node-1.cisco.com*”. |
| link_type (Optional) | query | string | Type of the link, some possible values for that are “instance-vnic”, “otep-vconnector”, “otep-host_pnic”, “host_pnic-network”, “vedge-otep”, “vnic-vconnector”, “vconnector-host_pnic”, “vnic-vedge”, “vedge-host_pnic” and “vservice-vnic” . |
| link_name (Optional) | query | string | Name of the link. e.g. “Segment-2”. |
| source_id (Optional) | query | string | ID of the source object of the link. e.g. “qdhcp-4f4bf8b5-ca42-411a-9f64-5b214d1f1c71”. |
| target_id (Optional) | query | string | ID of the target object of the link. “tap708d399a-20”. |
| state (Optional) | query | string | State of the link, “up” or “down”. |
| attributes | query | object | The attributes of the link, e.g. the network attribute of the link is attributes:network=”4f4bf8b5-ca42-411a-9f64-5b214d1f1c71”. |
| page (Optional) | query | int | Which page is to be returned, the default is first page, when the page is larger than the maximum page of the query, it will return an empty set. (Page starts from 0). |
| page_size (Optional) | query | int | Size of each page, the default is 1000. |
Response
| Name | In | Type | Description |
|---|---|---|---|
| id | body | string | ID of the link. |
| _id | body | string | MongoDB ObjectId of the link. |
| environment | body | string | Environment of the link. |
| source_id | body | string | ID of the source object of the link. |
| target_id | body | string | ID of the target object of the link. |
| source | body | string | MongoDB ObjectId of the source object. |
| target | body | string | MongoDB ObjectId of the target object. |
| source_label | body | string | Descriptive text for the source object. |
| target_label | body | string | Descriptive text for the target object. |
| link_weight | body | string | Weight of the link. |
| link_type | body | string | Type of the link, some possible values for that are “instance-vnic”, “otep-vconnector”, “otep-host_pnic”, “host_pnic-network”, “vedge-otep”, “vnic-vconnector”, “vconnector-host_pnic”, “vnic-vedge”, “vedge-host_pnic” and “vservice-vnic”. |
| state | body | string | State of the link, “up” or “down”. |
| attributes | body | object | The attributes of the link. |
| links | body | array | List of link IDs which match the filters. |
Examples
Example Get Link Ids
Request
Response
{
“links”: [
{“id”: “58ca73ae3a8a836d10ff3b45”,“host”: “*node-1.cisco.com*”,“link_type”: “host_pnic-network”,“link_name”: “Segment-103”,“environment”: “Mirantis-Liberty”}
]
}
Example Get Link Details
Request
Response
GET /cliques
Description: get clique details with environment name and clique id, or get a list of cliques with filters except id
Normal response code: 200
Error response code: badRequest(400), unauthorized(401), notFound(404)
Request
| Name | In | Type | Description |
|---|---|---|---|
| env_name (Mandatory) | query | string | Environment of the cliques. e.g. “Mirantis-Liberty-API”. |
| id (Optional) | query | string | ID of the clique, it must be a string that can be converted to Mongo ObjectID. |
| focal_point (Optional) | query | string | MongoDB ObjectId of the focal point object, it must be a string that can be converted to Mongo ObjectID. |
| focal_point_type (Optional) | query | string | Type of the focal point object, some possible values are “vnic”, “vconnector”, “vedge”, “instance”, “vservice”, “host_pnic”, “network”, “port”, “otep” and “agent”. |
| link_type(Optional) | query | string | Type of the link, when this filter is specified, it will return all the cliques which contain the specific type of the link, some possible values for link_type are ”instance-vnic”, “otep-vconnector”, “otep-host_pnic”, “host_pnic-network”, “vedge-otep”, “vnic-vconnector”, “vconnector-host_pnic”, “vnic-vedge”, “vedge-host_pnic” and “vservice-vnic”. |
| link_id (Optional) | query | string | MongoDB ObjectId of the link, it must be a string that can be converted to MongoDB ID, when this filter is specified, it will return all the cliques which contain that specific link. |
| page (Optional) | query | int | The page is to be returned, the default is the first page, if the page is larger than the maximum page of the query, it will return an empty set. (Page starts from 0). |
| page_size (Optional) | query | int | The size of each page, the default is 1000. |
Response
| Name | In | Type | Description |
|---|---|---|---|
| id | body | string | ID of the clique. |
| _id | body | string | MongoDB ObjectId of the clique. |
| environment | body | string | Environment of the clique. |
| focal_point | body | string | Object ID of the focal point. |
| focal_point_type | body | string | Type of the focal point object, e.g. “vservice”. |
| links | body | array | List of MongoDB ObjectIds of the links in the clique. |
| links_detailed | body | array | Details of the links in the clique. |
| constraints | body | object | Constraints of the clique. |
| cliques | body | array | The list of clique ids that match the filters. |
Examples
Example Get Cliques
Request
*http://10.56.20.32:8000/cliques?env_name=Mirantis-Liberty-API&link_id=58a2405a6a283a8bee15d42f*
Response
{
“cliques”: [
{“link_types”: [“instance-vnic”,“vservice-vnic”,“vnic-vconnector”],”environment”: “Mirantis-Liberty”,”focal_point_type”: “vnic”,”id”: “576c119a3f4173144c7a75c5”},{”link_types”: [”vnic-vconnector”,”vconnector-vedge”],”environment”: “Mirantis-Liberty”,”focal_point_type”: “vconnector”,”id”: “576c119a3f4173144c7a75c6”}]
}
Example Get Clique Details
Request
Response
}
GET /clique_types
Description: get clique_type details with environment name and clique_type id, or get a list of clique_types with filters except id
Normal response code: 200
Error response code: badRequest(400), unauthorized(401), notFound(404)
Request
| Name | In | Type | Description |
|---|---|---|---|
| env_name | query | string | Environment of the clique_types. e.g. “Mirantis-Liberty-API” |
| id | query | string | ID of the clique_type, it must be a string that can be converted to the MongoDB ObjectID. |
| focal_point_type (Optional) | query | string | Type of the focal point object, some possible values for it are ”vnic”, “vconnector”, “vedge”, “instance”, “vservice”, “host_pnic”, “network”, “port”, “otep” and “agent”. |
| link_type(Optional) | query | string | Type of the link, when this filter is specified, it will return all the clique_types which contain the specific link_type in its link_types array. Some possible values of the link_type are ”instance-vnic”, “otep-vconnector”, “otep-host_pnic”, “host_pnic-network”, “vedge-otep”, “vnic-vconnector”, “vconnector-host_pnic”, “vnic-vedge”, “vedge-host_pnic” and “vservice-vnic”. Repeat link_type several times to specify multiple link_types, e.g link_type=instance-vnic&link_type=host_pnic-network. |
| page_size(Optional) | query | int | Size of each page, the default is 1000. |
| page (Optional) | query | int | Which page is to be returned, the default is first page, if the page is larger than the maximum page of the query, it will return an empty result set. (Page starts from 0). |
Response
| Name | In | Type | Description |
|---|---|---|---|
| id | body | string | ID of the clique_type. |
| _id | body | string | MongoDB ObjectId of the clique_type |
| environment | body | string | Environment of the clique_type. |
| focal_point_type | body | string | Type of the focal point, e.g. “vnic”. |
| link_types | body | array | List of link_types of the clique_type. |
| name | body | string | Name of the clique_type. |
| clique_types | body | array | List of clique_type ids of clique types that match the filters. |
Examples
Example Get Clique_types
Request
*** ***http://korlev-calipso-testing.cisco.com:8000/clique_types?env_name=Mirantis-Liberty-API&link_type=instance-vnic&page_size=3&link_type=host_pnic-network
{
“clique_types”: [
{”environment”: “Mirantis-Liberty”,”focal_point_type”: “host_pnic”,”id”: “58ca73ae3a8a836d10ff3b80”}]
}
Example Get Clique_type Details
Request
Response
POST /clique_types
Description: Create a new clique_type
Normal response code: 201(Created)
Error response code: badRequest(400), unauthorized(401), conflict(409)
Request
| Name | In | Type | Description |
|---|---|---|---|
| environment(Mandatory) | body | string | Environment of the system, the environment must be the existing environment in the system. |
| focal_point_type(Mandatory) | body | string | Type of the focal point, some possible values are ”vnic”, “vconnector”, “vedge”, “instance”, “vservice”, “host_pnic”, “network”, “port”, “otep” and “agent”. |
| link_types(Mandatory) | body | array | Link_types of the clique_type, some possible values of the link_type are ”instance-vnic”, “otep-vconnector”, “otep-host_pnic”, “host_pnic-network”, “vedge-otep”, “vnic-vconnector”, “vconnector-host_pnic”, “vnic-vedge”, “vedge-host_pnic” and “vservice-vnic” |
| name(Mandatory) | body | string | Name of the clique type, e.g. “instance_vconnector_clique” |
Request Example
post http://korlev-calipso-testing.cisco.com:8000/clique_types
Response
Successful Example
GET /clique_constraints
Description: get clique_constraint details with clique_constraint id, or get a list of clique_constraints with filters except id.
Normal response code: 200
Error response code: badRequest(400), unauthorized(401), notFound(404)
Note: this is not environment specific so query starts with parameter, not env_name (as with all others), example:
http://korlev-calipso-testing.cisco.com:8000/clique_constraints?focal_point_type=instance
Request
| Name | In | Type | Description |
|---|---|---|---|
| id (Optional) | query | string | ID of the clique_constraint, it must be a string that can be converted to MongoDB ObjectId. |
| focal_point_type (Optional) | query | string | Type of the focal_point, some possible values for that are ”vnic”, “vconnector”, “vedge”, “instance”, “vservice”, “host_pnic”, “network”, “port”, “otep” and “agent”. |
| constraint(Optional) | query | string | Constraint of the cliques, repeat this filter several times to specify multiple constraints. e.g constraint=network&constraint=host_pnic. |
| page (Optional) | query | int | Which page is to be returned, the default is the first page, if the page is larger than the maximum page of the query, the last page will be returned. (Page starts from 0.) |
| page_size (Optional) | query | int | Size of each page, the default is 1000 |
Response
| Name | In | Type | Description |
|---|---|---|---|
| id | body | string | Object id of the clique constraint. |
| _id | body | string | MongoDB ObjectId of the clique_constraint. |
| focal_point_type | body | string | Type of the focal point object. |
| constraints | body | array | Constraints of the clique. |
| clique_constraints | body | array | List of clique constraints ids that match the filters. |
Examples
Example Get Clique_constraints
Request
Response
{
”clique_constraints”: [
{”id”: “576a4176a83d5313f21971f5”},{“id”: “576ac7069f6ba3074882b2eb”}
]
}
Example Get Clique_constraint Details
Request
http://korlev-calipso-testing.cisco.com:8000/clique_constraints?id=576a4176a83d5313f21971f5
GET /scans
Description: get scan details with environment name and scan id, or get a list of scans with filters except id
Normal response code: 200
Error response code: badRequest (400), unauthorized (401), notFound(404)
Request
| Name | In | Type | Description |
|---|---|---|---|
| env_name (Mandatory) | query | string | Environment of the scans. e.g. “Mirantis-Liberty”. |
| id (Optional) | query | string | ID of the scan, it must be a string that can be converted MongoDB ObjectId. |
| base_object(Optional) | query | string | ID of the scanned base object. e.g. “*node-2.cisco.com*”. |
| status (Optional) | query | string | Status of the scans, the possible values for the status are ”draft”, “pending”, “running”, “completed”, “failed” and “aborted”. |
| page (Optional) | query | int | Which page is to be returned, the default is the first page, if the page is larger than the maximum page of the query, it will return an empty set. (Page starts from 0.) |
| page_size (Optional) | query | int | Size of each page, the default is 1000. |
Response
| Name | In | Type | Description |
|---|---|---|---|
| status | body | string | The current status of the scan, possible values are “draft”, “pending”, “running”, “completed”, “failed” and “aborted”. |
| log_level | body | string | Logging level of the scanning, the possible values are “CRITICAL”, “ERROR”, “WARNING”, “INFO”, “DEBUG” and “NOTSET”. |
| clear | body | boolean | Indicates whether it needs to clear all the data before scanning. |
| scan_only_inventory | body | boolean | Only scan and store data in the inventory. |
| scan_only_links | body | boolean | Limit the scan to find only missing links. |
| scan_only_cliques | body | boolean | Limit the scan to find only missing cliques. |
| scan_completed | body | boolean | Indicates if the scan completed |
| submit_timestamp | body | string | Submit timestamp of the scan |
| environment | body | string | Environment name of the scan |
| inventory | body | string | Name of the inventory collection. |
| object_id | body | string | Base object of the scan |
Examples
Example Get Scans
Request
Response
]
}
Example Get Scan Details
Request
Response
POST /scans
Description: create a new scan (ask calipso to scan an environment for detailed data gathering).
Normal response code: 201(Created)
Error response code: badRequest (400), unauthorized (401)
Request
| Name | In | Type | Description |
|---|---|---|---|
| status (mandatory) | body | string | The current status of the scan, possible values are “draft”, “pending”, “running”, “completed”, “failed” and “aborted”. |
| log_level (optional) | body | string | Logging level of the scanning, the possible values are “critical”, “error”, “warning”, “info”, “debug” and “notset”. |
| clear (optional) | body | boolean | Indicates whether it needs to clear all the data before scanning. |
| scan_only_inventory (optional) | body | boolean | Only scan and store data in the inventory. |
| scan_only_links (optional) | body | boolean | Limit the scan to find only missing links. |
| scan_only_cliques (optional) | body | boolean | Limit the scan to find only missing cliques. |
| environment (mandatory) | body | string | Environment name of the scan |
| inventory (optional) | body | string | Name of the inventory collection. |
| object_id (optional) | body | string | Base object of the scan |
Request Example
post http://korlev-calipso-testing.cisco.com:8000/*scans*
Response
Successful Example
GET /scheduled_scans
Description: get scheduled_scan details with environment name and scheduled_scan id, or get a list of scheduled_scans with filters except id
Normal response code: 200
Error response code: badRequest (400), unauthorized (401), notFound(404)
Request
| Name | In | Type | Description |
|---|---|---|---|
| environment(Mandatory) | query | string | Environment of the scheduled_scans. e.g. “Mirantis-Liberty”. |
| id (Optional) | query | string | ID of the scheduled_scan, it must be a string that can be converted to MongoDB ObjectId. |
| freq (Optional) | query | string | Frequency of the scheduled_scans, the possible values for the freq are ”HOURLY”, “DAILY”, “WEEKLY”, “MONTHLY”, and “YEARLY”. |
| page (Optional) | query | int | Which page is to be returned, the default is the first page, if the page is larger than the maximum page of the query, it will return an empty set. (Page starts from 0.) |
| page_size (Optional) | query | int | Size of each page, the default is 1000. |
Response
| Name | In | Type | Description |
|---|---|---|---|
| freq | body | string | The frequency of the scheduled_scan, possible values are “HOURLY”, “DAILY”, “WEEKLY”, “MONTHLY”, and “YEARLY”. |
| log_level | body | string | Logging level of the scheduled_scan, the possible values are “critical”, “error”, “warning”, “info”, “debug” and “notset”. |
| clear | body | boolean | Indicates whether it needs to clear all the data before scanning. |
| scan_only_inventory | body | boolean | Only scan and store data in the inventory. |
| scan_only_links | body | boolean | Limit the scan to find only missing links. |
| scan_only_cliques | body | boolean | Limit the scan to find only missing cliques. |
| submit_timestamp | body | string | Submitted timestamp of the scheduled_scan |
| environment | body | string | Environment name of the scheduled_scan |
| scheduled_timestamp | body | string | Scheduled time for the scanning, it should follows *ISO 8610: *YYYY-MM-DDThh:mm:ss.sss+hhmm |
Examples
Example Get Scheduled_scans
Request
http://korlev-calipso-testing.cisco.com:8000/scheduled_scans?environment=Mirantis-Liberty
Response
{
]
}
Example Get Scheduled_Scan Details
Request
Response
POST /scheduled_scans
Description: create a new scheduled_scan (request calipso to scan in a future date).
Normal response code: 201(Created)
Error response code: badRequest (400), unauthorized (401)
Request
| Name | In | Type | Description |
|---|---|---|---|
| log_level (optional) | body | string | Logging level of the scheduled_scan, the possible values are “critical”, “error”, “warning”, “info”, “debug” and “notset”. |
| clear (optional) | body | boolean | Indicates whether it needs to clear all the data before scanning. |
| scan_only_inventory (optional) | body | boolean | Only scan and store data in the inventory. |
| scan_only_links (optional) | body | boolean | Limit the scan to find only missing links. |
| scan_only_cliques (optional) | body | boolean | Limit the scan to find only missing cliques. |
| environment (mandatory) | body | string | Environment name of the scan |
| freq(mandatory) | body | string | The frequency of the scheduled_scan, possible values are “HOURLY”, “DAILY”, “WEEKLY”, “MONTHLY”, and “YEARLY”. |
| submit_timestamp(mandatory) | body | string | Submitted time for the scheduled_scan, it should follows *ISO 8610: *YYYY-MM-DDThh:mm:ss.sss+hhmm |
** Post** http://korlev-calipso-testing.cisco.com:8000/scheduled_scans
Response
Successful Example
GET /constants
Description: get constant details with name (constants are used by ui and event/scan managers)
Normal response code: 200
Error response code: badRequest(400), unauthorized(401), notFound(404)
Request
| Name | In | Type | Description |
|---|---|---|---|
| name (Mandatory) | query | string | Name of the constant. e.g. “distributions”. |
Response
| Name | In | Type | Description |
|---|---|---|---|
| id | body | string | ID of the constant. |
| _id | body | string | MongoDB ObjectId of the constant. |
| name | body | string | Name of the constant. |
| data | body | array | Data of the constant. |
Examples
Example Get Constant Details
Request
*http://korlev-osdna-testing.cisco.com:8000/constants?name=link_states*
Response
GET /monitoring_config_templates
Description: get monitoring_config_template details with template id, or get a list of templates with filters except id (see monitoring-guide).
Normal response code: 200
Error response code: badRequest(400), unauthorized(401), notFound(404)
Request
| Name | In | Type | Description |
|---|---|---|---|
| id (Optional) | query | string | ID of the monitoring config template, it must be a string that can be converted MongoDB ObjectId |
| order (Optional) | query | int | Order by which templates are applied, 1 is the OSDNA default template. Templates that the user added later we use higher order and will override matching attributes in the default templates or add new attributes. |
| side (Optional) | query | string | The side which runs the monitoring, the possible values are “client” and “server”. |
| type (Optional) | query | string | The name of the config file, e.g. “client.json”. |
| page (Optional) | query | int | Which page is to be returned, the default is the first page, if the page is larger than the maximum page of the query, it will return an empty result set. (Page starts from 0). |
| page_size(Optional) | query | int | Size of each page, the default is 1000. |
Response
| Name | In | Type | Description |
|---|---|---|---|
| id | body | string | ID of the monitoring_config_template. |
| _id | body | srting | MongoDB ObjectId of the monitoring_config_template. |
| monitoring_system | body | string | System that we use to do the monitoring, e.g, “Sensu”. |
| order | body | string | Order by which templates are applied, 1 is the OSDNA default templates. Templates that the user added later we use higher order and will override matching attributes in the default templates or add new attributes. |
| config | body | object | Configuration of the monitoring. |
| side | body | string | The side which runs the monitoring. |
| type | body | string | The name of the config file, e.g. “client.json”. |
Examples
Example Get Monitoring_config_templates
Request
Response
{“type”: “rabbitmq.json”,“side”: “client”,“id”: “583711893e149c14785d6daa”}
Example Get Monitoring_config_template Details
Request
http://korlev-calipso-testing.cisco.com:8000/monitoring_config_templates?id=583711893e149c14785d6daa
Response
GET /aggregates
Description: List some aggregated information about environment, message or constant.
Normal response code: 200
Error response code: badRequest(400), unauthorized(401), notFound(404)
Request
| Name | In | Type | Description |
|---|---|---|---|
| env_name (Optional) | query | string | Environment name, if the aggregate type is “environment”, this value must be specified. |
| type (Optional) | query | string | Type of aggregate, currently we support three types of aggregate, “environment”, “message” and “constant”. |
Response
| Name | In | Type | Description |
|---|---|---|---|
| type | body | string | Type of aggregate, we support three types of aggregates now, “environment”, “message” and “constant”. |
| env_name (Optional) | body | string | Environment name of the aggregate, when the aggregate type is “environment”, this attribute will appear. |
| aggregates | body | object | The aggregates information. |
Examples
Example Get Environment Aggregate
Request
Response
Example Get Messages Aggregate
Request
http://korlev-calipso-testing.cisco.com:8000/aggregates?type=message
Response
{
“type”: “message”,
“aggregates”: {
”levels”: {
“warn”: 5,
“info”: 10,
“error”: 10
},
“environments”: {
“Mirantis-Liberty-API”: 5,
“Mirantis-Liberty”: 10
}
}
}
Example Get Constants Aggregate
Request
http://korlev-calipso-testing.cisco.com:8000/aggregates?type=constant
Response
GET /environment_configs
Description: get environment_config details with name, or get a list of environments_config with filters except name
Normal response code: 200
Error response code: badRequest(400), unauthorized(401), notFound(404)
Request
| Name | In | Type | Description |
|---|---|---|---|
| name(Optional) | query | string | Name of the environment. |
| distribution(Optional) | query | string | The distribution of the OpenStack environment, it must be one of the distributions we support, e.g “Mirantis-8.0”.(you can get all the supported distributions by querying the distributions constants) |
| mechanism_drivers(Optional) | query | string | The mechanism drivers of the environment, it should be one of the drivers in mechanism_drivers constants, e.g “ovs”. |
| type_drivers(Optional) | query | string | ‘flat’, ‘gre’, ‘vlan’, ‘vxlan’. |
| user(Optional) | query | string | name of the environment user |
| listen(Optional) | query | boolean | Indicates whether the environment is being listened. |
| scanned(Optional) | query | boolean | Indicates whether the environment has been scanned. |
| monitoring_setup_done(Optional) | query | boolean | Indicates whether the monitoring setup has been done. |
| operational(Optional) | query | string | operational status of the environment, the possible statuses are “stopped”, “running” and “error”. |
| page(Optional) | query | int | Which page is to be returned, the default is the first page, if the page is larger than the maximum page of the query, it will return an empty result set. (Page starts from 0). |
| page_size(Optional) | query | int | Size of each page, the default is 1000. |
Response
| Name | In | Type | Description |
|---|---|---|---|
| configuration | body | array | List of configurations of the environment, including configurations of mysql, OpenStack, CLI, AMQP and Monitoring. |
| distribution | body | string | The distribution of the OpenStack environment, it must be one of the distributions we support, e.g “Mirantis-8.0”. |
| last_scanned | body | string | The date of last time scanning the environment, the format of the date is MM/DD/YY. |
| mechanism_dirvers | body | array | The mechanism drivers of the environment, it should be one of the drivers in mechanism_drivers constants. |
| monitoring_setup_done | body | boolean | Indicates whether the monitoring setup has been done. |
| name | body | string | Name of the environment. |
| operational | body | boolean | Indicates if the environment is operational. |
| scanned | body | boolean | Indicates whether the environment has been scanned. |
| type | body | string | Production, testing, development, etc. |
| type_drivers | body | string | ‘flat’, ‘gre’, ‘vlan’, ‘vxlan’. |
| user | body | string | The user of the environment. |
| listen | body | boolean | Indicates whether the environment is being listened. |
Examples
Example Get Environments config
Request
http://korlev-calipso-testing.cisco.com:8000/environment_configs?mechanism_drivers=ovs
{“distribution”: “Canonical-icehouse”,“name”: “thundercloud”}
Example Environment config Details
Request
http://korlev-calipso-testing.cisco.com:8000/environment_configs?name=Mirantis-Mitaka-2
Response
POST /environment_configs
Description: create a new environment configuration.
Normal response code: 201(Created)
Error response code: badRequest(400), unauthorized(401), notFound(404), conflict(409)
Request
| Name | In | Type | Description |
|---|---|---|---|
| configuration(Mandatory) | body | array | List of configurations of the environment, including configurations of mysql(mandatory), OpenStack(mandatory), CLI(mandatory), AMQP(mandatory) and Monitoring(Optional). |
| distribution(Mandatory) | body | string | The distribution of the OpenStack environment, it must be one of the distributions we support, e.g “Mirantis-8.0”.(you can get all the supported distributions by querying the distributions constants) |
| last_scanned(Optional) | body | string | The date and time of last scanning, it should follows *ISO 8610: * YYYY-MM-DDThh:mm:ss.sss+hhmm |
| mechanism_dirvers(Mandatory) | body | array | The mechanism drivers of the environment, it should be one of the drivers in mechanism_drivers constants, e.g “OVS”. |
| name(Mandatory) | body | string | Name of the environment. |
| operational(Mandatory) | body | boolean | Indicates if the environment is operational. e.g. true. |
| scanned(Optional) | body | boolean | Indicates whether the environment has been scanned. |
| listen(Mandatory) | body | boolean | Indicates if the environment need to been listened. |
| user(Optional) | body | string | The user of the environment. |
| app_path(Mandatory) | body | string | The path that the app is located in. |
| type(Mandatory) | body | string | Production, testing, development, etc. |
| type_drivers(Mandatory) | body | string | ‘flat’, ‘gre’, ‘vlan’, ‘vxlan’. |
Request Example
Post http://korlev-calipso-testing:8000/environment_configs
Response
Successful Example
Copyright (c) 2017 Koren Lev (Cisco Systems), Yaron Yogev (Cisco Systems) and others All rights reserved. This program and the accompanying materials are made available under the terms of the Apache License, Version 2.0 which accompanies this distribution, and is available at http://www.apache.org/licenses/LICENSE-2.0
Project “Calipso” tries to illuminate complex virtual networking with real time operational state visibility for large and highly distributed Virtual Infrastructure Management (VIM).
Calipso provides visible insights using smart discovery and virtual topological representation in graphs, with monitoring per object in the graph inventory to reduce error vectors and troubleshooting, maintenance cycles for VIM operators and administrators.
Calipso model, described in this document, was built for multi-environment and many VIM variances, the model was tested successfully (as of Aug 27th) against 60 different VIM variances (Distributions, Versions, Networking Drivers and Types).
Table of Contents
Calipso.io Objects Model 1
1 Environments config 4
2 Inventory objects 6
2.1 Host 6
2.2 physical NIC (pNIC) 7
2.3 Bond 7
2.4 Instance 7
2.5 virtual Service (vService) 7
2.6 Network 7
2.7 virtual NIC (vNIC) 7
2.8 Port 8
2.9 virtual Connector (vConnector) 8
2.10 virtual Edge (vEdge) 8
2.11 Overlay-Tunnel-Endpoint (OTEP) 8
2.12 Network_segment 8
2.13 Network_Agent 8
2.14 Looking up Calipso objects details 9
3 Link Objects 10
3.1 Link types 11
4 Clique objects 11
4.1 Clique types 11
5 Supported Environments 12
6 System collections 14
6.1 Attributes_for_hover_on_data 14
6.2 Clique_constraints 14
6.3 Connection_tests 14
6.4 Messages 14
6.5 Network_agent_types 14
6.6 Roles, Users 15
6.7 Statistics 15
6.8 Constants 15
6.9 Constants-env_types 15
6.10 Constants-log_levels 15
6.11 Constants-mechanism_drivers 15
6.12 Constants-type_drivers 15
6.13 Constants-environment_monitoring_types 15
6.14 Constants-link_states 15
6.15 Constants-environment_provision_types 15
6.16 Constants-environment_operational_status 16
6.17 Constants-link_types 16
6.18 Constants-monitoring_sides 16
6.19 Constants-object_types 16
6.20 Constants-scans_statuses 16
6.21 Constants-distributions 16
6.22 Constants-distribution_versions 16
6.23 Constants-message_source_systems 16
6.24 Constants-object_types_for_links 16
6.25 Constants-scan_object_types 17
Environment is defined as a certain type of Virtual Infrastructure facility the runs under a single unified Management (like an OpenStack facility).
Everything in Calipso application rely on environments config, this is maintained in the “environments_config” collection in the mongo Calipso DB.
Environment configs are pushed down to Calipso DB either through UI or API (and only in OPNFV case Calipso provides an automated program to build all needed environments_config parameters for an ‘Apex’ distribution automatically).
When scanning and discovering items Calipso uses this configuration document for successful scanning results, here is an example of an environment config document:
**{ **
**“name”: “DEMO-ENVIRONMENT-SCHEME”, **
**“enable_monitoring”: true, **
**“last_scanned”: “filled-by-scanning”, **
**“app_path”: “/home/scan/calipso_prod/app”, **
**“type”: “environment”, **
**“distribution”: “Mirantis”, **
**“distribution_version”: “8.0”, **
**“mechanism_drivers”: [“OVS”], **
“type_drivers”: “vxlan”
**“operational”: “stopped”, **
**“listen”: true, **
**“scanned”: false, **
“configuration”: [
{
**“name”: “OpenStack”, **
**“port”:”5000”, **
**“user”: “adminuser”, **
**“pwd”: “dummy_pwd”, **
**“host”: “10.0.0.1”, **
“admin_token”: “dummy_token”
**}, **
{
**“name”: “mysql”, **
**“pwd”: “dummy_pwd”, **
**“host”: “10.0.0.1”, **
**“port”: “3307”, **
“user”: “mysqluser”
**}, **
{
**“name”: “CLI”, **
**“user”: “sshuser”, **
**“host”: “10.0.0.1”, **
“pwd”: “dummy_pwd”
**}, **
{
**“name”: “AMQP”, **
**“pwd”: “dummy_pwd”, **
**“host”: “10.0.0.1”, **
**“port”: “5673”, **
“user”: “rabbitmquser”
**}, **
{
**“name”: “Monitoring”, **
**“ssh_user”: “root”, **
**“server_ip”: “10.0.0.1”, **
**“ssh_password”: “dummy_pwd”, **
**“rabbitmq_pass”: “dummy_pwd”, **
**“rabbitmq_user”: “sensu”, **
**“rabbitmq_port”: “5671”, **
**“provision”: “None”, **
**“env_type”: “production”, **
**“ssh_port”: “20022”, **
**“config_folder”: “/local_dir/sensu_config”, **
**“server_name”: “sensu_server”, **
**“type”: “Sensu”, **
“api_port”: NumberInt(4567)
**}, **
{
**“name”: “ACI”, **
**“user”: “admin”, **
**“host”: “10.1.1.104”, **
“pwd”: “dummy_pwd”
}
**], **
**“user”: “wNLeBJxNDyw8G7Ssg”, **
“auth”: {
“view-env”: [
“wNLeBJxNDyw8G7Ssg”
**], **
“edit-env”: [
“wNLeBJxNDyw8G7Ssg”
]
**}, **
}
Here is a brief explanation of the purpose of major keys in this environment configuration doc:
Distribution: captures type of VIM, used for scanning of objects, links and cliques.
Distribution_version: captures version of VIM distribution, used for scanning of objects, links and cliques.
Mechanism_driver: captures virtual switch type used by the VIM, used for scanning of objects, links and cliques.
Type_driver: captures virtual switch tunneling type used by the switch, used for scanning of objects, links and cliques.
Listen: defines whether or not to use Calipso listener against the VIM BUS for updating inventory in real-time from VIM events.
Scanned: defines whether or not Calipso ran a full and a successful scan against this environment.
Last_scanned: end time of last scan.
Operational: defines whether or not VIM environment endpoints are up and running.
Enable_monitoring: defines whether or not Calipso should deploy monitoring of the inventory objects running inside all environment hosts.
Configuration-OpenStack: defines credentials for OpenStack API endpoints access.
Configuration-mysql: defines credentials for OpenStack DB access.
Configuration-CLI: defines credentials for servers CLI access.
Configuration-AMQP: defines credentials for OpenStack BUS access.
Configuration-Monitoring: defines credentials and setup for Calipso sensu server (see monitoring-guide for details).
Configuration-ACI: defines credentials for ACI switched management API, if exists.
User and auth: used for UI authorizations to view and edit this environment.
App-path: defines the root directory of the scanning application.
Calipso’s success in scanning, discovering and analyzing many (60 as of 27th Aug 2017) variances of virtual infrastructures lies with its objects model and relationship definitions (model was tested even against a vSphere VMware environment).
Those objects are the real-time processes and systems that are built by workers and agents on the virtual infrastructure servers.
All Calipso objects are maintained in the “inventory” collection.
Here are the major objects defined in Calipso inventory in order to capture the real-time state of networking:
It’s the physical server that runs all virtual objects, typically a hypervisor or a containers hosting machine.
It’s typically a bare-metal server, in some cases it might be virtual (running “nesting” VMs as second virtualization layer inside it).
It’s the physical Ethernet Network Interface Card attached to the Host, typically several of those are available on a host, in some cases few of those are grouped (bundled) together into etherchannel bond interfaces.
For capturing data from real infrastructure devices Calipso created 2 types of pNICs: host_pnic (pNICs on the servers) and switch_pnic (pNICs on the physical switches). Calipso currently discovers host to switch physical connections only in some types of switches (Cisco ACI as of Aug 27th 2017).
It’s a logical Network Interface using etherchannel standard protocols to form a group of pNICs providing enhanced throughput for communications to/from the host.
Calipso currently maintains bond details inside a host_pnic object.
It’s the virtual server created for running a certain application or function. Typically it’s a Virtual Machine, sometimes it’s a Container.
It’s a process/system that provides some type of networking service to instances running on networks, some might be deployed as namespaces and some might deploy as VM or Container, for example: DHCP server, Router, Firewall, Load-Balancer, VPN service and others. Calipso categorized vServices accordingly.
It’s an abstracted object, illustrating and representing all the components (see below) that builds and provides communication services for several instances and vServices.
There are 2 types - instance vNIC and vService vNIC:
It’s an abstracted object representing the attachment point for an instance or a vService into the network, in reality it’s fulfilled by deployment of vNICs on hosts.
It’s a process/system that provides layer 2 isolation for a specific network inside the host (isolating traffic from other networks). Examples: Linux Bridge, Bridge-group, port-group etc.
It’s a process/system that provides switching and routing services for instances and/or vServices running on a specific host. It function as an edge device between virtual components running on that host and the pNICs on that host, making sure traffic is maintained and still isolated across different networks.
Examples: Open Virtual Switch, Midonet, VPP.
It’s an abstracted object representing the end-point on the host that runs a certain tunneling technology to provide isolation across networks and hosts for packets leaving and entering the pNICs of a specific host. Examples: VXLAN tunnels endpoints, GRE tunnels endpoints etc.
It’s the specific segment used inside the “overlay tunnel” to represent traffic from a specific network, this depends on the specific type (encapsulation) of the OTEP.
Calipso currently maintains segments details inside a network object.
It’s a controlling software running on the hosts for orchestrating the lifecycle of the above virtual components. Examples: DHCP agent, L3 agent, OVS agent, Metadata agent etc.
As explained in more details in Calipso admin-guide, the underlying database used is mongoDB. All major objects discovered by Calipso scanning module are maintained in the “inventory” collection and those document includes detailed attributes captured from the infrastructure about those objects, here are the main objects quarries to use for grabbing each of the above object types from Calipso’s inventory:
{type:”vnic”}
{type:”vservice”}
{type:”instance”}
{type:”host_pnic”}
{type:”switch_pnic”}
{type:”vconnector”}
{type:”vedge”}
{type:”network”}
{type:”network_agent”}
{type:”otep”}
{type:”host”}
{type:”port”}
All Calipso modules (visualization, monitoring and analysis) rely on those objects as baseline inventory items for any further computation.
Here is an example of a query made using mongo Chef Client application:
* See Calipso API-guide for details on looking up those objects through the Calipso API.
The following simplified UML illustrates the way Calipso objects relationships are maintained in a VIM of type OpenStack:
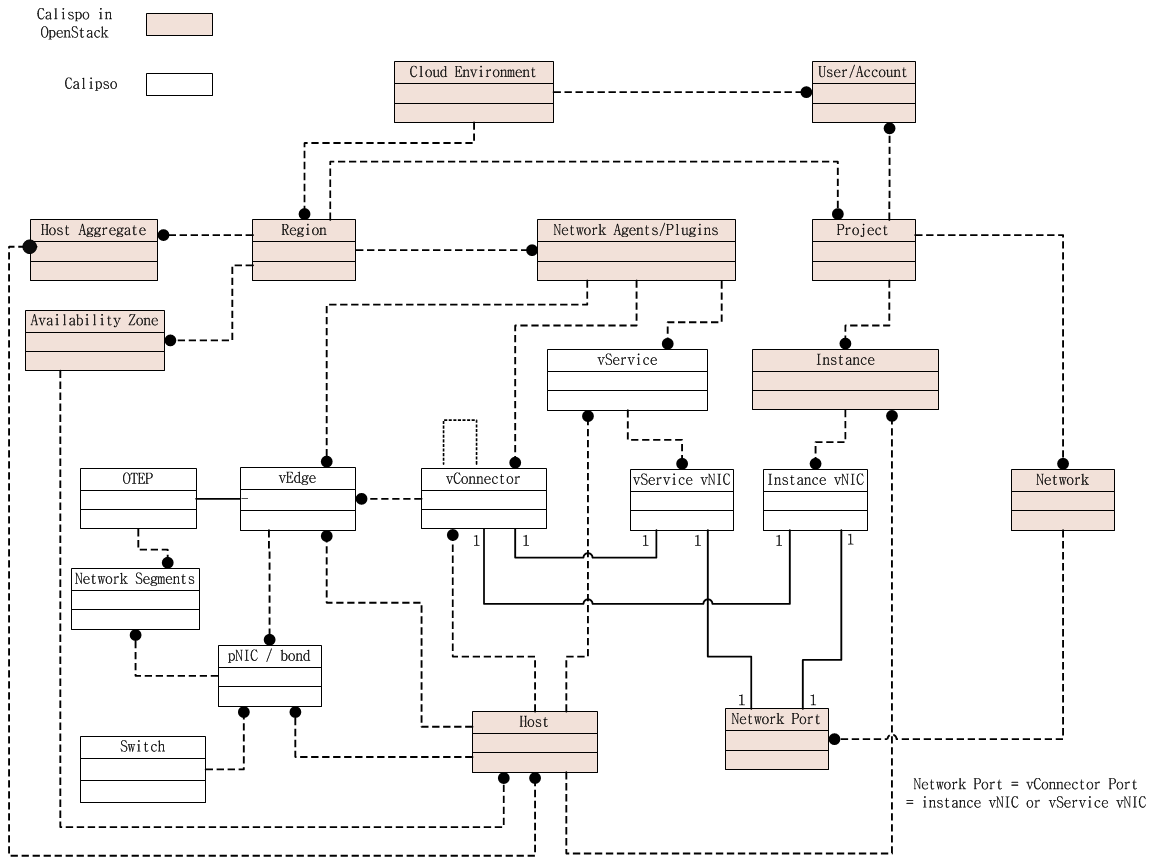
Calipso analyzes all objects in its inventory for relationships, finding in real-time, which object is attached to which object and then creates a link object representing this relationship. This analysis finds a link that is “single hop away” - a connection from certain object to certain object that is attached to it directly.
Derived relationships (A to B and B to C = A to C) is maintained as ‘cliques’.
Links objects are maintained in the “links” collection.
Based on the specific VIM distribution, distribution version, mechanism driver and type driver a set of links are discovered automatically by Calipso scanning module. Each link type is bi-directional, it means that if a connection is discovered from A to B, a connection also exists from B to A.
Here is the list of link types that might be discovered from a certain environment in the current release:
{“link_type”: “instance-vnic”}
{“link_type”: “vnic-vconnector”}
{“link_type”: “vconnector-vedge”}
{“link_type”: “vedge-host_pnic”}
{“link_type: “host_pnic-network”}
{“link_type”: “vedge-otep”}
{“link_type”: “otep-vconnector”}
{“link_type”: “otep-host_pnic”}
{“link_type”: “vconnector-host_pnic”}
{“link_type”: “vnic-vedge”}
{“link_type”: “vservice-vnic”}
{“link_type”: “switch_pnic-host_pnic”}
{“link_type”: “switch_pnic-switch_pnic”}
{“link_type”: “switch_pnic-switch”}
A successful completion of scanning and discovery means that all inventory objects, link objects and clique objects (see below) are found and accurately representing real-time state of the virtual networking on the specific environment.
Cliques are lists of links. Clique represent a certain path in the virtual networking infrastructure that an administrator is interested in, this is made to allow easier searching and finding of certain points of interest (“focal point”).
Based on the specific VIM distribution, distribution version, mechanism driver and type driver variance, Calipso scanning module search for specific cliques using a model that is pre-populated in its “clique_types” collection, and it depends on the environment variance, here is an example of a clique_type:
**{ **
**“environment” : “Apex-Euphrates”, **
“link_types” : [
**“instance-vnic”, **
**“vnic-vconnector”, **
**“vconnector-vedge”, **
**“vedge-otep”, **
**“otep-host_pnic”, **
“host_pnic-network”
**], **
**“name”: “instance_clique_for_opnfv”, **
“focal_point_type”: “instance”
}
The above model instruct the Calipso scanner to create cliques with the above list of link types for a “focal_point” that is an “instance” type of object. We believe this is a highly customized model for analysis of dependencies for many use cases. We have included several clique types, common across variances supported in this release.
The cliques themselves are then maintained in the “cliques” collection.
To clarify this concept, here is an example for an implementation use case in the Calipso UI module:
When the user of the UI clicks on a certain object of type=instance, he expresses he’s wish to see a graph representing the path taken by traffic from that specific instance (as the root source of traffic, on that specific network) all the way down to the host pNIC and the (abstracted) network itself.
A successful completion of scanning and discovery means that all inventory objects, link objects and clique objects (based on the environment clique types) are found and accurately representing real-time state of the virtual networking on the specific environment.
As of Aug 27th 2017, Calipso application supports 60 different VIM environment variances and with each release the purpose of the application is to maintain support and add more variances per the VIM development cycles. The latest supported variance and the specific functions of Calipso available for that specific variance is captured in the “supported_environments” collection, here are two examples of that ‘supported’ model:
1.
**{ **
“environment” : {
**“distribution” : “Apex”, **
**“distribution_version” : [“Euphrates”], **
**“mechanism_drivers” : “OVS”, **
“type_drivers” : “vxlan”
**}, **
“features” : {
**“listening” : true, **
**“scanning” : true, **
“monitoring” : false
}
}
2.
**{ **
“environment” : {
**“distribution” : “Mirantis”, **
**“distribution_version”: [“6.0”, “7.0”, “8.0”, “9.0”, “9.1”, “10.0”], **
**“mechanism_drivers” : “OVS”, **
“type_drivers” : “vxlan”
**}, **
“features” : {
**“listening” : true, **
**“scanning” : true, **
“monitoring” : true
}
}
The examples above defines for Calipso application that:
With each calipso release more “supported_environments” should be added.
Calipso uses other system collections to maintain its data for scanning, event handling, monitoring and for helping to operate the API and UI modules, here is the recent list of collections not covered yet in other written guides:
This collection maintains a list of documents describing what will be presented on the UI popup screen when the use hover-on a specific object type, it details which parameters or attributed from the object’s data will be shown on the screen, making this popup fully customized.
Defines the logic on which cliques are built, currently network is the main focus of the UI (central point of connection for all cliques in the system), but this is customizable.
When building a clique graph, Calipso defaults to traversing all nodes edges (links) in the graph.
In some cases we want to limit the graph so it will not expand too much (nor forever).
For example: when we build the graph for a specific instance, we limit the graph to only take objects from the network on which this instance resides - otherwise the graph will show objects related to other instances.
The constraint validation is done by checking value V from the focal point F on the links.
For example, if an n instance has network X, we check that each link we use either has network X (attribute “network” has value X), or does not have the “network” attribute.
This collection keeps requests from the UI or API to test the different adapters (API, DB, and CLI etc) and their connections to the underlying VIM, making sure dynamic and real-time data will be maintained during discovery.
Aggregates all loggings from the different systems, source_system of logs currently defined as “OpenStack” (the VIM), “Sensu” (the Monitoring module) and “Calipso” (logs of the application itself. Messages have 6 levels of severity and can be browsed in the UI and through Calipso API.
Lists the types of networking agents supported on the VIM (per distribution and version).
Basic RBAC facility to authorize calispo UI users for certain calipso functionalities on the UI.
Built for detailed analysis and future functionalities, used today for traffic analysis (capturing samples of throughputs per session on VPP based environments).
This is an aggregated collection for many types of documents that are required mostly by the UI and basic functionality on some scanning classes (‘fetchers’).
Type of environments to allow for configuration on sensu monitoring framework.
Severity levels for messages generated.
Mechanism-drivers allowed for UI users.
Type-drivers allowed for UI users.
Currently only “Sensu” is available, might be used for other monitoring systems integrations.
Provides statuses for link objects, based on monitoring results.
The types of deployment options available for monitoring (see monitoring-guide for details).
Captures the overall (aggregated) status of a curtained environment.
Lists the connections and relationships options for objects in the inventory.
Used for monitoring auto configurations of clients and servers.
Lists the type of objects supported through scanning (inventory objects).
During scans, several statuses are shown on the UI, based on the specific stage and results.
Lists the VIM distributions.
Lists the VIM different versions of different distributions.
The list of systems that can generate logs and messages.
Object_types used only for link popups on UI.
Object_types used during scanning, see development-guide for details.
Constants-configuration_targets Names of the configuration targets used in the configuration section of environment configs.
Copyright (c) 2017 Koren Lev (Cisco Systems), Yaron Yogev (Cisco Systems) and others All rights reserved. This program and the accompanying materials are made available under the terms of the Apache License, Version 2.0 which accompanies this distribution, and is available at http://www.apache.org/licenses/LICENSE-2.0
Project “Calipso” tries to illuminate complex virtual networking with real time operational state visibility for large and highly distributed Virtual Infrastructure Management (VIM).
We believe that Stability is driven by accurate Visibility.
Calipso provides visible insights using smart discovery and virtual topological representation in graphs, with monitoring per object in the graph inventory to reduce error vectors and troubleshooting, maintenance cycles for VIM operators and administrators.
Table of Contents
Calipso.io Quick Start Guide 1
1 Getting started 3
1.1 Post installation tools 3
1.2 Calipso containers details 3
1.3 Calipso containers access 5
2 Validating Calipso app 5
2.1 Validating calipso-mongo module 5
2.2 Validating calipso-scan module 7
2.3 Validating calipso-listen module 8
2.4 Validating calipso-api module 9
2.5 Validating calipso-sensu module 9
2.6 Validating calipso-ui module 10
2.7 Validating calipso-ldap module 10
Calipso administrator should first complete installation as per install-guide document.
After all calipso containers are running she can start examining the application using the following suggested tools:
Calipso is currently made of the following 7 containers:
Mongo: holds and maintains calipso’s data inventories.
LDAP: holds and maintains calipso’s user directories.
Scan: deals with automatic discovery of virtual networking from VIMs.
Listen: deals with automatic updating of virtual networking into inventories.
API: runs calipso’s RESTful API server.
UI: runs calipso’s GUI/web server.
Sensu: runs calipso’s monitoring server.
After successful installation Calipso containers should have been downloaded, registered and started, here are the images used:
sudo docker images
Expected results (as of Aug 2017):
REPOSITORY TAG IMAGE ID CREATED SIZE
korenlev/calipso listen 12086aaedbc3 6 hours ago 1.05GB
korenlev/calipso api 34c4c6c1b03e 6 hours ago 992MB
korenlev/calipso scan 1ee60c4e61d5 6 hours ago 1.1GB
korenlev/calipso sensu a8a17168197a 6 hours ago 1.65GB
korenlev/calipso mongo 17f2d62f4445 22 hours ago 1.31GB
korenlev/calipso ui ab37b366e812 11 days ago 270MB
korenlev/calipso ldap 316bc94b25ad 2 months ago 269MB
Typically Calipso application is fully operational at this stage and you can jump to ‘Using Calipso’ section to learn how to use it, the following explains how the containers are deployed by calipso-installer.py for general reference.
Checking the running containers status and ports in use:
sudo docker ps
Expected results and details (as of Aug 2017):
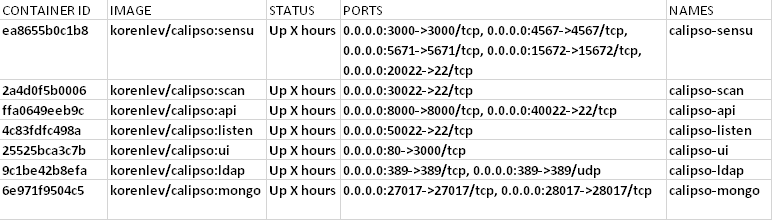
The above listed TCP ports are used by default on the hosts to map to each calipso container, you should be familiar with these mappings of ports per container.
Checking running containers entry-points (The commands used inside the container):
sudo docker inspect [container-ID]
Expected results (as of Aug 2017):
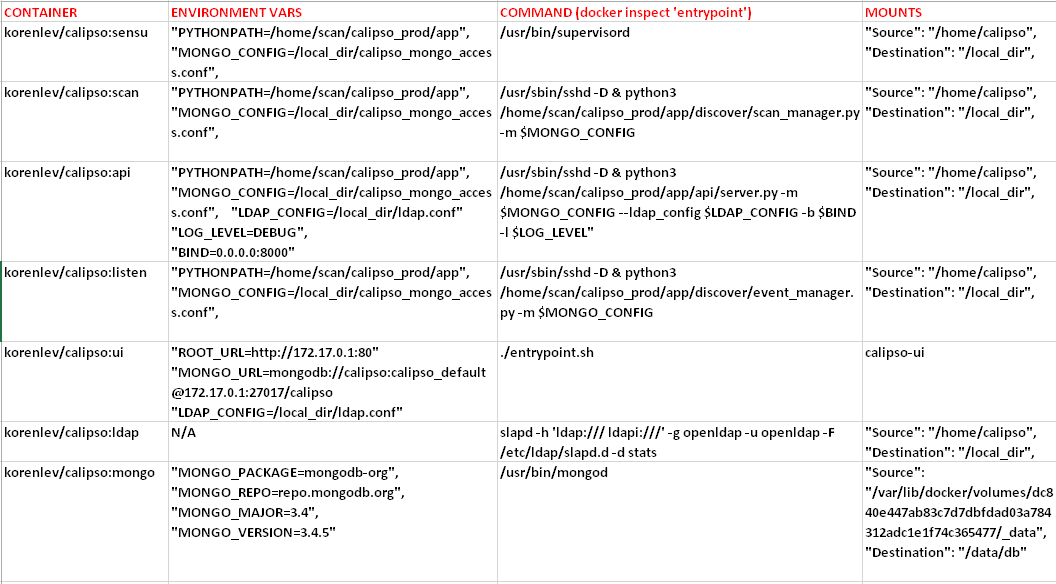
Calipso containers configuration can be listed with docker inspect, summarized in the table above. In a none-containerized deployment (see ‘Monolithic app install option in the install-guide) these are the individual commands that are needed to run calipso manually for special development needs.
The ‘calipso-sensu’ is built using sensu framework customized for calipso monitoring design, ‘calipso-ui’ is built using meteor framework, ‘calipso-ldap’ is built using pre-defined open-ldap container, and as such those three are only supported as pre-built containers.
Administrator should be aware of the following details deployed in the containers:
calipso-api, calipso-sensu, calipso-scan and calipso-listen maps host directory /home/calipso as volume /local_dir inside the container.
They use calipso_mongo_access.conf and ldap.conf files for configuration.
They use /home/scan/calipso_prod/app as the main PYTHONPATH needed to run the different python modules per container.
Calipso-sensu is using the ‘supervisord’ process to control all sensu server processes needed for calipso and the calipso event handler on this container.
Calipso-ldap can be used as standalone, but is a pre-requisite for calipso-api.
Calipso-ui needs calipso-mongo with latest scheme, to run and offer UI services.
The different Calipso containers are also accessible using SSH and pre-defined default credentials, here is the access details:
Calipso-listen: ssh scan@localhost –p 50022 , password = scan
Calipso-scan: ssh scan@localhost –p 30022 , password = scan
Calipso-api: ssh scan@localhost –p 40022 , password = scan
Calipso-sensu: ssh scan@localhost –p 20022 , password = scan
Calipso-ui: only accessible through web browser
Calipso-ldap: only accessible through ldap tools.
Calipso-mongo: only accessible through mongo clients like MongoChef.
Using MongoChef client, create a new connection pointing to the server where calipso-mongo container is running, using port 27017 and the following default credentials:
Host IP=server_IP and TCP port=27017
Username : calipso
Password : calipso_default
Auto-DB: calipso
Defaults are also configured into /home/calipso/calipso_mongo_access.conf.
The following is a screenshot of a correct connection setup in MongoChef:
When clicking on the new defined connection the calipso DB should be listed:
At this stage you can checkout calipso-mongo collections data and validate as needed.
Scan container is running the main calipso scanning engine that receives requests to scan a specific VIM environment, this command will validate that the main scan_manager.py process is running and waiting for scan requests:
sudo docker ps # grab the containerID of calipso-scan
sudo docker logs bf5f2020028a #containerID for example
Expected results:
2017-08-28 06:11:39,231 INFO: Using inventory collection: inventory
2017-08-28 06:11:39,231 INFO: Using links collection: links
2017-08-28 06:11:39,231 INFO: Using link_types collection: link_types
2017-08-28 06:11:39,231 INFO: Using clique_types collection: clique_types
2017-08-28 06:11:39,231 INFO: Using clique_constraints collection: clique_constraints
2017-08-28 06:11:39,231 INFO: Using cliques collection: cliques
2017-08-28 06:11:39,232 INFO: Using monitoring_config collection: monitoring_config
2017-08-28 06:11:39,232 INFO: Using constants collection: constants
2017-08-28 06:11:39,232 INFO: Using scans collection: scans
2017-08-28 06:11:39,232 INFO: Using messages collection: messages
2017-08-28 06:11:39,232 INFO: Using monitoring_config_templates collection: monitoring_config_templates
2017-08-28 06:11:39,232 INFO: Using environments_config collection: environments_config
2017-08-28 06:11:39,232 INFO: Using supported_environments collection: supported_environments
2017-08-28 06:11:39,233 INFO: Started ScanManager with following configuration:
Mongo config file path: /local_dir/calipso_mongo_access.conf
Scans collection: scans
Environments collection: environments_config
Polling interval: 1 second(s)
The above logs basically shows that scan_manager.py is running and listening to scan requests (should they come in through into ‘scans’ collection for specific environment listed in ‘environments_config’ collection, refer to use-guide for details).
Listen container is running the main calipso event_manager engine that listens for events on a specific VIM BUS environment, this command will validate that the main event_manager.py process is running and waiting for events from the BUS:
2017-08-28 06:11:35,572 INFO: Using inventory collection: inventory
2017-08-28 06:11:35,572 INFO: Using links collection: links
2017-08-28 06:11:35,572 INFO: Using link_types collection: link_types
2017-08-28 06:11:35,572 INFO: Using clique_types collection: clique_types
2017-08-28 06:11:35,572 INFO: Using clique_constraints collection: clique_constraints
2017-08-28 06:11:35,573 INFO: Using cliques collection: cliques
2017-08-28 06:11:35,573 INFO: Using monitoring_config collection: monitoring_config
2017-08-28 06:11:35,573 INFO: Using constants collection: constants
2017-08-28 06:11:35,573 INFO: Using scans collection: scans
2017-08-28 06:11:35,573 INFO: Using messages collection: messages
2017-08-28 06:11:35,573 INFO: Using monitoring_config_templates collection: monitoring_config_templates
2017-08-28 06:11:35,573 INFO: Using environments_config collection: environments_config
2017-08-28 06:11:35,574 INFO: Using supported_environments collection: supported_environments
2017-08-28 06:11:35,574 INFO: Started EventManager with following configuration:
Mongo config file path: /local_dir/calipso_mongo_access.conf
Collection: environments_config
Polling interval: 5 second(s)
The above logs basically shows that event_manager.py is running and listening to event (should they come in through from VIM BUS) and listed in ‘environments_config’ collection, refer to use-guide for details).
Scan container is running the main calipso API that allows applications to integrate with calipso inventory and functions, this command will validate it is operational:
sudo docker ps # grab the containerID of calipso-scan
sudo docker logs bf5f2020028c #containerID for example
Expected results:
2017-08-28 06:11:38,118 INFO: Using inventory collection: inventory
2017-08-28 06:11:38,119 INFO: Using links collection: links
2017-08-28 06:11:38,119 INFO: Using link_types collection: link_types
2017-08-28 06:11:38,119 INFO: Using clique_types collection: clique_types
2017-08-28 06:11:38,120 INFO: Using clique_constraints collection: clique_constraints
2017-08-28 06:11:38,120 INFO: Using cliques collection: cliques
2017-08-28 06:11:38,121 INFO: Using monitoring_config collection: monitoring_config
2017-08-28 06:11:38,121 INFO: Using constants collection: constants
2017-08-28 06:11:38,121 INFO: Using scans collection: scans
2017-08-28 06:11:38,121 INFO: Using messages collection: messages
2017-08-28 06:11:38,121 INFO: Using monitoring_config_templates collection: monitoring_config_templates
2017-08-28 06:11:38,122 INFO: Using environments_config collection: environments_config
2017-08-28 06:11:38,122 INFO: Using supported_environments collection: supported_environments
[2017-08-28 06:11:38 +0000] [6] [INFO] Starting gunicorn 19.4.5
[2017-08-28 06:11:38 +0000] [6] [INFO] Listening at: http://0.0.0.0:8000 (6)
[2017-08-28 06:11:38 +0000] [6] [INFO] Using worker: sync
[2017-08-28 06:11:38 +0000] [12] [INFO] Booting worker with pid: 12
The above logs basically shows that the calipso api is running and listening on port 8000 for requests.
Sensu container is running several servers (currently unified into one for simplicity) and the calipso event handler (refer to use-guide for details), here is how to validate it is operational:
ssh scan@localhost -p 20022 # default password = scan
sudo /etc/init.d/sensu-client status
sudo /etc/init.d/sensu-server status
sudo /etc/init.d/sensu-api status
sudo /etc/init.d/uchiwa status
sudo /etc/init.d/rabbitmq-server status
Expected results:
Each of the above should return a pid and a ‘running’ state +
ls /home/scan/calipso_prod/app/monitoring/handlers # should list monitor.py module.
The above logs basically shows that calipso-sensu is running and listening to monitoring events from sensu-clients on VIM hosts, refer to use-guide for details).
UI container is running several JS process with the back-end mongoDB, it needs data to run and it will not run if any connection with DB is lost, this is per design. To validate operational state of the UI simply point a Web Browser to : http://server-IP:80 and expect a login page. Use admin/123456 as default credentials to login:
LDAP container is running a common user directory for integration with UI and API modules, it is placed with calipso to validate interaction with LDAP. The main configuration needed for communication with it is stored by calipso installer in /home/calipso/ldap.conf and accessed by the API module. We assume in production use-cases a corporate LDAP server might be used instead, in that case ldap.conf needs to be changed and point to the corporate server.
To validate LDAP container, you will need to install openldap-clients, using:
yum -y install openldap-clients / apt-get install openldap-clients
Search all LDAP users inside that ldap server:
ldapsearch -H ldap://localhost -LL -b ou=Users,dc=openstack,dc=org x
Admin user details on this container (user=admin, pass=password):
LDAP username : cn=admin,dc=openstack,dc=org
cn=admin,dc=openstack,dc=org’s password : password
Account BaseDN [DC=168,DC=56,DC=153:49154]: ou=Users,dc=openstack,dc=org
Group BaseDN [ou=Users,dc=openstack,dc=org]:
Add a new user (admin credentials needed to bind to ldap and add users):
Create a /tmp/adduser.ldif file, use this example:
dn: cn=Myname,ou=Users,dc=openstack,dc=org // which org, which ou etc ...
objectclass: inetOrgPerson
cn: Myname // match the dn details !
sn: Koren
uid: korlev
userpassword: mypassword // the password
carlicense: MYCAR123
homephone: 555-111-2222
mail: korlev@cisco.com
description: koren guy
ou: calipso Department
Run this command to add the above user attributes into the ldap server:
ldapadd -x -D cn=admin,dc=openstack,dc=org -w password -c -f /tmp/adduser.ldif // for example, the above file is used and the admin bind credentials who is, by default, authorized to add users.
You should see “user added” message if successful
Validate users against this LDAP container:
Wrong credentials:
ldapwhoami -x -D cn=Koren,ou=Users,dc=openstack,dc=org -w korlevwrong
Response: ldap_bind: Invalid credentials (49)
Correct credentials:
ldapwhoami -x -D cn=Koren,ou=Users,dc=openstack,dc=org -w korlev
Response: dn:cn=Koren,ou=Users,dc=openstack,dc=org
The reply ou/dc details can be used by any application (UI and API etc) for mapping users to some application specific group…
Found a typo or any other feedback? Send an email to users@opnfv.org or talk to us on IRC.
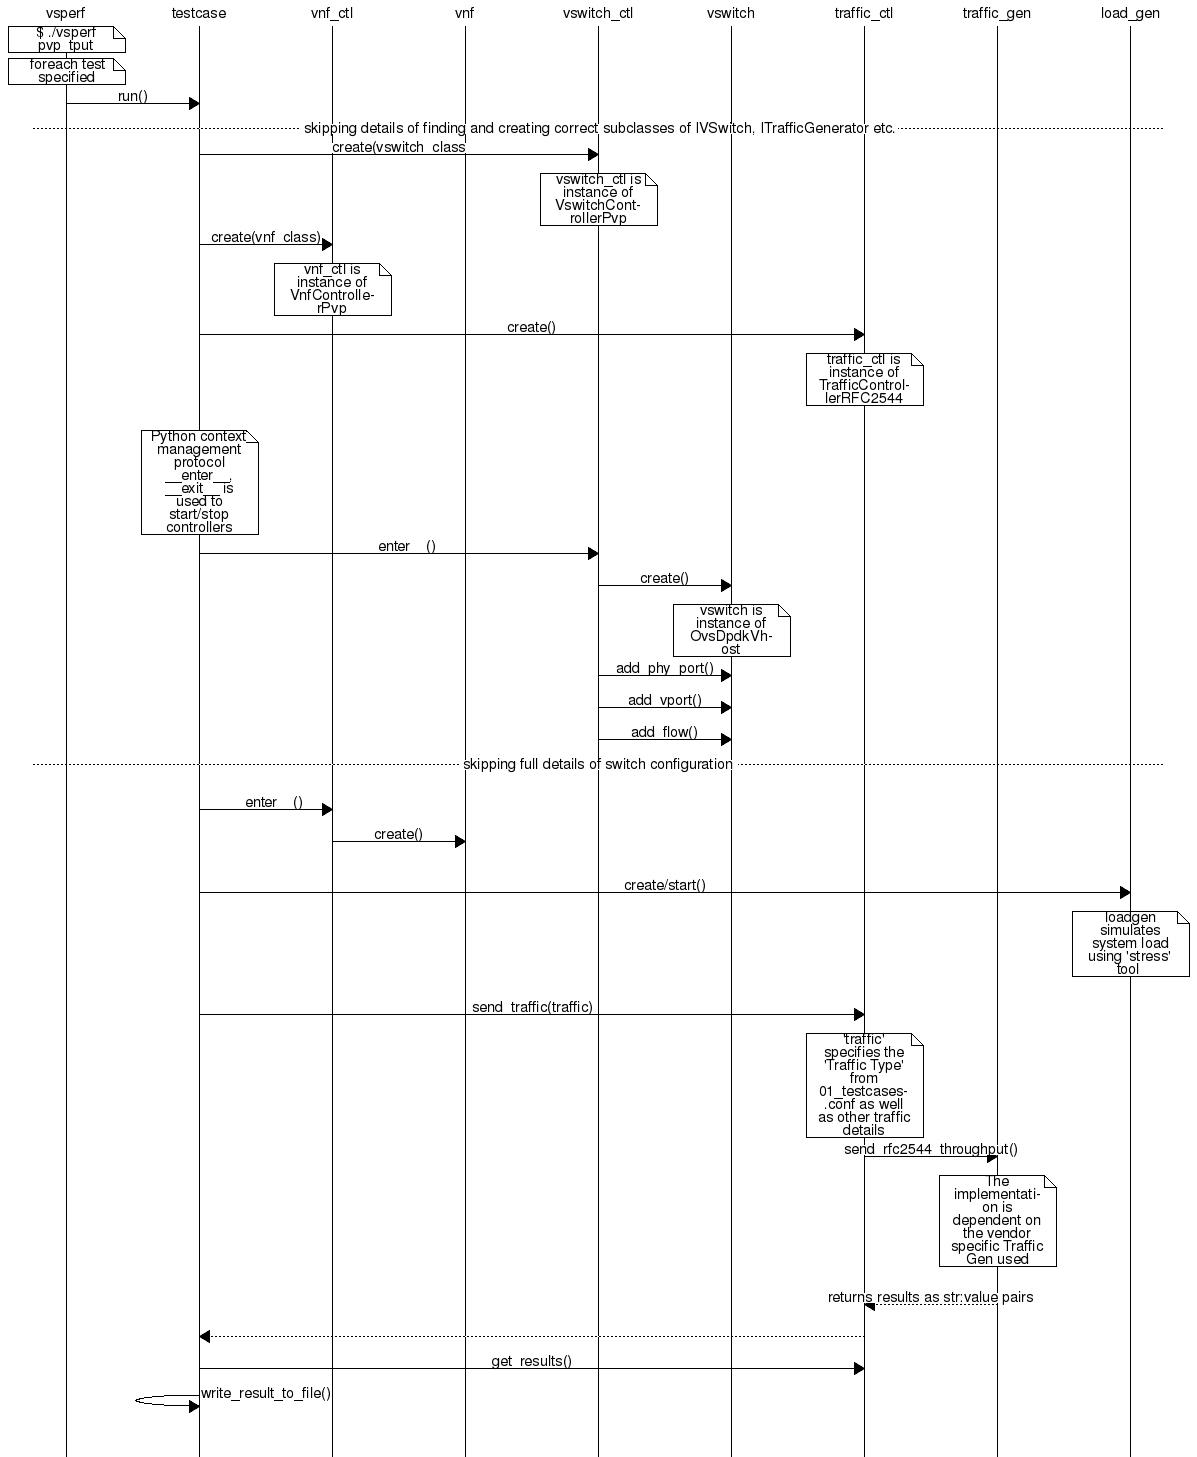
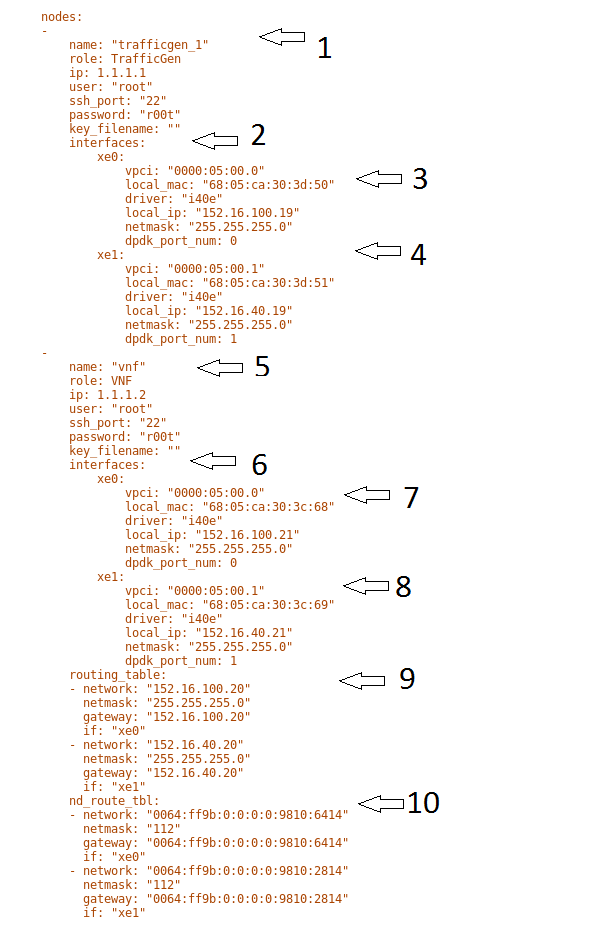
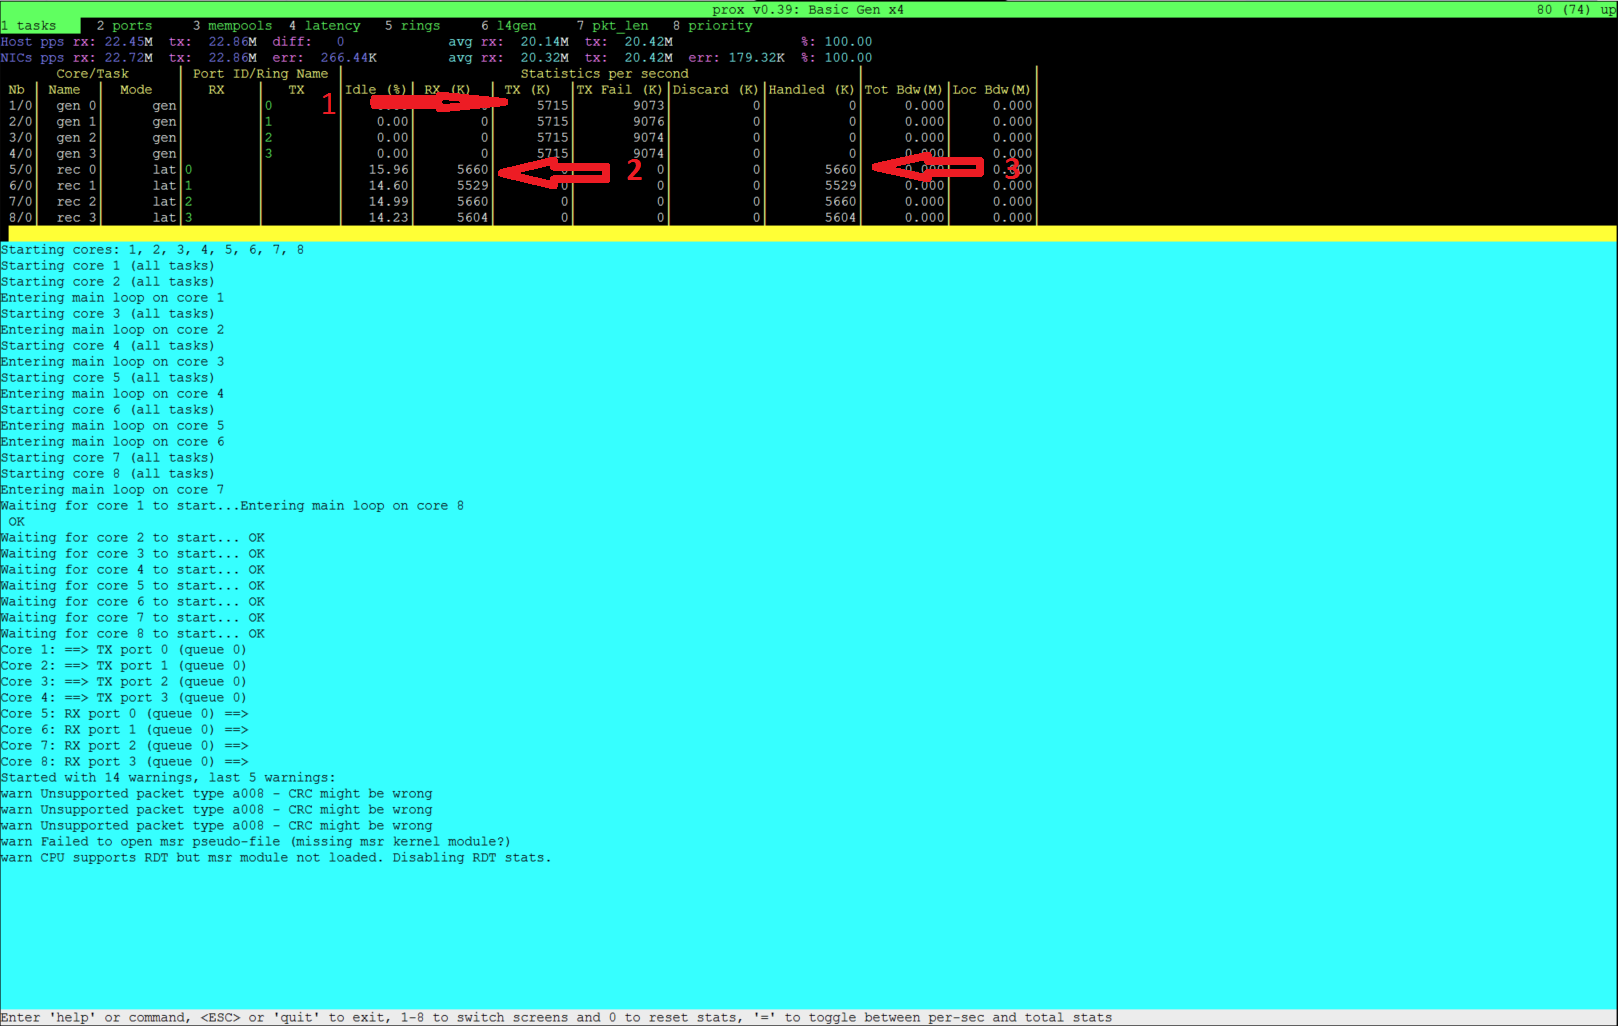
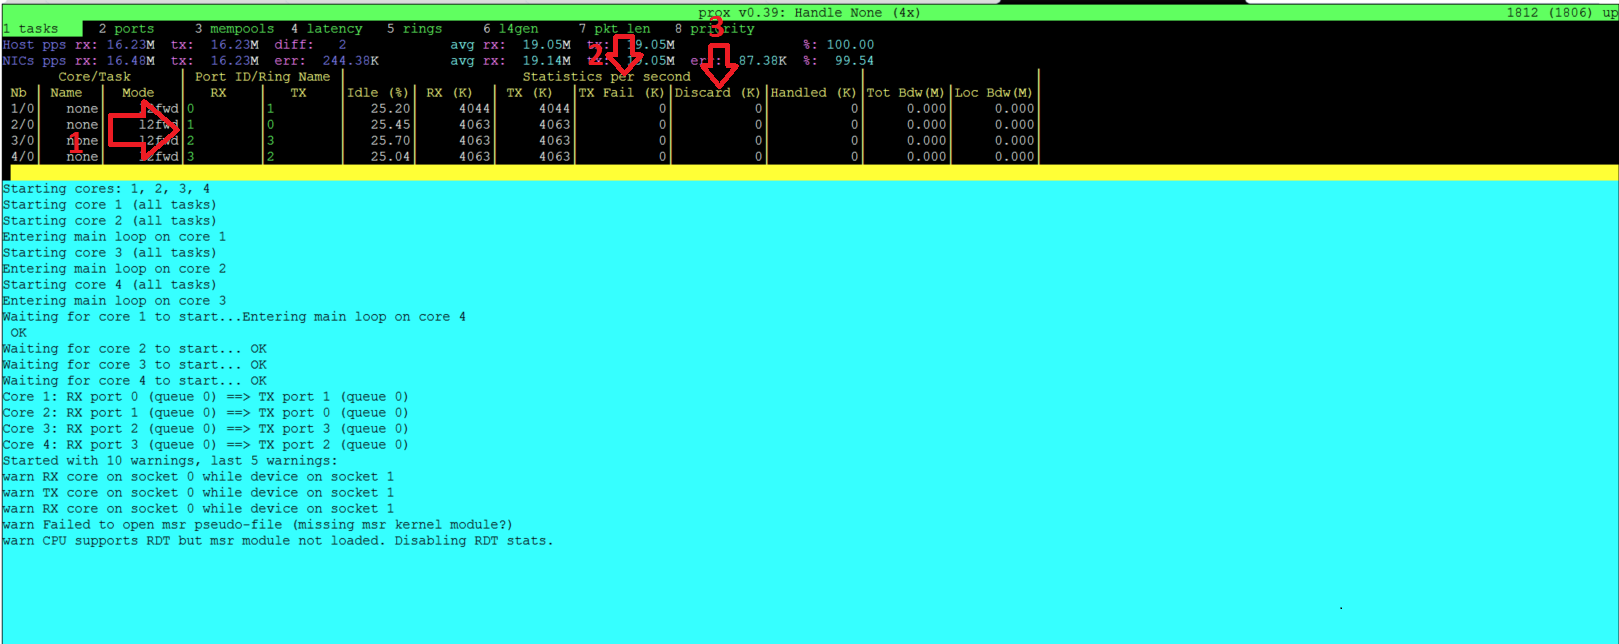
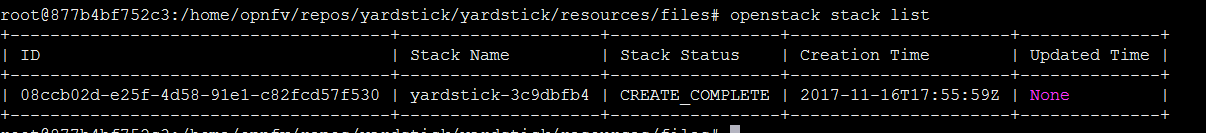
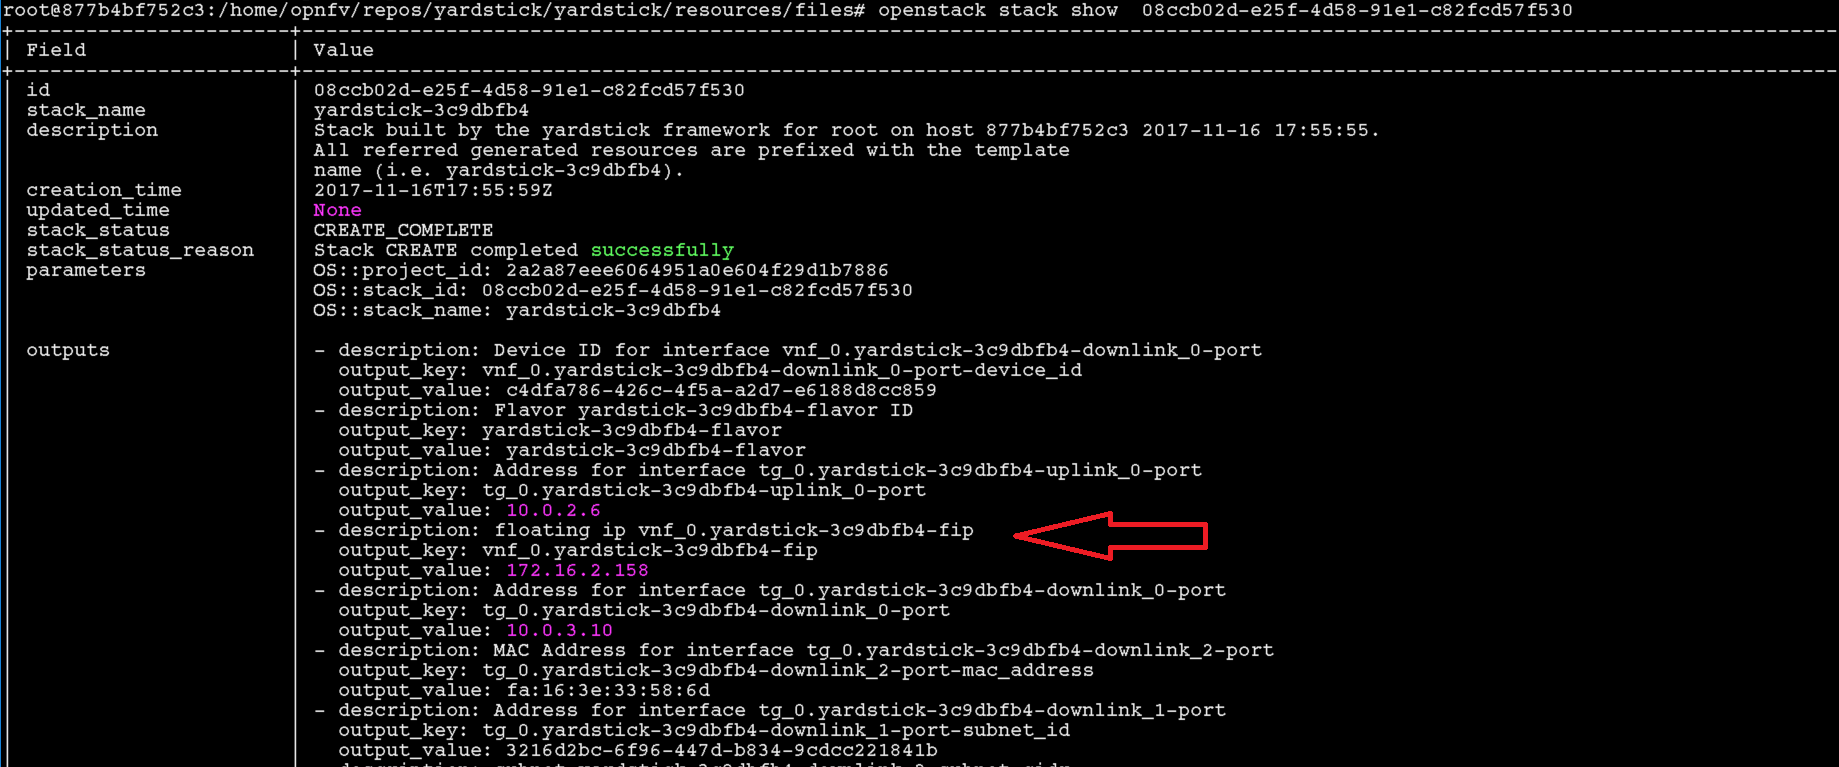
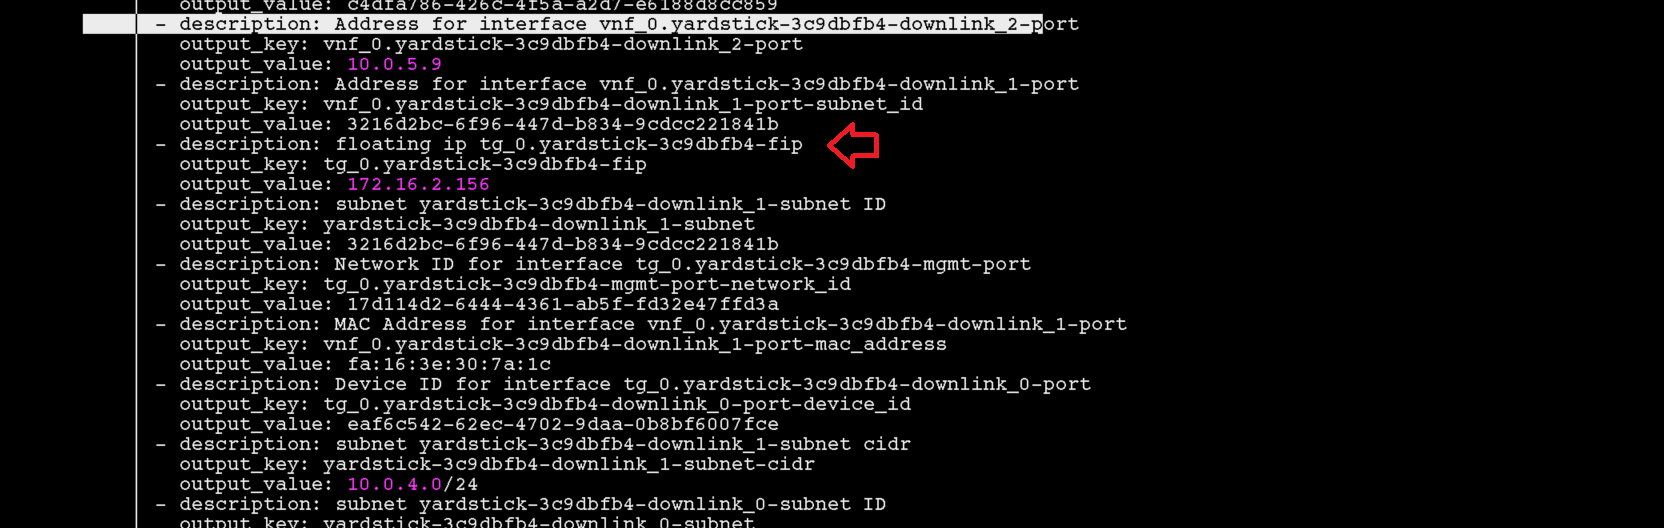
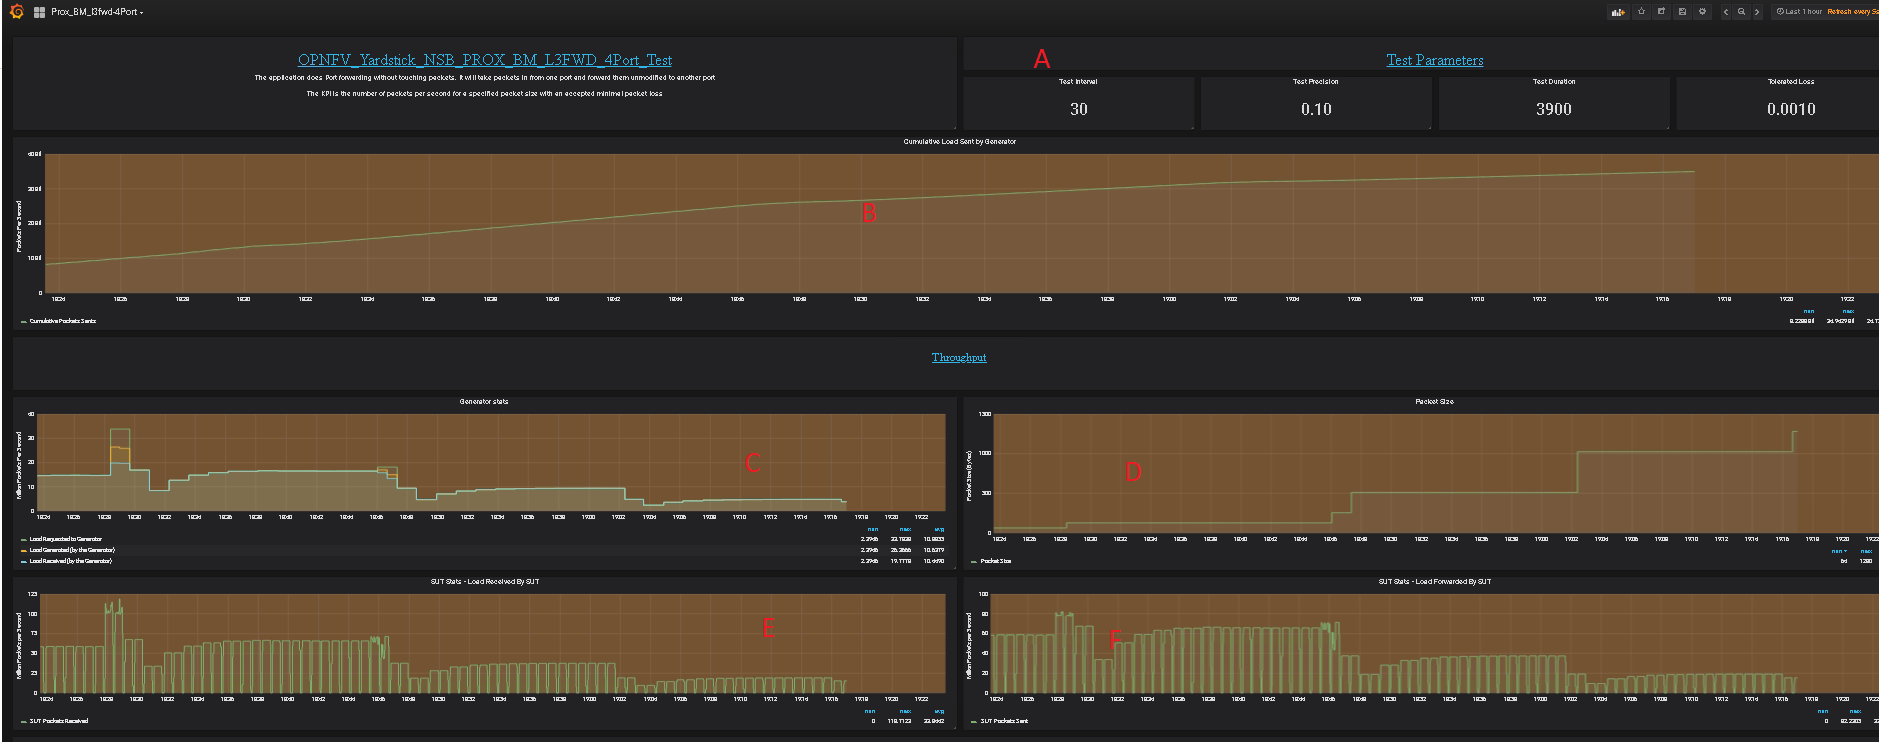
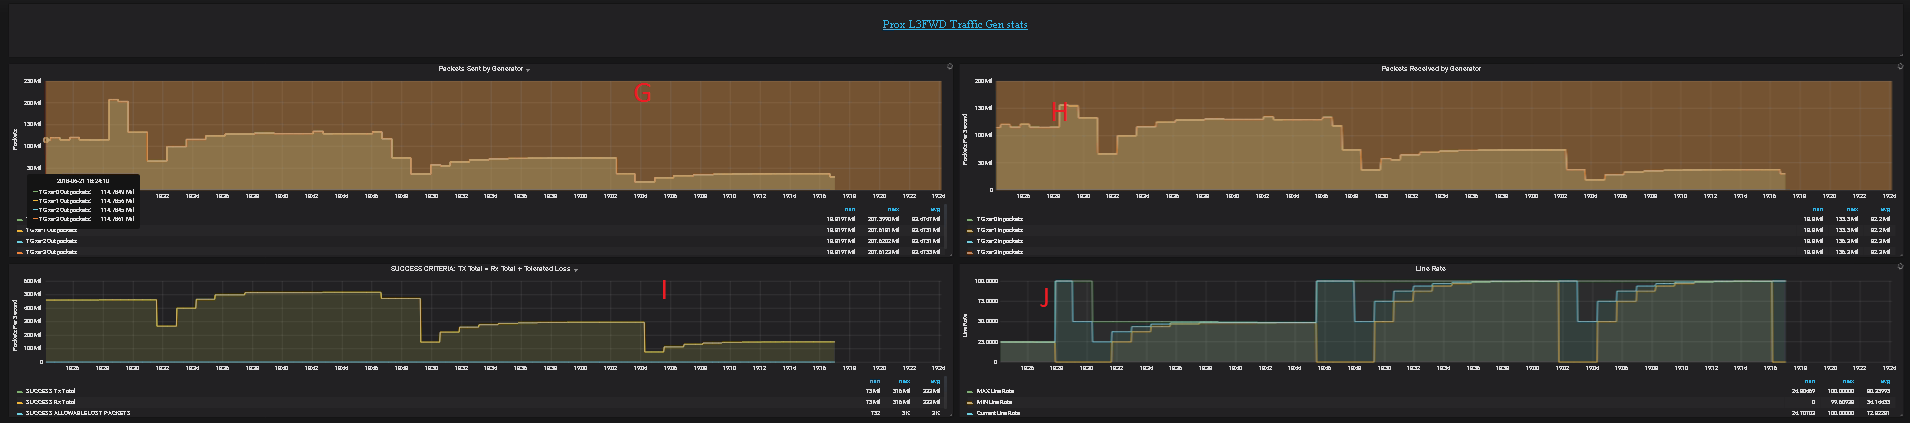
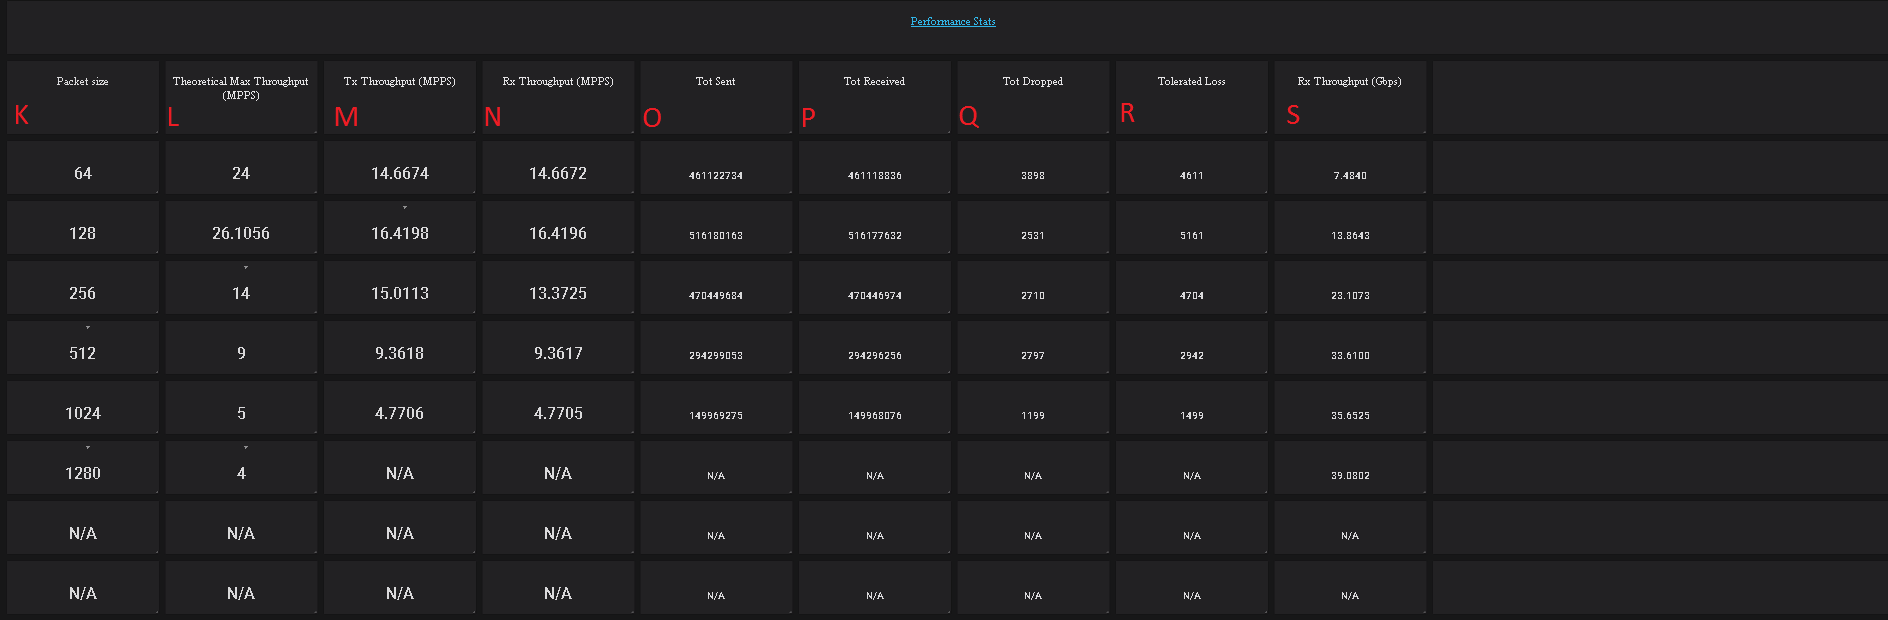
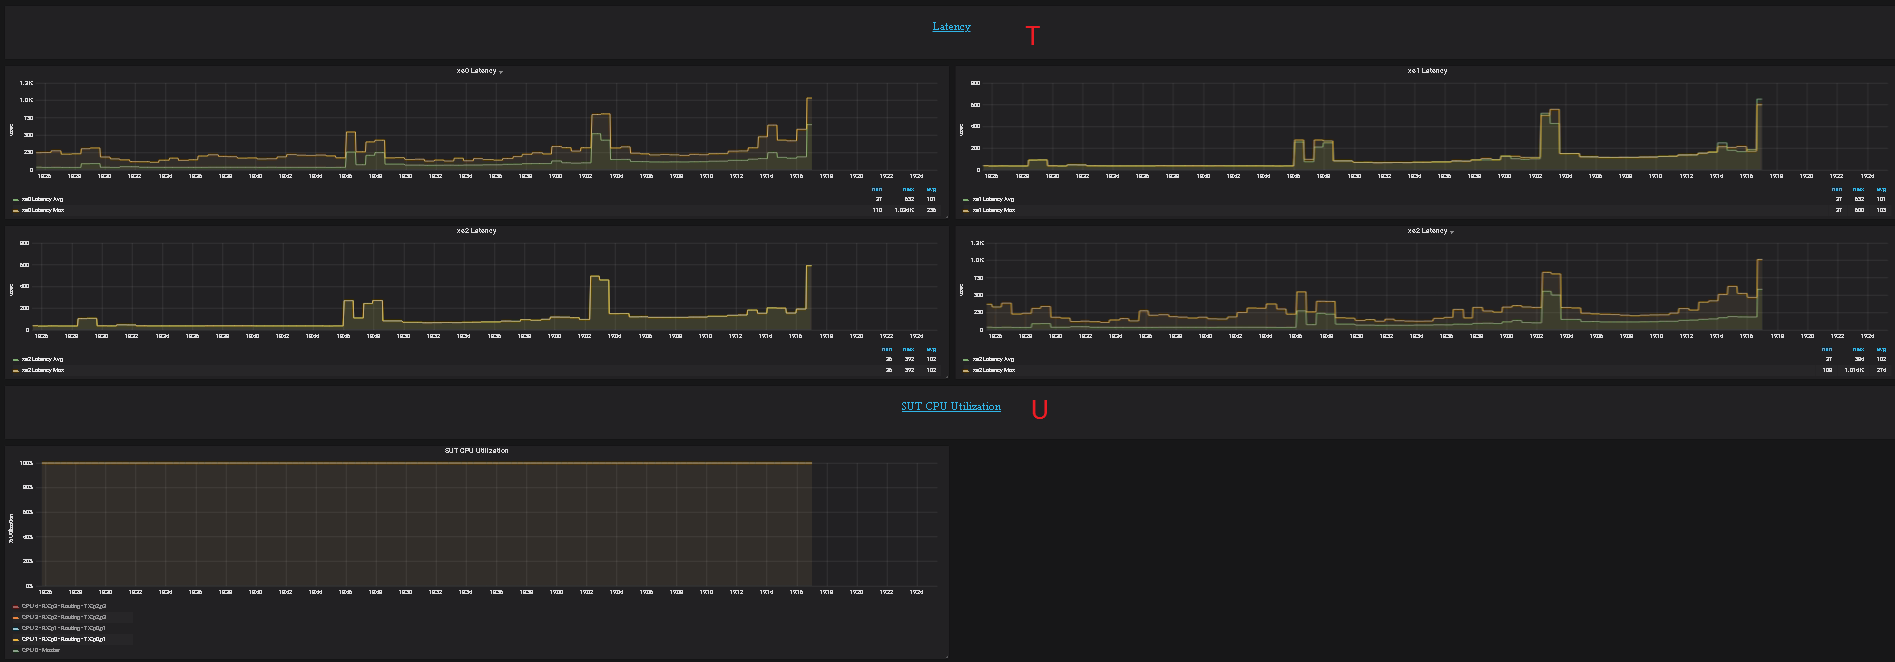
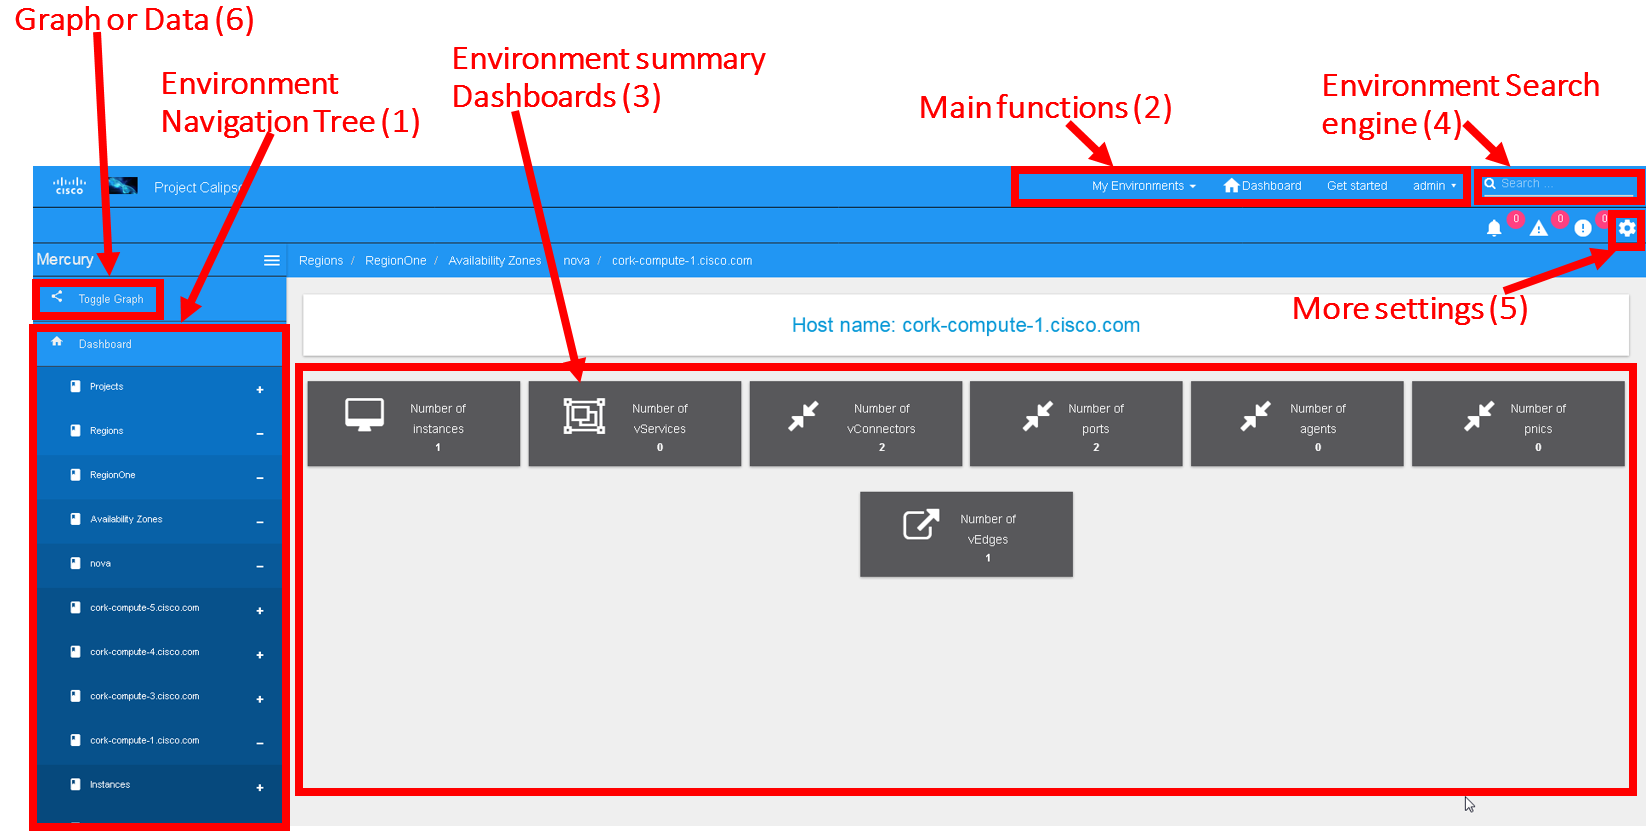
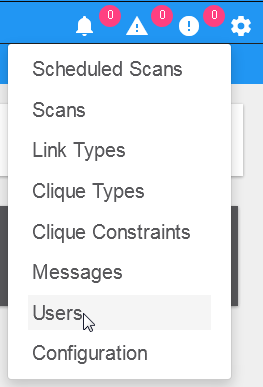
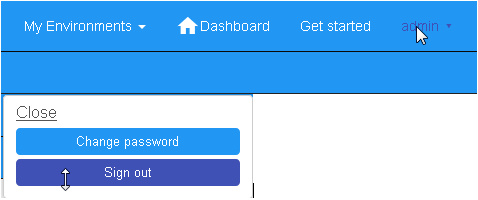
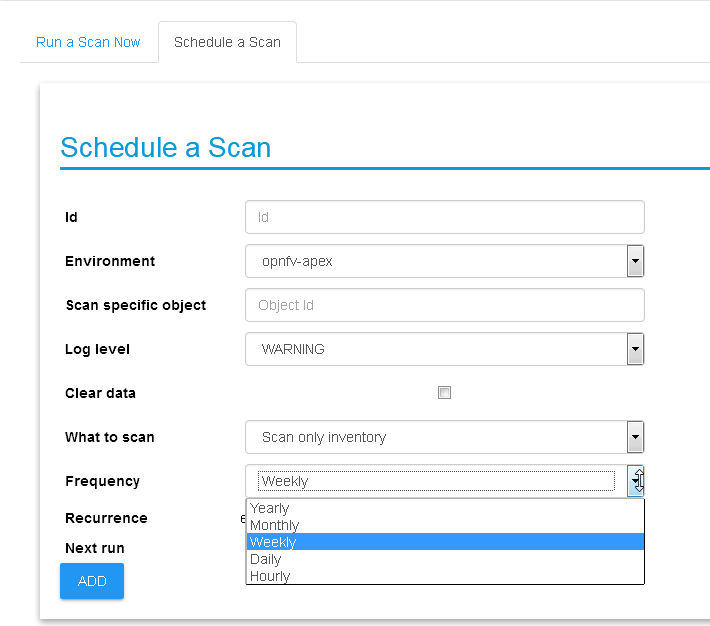
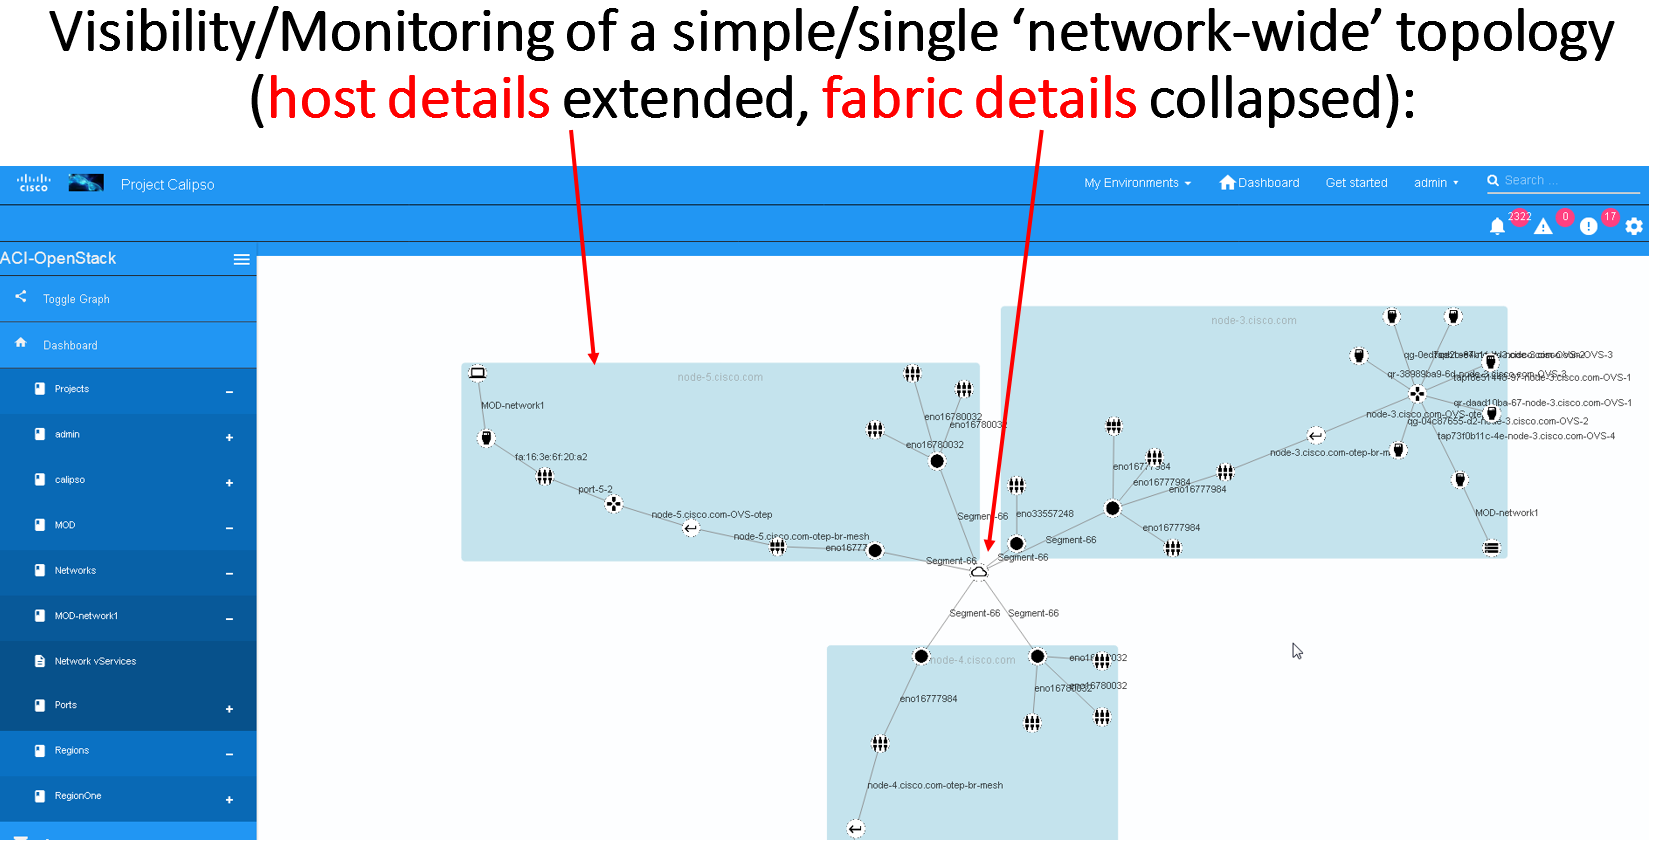
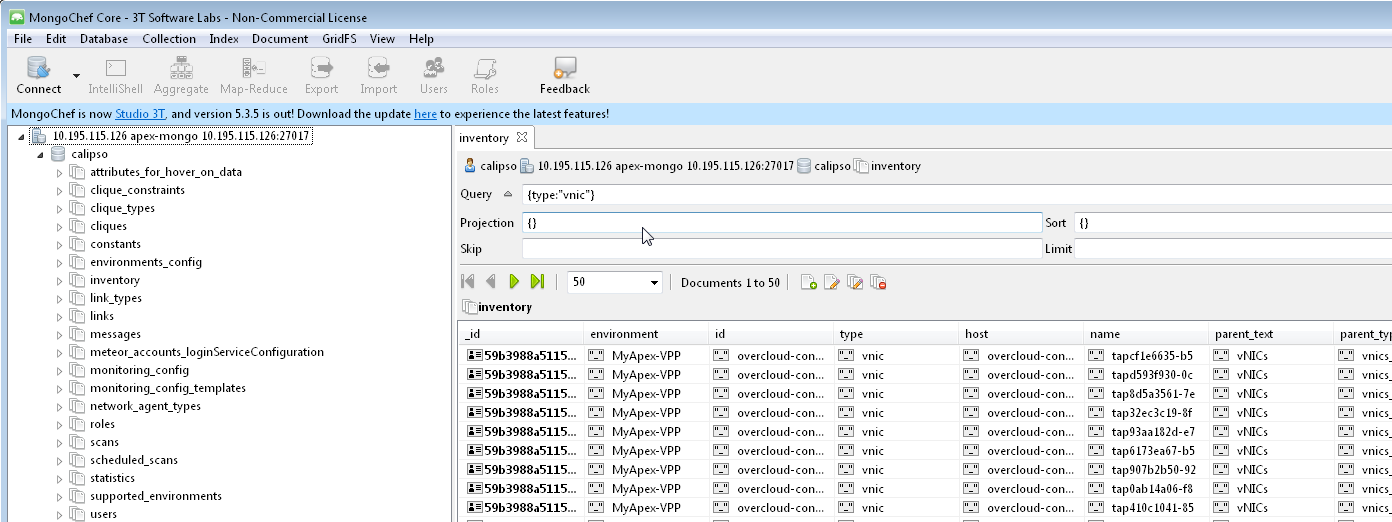
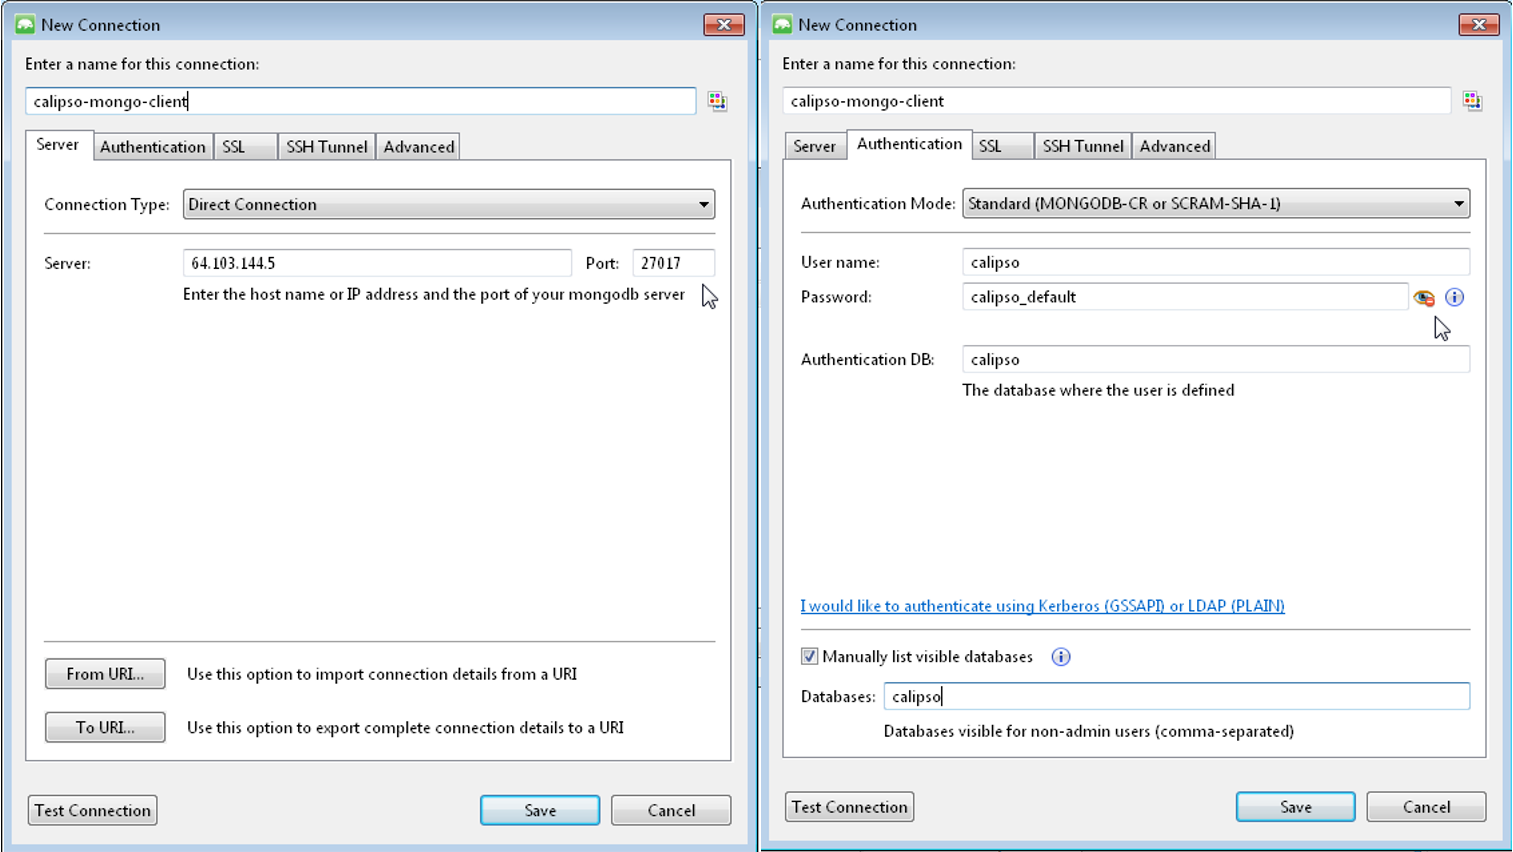
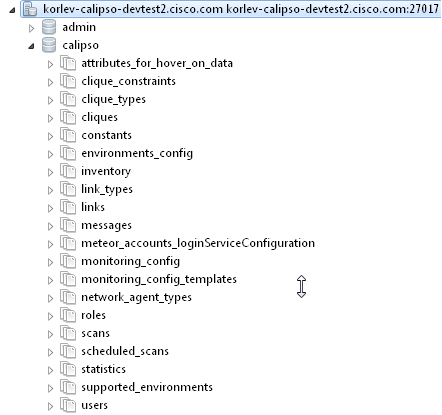