SFQM user guide
collectd plugins description
The SFQM collectd plugins enable the ability to monitor DPDK interfaces by exposing stats and the relevant events to higher level telemetry and fault management applications. The following sections will discuss the SFQM features in detail.
Measuring Telco Traffic and Performance KPIs
This section will discuss the SFQM features that enable Measuring Telco Traffic and Performance KPIs.

Measuring Telco Traffic and Performance KPIs
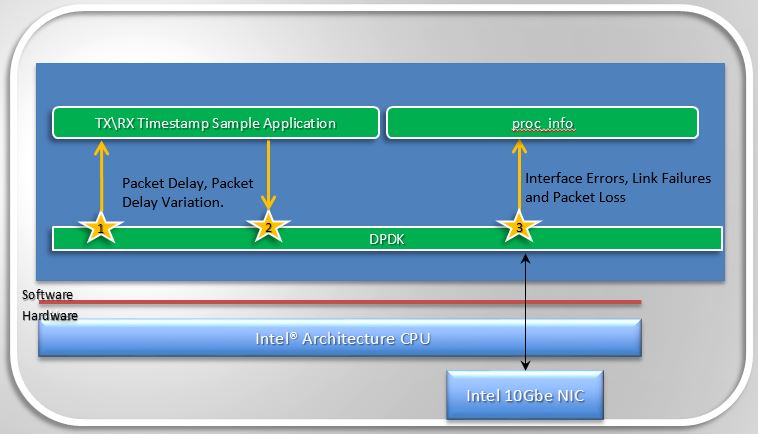
- The very first thing SFQM enabled was a call-back API in DPDK and an associated application that used the API to demonstrate how to timestamp packets and measure packet latency in DPDK (the sample app is called rxtx_callbacks). This was upstreamed to DPDK 2.0 and is represented by the interfaces 1 and 2 in Figure 1.2.
- The second thing SFQM implemented in DPDK is the extended NIC statistics API,
which exposes NIC stats including error stats to the DPDK user by reading the
registers on the NIC. This is represented by interface 3 in Figure 1.2.
- For DPDK 2.1 this API was only implemented for the ixgbe (10Gb) NIC driver, in association with a sample application that runs as a DPDK secondary process and retrieves the extended NIC stats.
- For DPDK 2.2 the API was implemented for igb, i40e and all the Virtual Functions (VFs) for all drivers.
- For DPDK 16.07 the API migrated from using string value pairs to using id value pairs, improving the overall performance of the API.
Monitoring DPDK interfaces
With the features SFQM enabled in DPDK to enable measuring Telco traffic and performance KPIs, we can now retrieve NIC statistics including error stats and relay them to a DPDK user. The next step is to enable monitoring of the DPDK interfaces based on the stats that we are retrieving from the NICs, by relaying the information to a higher level Fault Management entity. To enable this SFQM has been enabling a number of plugins for collectd.
collectd
collectd is a daemon which collects system performance statistics periodically and provides a variety of mechanisms to publish the collected metrics. It supports more than 90 different input and output plugins. Input plugins retrieve metrics and publish them to the collectd deamon, while output plugins publish the data they receive to an end point. collectd also has infrastructure to support thresholding and notification.
collectd statistics and Notifications
Within collectd notifications and performance data are dispatched in the same way. There are producer plugins (plugins that create notifications/metrics), and consumer plugins (plugins that receive notifications/metrics and do something with them).
Statistics in collectd consist of a value list. A value list includes:
- Values, can be one of:
- Derive: used for values where a change in the value since it’s last been read is of interest. Can be used to calculate and store a rate.
- Counter: similar to derive values, but take the possibility of a counter wrap around into consideration.
- Gauge: used for values that are stored as is.
- Absolute: used for counters that are reset after reading.
- Value length: the number of values in the data set.
- Time: timestamp at which the value was collected.
- Interval: interval at which to expect a new value.
- Host: used to identify the host.
- Plugin: used to identify the plugin.
- Plugin instance (optional): used to group a set of values together. For e.g. values belonging to a DPDK interface.
- Type: unit used to measure a value. In other words used to refer to a data set.
- Type instance (optional): used to distinguish between values that have an identical type.
- meta data: an opaque data structure that enables the passing of additional information about a value list. “Meta data in the global cache can be used to store arbitrary information about an identifier” [7].
Host, plugin, plugin instance, type and type instance uniquely identify a collectd value.
Values lists are often accompanied by data sets that describe the values in more detail. Data sets consist of:
- A type: a name which uniquely identifies a data set.
- One or more data sources (entries in a data set) which include:
- The name of the data source. If there is only a single data source this is set to “value”.
- The type of the data source, one of: counter, gauge, absolute or derive.
- A min and a max value.
Types in collectd are defined in types.db. Examples of types in types.db:
bitrate    value:GAUGE:0:4294967295
counter    value:COUNTER:U:U
if_octets  rx:COUNTER:0:4294967295, tx:COUNTER:0:4294967295
In the example above if_octets has two data sources: tx and rx.
Notifications in collectd are generic messages containing:
- An associated severity, which can be one of OKAY, WARNING, and FAILURE.
- A time.
- A Message
- A host.
- A plugin.
- A plugin instance (optional).
- A type.
- A types instance (optional).
- Meta-data.
collectd plugins
SFQM has enabled three collectd plugins to date:
- dpdkstat plugin: A read plugin that retrieve stats from the DPDK extended
NIC stats API.
ceilometer plugin: A write plugin that pushes the retrieved stats to Ceilometer. It’s capable of pushing any stats read through collectd to Ceilometer, not just the DPDK stats.
hugepages plugin: A read plugin that retrieves the number of available and free hugepages on a platform as well as what is available in terms of hugepages per socket.
Other plugins in progress:
- dpdkevents: A read plugin that retrieves DPDK link status and DPDK forwarding cores liveliness status (DPDK Keep Alive).
- Open vSwitch stats Plugin: A read plugin that retrieve flow and interface stats from OVS.
- Open vSwitch events Plugin: A read plugin that retrieves events from OVS.
Monitoring Interfaces and Openstack Support

Monitoring Interfaces and Openstack Support
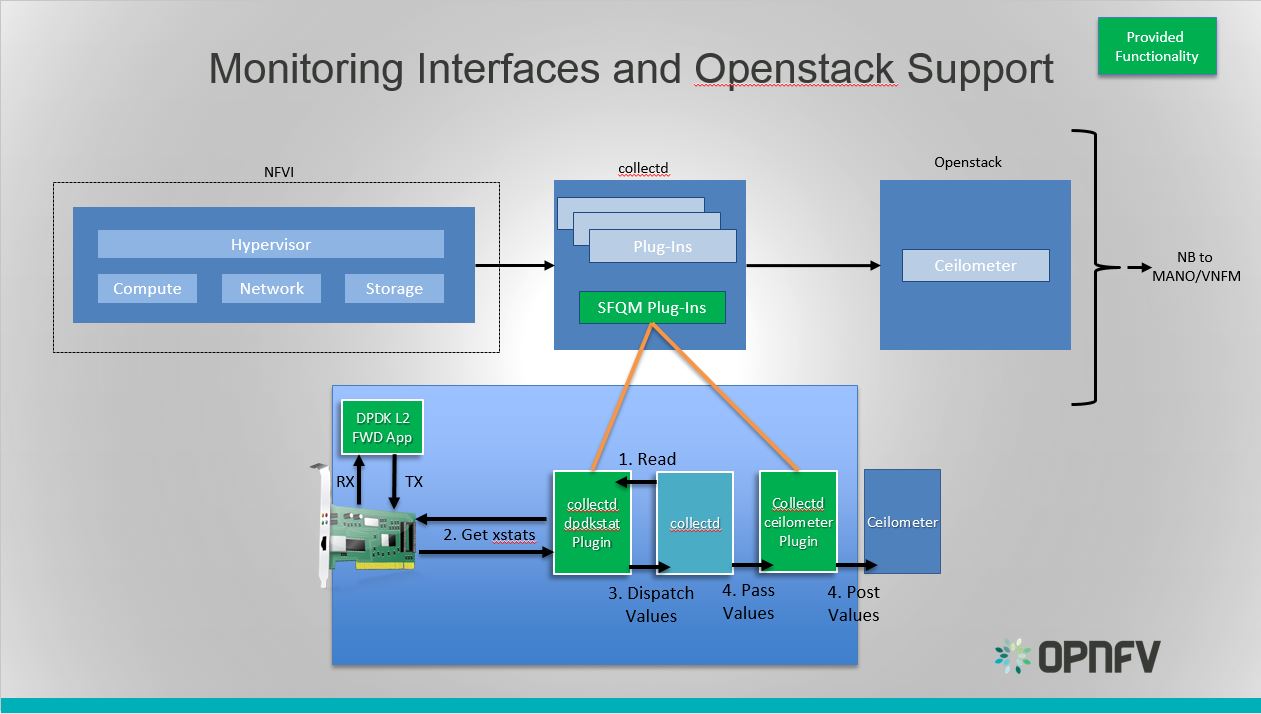
The figure above shows the DPDK L2 forwarding application running on a compute node, sending and receiving traffic. collectd is also running on this compute node retrieving the stats periodically from DPDK through the dpdkstat plugin and publishing the retrieved stats to Ceilometer through the ceilometer plugin.
To see this demo in action please checkout: SFQM OPNFV Summit demo
References
[1] https://collectd.org/wiki/index.php/Naming_schema [2] https://github.com/collectd/collectd/blob/master/src/daemon/plugin.h [3] https://collectd.org/wiki/index.php/Value_list_t [4] https://collectd.org/wiki/index.php/Data_set [5] https://collectd.org/documentation/manpages/types.db.5.shtml [6] https://collectd.org/wiki/index.php/Data_source [7] https://collectd.org/wiki/index.php/Meta_Data_Interface
DPDK Keep Alive description
SFQM aims to enable fault detection within DPDK, the very first feature to meet this goal is the DPDK Keep Alive Sample app that is part of DPDK 2.2.
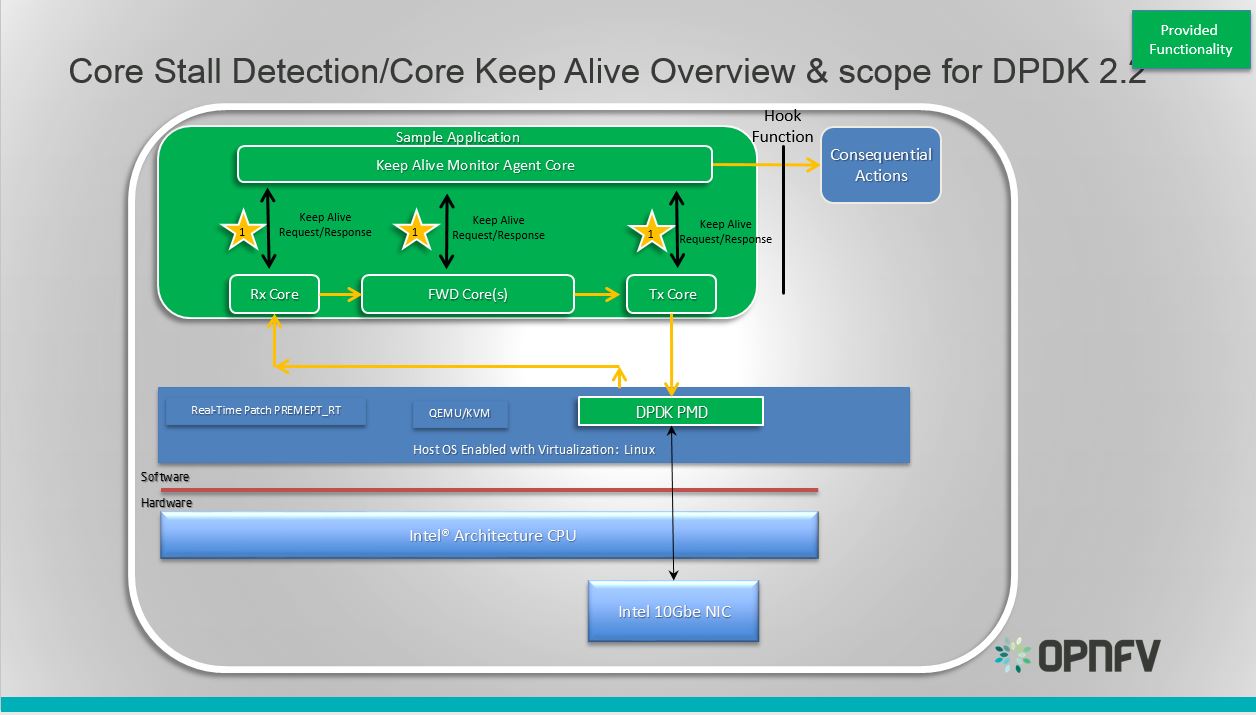
DPDK Keep Alive or KA is a sample application that acts as a heartbeat/watchdog for DPDK packet processing cores, to detect application thread failure. The application supports the detection of ‘failed’ DPDK cores and notification to a HA/SA middleware. The purpose is to detect Packet Processing Core fails (e.g. infinite loop) and ensure the failure of the core does not result in a fault that is not detectable by a management entity.

DPDK Keep Alive Sample Application
Essentially the app demonstrates how to detect ‘silent outages’ on DPDK packet processing cores. The application can be decomposed into two specific parts: detection and notification.
- The detection period is programmable/configurable but defaults to 5ms if no timeout is specified.
- The Notification support is enabled by simply having a hook function that where this can be ‘call back support’ for a fault management application with a compliant heartbeat mechanism.
DPDK Keep Alive Sample App Internals
This section provides some explanation of the The Keep-Alive/’Liveliness’ conceptual scheme as well as the DPDK Keep Alive App. The initialization and run-time paths are very similar to those of the L2 forwarding application (see L2 Forwarding Sample Application (in Real and Virtualized Environments) for more information).
There are two types of cores: a Keep Alive Monitor Agent Core (master DPDK core) and Worker cores (Tx/Rx/Forwarding cores). The Keep Alive Monitor Agent Core will supervise worker cores and report any failure (2 successive missed pings). The Keep-Alive/’Liveliness’ conceptual scheme is:
- DPDK worker cores mark their liveliness as they forward traffic.
- A Keep Alive Monitor Agent Core runs a function every N Milliseconds to inspect worker core liveliness.
- If keep-alive agent detects time-outs, it notifies the fault management entity through a call-back function.
Note: Only the worker cores state is monitored. There is no mechanism or agent to monitor the Keep Alive Monitor Agent Core.
DPDK Keep Alive Sample App Code Internals
The following section provides some explanation of the code aspects that are specific to the Keep Alive sample application.
The heartbeat functionality is initialized with a struct rte_heartbeat and the callback function to invoke in the case of a timeout.
rte_global_keepalive_info = rte_keepalive_create(&dead_core, NULL);
if (rte_global_hbeat_info == NULL)
    rte_exit(EXIT_FAILURE, "keepalive_create() failed");
The function that issues the pings hbeat_dispatch_pings() is configured to run every check_period milliseconds.
if (rte_timer_reset(&hb_timer,
        (check_period * rte_get_timer_hz()) / 1000,
        PERIODICAL,
        rte_lcore_id(),
        &hbeat_dispatch_pings, rte_global_keepalive_info
        ) != 0 )
    rte_exit(EXIT_FAILURE, "Keepalive setup failure.\n");
The rest of the initialization and run-time path follows the same paths as the the L2 forwarding application. The only addition to the main processing loop is the mark alive functionality and the example random failures.
rte_keepalive_mark_alive(&rte_global_hbeat_info);
cur_tsc = rte_rdtsc();

/* Die randomly within 7 secs for demo purposes.. */
if (cur_tsc - tsc_initial > tsc_lifetime)
break;
The rte_keepalive_mark_alive() function simply sets the core state to alive.
static inline void
rte_keepalive_mark_alive(struct rte_heartbeat *keepcfg)
{
    keepcfg->state_flags[rte_lcore_id()] = 1;
}
Keep Alive Monitor Agent Core Monitoring Options The application can run on either a host or a guest. As such there are a number of options for monitoring the Keep Alive Monitor Agent Core through a Local Agent on the compute node:
Application Location DPDK KA LOCAL AGENT HOST X HOST/GUEST GUEST X HOST/GUEST
For the first implementation of a Local Agent SFQM will enable:
Application Location DPDK KA LOCAL AGENT HOST X HOST
Through extending the dpdkstat plugin for collectd with KA functionality, and integrating the extended plugin with Monasca for high performing, resilient, and scalable fault detection.
