Design Documents
This is the directory to store design documents which may include draft versions of blueprints written before proposing to upstream OSS communities such as OpenStack, in order to keep the original blueprint as reviewed in OPNFV. That means there could be out-dated blueprints as result of further refinements in the upstream OSS community. Please refer to the link in each document to find the latest version of the blueprint and status of development in the relevant OSS community.
See also https://wiki.opnfv.org/requirements_projects .
Note
This is a specification draft of a blueprint proposed for OpenStack Nova Liberty. It was written by project member(s) and agreed within the project before submitting it upstream. No further changes to its content will be made here anymore; please follow it upstream:
- Current version upstream: https://review.openstack.org/#/c/169836/
- Development activity: https://blueprints.launchpad.net/nova/+spec/mark-host-down
Original draft is as follow:
Report host fault to update server state immediately
https://blueprints.launchpad.net/nova/+spec/update-server-state-immediately
A new API is needed to report a host fault to change the state of the instances and compute node immediately. This allows usage of evacuate API without a delay. The new API provides the possibility for external monitoring system to detect any kind of host failure fast and reliably and inform OpenStack about it. Nova updates the compute node state and states of the instances. This way the states in the Nova DB will be in sync with the real state of the system.
Problem description
- Nova state change for failed or unreachable host is slow and does not reliably state compute node is down or not. This might cause same instance to run twice if action taken to evacuate instance to another host.
- Nova state for instances on failed compute node will not change, but remains active and running. This gives user a false information about instance state. Currently one would need to call “nova reset-state” for each instance to have them in error state.
- OpenStack user cannot make HA actions fast and reliably by trusting instance state and compute node state.
- As compute node state changes slowly one cannot evacuate instances.
Use Cases
Use case in general is that in case there is a host fault one should change compute node state fast and reliably when using DB servicegroup backend. On top of this here is the use cases that are not covered currently to have instance states changed correctly: * Management network connectivity lost between controller and compute node. * Host HW failed.
Generic use case flow:
- The external monitoring system detects a host fault.
- The external monitoring system fences the host if not down already.
- The external system calls the new Nova API to force the failed compute node into down state as well as instances running on it.
- Nova updates the compute node state and state of the effected instances to Nova DB.
Currently nova-compute state will be changing “down”, but it takes a long time. Server state keeps as “vm_state: active” and “power_state: running”, which is not correct. By having external tool to detect host faults fast, fence host by powering down and then report host down to OpenStack, all these states would reflect to actual situation. Also if OpenStack will not implement automatic actions for fault correlation, external tool can do that. This could be configured for example in server instance METADATA easily and be read by external tool.
Project Priority
Liberty priorities have not yet been defined.
Proposed change
There needs to be a new API for Admin to state host is down. This API is used to mark compute node and instances running on it down to reflect the real situation.
Example on compute node is:
- When compute node is up and running: vm_state: active and power_state: running nova-compute state: up status: enabled
- When compute node goes down and new API is called to state host is down: vm_state: stopped power_state: shutdown nova-compute state: down status: enabled
vm_state values: soft-delete, deleted, resized and error should not be touched. task_state effect needs to be worked out if needs to be touched.
Alternatives
There is no attractive alternatives to detect all different host faults than to have a external tool to detect different host faults. For this kind of tool to exist there needs to be new API in Nova to report fault. Currently there must have been some kind of workarounds implemented as cannot trust or get the states from OpenStack fast enough.
Data model impact
None
REST API impact
Update CLI to report host is down
nova host-update command
- usage: nova host-update [–status <enable|disable>]
[–maintenance <enable|disable>] [–report-host-down] <hostname>
Update host settings.
Positional arguments
<hostname> Name of host.
Optional arguments
–status <enable|disable> Either enable or disable a host.
–maintenance <enable|disable> Either put or resume host to/from maintenance.
–down Report host down to update instance and compute node state in db.
Update Compute API to report host is down:
/v2.1/{tenant_id}/os-hosts/{host_name}
Normal response codes: 200 Request parameters
Parameter Style Type Description host_name URI xsd:string The name of the host of interest to you.
- {
- “host”: {
“status”: “enable”, “maintenance_mode”: “enable” “host_down_reported”: “true”
}
}
- {
- “host”: {
“host”: “65c5d5b7e3bd44308e67fc50f362aee6”, “maintenance_mode”: “enabled”, “status”: “enabled” “host_down_reported”: “true”
}
}
New method to nova.compute.api module HostAPI class to have a to mark host related instances and compute node down: set_host_down(context, host_name)
class novaclient.v2.hosts.HostManager(api) method update(host, values) Needs to handle reporting host down.
Schema does not need changes as in db only service and server states are to be changed.
Security impact
API call needs admin privileges (in the default policy configuration).
Notifications impact
None
Other end user impact
None
Performance Impact
Only impact is that user can get information faster about instance and compute node state. This also gives possibility to evacuate faster. No impact that would slow down. Host down should be rare occurrence.
Other deployer impact
Developer can make use of any external tool to detect host fault and report it to OpenStack.
Developer impact
None
Implementation
Assignee(s)
Primary assignee: Tomi Juvonen Other contributors: Ryota Mibu
Work Items
- Test cases.
- API changes.
- Documentation.
Dependencies
None
Testing
Test cases that exists for enabling or putting host to maintenance should be altered or similar new cases made test new functionality.
Documentation Impact
New API needs to be documented:
- Compute API extensions documentation. http://developer.openstack.org/api-ref-compute-v2.1.html
- Nova commands documentation. http://docs.openstack.org/user-guide-admin/content/novaclient_commands.html
- Compute command-line client documentation. http://docs.openstack.org/cli-reference/content/novaclient_commands.html
- nova.compute.api documentation. http://docs.openstack.org/developer/nova/api/nova.compute.api.html
- High Availability guide might have page to tell external tool could provide ability to provide faster HA as able to update states by new API. http://docs.openstack.org/high-availability-guide/content/index.html
References
- OPNFV Doctor project: https://wiki.opnfv.org/doctor
- OpenStack Instance HA Proposal: http://blog.russellbryant.net/2014/10/15/openstack-instance-ha-proposal/
- The Different Facets of OpenStack HA: http://blog.russellbryant.net/2015/03/10/ the-different-facets-of-openstack-ha/
Notification Alarm Evaluator
Note
This is spec draft of blueprint for OpenStack Ceilomter Liberty. To see current version: https://review.openstack.org/172893 To track development activity: https://blueprints.launchpad.net/ceilometer/+spec/notification-alarm-evaluator
https://blueprints.launchpad.net/ceilometer/+spec/notification-alarm-evaluator
This blueprint proposes to add a new alarm evaluator for handling alarms on events passed from other OpenStack services, that provides event-driven alarm evaluation which makes new sequence in Ceilometer instead of the polling-based approach of the existing Alarm Evaluator, and realizes immediate alarm notification to end users.
Problem description
As an end user, I need to receive alarm notification immediately once Ceilometer captured an event which would make alarm fired, so that I can perform recovery actions promptly to shorten downtime of my service. The typical use case is that an end user set alarm on “compute.instance.update” in order to trigger recovery actions once the instance status has changed to ‘shutdown’ or ‘error’. It should be nice that an end user can receive notification within 1 second after fault observed as the same as other helth- check mechanisms can do in some cases.
The existing Alarm Evaluator is periodically querying/polling the databases in order to check all alarms independently from other processes. This is good approach for evaluating an alarm on samples stored in a certain period. However, this is not efficient to evaluate an alarm on events which are emitted by other OpenStack servers once in a while.
The periodical evaluation leads delay on sending alarm notification to users. The default period of evaluation cycle is 60 seconds. It is recommended that an operator set longer interval than configured pipeline interval for underlying metrics, and also longer enough to evaluate all defined alarms in certain period while taking into account the number of resources, users and alarms.
Proposed change
The proposal is to add a new event-driven alarm evaluator which receives messages from Notification Agent and finds related Alarms, then evaluates each alarms;
- New alarm evaluator could receive event notification from Notification Agent by which adding a dedicated notifier as a publisher in pipeline.yaml (e.g. notifier://?topic=event_eval).
- When new alarm evaluator received event notification, it queries alarm database by Project ID and Resource ID written in the event notification.
- Found alarms are evaluated by referring event notification.
- Depending on the result of evaluation, those alarms would be fired through Alarm Notifier as the same as existing Alarm Evaluator does.
This proposal also adds new alarm type “notification” and “notification_rule”. This enables users to create alarms on events. The separation from other alarm types (such as “threshold” type) is intended to show different timing of evaluation and different format of condition, since the new evaluator will check each event notification once it received whereas “threshold” alarm can evaluate average of values in certain period calculated from multiple samples.
The new alarm evaluator handles Notification type alarms, so we have to change existing alarm evaluator to exclude “notification” type alarms from evaluation targets.
Alternatives
There was similar blueprint proposal “Alarm type based on notification”, but the approach is different. The old proposal was to adding new step (alarm evaluations) in Notification Agent every time it received event from other OpenStack services, whereas this proposal intends to execute alarm evaluation in another component which can minimize impact to existing pipeline processing.
Another approach is enhancement of existing alarm evaluator by adding notification listener. However, there are two issues; 1) this approach could cause stall of periodical evaluations when it receives bulk of notifications, and 2) this could break the alarm portioning i.e. when alarm evaluator received notification, it might have to evaluate some alarms which are not assign to it.
Data model impact
Resource ID will be added to Alarm model as an optional attribute. This would help the new alarm evaluator to filter out non-related alarms while querying alarms, otherwise it have to evaluate all alarms in the project.
REST API impact
Alarm API will be extended as follows;
- Add “notification” type into alarm type list
- Add “resource_id” to “alarm”
- Add “notification_rule” to “alarm”
Sample data of Notification-type alarm:
{
    "alarm_actions": [
        "http://site:8000/alarm"
    ],
    "alarm_id": null,
    "description": "An alarm",
    "enabled": true,
    "insufficient_data_actions": [
        "http://site:8000/nodata"
    ],
    "name": "InstanceStatusAlarm",
    "notification_rule": {
        "event_type": "compute.instance.update",
        "query" : [
            {
                "field" : "traits.state",
                "type" : "string",
                "value" : "error",
                "op" : "eq",
            },
        ]
    },
    "ok_actions": [],
    "project_id": "c96c887c216949acbdfbd8b494863567",
    "repeat_actions": false,
    "resource_id": "153462d0-a9b8-4b5b-8175-9e4b05e9b856",
    "severity": "moderate",
    "state": "ok",
    "state_timestamp": "2015-04-03T17:49:38.406845",
    "timestamp": "2015-04-03T17:49:38.406839",
    "type": "notification",
    "user_id": "c96c887c216949acbdfbd8b494863567"
}
“resource_id” will be refered to query alarm and will not be check permission and belonging of project.
Security impact
None
Pipeline impact
None
Other end user impact
None
Performance/Scalability Impacts
When Ceilomter received a number of events from other OpenStack services in short period, this alarm evaluator can keep working since events are queued in a messaging queue system, but it can cause delay of alarm notification to users and increase the number of read and write access to alarm database.
“resource_id” can be optional, but restricting it to mandatory could be reduce performance impact. If user create “notification” alarm without “resource_id”, those alarms will be evaluated every time event occurred in the project. That may lead new evaluator heavy.
Other deployer impact
New service process have to be run.
Developer impact
Developers should be aware that events could be notified to end users and avoid passing raw infra information to end users, while defining events and traits.
Implementation
Assignee(s)
- Primary assignee:
- r-mibu
- Other contributors:
- None
- Ongoing maintainer:
- None
Work Items
- New event-driven alarm evaluator
- Add new alarm type “notification” as well as AlarmNotificationRule
- Add “resource_id” to Alarm model
- Modify existing alarm evaluator to filter out “notification” alarms
- Add new config parameter for alarm request check whether accepting alarms without specifying “resource_id” or not
Future lifecycle
This proposal is key feature to provide information of cloud resources to end users in real-time that enables efficient integration with user-side manager or Orchestrator, whereas currently those information are considered to be consumed by admin side tool or service. Based on this change, we will seek orchestrating scenarios including fault recovery and add useful event definition as well as additional traits.
Dependencies
None
Testing
New unit/scenario tests are required for this change.
Documentation Impact
- Proposed evaluator will be described in the developer document.
- New alarm type and how to use will be explained in user guide.
References
- OPNFV Doctor project: https://wiki.opnfv.org/doctor
- Blueprint “Alarm type based on notification”: https://blueprints.launchpad.net/ceilometer/+spec/alarm-on-notification
Neutron Port Status Update
Note
This document represents a Neutron RFE reviewed in the Doctor project before submitting upstream to Launchpad Neutron space. The document is not intended to follow a blueprint format or to be an extensive document. For more information, please visit http://docs.openstack.org/developer/neutron/policies/blueprints.html
The RFE was submitted to Neutron. You can follow the discussions in https://bugs.launchpad.net/neutron/+bug/1598081
Neutron port status field represents the current status of a port in the cloud infrastructure. The field can take one of the following values: ‘ACTIVE’, ‘DOWN’, ‘BUILD’ and ‘ERROR’.
At present, if a network event occurs in the data-plane (e.g. virtual or physical switch fails or one of its ports, cable gets pulled unintentionally, infrastructure topology changes, etc.), connectivity to logical ports may be affected and tenants’ services interrupted. When tenants/cloud administrators are looking up their resources’ status (e.g. Nova instances and services running in them, network ports, etc.), they will wrongly see everything looks fine. The problem is that Neutron will continue reporting port ‘status’ as ‘ACTIVE’.
Many SDN Controllers managing network elements have the ability to detect and report network events to upper layers. This allows SDN Controllers’ users to be notified of changes and react accordingly. Such information could be consumed by Neutron so that Neutron could update the ‘status’ field of those logical ports, and additionally generate a notification message to the message bus.
However, Neutron misses a way to be able to receive such information through e.g. ML2 driver or the REST API (‘status’ field is read-only). There are pros and cons on both of these approaches as well as other possible approaches. This RFE intends to trigger a discussion on how Neutron could be improved to receive fault/change events from SDN Controllers or even also from 3rd parties not in charge of controlling the network (e.g. monitoring systems, human admins).
Port data plane status
https://bugs.launchpad.net/neutron/+bug/1598081
Neutron does not detect data plane failures affecting its logical resources. This spec addresses that issue by means of allowing external tools to report to Neutron about faults in the data plane that are affecting the ports. A new REST API field is proposed to that end.
Problem Description
An initial description of the problem was introduced in bug #159801 [1]. This spec focuses on capturing one (main) part of the problem there described, i.e. extending Neutron’s REST API to cover the scenario of allowing external tools to report network failures to Neutron. Out of scope of this spec are works to enable port status changes to be received and managed by mechanism drivers.
This spec also tries to address bug #1575146 [2]. Specifically, and argued by the Neutron driver team in [3]:
- Neutron should not shut down the port completly upon detection of physnet failure; connectivity between instances on the same node may still be reachable. Externals tools may or may not want to trigger a status change on the port based on their own logic and orchestration.
- Port down is not detected when an uplink of a switch is down;
- The physnet bridge may have multiple physical interfaces plugged; shutting down the logical port may not be needed in case network redundancy is in place.
Proposed Change
A couple of possible approaches were proposed in [1] (comment #3). This spec proposes tackling the problema via a new extension API to the port resource. The extension adds a new attribute ‘dp-down’ (data plane down) to represent the status of the data plane. The field should be read-only by tenants and read-write by admins.
Neutron should send out an event to the message bus upon toggling the data plane status value. The event is relevant for e.g. auditing.
Data Model Impact
A new attribute as extension will be added to the ‘ports’ table.
| Attribute Name | Type | Access | Default Value | Validation/ Conversion | Description |
|---|---|---|---|---|---|
| dp_down | boolean | RO, tenant RW, admin | False | True/False |
REST API Impact
A new API extension to the ports resource is going to be introduced.
EXTENDED_ATTRIBUTES_2_0 = {
    'ports': {
        'dp_down': {'allow_post': False, 'allow_put': True,
                    'default': False, 'convert_to': convert_to_boolean,
                    'is_visible': True},
    },
}
Examples
Updating port data plane status to down:
PUT /v2.0/ports/<port-uuid>
Accept: application/json
{
    "port": {
        "dp_down": true
    }
}
Command Line Client Impact
neutron port-update [--dp-down <True/False>] <port>
openstack port set [--dp-down <True/False>] <port>
Argument –dp-down is optional. Defaults to False.
Security Impact
None
Notifications Impact
A notification (event) upon toggling the data plane status (i.e. ‘dp-down’ attribute) value should be sent to the message bus. Such events do not happen with high frequency and thus no negative impact on the notification bus is expected.
Performance Impact
None
IPv6 Impact
None
Other Deployer Impact
None
Developer Impact
None
Implementation
Assignee(s)
- cgoncalves
Work Items
- New ‘dp-down’ attribute in ‘ports’ database table
- API extension to introduce new field to port
- Client changes to allow for data plane status (i.e. ‘dp-down’ attribute’) being set
- Policy (tenants read-only; admins read-write)
Documentation Impact
Documentation for both administrators and end users will have to be contemplated. Administrators will need to know how to set/unset the data plane status field.
References
| [1] | RFE: Port status update, https://bugs.launchpad.net/neutron/+bug/1598081 |
| [2] | RFE: ovs port status should the same as physnet https://bugs.launchpad.net/neutron/+bug/1575146 |
| [3] | Neutron Drivers meeting, July 21, 2016 http://eavesdrop.openstack.org/meetings/neutron_drivers/2016/neutron_drivers.2016-07-21-22.00.html |
Inspector Design Guideline
Note
This is spec draft of design guideline for inspector component. JIRA ticket to track the update and collect comments: DOCTOR-73.
This document summarize the best practise in designing a high performance inspector to meet the requirements in OPNFV Doctor project.
Problem Description
Some pitfalls has be detected during the development of sample inspector, e.g. we suffered a significant performance degrading in listing VMs in a host.
A patch set for caching the list has been committed to solve issue. When a new inspector is integrated, it would be nice to have an evaluation of existing design and give recommendations for improvements.
This document can be treated as a source of related blueprints in inspector projects.
Guidelines
Host specific VMs list
While requirement in doctor project is to have alarm about fault to consumer in one second, it is just a limit we have set in requirements. When talking about fault management in Telco, the implementation needs to be by all means optimal and the one second is far from traditional Telco requirements.
One thing to be optimized in inspector is to eliminate the need to read list of host specific VMs from Nova API, when
it gets a host specific failure event. Optimal way of implementation would be to initialize this list when Inspector
start by reading from Nova API and after this list would be kept up-to-date by instance.update notifications
received from nova. Polling Nova API can be used as a complementary channel to make snapshot of hosts and VMs list in
order to keep the data consistent with reality.
This is enhancement and not perhaps something needed to keep under one second in a small system. Anyhow this would be something needed in case of production use.
This guideline can be summarized as following:
- cache the host VMs mapping instead of reading it on request
- subscribe and handle update notifications to keep the list up to date
- make snapshot periodically to ensure data consistency
Parallel execution
In doctor’s architecture, the inspector is responsible to set error state for the affected VMs in order to notify the consumers of such failure. This is done by calling the nova reset-state API. However, this action is a synchronous request with many underlying steps and cost typically hundreds of milliseconds. According to the discussion in mailing list, this time cost will grow linearly if the requests are sent one by one. It will become a critical issue in large scale system.
It is recommended to introduce parallel execution for actions like reset-state that takes a list of targets.
Shortcut notification
An alternative way to improve notification performance is to take a shortcut from inspector to notifier instead of triggering it from controller. The difference between the two workflow is shown below:
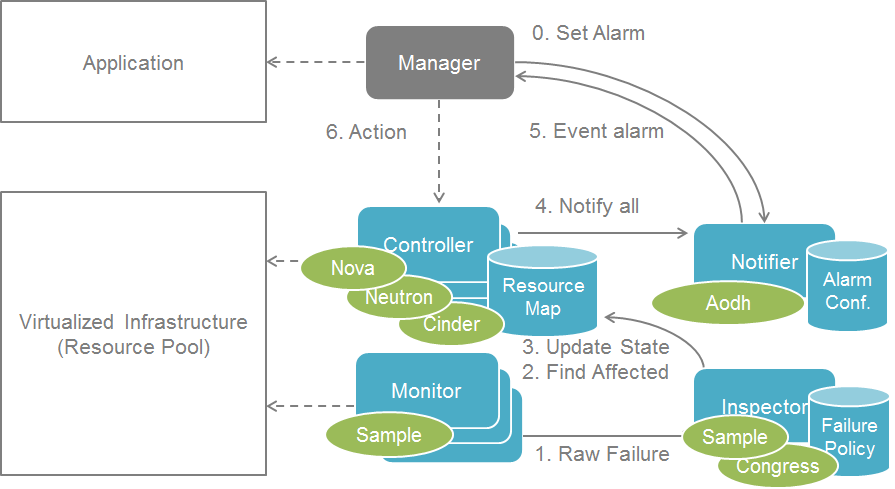
Conservative Notification
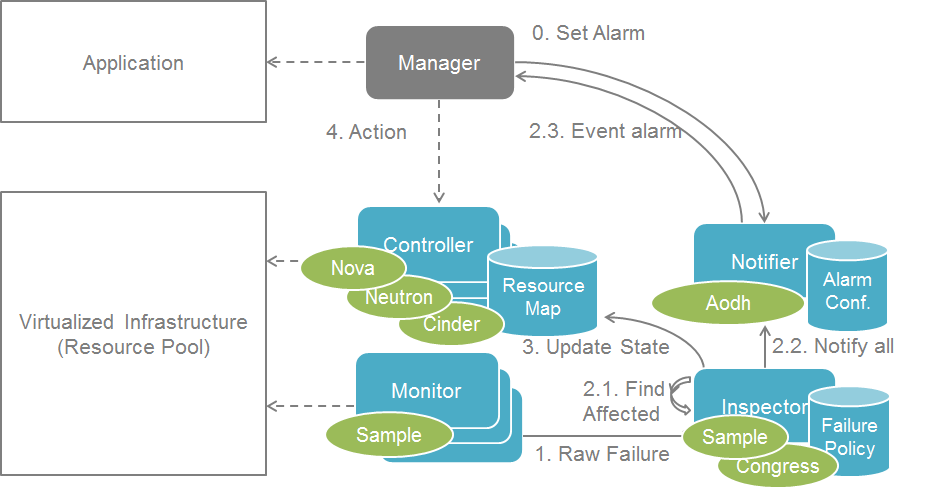
Shortcut Notification
It worth noting that the shortcut notification has a side effect that cloud resource states could still be out-of-sync by the time consumer processes the alarm notification. This is out of scope of inspector design but need to be taken consideration in system level.
Also the call of “reset servers state to error” is not necessary in the alternative notification case where the “host forced down” is still called. “get-valid-server-state” was implemented to have valid server state while earlier one couldn’t get it unless calling “reset servers state to error”. When not having “reset servers state to error”, states are more unlikely to be out of sync while notification and force down host would be parallel.
Appendix
A study has been made to evaluate the effect of parallel execution and shortcut notification on OPNFV Beijing Summit 2017.
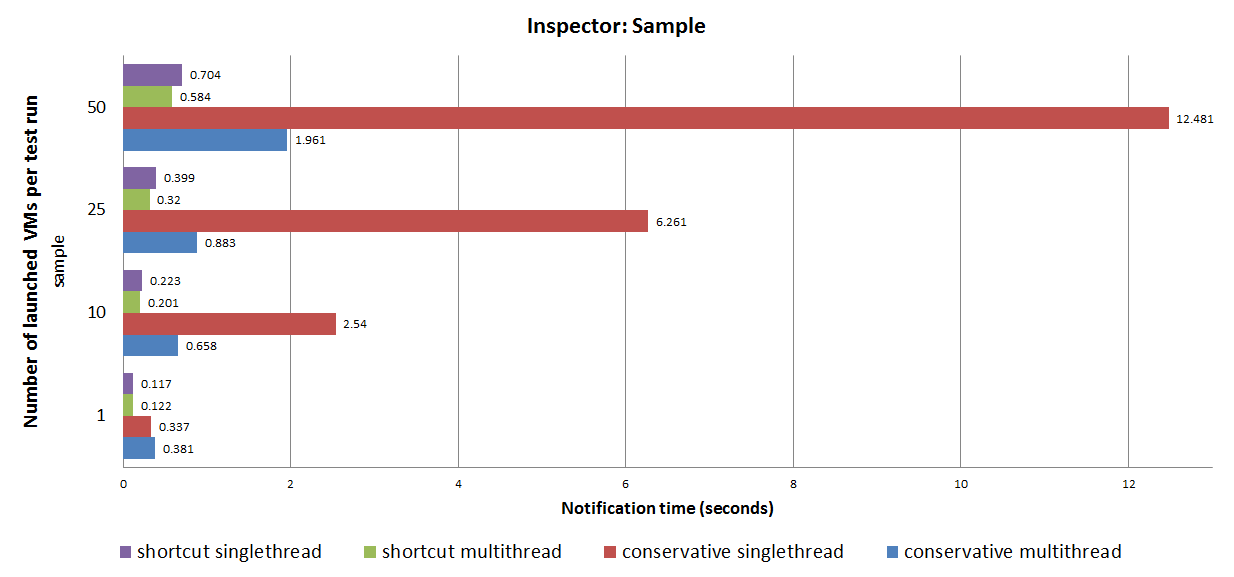
Notification Time
Download the full presentation slides here.
Performance Profiler
This blueprint proposes to create a performance profiler for doctor scenarios.
Problem Description
In the verification job for notification time, we have encountered some performance issues, such as
1. In environment deployed by APEX, it meets the criteria while in the one by Fuel, the performance is much more poor. 2. Signification performance degradation was spotted when we increase the total number of VMs
It takes time to dig the log and analyse the reason. People have to collect timestamp at each checkpoints manually to find out the bottleneck. A performance profiler will make this process automatic.
Proposed Change
Current Doctor scenario covers the inspector and notifier in the whole fault management cycle:
start                                          end
  +       +         +        +       +          +
  |       |         |        |       |          |
  |monitor|inspector|notifier|manager|controller|
  +------>+         |        |       |          |
occurred  +-------->+        |       |          |
  |     detected    +------->+       |          |
  |       |     identified   +-------+          |
  |       |               notified   +--------->+
  |       |                  |    processed  resolved
  |       |                  |                  |
  |       +<-----doctor----->+                  |
  |                                             |
  |                                             |
  +<---------------fault management------------>+
The notification time can be split into several parts and visualized as a timeline:
start                                         end
  0----5---10---15---20---25---30---35---40---45--> (x 10ms)
  +    +   +   +   +    +      +   +   +   +   +
0-hostdown |   |   |    |      |   |   |   |   |
  +--->+   |   |   |    |      |   |   |   |   |
  |  1-raw failure |    |      |   |   |   |   |
  |    +-->+   |   |    |      |   |   |   |   |
  |    | 2-found affected      |   |   |   |   |
  |    |   +-->+   |    |      |   |   |   |   |
  |    |     3-marked host down|   |   |   |   |
  |    |       +-->+    |      |   |   |   |   |
  |    |         4-set VM error|   |   |   |   |
  |    |           +--->+      |   |   |   |   |
  |    |           |  5-notified VM error  |   |
  |    |           |    +----->|   |   |   |   |
  |    |           |    |    6-transformed event
  |    |           |    |      +-->+   |   |   |
  |    |           |    |      | 7-evaluated event
  |    |           |    |      |   +-->+   |   |
  |    |           |    |      |     8-fired alarm
  |    |           |    |      |       +-->+   |
  |    |           |    |      |         9-received alarm
  |    |           |    |      |           +-->+
sample | sample    |    |      |           |10-handled alarm
monitor| inspector |nova| c/m  |    aodh   |
  |                                        |
  +<-----------------doctor--------------->+
Note: c/m = ceilometer
And a table of components sorted by time cost from most to least
| Component | Time Cost | Percentage |
|---|---|---|
| inspector | 160ms | 40% |
| aodh | 110ms | 30% |
| monitor | 50ms | 14% |
| ... | ||
| ... |
Note: data in the table is for demonstration only, not actual measurement
Timestamps can be collected from various sources
- log files
- trace point in code
The performance profiler will be integrated into the verification job to provide detail result of the test. It can also be deployed independently to diagnose performance issue in specified environment.
Working Items
- PoC with limited checkpoints
- Integration with verification job
- Collect timestamp at all checkpoints
- Display the profiling result in console
- Report the profiling result to test database
- Independent package which can be installed to specified environment
Planned Maintenance Design Guideline
Note
This is spec draft of design guideline for planned maintenance. JIRA ticket to track the update and collect comments: DOCTOR-52.
This document describes how one can implement planned maintenance by utilizing the OPNFV Doctor project. framework and to meet the set requirements.
Problem Description
Telco application need to know when planned maintenance is going to happen in order to guarantee zero down time in its operation. It needs to be possible to make own actions to have application running on not affected resource or give guidance to admin actions like migration. More details are defined in requirement documentation: use cases, architecture and implementation. Also discussion in the OPNFV summit about planned maintenance session.
Guidelines
Cloud admin needs to make a notification about planned maintenance including all details that application needs in order to make decisions upon his affected service. This notification payload can be consumed by application by subscribing to corresponding event alarm trough alarming service like OpenStack AODH.
Before maintenance starts application needs to be able to make switch over for his ACT-STBY service affected, do operation to move service to not effected part of infra or give a hint for admin operation like migration that can be automatically issued by admin tool according to agreed policy.
Flow diagram:
admin alarming project  controller  inspector
  |   service  app manager   |           |
  |  1.   |         |        |           |
  +------------------------->+           |
  +<-------------------------+           |
  |  2.   |         |        |           |
  +------>+    3.   |        |           |
  |       +-------->+   4.   |           |
  |       |         +------->+           |
  |       |    5.   +<-------+           |
  +<----------------+        |           |
  |                 |   6.   |           |
  +------------------------->+           |
  +<-------------------------+     7.    |
  +------------------------------------->+
  |   8.  |         |        |           |
  +------>+    9.   |        |           |
  |       +-------->+        |           |
  +--------------------------------------+
  |                10.                   |
  +--------------------------------------+
  |  11.  |         |        |           |
  +------------------------->+           |
  +<-------------------------+           |
  |  12.  |         |        |           |
  +------>+-------->+        |    13.    |
  +------------------------------------->+
  +-------+---------+--------+-----------+
Concepts used below:
- full maintenance: This means maintenance will take a longer time and resource should be emptied, meaning container or VM need to be moved or deleted. Admin might need to test resource to work after maintenance.
- reboot: Only a reboot is needed and admin does not need separate testing after that. Container or VM can be left in place if so wanted.
- notification: Notification to rabbitmq.
Admin makes a planned maintenance session where he sets a maintenance_session_id that is a unique ID for all the hardware resources he is going to have the maintenance at the same time. Mostly maintenance should be done node by node, meaning a single compute node at a time would be in single planned maintenance session having unique maintenance_session_id. This ID will be carried trough the whole session in all places and can be used to query maintenance in admin tool API. Project running a Telco application should set a specific role for admin tool to know it cannot do planned maintenance unless project has agreed actions to be done for its VMs or containers. This means the project has configured itself to get alarms upon planned maintenance and it is capable of agreeing needed actions. Admin is supposed to use an admin tool to automate maintenance process partially or entirely.
The flow of a successful planned maintenance session as in OpenStack example case:
- Admin disables nova-compute in order to do planned maintenance on a compute host and gets ACK from the API call. This action needs to be done to ensure no thing will be placed in this compute host by any user. Action is always done regardless the whole compute will be affected or not.
- Admin sends a project specific maintenance notification with state planned maintenance. This includes detailed information about maintenance, like when it is going to start, is it reboot or full maintenance including the information about project containers or VMs running on host or the part of it that will need maintenance. Also default action like migration will be mentioned that will be issued by admin before maintenance starts if no other action is set by project. In case project has a specific role set, planned maintenance cannot start unless project has agreed the admin action. Available admin actions are also listed in notification.
- Application manager of the project receives AODH alarm about the same.
- Application manager can do switch over to his ACT-STBY service, delete and re-instantiate his service on not affected resource if so wanted.
- Application manager may call admin tool API to give preferred instructions for leaving VMs and containers in place or do admin action to migrate them. In case admin does not receive this instruction before maintenance is to start it will do the pre-configured default action like migration to projects without a specific role to say project need to agree the action. VMs or Containers can be left on host if type of maintenance is just reboot.
- Admin does possible actions to VMs and containers and receives an ACK.
- In case everything went ok, Admin sends admin type of maintenance notification with state in maintenance. This notification can be consumed by Inspector and other cloud services to know there is ongoing maintenance which means things like automatic fault management actions for the hardware resources should be disabled.
- If maintenance type is reboot and project is still having containers or VMs running on affected hardware resource, Admin sends project specific maintenance notification with state updated to in maintenance. If project do not have anything left running on affected hardware resource, state will be maintenance over instead. If maintenance can not be performed for some reason state should be maintenance cancelled. In this case last operation remaining for admin is to re-enable nova-compute service, ensure everything is running and not to proceed any further steps.
- Application manager of the project receives AODH alarm about the same.
- Admin will do the maintenance. This is out of Doctor scope.
- Admin enables nova-compute service when maintenance is over and host can be put back to production. An ACK is received from API call.
- In case project had left containers or VMs on hardware resource over maintenance, Admin sends project specific maintenance notification with state updated to maintenance over.
- Admin sends admin type of maintenance notification with state updated to maintenance over. Inspector and other cloud services can consume this to know hardware resource is back in use.
POC
There was a Maintenance POC for planned maintenance in the OPNFV Beijing summit to show the basic concept of using framework defined by the project.
Inspector Design Guideline
Note
This is spec draft of design guideline for inspector component. JIRA ticket to track the update and collect comments: DOCTOR-73.
This document summarize the best practise in designing a high performance inspector to meet the requirements in OPNFV Doctor project.
Problem Description
Some pitfalls has be detected during the development of sample inspector, e.g. we suffered a significant performance degrading in listing VMs in a host.
A patch set for caching the list has been committed to solve issue. When a new inspector is integrated, it would be nice to have an evaluation of existing design and give recommendations for improvements.
This document can be treated as a source of related blueprints in inspector projects.
Guidelines
Host specific VMs list
While requirement in doctor project is to have alarm about fault to consumer in one second, it is just a limit we have set in requirements. When talking about fault management in Telco, the implementation needs to be by all means optimal and the one second is far from traditional Telco requirements.
One thing to be optimized in inspector is to eliminate the need to read list of host specific VMs from Nova API, when
it gets a host specific failure event. Optimal way of implementation would be to initialize this list when Inspector
start by reading from Nova API and after this list would be kept up-to-date by instance.update notifications
received from nova. Polling Nova API can be used as a complementary channel to make snapshot of hosts and VMs list in
order to keep the data consistent with reality.
This is enhancement and not perhaps something needed to keep under one second in a small system. Anyhow this would be something needed in case of production use.
This guideline can be summarized as following:
- cache the host VMs mapping instead of reading it on request
- subscribe and handle update notifications to keep the list up to date
- make snapshot periodically to ensure data consistency
Parallel execution
In doctor’s architecture, the inspector is responsible to set error state for the affected VMs in order to notify the consumers of such failure. This is done by calling the nova reset-state API. However, this action is a synchronous request with many underlying steps and cost typically hundreds of milliseconds. According to the discussion in mailing list, this time cost will grow linearly if the requests are sent one by one. It will become a critical issue in large scale system.
It is recommended to introduce parallel execution for actions like reset-state that takes a list of targets.
Shortcut notification
An alternative way to improve notification performance is to take a shortcut from inspector to notifier instead of triggering it from controller. The difference between the two workflow is shown below:
Conservative Notification
Shortcut Notification
It worth noting that the shortcut notification has a side effect that cloud resource states could still be out-of-sync by the time consumer processes the alarm notification. This is out of scope of inspector design but need to be taken consideration in system level.
Also the call of “reset servers state to error” is not necessary in the alternative notification case where the “host forced down” is still called. “get-valid-server-state” was implemented to have valid server state while earlier one couldn’t get it unless calling “reset servers state to error”. When not having “reset servers state to error”, states are more unlikely to be out of sync while notification and force down host would be parallel.
Appendix
A study has been made to evaluate the effect of parallel execution and shortcut notification on OPNFV Beijing Summit 2017.
Notification Time
Download the full presentation slides here.