Barometer user guide
collectd plugins
Barometer has enabled the following collectd plugins:
- dpdkstat plugin: A read plugin that retrieve stats from the DPDK extended
- NIC stats API.
- ceilometer plugin: A write plugin that pushes the retrieved stats to Ceilometer. It’s capable of pushing any stats read through collectd to Ceilometer, not just the DPDK stats.
- hugepages plugin: A read plugin that retrieves the number of available and free hugepages on a platform as well as what is available in terms of hugepages per socket.
- RDT plugin: A read plugin that provides the last level cache utilitzation and memory bandwidth utilization
- Open vSwitch events Plugin: A read plugin that retrieves events from OVS.
- mcelog plugin: A read plugin that uses mcelog client protocol to check for memory Machine Check Exceptions and sends the stats for reported exceptions
All the plugins above are available on the collectd master, except for the ceilometer plugin as it’s a python based plugin and only C plugins are accepted by the collectd community. The ceilometer plugin lives in the OpenStack repositories.
Other plugins under development or existing as a pull request into collectd master:
- dpdkevents: A read plugin that retrieves DPDK link status and DPDK forwarding cores liveliness status (DPDK Keep Alive).
- Open vSwitch stats Plugin: A read plugin that retrieve flow and interface stats from OVS.
- SNMP Agent: A write plugin that will act as a AgentX subagent that receives and handles queries from SNMP master agent and returns the data collected by read plugins. The SNMP Agent plugin handles requests only for OIDs specified in configuration file. To handle SNMP queries the plugin gets data from collectd and translates requested values from collectd’s internal format to SNMP format. Supports SNMP: get, getnext and walk requests.
- Legacy/IPMI: A read plugin that reports platform thermals, voltages, fanspeed, current, flow, power etc. Also, the plugin monitors Intelligent Platform Management Interface (IPMI) System Event Log (SEL) and sends the collectd notification once a new record appears in the SEL.
Building collectd with the Barometer plugins and installing the dependencies
All Upstreamed plugins
The plugins that have been merged to the collectd master branch can all be built and configured through the barometer repository.
Note: sudo permissions are required to install collectd.
Note: These are instructions for Ubuntu 16.04.
To build and install these dependencies, clone the barometer repo:
$ git clone https://gerrit.opnfv.org/gerrit/barometer
Install the build dependencies
$ ./src/install_build_deps.sh
To install collectd as a service and install all it’s dependencies:
$ cd barometer/src && sudo make && sudo make install
This will install collectd as a service and the base install directory is /opt/collectd.
Sample configuration files can be found in ‘/opt/collectd/etc/collectd.conf.d’
Note: Exec plugin requires non-root user to execute scripts. By default, collectd_exec user is used. Barometer scripts do not create this user. It needs to be manually added or exec plugin configuration has to be changed to use other, existing user before starting collectd service.
Please note if you are using any Open vSwitch plugins you need to run:
$ sudo ovs-vsctl set-manager ptcp:6640
DPDK statistics plugin
Repo: https://github.com/collectd/collectd
Branch: master
Dependencies: DPDK (http://dpdk.org/)
To build and install DPDK to /usr please see: https://github.com/collectd/collectd/blob/master/docs/BUILD.dpdkstat.md
Building and installing collectd:
$ git clone https://github.com/collectd/collectd.git
$ cd collectd
$ ./build.sh
$ ./configure --enable-syslog --enable-logfile --enable-debug
$ make
$ sudo make install
This will install collectd to /opt/collectd The collectd configuration file can be found at /opt/collectd/etc To configure the hugepages plugin you need to modify the configuration file to include:
LoadPlugin dpdkstat
<Plugin dpdkstat>
       Coremask "0xf"
       ProcessType "secondary"
       FilePrefix "rte"
       EnabledPortMask 0xffff
</Plugin>
For more information on the plugin parameters, please see: https://github.com/collectd/collectd/blob/master/src/collectd.conf.pod
Please note if you are configuring collectd with the static DPDK library you must compile the DPDK library with the -fPIC flag:
$ make EXTRA_CFLAGS=-fPIC
You must also modify the configuration step when building collectd:
$ ./configure CFLAGS=" -lpthread -Wl,--whole-archive -Wl,-ldpdk -Wl,-lm -Wl,-lrt -Wl,-lpcap -Wl,-ldl -Wl,--no-whole-archive"
Please also note that if you are not building and installing DPDK system-wide you will need to specify the specific paths to the header files and libraries using LIBDPDK_CPPFLAGS and LIBDPDK_LDFLAGS. You will also need to add the DPDK library symbols to the shared library path using ldconfig. Note that this update to the shared library path is not persistant (i.e. it will not survive a reboot). Pending a merge of https://github.com/collectd/collectd/pull/2073.
$ ./configure LIBDPDK_CPPFLAGS="path to DPDK header files" LIBDPDK_LDFLAGS="path to DPDK libraries"
Hugepages Plugin
Repo: https://github.com/collectd/collectd
Branch: master
Dependencies: None, but assumes hugepages are configured.
To configure some hugepages:
sudo mkdir -p /mnt/huge
sudo mount -t hugetlbfs nodev /mnt/huge
sudo echo 14336 > /sys/devices/system/node/node0/hugepages/hugepages-2048kB/nr_hugepages
Building and installing collectd:
$ git clone https://github.com/collectd/collectd.git
$ cd collectd
$ ./build.sh
$ ./configure --enable-syslog --enable-logfile --enable-hugepages --enable-debug
$ make
$ sudo make install
This will install collectd to /opt/collectd The collectd configuration file can be found at /opt/collectd/etc To configure the hugepages plugin you need to modify the configuration file to include:
LoadPlugin hugepages
<Plugin hugepages>
    ReportPerNodeHP  true
    ReportRootHP     true
    ValuesPages      true
    ValuesBytes      false
    ValuesPercentage false
</Plugin>
For more information on the plugin parameters, please see: https://github.com/collectd/collectd/blob/master/src/collectd.conf.pod
Intel RDT Plugin
Repo: https://github.com/collectd/collectd
Branch: master
Dependencies:
- PQoS/Intel RDT library https://github.com/01org/intel-cmt-cat.git
- msr kernel module
Building and installing PQoS/Intel RDT library:
$ git clone https://github.com/01org/intel-cmt-cat.git
$ cd intel-cmt-cat
$ make
$ make install PREFIX=/usr
You will need to insert the msr kernel module:
$ modprobe msr
Building and installing collectd:
$ git clone https://github.com/collectd/collectd.git
$ cd collectd
$ ./build.sh
$ ./configure --enable-syslog --enable-logfile --with-libpqos=/usr/ --enable-debug
$ make
$ sudo make install
This will install collectd to /opt/collectd The collectd configuration file can be found at /opt/collectd/etc To configure the RDT plugin you need to modify the configuration file to include:
<LoadPlugin intel_rdt>
  Interval 1
</LoadPlugin>
<Plugin "intel_rdt">
  Cores ""
</Plugin>
For more information on the plugin parameters, please see: https://github.com/collectd/collectd/blob/master/src/collectd.conf.pod
IPMI Plugin
Repo: https://github.com/maryamtahhan/collectd
Branch: feat_ipmi_events, feat_ipmi_analog
Dependencies: OpenIPMI library
The IPMI plugin is already implemented in the latest collectd and sensors like temperature, voltage, fanspeed, current are already supported there. The list of supported IPMI sensors has been extended and sensors like flow, power are supported now. Also, a System Event Log (SEL) notification feature has been introduced.
- The feat_ipmi_events branch includes new SEL feature support in collectd IPMI plugin. If this feature is enabled, the collectd IPMI plugin will dispatch notifications about new events in System Event Log.
- The feat_ipmi_analog branch includes the support of extended IPMI sensors in collectd IPMI plugin.
On Ubuntu, install the dependencies:
$ sudo apt-get install libopenipmi-dev
Enable IPMI support in the kernel:
$ sudo modprobe ipmi_devintf
$ sudo modprobe ipmi_si
Note: If HW supports IPMI, the /dev/ipmi0 character device will be
created.
Clone and install the collectd IPMI plugin:
$ git clone  https://github.com/maryamtahhan/collectd
$ cd collectd
$ git checkout $BRANCH
$ ./build.sh
$ ./configure --enable-syslog --enable-logfile --enable-debug
$ make
$ sudo make install
Where $BRANCH is feat_ipmi_events or feat_ipmi_analog.
This will install collectd to default folder /opt/collectd. The collectd
configuration file (collectd.conf) can be found at /opt/collectd/etc. To
configure the IPMI plugin you need to modify the file to include:
LoadPlugin ipmi
<Plugin ipmi>
   SELEnabled true # only feat_ipmi_events branch supports this
</Plugin>
Note: By default, IPMI plugin will read all available analog sensor values, dispatch the values to collectd and send SEL notifications.
For more information on the IPMI plugin parameters and SEL feature configuration, please see:
https://github.com/maryamtahhan/collectd/blob/feat_ipmi_events/src/collectd.conf.pod
Extended analog sensors support doesn’t require addition configuration. The usual collectd IPMI documentation can be used.
https://collectd.org/wiki/index.php/Plugin:IPMI https://collectd.org/documentation/manpages/collectd.conf.5.shtml#plugin_ipmi
IPMI documentation:
https://www.kernel.org/doc/Documentation/IPMI.txt http://www.intel.com/content/www/us/en/servers/ipmi/ipmi-second-gen-interface-spec-v2-rev1-1.html
Mcelog Plugin:
Repo: https://github.com/collectd/collectd
Branch: master
Dependencies: mcelog
Start by installing mcelog. Note: The kernel has to have CONFIG_X86_MCE enabled. For 32bit kernels you need at least a 2.6,30 kernel.
On ubuntu:
$ apt-get update && apt-get install mcelog
Or build from source
$ git clone git://git.kernel.org/pub/scm/utils/cpu/mce/mcelog.git
$ cd mcelog
$ make
... become root ...
$ make install
$ cp mcelog.service /etc/systemd/system/
$ systemctl enable mcelog.service
$ systemctl start mcelog.service
Verify you got a /dev/mcelog. You can verify the daemon is running completely by running:
$ mcelog --client
This should query the information in the running daemon. If it prints nothing that is fine (no errors logged yet). More info @ http://www.mcelog.org/installation.html
Modify the mcelog configuration file “/etc/mcelog/mcelog.conf” to include or enable:
socket-path = /var/run/mcelog-client
Clone and install the collectd mcelog plugin:
$ git clone  https://github.com/maryamtahhan/collectd
$ cd collectd
$ git checkout feat_ras
$ ./build.sh
$ ./configure --enable-syslog --enable-logfile --enable-debug
$ make
$ sudo make install
This will install collectd to /opt/collectd The collectd configuration file can be found at /opt/collectd/etc To configure the mcelog plugin you need to modify the configuration file to include:
<LoadPlugin mcelog>
  Interval 1
</LoadPlugin>
<Plugin "mcelog">
   McelogClientSocket "/var/run/mcelog-client"
</Plugin>
For more information on the plugin parameters, please see: https://github.com/maryamtahhan/collectd/blob/feat_ras/src/collectd.conf.pod
Simulating a Machine Check Exception can be done in one of 3 ways:
- Running $make test in the mcelog cloned directory - mcelog test suite
- using mce-inject
- using mce-test
mcelog test suite:
It is always a good idea to test an error handling mechanism before it is really needed. mcelog includes a test suite. The test suite relies on mce-inject which needs to be installed and in $PATH.
You also need the mce-inject kernel module configured (with CONFIG_X86_MCE_INJECT=y), compiled, installed and loaded:
$ modprobe mce-inject
Then you can run the mcelog test suite with
$ make test
This will inject different classes of errors and check that the mcelog triggers runs. There will be some kernel messages about page offlining attempts. The test will also lose a few pages of memory in your system (not significant) Note this test will kill any running mcelog, which needs to be restarted manually afterwards.
mce-inject:
A utility to inject corrected, uncorrected and fatal machine check exceptions
$ git clone https://git.kernel.org/pub/scm/utils/cpu/mce/mce-inject.git
$ cd mce-inject
$ make
$ modprobe mce-inject
Modify the test/corrected script to include the following:
CPU 0 BANK 0
STATUS 0xcc00008000010090
ADDR 0x0010FFFFFFF
Inject the error: .. code:: bash
$ ./mce-inject < test/corrected
Note: the uncorrected and fatal scripts under test will cause a platform reset. Only the fatal script generates the memory errors. In order to quickly emulate uncorrected memory errors and avoid host reboot following test errors from mce-test suite can be injected:
$ mce-inject mce-test/cases/coverage/soft-inj/recoverable_ucr/data/srao_mem_scrub
mce-test:
In addition an more in-depth test of the Linux kernel machine check facilities can be done with the mce-test test suite. mce-test supports testing uncorrected error handling, real error injection, handling of different soft offlining cases, and other tests.
Corrected memory error injection:
To inject corrected memory errors:
- Remove sb_edac and edac_core kernel modules: rmmod sb_edac rmmod edac_core
- Insert einj module: modprobe einj param_extension=1
- Inject an error by specifying details (last command should be repeated at least two times):
$ APEI_IF=/sys/kernel/debug/apei/einj
$ echo 0x8 > $APEI_IF/error_type
$ echo 0x01f5591000 > $APEI_IF/param1
$ echo 0xfffffffffffff000 > $APEI_IF/param2
$ echo 1 > $APEI_IF/notrigger
$ echo 1 > $APEI_IF/error_inject
- Check the MCE statistic: mcelog –client. Check the mcelog log for injected error details: less /var/log/mcelog.
Open vSwitch Plugins
OvS Events Repo: https://github.com/collectd/collectd
OvS Stats Repo: https://github.com/maryamtahhan/collectd
OvS Events Branch: master
OvS Stats Branch:feat_ovs_stats
Dependencies: Open vSwitch, libyajl
On Ubuntu, install the dependencies:
$ sudo apt-get install libyajl-dev openvswitch-switch
Start the Open vSwitch service:
$ sudo service openvswitch-switch start
configure the ovsdb-server manager:
$ sudo ovs-vsctl set-manager ptcp:6640
Clone and install the collectd ovs plugin:
$ git clone $REPO
$ cd collectd
$ git checkout $BRANCH
$ ./build.sh
$ ./configure --enable-syslog --enable-logfile --enable-debug
$ make
$ sudo make install
where $REPO is one of the repos listed at the top of this section.
Where $BRANCH is master or feat_ovs_stats.
This will install collectd to /opt/collectd. The collectd configuration file can be found at /opt/collectd/etc. To configure the OVS events plugin you need to modify the configuration file to include:
<LoadPlugin ovs_events>
   Interval 1
</LoadPlugin>
<Plugin "ovs_events">
   Port 6640
   Socket "/var/run/openvswitch/db.sock"
   Interfaces "br0" "veth0"
   SendNotification false
</Plugin>
To configure the OVS stats plugin you need to modify the configuration file to include:
<LoadPlugin ovs_stats>
   Interval 1
</LoadPlugin>
<Plugin ovs_stats>
   Port "6640"
   Address "127.0.0.1"
   Socket "/var/run/openvswitch/db.sock"
   Bridges "br0" "br_ext"
</Plugin>
For more information on the plugin parameters, please see: https://github.com/collectd/collectd/blob/master/src/collectd.conf.pod and https://github.com/maryamtahhan/collectd/blob/feat_ovs_stats/src/collectd.conf.pod
SNMP Agent Plugin:
Repo: https://github.com/maryamtahhan/collectd/
Branch: feat_snmp
Dependencies: NET-SNMP library
Start by installing net-snmp and dependencies.
On ubuntu:
$ apt-get install snmp snmp-mibs-downloader snmpd libsnmp-dev
$ systemctl start snmpd.service
Or build from source
Become root to install net-snmp dependencies
$ apt-get install libperl-dev
Clone and build net-snmp
$ git clone https://github.com/haad/net-snmp.git
$ cd net-snmp
$ ./configure --with-persistent-directory="/var/net-snmp" --with-systemd --enable-shared --prefix=/usr
$ make
Become root
$ make install
Copy default configuration to persistent folder
$ cp EXAMPLE.conf /usr/share/snmp/snmpd.conf
Set library path and default MIB configuration
$ cd ~/
$ echo export LD_LIBRARY_PATH=/usr/lib >> .bashrc
$ net-snmp-config --default-mibdirs
$ net-snmp-config --snmpconfpath
Configure snmpd as a service
$ cd net-snmp
$ cp ./dist/snmpd.service /etc/systemd/system/
$ systemctl enable snmpd.service
$ systemctl start snmpd.service
Add the following line to snmpd.conf configuration file “/usr/share/snmp/snmpd.conf” to make all OID tree visible for SNMP clients:
view systemonly included .1
To verify that SNMP is working you can get IF-MIB table using SNMP client to view the list of Linux interfaces:
$ snmpwalk -v 2c -c public localhost IF-MIB::interfaces
Clone and install the collectd snmp_agent plugin:
$ git clone  https://github.com/maryamtahhan/collectd
$ cd collectd
$ git checkout feat_snmp
$ ./build.sh
$ ./configure --enable-syslog --enable-logfile --enable-debug --enable-snmp --with-libnetsnmp
$ make
$ sudo make install
This will install collectd to /opt/collectd The collectd configuration file can be found at /opt/collectd/etc SNMP Agent plugin is a generic plugin and cannot work without configuration. To configure the snmp_agent plugin you need to modify the configuration file to include OIDs mapped to collectd types. The following example maps scalar memAvailReal OID to value represented as free memory type of memory plugin:
LoadPlugin snmp_agent
<Plugin "snmp_agent">
  <Data "memAvailReal">
    Plugin "memory"
    Type "memory"
    TypeInstance "free"
    OIDs "1.3.6.1.4.1.2021.4.6.0"
  </Data>
</Plugin>
For more information on the plugin parameters, please see: https://github.com/maryamtahhan/collectd/blob/feat_snmp/src/collectd.conf.pod
For more details on AgentX subagent, please see: http://www.net-snmp.org/tutorial/tutorial-5/toolkit/demon/
Installing collectd as a service
Collectd service scripts are available in the collectd/contrib directory. To install collectd as a service:
$ sudo cp contrib/systemd.collectd.service /etc/systemd/system/
$ cd /etc/systemd/system/
$ sudo mv systemd.collectd.service collectd.service
$ sudo chmod +x collectd.service
Modify collectd.service
[Service]
ExecStart=/opt/collectd/sbin/collectd
EnvironmentFile=-/opt/collectd/etc/
EnvironmentFile=-/opt/collectd/etc/
CapabilityBoundingSet=CAP_SETUID CAP_SETGID
Reload
$ sudo systemctl daemon-reload
$ sudo systemctl start collectd.service
$ sudo systemctl status collectd.service should show success
Additional useful plugins
Exec Plugin
Can be used to show you when notifications are being generated by calling a bash script that dumps notifications to file. (handy for debug). Modify /opt/collectd/etc/collectd.conf:
LoadPlugin exec
<Plugin exec>
#   Exec "user:group" "/path/to/exec"
   NotificationExec "user" "<path to barometer>/barometer/src/collectd/collectd_sample_configs/write_notification.sh"
</Plugin>
write_notification.sh (just writes the notification passed from exec through STDIN to a file (/tmp/notifications)):
#!/bin/bash
rm -f /tmp/notifications
while read x y
do
  echo $x$y >> /tmp/notifications
done
output to /tmp/notifications should look like:
Severity:WARNING
Time:1479991318.806
Host:localhost
Plugin:ovs_events
PluginInstance:br-ex
Type:gauge
TypeInstance:link_status
uuid:f2aafeec-fa98-4e76-aec5-18ae9fc74589

linkstate of "br-ex" interface has been changed to "DOWN"
logfile plugin
Can be used to log collectd activity. Modify /opt/collectd/etc/collectd.conf to include:
LoadPlugin logfile
<Plugin logfile>
    LogLevel info
    File "/var/log/collectd.log"
    Timestamp true
    PrintSeverity false
</Plugin>
Monitoring Interfaces and Openstack Support
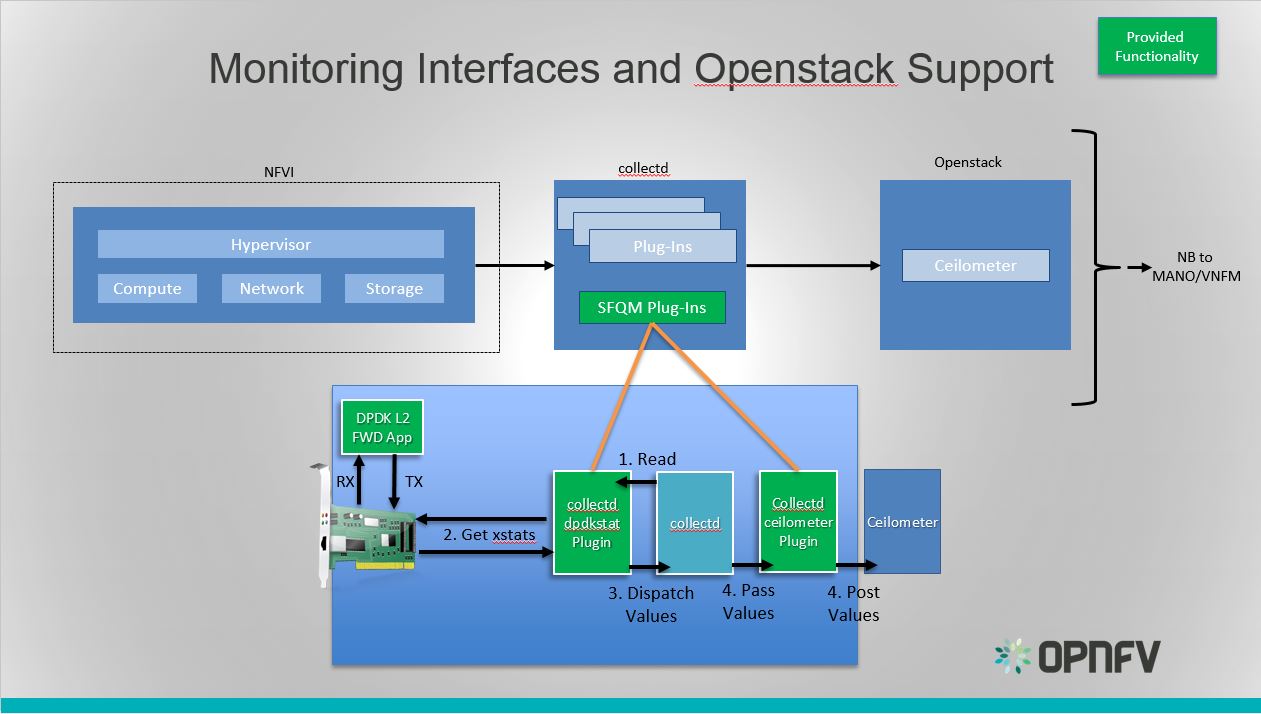
Monitoring Interfaces and Openstack Support
The figure above shows the DPDK L2 forwarding application running on a compute node, sending and receiving traffic. collectd is also running on this compute node retrieving the stats periodically from DPDK through the dpdkstat plugin and publishing the retrieved stats to Ceilometer through the ceilometer plugin.
To see this demo in action please checkout: Barometer OPNFV Summit demo
References
| [1] | https://collectd.org/wiki/index.php/Naming_schema |
| [2] | https://github.com/collectd/collectd/blob/master/src/daemon/plugin.h |
| [3] | https://collectd.org/wiki/index.php/Value_list_t |
| [4] | https://collectd.org/wiki/index.php/Data_set |
| [5] | https://collectd.org/documentation/manpages/types.db.5.shtml |
| [6] | https://collectd.org/wiki/index.php/Data_source |
| [7] | https://collectd.org/wiki/index.php/Meta_Data_Interface |
collectd VES plugin
The Barometer repository contains a python based write plugin for VES.
The plugin currently supports pushing platform relevant metrics through the additional measurements field for VES.
Please note: Hardcoded configuration values will be modified so that they are configurable through the configuration file.
Installation Instructions:
- Clone this repo
- Install collectd
$ sudo apt-get install collectd
- Modify the collectd configuration script: /etc/collectd/collectd.conf
<LoadPlugin python>
  Globals true
</LoadPlugin>

<Plugin python>
  ModulePath "/path/to/your/python/modules"
  LogTraces true
  Interactive false
  Import "ves_plugin"
<Module ves_plugin>
# VES plugin configuration (see next section below)
</Module>
</Plugin>
where “/path/to/your/python/modules” is the path to where you cloned this repo
VES python plugin configuration description:
Note Details of the Vendor Event Listener REST service
REST resources are defined with respect to a ServerRoot:
ServerRoot = https://{Domain}:{Port}/{optionalRoutingPath}
REST resources are of the form:
{ServerRoot}/eventListener/v{apiVersion}`
{ServerRoot}/eventListener/v{apiVersion}/{topicName}`
{ServerRoot}/eventListener/v{apiVersion}/eventBatch`
Domain “host” * VES domain name. It can be IP address or hostname of VES collector (default: 127.0.0.1)
Port port * VES port (default: 30000)
Path “path” * Used as the “optionalRoutingPath” element in the REST path (default: empty)
Topic “path” * Used as the “topicName” element in the REST path (default: empty)
UseHttps true|false * Allow plugin to use HTTPS instead of HTTP (default: false)
Username “username” * VES collector user name (default: empty)
Password “passwd” * VES collector password (default: empty)
FunctionalRole “role” * Used as the ‘functionalRole’ field of ‘commonEventHeader’ event (default: Collectd VES Agent)
GuestRunning true|false * This option is used if the collectd is running on a guest machine, e.g this option should be set to true in this case. Defaults to false.
Other collectd.conf configurations
Please ensure that FQDNLookup is set to false
FQDNLookup false
Please ensure that the virt plugin is enabled and configured as follows. This configuration is is required only on a host side (‘GuestRunning’ = false).
LoadPlugin virt

<Plugin virt>
        Connection "qemu:///system"
        RefreshInterval 60
        HostnameFormat uuid
</Plugin>
Please ensure that the cpu plugin is enabled and configured as follows
LoadPlugin cpu

<Plugin cpu>
    ReportByCpu false
    ValuesPercentage true
</Plugin>
Please ensure that the aggregation plugin is enabled and configured as follows
LoadPlugin aggregation

<Plugin aggregation>
    <Aggregation>
            Plugin "cpu"
            Type "percent"
            GroupBy "Host"
            GroupBy "TypeInstance"
            SetPlugin "cpu-aggregation"
            CalculateAverage true
    </Aggregation>
</Plugin>
If plugin is running on a guest side, it is important to enable uuid plugin too. In this case the hostname in event message will be represented as UUID instead of system host name.
LoadPlugin uuid
If custom UUID needs to be provided, the following configuration is required in collectd.conf file:
<Plugin uuid>
    UUIDFile "/etc/uuid"
</Plugin>
Where “/etc/uuid” is a file containing custom UUID.
Please also ensure that the following plugins are enabled:
LoadPlugin disk
LoadPlugin interface
LoadPlugin memory
VES plugin notification example
A good example of collectD notification is monitoring of CPU load on a host or guest using ‘threshold’ plugin. The following configuration will setup VES plugin to send ‘Fault’ event every time a CPU idle value is out of range (e.g.: WARNING: CPU-IDLE < 50%, CRITICAL: CPU-IDLE < 30%) and send ‘Fault’ NORMAL event if CPU idle value is back to normal.
LoadPlugin threshold

<Plugin "threshold">
     <Plugin "cpu-aggregation">
        <Type "percent">
          WarningMin    50.0
          WarningMax   100.0
          FailureMin    30.0
          FailureMax   100.0
          Instance "idle"
          Hits 1
        </Type>
    </Plugin>
</Plugin>
More detailed information on how to configure collectD thresholds(memory, cpu etc.) can be found here at https://collectd.org/documentation/manpages/collectd-threshold.5.shtml