Barometer
| Project: | Barometer, https://wiki.opnfv.org/display/fastpath/Barometer+Home |
||||
|---|---|---|---|---|---|
| Authors: | Maryam Tahhan <maryam.tahhan@intel.com> |
||||
| History: |
|
1. Barometer Requirements
1.1. Introduction
Barometer is the project that renames Software Fastpath service Quality Metrics (SFQM) and updates its scope which was networking centric.
The goal of SFQM was to develop the utilities and libraries in DPDK to support:
- Measuring Telco Traffic and Performance KPIs. Including:
- Packet Delay Variation (by enabling TX and RX time stamping).
- Packet loss (by exposing extended NIC stats).
- Performance Monitoring of the DPDK interfaces (by exposing extended NIC stats + collectd Plugin).
- Detecting and reporting violations that can be consumed by VNFs and higher level management systems (through DPDK Keep Alive).
With Barometer the scope is extended to monitoring the NFVI. The ability to monitor the Network Function Virtualization Infrastructure (NFVI) where VNFs are in operation will be a key part of Service Assurance within an NFV environment, in order to enforce SLAs or to detect violations, faults or degradation in the performance of NFVI resources so that events and relevant metrics are reported to higher level fault management systems. If physical appliances are going to be replaced by virtualized appliances the service levels, manageability and service assurance needs to remain consistent or improve on what is available today. As such, the NFVI needs to support the ability to monitor:
- Traffic monitoring and performance monitoring of the components that provide networking functionality to the VNF, including: physical interfaces, virtual switch interfaces and flows, as well as the virtual interfaces themselves and their status, etc.
- Platform monitoring including: CPU, memory, load, cache, themals, fan speeds, voltages and machine check exceptions, etc.
All of the statistics and events gathered must be collected in-service and must be capable of being reported by standard Telco mechanisms (e.g. SNMP), for potential enforcement or correction actions. In addition, this information could be fed to analytics systems to enable failure prediction, and can also be used for intelligent workload placement.
All developed features will be upstreamed to Open Source projects relevant to telemetry such as collectd and Ceilometer.
The OPNFV project wiki can be found @ Barometer
1.2. Problem Statement
Providing carrier grade Service Assurance is critical in the network transformation to a software defined and virtualized network (NFV). Medium-/large-scale cloud environments account for between hundreds and hundreds of thousands of infrastructure systems. It is vital to monitor systems for malfunctions that could lead to users application service disruption and promptly react to these fault events to facilitate improving overall system performance. As the size of infrastructure and virtual resources grow, so does the effort of monitoring back-ends. SFQM aims to expose as much useful information as possible off the platform so that faults and errors in the NFVI can be detected promptly and reported to the appropriate fault management entity.
The OPNFV platform (NFVI) requires functionality to:
- Create a low latency, high performance packet processing path (fast path) through the NFVI that VNFs can take advantage of;
- Measure Telco Traffic and Performance KPIs through that fast path;
- Detect and report violations that can be consumed by VNFs and higher level EMS/OSS systems
Examples of local measurable QoS factors for Traffic Monitoring which impact both Quality of Experience and five 9’s availability would be (using Metro Ethernet Forum Guidelines as reference):
- Packet loss
- Packet Delay Variation
- Uni-directional frame delay
Other KPIs such as Call drops, Call Setup Success Rate, Call Setup time etc. are measured by the VNF.
In addition to Traffic Monitoring, the NFVI must also support Performance Monitoring of the physical interfaces themselves (e.g. NICs), i.e. an ability to monitor and trace errors on the physical interfaces and report them.
All these traffic statistics for Traffic and Performance Monitoring must be measured in-service and must be capable of being reported by standard Telco mechanisms (e.g. SNMP traps), for potential enforcement actions.
1.3. Barometer updated scope
The scope of the project is to provide interfaces to support monitoring of the NFVI. The project will develop plugins for telemetry frameworks to enable the collection of platform stats and events and relay gathered information to fault management applications or the VIM. The scope is limited to collecting/gathering the events and stats and relaying them to a relevant endpoint. The project will not enforce or take any actions based on the gathered information.
1.4. Scope of SFQM
NOTE: The SFQM project has been replaced by Barometer. The output of the project will provide interfaces and functions to support monitoring of Packet Latency and Network Interfaces while the VNF is in service.
The DPDK interface/API will be updated to support:
- Exposure of NIC MAC/PHY Level Counters
- Interface for Time stamp on RX
- Interface for Time stamp on TX
- Exposure of DPDK events
collectd will be updated to support the exposure of DPDK metrics and events.
Specific testing and integration will be carried out to cover:
- Unit/Integration Test plans: A sample application provided to demonstrate packet latency monitoring and interface monitoring
The following list of features and functionality will be developed:
- DPDK APIs and functions for latency and interface monitoring
- A sample application to demonstrate usage
- collectd plugins
The scope of the project involves developing the relavant DPDK APIs, OVS APIs, sample applications, as well as the utilities in collectd to export all the relavent information to a telemetry and events consumer.
VNF specific processing, Traffic Monitoring, Performance Monitoring and Management Agent are out of scope.
The Proposed Interface counters include:
- Packet RX
- Packet TX
- Packet loss
- Interface errors + other stats
The Proposed Packet Latency Monitor include:
- Cycle accurate stamping on ingress
- Supports latency measurements on egress
Support for failover of DPDK enabled cores is also out of scope of the current proposal. However, this is an important requirement and must-have functionality for any DPDK enabled framework in the NFVI. To that end, a second phase of this project will be to implement DPDK Keep Alive functionality that would address this and would report to a VNF-level Failover and High Availability mechanism that would then determine what actions, including failover, may be triggered.
1.5. Consumption Models
In reality many VNFs will have an existing performance or traffic monitoring utility used to monitor VNF behavior and report statistics, counters, etc.
The consumption of performance and traffic related information/events provided by this project should be a logical extension of any existing VNF/NFVI monitoring framework. It should not require a new framework to be developed. We do not see the Barometer gathered metrics and evetns as major additional effort for monitoring frameworks to consume; this project would be sympathetic to existing monitoring frameworks. The intention is that this project represents an interface for NFVI monitoring to be used by higher level fault management entities (see below).
Allowing the Barometer metrics and events to be handled within existing telemetry frameoworks makes it simpler for overall interfacing with higher level management components in the VIM, MANO and OSS/BSS. The Barometer proposal would be complementary to the Doctor project, which addresses NFVI Fault Management support in the VIM, and the VES project, which addresses the integration of VNF telemetry-related data into automated VNF management systems. To that end, the project committers and contributors for the Barometer project wish to collaborate with the Doctor and VES projects to facilitate this.
1.6. collectd
collectd is a daemon which collects system performance statistics periodically and provides a variety of mechanisms to publish the collected metrics. It supports more than 90 different input and output plugins. Input plugins retrieve metrics and publish them to the collectd deamon, while output plugins publish the data they receive to an end point. collectd also has infrastructure to support thresholding and notification.
1.7. collectd statistics and Notifications
Within collectd notifications and performance data are dispatched in the same way. There are producer plugins (plugins that create notifications/metrics), and consumer plugins (plugins that receive notifications/metrics and do something with them).
Statistics in collectd consist of a value list. A value list includes:
- Values, can be one of:
- Derive: used for values where a change in the value since it’s last been read is of interest. Can be used to calculate and store a rate.
- Counter: similar to derive values, but take the possibility of a counter wrap around into consideration.
- Gauge: used for values that are stored as is.
- Absolute: used for counters that are reset after reading.
- Value length: the number of values in the data set.
- Time: timestamp at which the value was collected.
- Interval: interval at which to expect a new value.
- Host: used to identify the host.
- Plugin: used to identify the plugin.
- Plugin instance (optional): used to group a set of values together. For e.g. values belonging to a DPDK interface.
- Type: unit used to measure a value. In other words used to refer to a data set.
- Type instance (optional): used to distinguish between values that have an identical type.
- meta data: an opaque data structure that enables the passing of additional information about a value list. “Meta data in the global cache can be used to store arbitrary information about an identifier” [7].
Host, plugin, plugin instance, type and type instance uniquely identify a collectd value.
Values lists are often accompanied by data sets that describe the values in more detail. Data sets consist of:
- A type: a name which uniquely identifies a data set.
- One or more data sources (entries in a data set) which include:
- The name of the data source. If there is only a single data source this is set to “value”.
- The type of the data source, one of: counter, gauge, absolute or derive.
- A min and a max value.
Types in collectd are defined in types.db. Examples of types in types.db:
bitrate    value:GAUGE:0:4294967295
counter    value:COUNTER:U:U
if_octets  rx:COUNTER:0:4294967295, tx:COUNTER:0:4294967295
In the example above if_octets has two data sources: tx and rx.
Notifications in collectd are generic messages containing:
- An associated severity, which can be one of OKAY, WARNING, and FAILURE.
- A time.
- A Message
- A host.
- A plugin.
- A plugin instance (optional).
- A type.
- A types instance (optional).
- Meta-data.
1.8. DPDK Enhancements
This section will discuss the Barometer features that were integrated with DPDK.
1.8.1. Measuring Telco Traffic and Performance KPIs
This section will discuss the Barometer features that enable Measuring Telco Traffic and Performance KPIs.
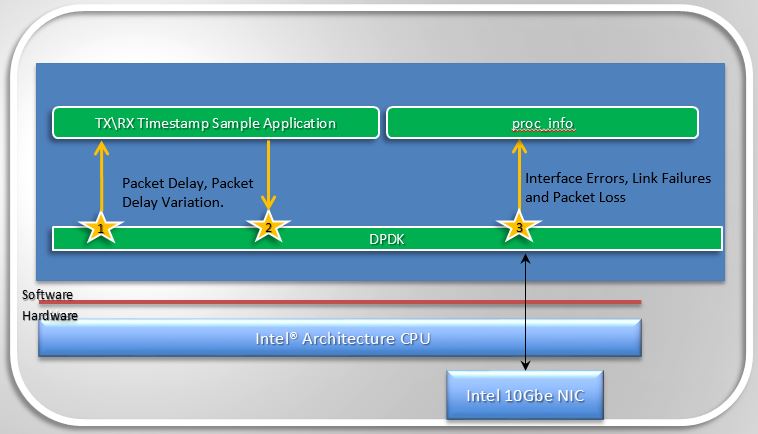
Measuring Telco Traffic and Performance KPIs
- The very first thing Barometer enabled was a call-back API in DPDK and an associated application that used the API to demonstrate how to timestamp packets and measure packet latency in DPDK (the sample app is called rxtx_callbacks). This was upstreamed to DPDK 2.0 and is represented by the interfaces 1 and 2 in Figure 1.2.
- The second thing Barometer implemented in DPDK is the extended NIC statistics API,
which exposes NIC stats including error stats to the DPDK user by reading the
registers on the NIC. This is represented by interface 3 in Figure 1.2.
- For DPDK 2.1 this API was only implemented for the ixgbe (10Gb) NIC driver, in association with a sample application that runs as a DPDK secondary process and retrieves the extended NIC stats.
- For DPDK 2.2 the API was implemented for igb, i40e and all the Virtual Functions (VFs) for all drivers.
- For DPDK 16.07 the API migrated from using string value pairs to using id value pairs, improving the overall performance of the API.
1.8.2. Monitoring DPDK interfaces
With the features Barometer enabled in DPDK to enable measuring Telco traffic and performance KPIs, we can now retrieve NIC statistics including error stats and relay them to a DPDK user. The next step is to enable monitoring of the DPDK interfaces based on the stats that we are retrieving from the NICs, by relaying the information to a higher level Fault Management entity. To enable this Barometer has been enabling a number of plugins for collectd.
1.8.3. DPDK Keep Alive description
SFQM aims to enable fault detection within DPDK, the very first feature to meet this goal is the DPDK Keep Alive Sample app that is part of DPDK 2.2.
DPDK Keep Alive or KA is a sample application that acts as a heartbeat/watchdog for DPDK packet processing cores, to detect application thread failure. The application supports the detection of ‘failed’ DPDK cores and notification to a HA/SA middleware. The purpose is to detect Packet Processing Core fails (e.g. infinite loop) and ensure the failure of the core does not result in a fault that is not detectable by a management entity.
DPDK Keep Alive Sample Application
Essentially the app demonstrates how to detect ‘silent outages’ on DPDK packet processing cores. The application can be decomposed into two specific parts: detection and notification.
- The detection period is programmable/configurable but defaults to 5ms if no timeout is specified.
- The Notification support is enabled by simply having a hook function that where this can be ‘call back support’ for a fault management application with a compliant heartbeat mechanism.
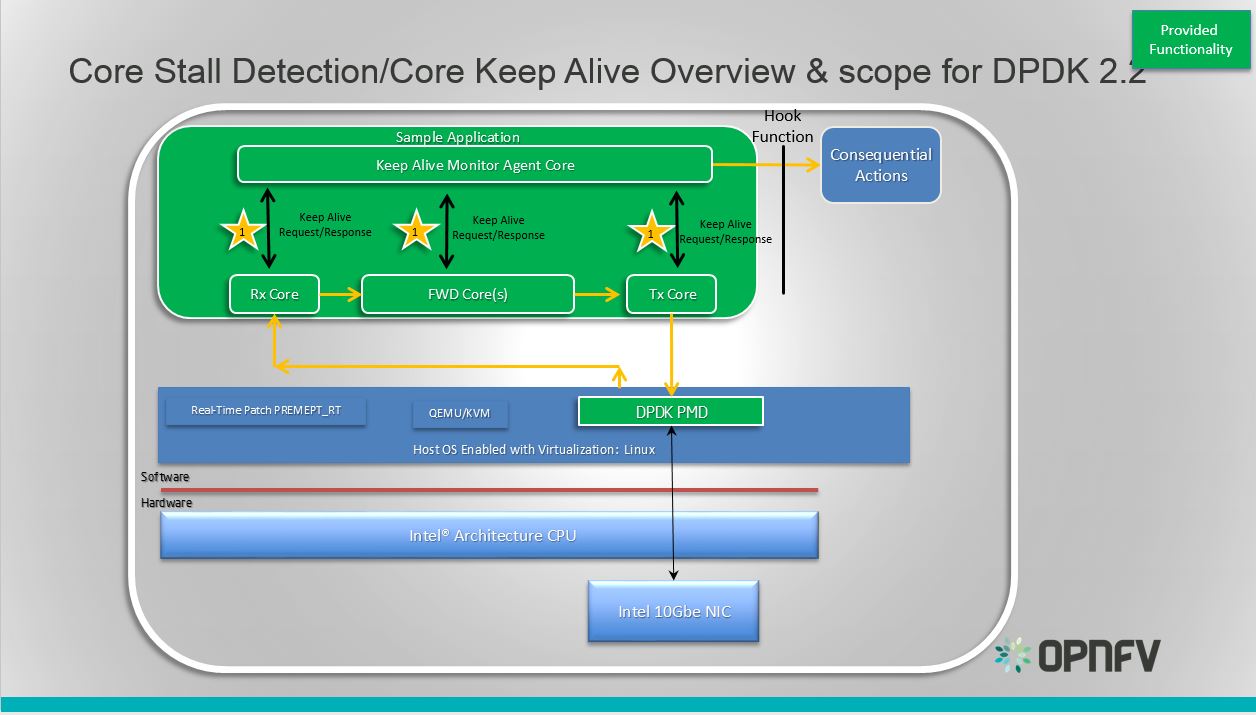
1.8.3.1. DPDK Keep Alive Sample App Internals
This section provides some explanation of the The Keep-Alive/’Liveliness’ conceptual scheme as well as the DPDK Keep Alive App. The initialization and run-time paths are very similar to those of the L2 forwarding application (see L2 Forwarding Sample Application (in Real and Virtualized Environments) for more information).
There are two types of cores: a Keep Alive Monitor Agent Core (master DPDK core) and Worker cores (Tx/Rx/Forwarding cores). The Keep Alive Monitor Agent Core will supervise worker cores and report any failure (2 successive missed pings). The Keep-Alive/’Liveliness’ conceptual scheme is:
- DPDK worker cores mark their liveliness as they forward traffic.
- A Keep Alive Monitor Agent Core runs a function every N Milliseconds to inspect worker core liveliness.
- If keep-alive agent detects time-outs, it notifies the fault management entity through a call-back function.
Note: Only the worker cores state is monitored. There is no mechanism or agent to monitor the Keep Alive Monitor Agent Core.
1.8.3.2. DPDK Keep Alive Sample App Code Internals
The following section provides some explanation of the code aspects that are specific to the Keep Alive sample application.
The heartbeat functionality is initialized with a struct rte_heartbeat and the callback function to invoke in the case of a timeout.
rte_global_keepalive_info = rte_keepalive_create(&dead_core, NULL);
if (rte_global_hbeat_info == NULL)
    rte_exit(EXIT_FAILURE, "keepalive_create() failed");
The function that issues the pings hbeat_dispatch_pings() is configured to run every check_period milliseconds.
if (rte_timer_reset(&hb_timer,
        (check_period * rte_get_timer_hz()) / 1000,
        PERIODICAL,
        rte_lcore_id(),
        &hbeat_dispatch_pings, rte_global_keepalive_info
        ) != 0 )
    rte_exit(EXIT_FAILURE, "Keepalive setup failure.\n");
The rest of the initialization and run-time path follows the same paths as the the L2 forwarding application. The only addition to the main processing loop is the mark alive functionality and the example random failures.
rte_keepalive_mark_alive(&rte_global_hbeat_info);
cur_tsc = rte_rdtsc();

/* Die randomly within 7 secs for demo purposes.. */
if (cur_tsc - tsc_initial > tsc_lifetime)
break;
The rte_keepalive_mark_alive() function simply sets the core state to alive.
static inline void
rte_keepalive_mark_alive(struct rte_heartbeat *keepcfg)
{
    keepcfg->state_flags[rte_lcore_id()] = 1;
}
Keep Alive Monitor Agent Core Monitoring Options The application can run on either a host or a guest. As such there are a number of options for monitoring the Keep Alive Monitor Agent Core through a Local Agent on the compute node:
Application Location DPDK KA LOCAL AGENT HOST X HOST/GUEST GUEST X HOST/GUEST
For the first implementation of a Local Agent SFQM will enable:
Application Location DPDK KA LOCAL AGENT HOST X HOST
Through extending the dpdkstat plugin for collectd with KA functionality, and integrating the extended plugin with Monasca for high performing, resilient, and scalable fault detection.
2. Barometer user guide
2.1. collectd plugins
Barometer has enabled the following collectd plugins:
- dpdkstat plugin: A read plugin that retrieve stats from the DPDK extended
- NIC stats API.
- ceilometer plugin: A write plugin that pushes the retrieved stats to Ceilometer. It’s capable of pushing any stats read through collectd to Ceilometer, not just the DPDK stats.
- hugepages plugin: A read plugin that retrieves the number of available and free hugepages on a platform as well as what is available in terms of hugepages per socket.
- RDT plugin: A read plugin that provides the last level cache utilitzation and memory bandwidth utilization
- Open vSwitch events Plugin: A read plugin that retrieves events from OVS.
- mcelog plugin: A read plugin that uses mcelog client protocol to check for memory Machine Check Exceptions and sends the stats for reported exceptions
All the plugins above are available on the collectd master, except for the ceilometer plugin as it’s a python based plugin and only C plugins are accepted by the collectd community. The ceilometer plugin lives in the OpenStack repositories.
Other plugins under development or existing as a pull request into collectd master:
- dpdkevents: A read plugin that retrieves DPDK link status and DPDK forwarding cores liveliness status (DPDK Keep Alive).
- Open vSwitch stats Plugin: A read plugin that retrieve flow and interface stats from OVS.
- SNMP Agent: A write plugin that will act as a AgentX subagent that receives and handles queries from SNMP master agent and returns the data collected by read plugins. The SNMP Agent plugin handles requests only for OIDs specified in configuration file. To handle SNMP queries the plugin gets data from collectd and translates requested values from collectd’s internal format to SNMP format. Supports SNMP: get, getnext and walk requests.
- Legacy/IPMI: A read plugin that reports platform thermals, voltages, fanspeed, current, flow, power etc. Also, the plugin monitors Intelligent Platform Management Interface (IPMI) System Event Log (SEL) and sends the collectd notification once a new record appears in the SEL.
2.2. Building collectd with the Barometer plugins and installing the dependencies
2.2.1. All Upstreamed plugins
The plugins that have been merged to the collectd master branch can all be built and configured through the barometer repository.
Note: sudo permissions are required to install collectd.
Note: These are instructions for Ubuntu 16.04.
To build and install these dependencies, clone the barometer repo:
$ git clone https://gerrit.opnfv.org/gerrit/barometer
Install the build dependencies
$ ./src/install_build_deps.sh
To install collectd as a service and install all it’s dependencies:
$ cd barometer/src && sudo make && sudo make install
This will install collectd as a service and the base install directory is /opt/collectd.
Sample configuration files can be found in ‘/opt/collectd/etc/collectd.conf.d’
Note: Exec plugin requires non-root user to execute scripts. By default, collectd_exec user is used. Barometer scripts do not create this user. It needs to be manually added or exec plugin configuration has to be changed to use other, existing user before starting collectd service.
Please note if you are using any Open vSwitch plugins you need to run:
$ sudo ovs-vsctl set-manager ptcp:6640
2.2.2. DPDK statistics plugin
Repo: https://github.com/collectd/collectd
Branch: master
Dependencies: DPDK (http://dpdk.org/)
To build and install DPDK to /usr please see: https://github.com/collectd/collectd/blob/master/docs/BUILD.dpdkstat.md
Building and installing collectd:
$ git clone https://github.com/collectd/collectd.git
$ cd collectd
$ ./build.sh
$ ./configure --enable-syslog --enable-logfile --enable-debug
$ make
$ sudo make install
This will install collectd to /opt/collectd The collectd configuration file can be found at /opt/collectd/etc To configure the hugepages plugin you need to modify the configuration file to include:
LoadPlugin dpdkstat
<Plugin dpdkstat>
       Coremask "0xf"
       ProcessType "secondary"
       FilePrefix "rte"
       EnabledPortMask 0xffff
</Plugin>
For more information on the plugin parameters, please see: https://github.com/collectd/collectd/blob/master/src/collectd.conf.pod
Please note if you are configuring collectd with the static DPDK library you must compile the DPDK library with the -fPIC flag:
$ make EXTRA_CFLAGS=-fPIC
You must also modify the configuration step when building collectd:
$ ./configure CFLAGS=" -lpthread -Wl,--whole-archive -Wl,-ldpdk -Wl,-lm -Wl,-lrt -Wl,-lpcap -Wl,-ldl -Wl,--no-whole-archive"
Please also note that if you are not building and installing DPDK system-wide you will need to specify the specific paths to the header files and libraries using LIBDPDK_CPPFLAGS and LIBDPDK_LDFLAGS. You will also need to add the DPDK library symbols to the shared library path using ldconfig. Note that this update to the shared library path is not persistant (i.e. it will not survive a reboot). Pending a merge of https://github.com/collectd/collectd/pull/2073.
$ ./configure LIBDPDK_CPPFLAGS="path to DPDK header files" LIBDPDK_LDFLAGS="path to DPDK libraries"
2.2.3. Hugepages Plugin
Repo: https://github.com/collectd/collectd
Branch: master
Dependencies: None, but assumes hugepages are configured.
To configure some hugepages:
sudo mkdir -p /mnt/huge
sudo mount -t hugetlbfs nodev /mnt/huge
sudo echo 14336 > /sys/devices/system/node/node0/hugepages/hugepages-2048kB/nr_hugepages
Building and installing collectd:
$ git clone https://github.com/collectd/collectd.git
$ cd collectd
$ ./build.sh
$ ./configure --enable-syslog --enable-logfile --enable-hugepages --enable-debug
$ make
$ sudo make install
This will install collectd to /opt/collectd The collectd configuration file can be found at /opt/collectd/etc To configure the hugepages plugin you need to modify the configuration file to include:
LoadPlugin hugepages
<Plugin hugepages>
    ReportPerNodeHP  true
    ReportRootHP     true
    ValuesPages      true
    ValuesBytes      false
    ValuesPercentage false
</Plugin>
For more information on the plugin parameters, please see: https://github.com/collectd/collectd/blob/master/src/collectd.conf.pod
2.2.4. Intel RDT Plugin
Repo: https://github.com/collectd/collectd
Branch: master
Dependencies:
- PQoS/Intel RDT library https://github.com/01org/intel-cmt-cat.git
- msr kernel module
Building and installing PQoS/Intel RDT library:
$ git clone https://github.com/01org/intel-cmt-cat.git
$ cd intel-cmt-cat
$ make
$ make install PREFIX=/usr
You will need to insert the msr kernel module:
$ modprobe msr
Building and installing collectd:
$ git clone https://github.com/collectd/collectd.git
$ cd collectd
$ ./build.sh
$ ./configure --enable-syslog --enable-logfile --with-libpqos=/usr/ --enable-debug
$ make
$ sudo make install
This will install collectd to /opt/collectd The collectd configuration file can be found at /opt/collectd/etc To configure the RDT plugin you need to modify the configuration file to include:
<LoadPlugin intel_rdt>
  Interval 1
</LoadPlugin>
<Plugin "intel_rdt">
  Cores ""
</Plugin>
For more information on the plugin parameters, please see: https://github.com/collectd/collectd/blob/master/src/collectd.conf.pod
2.2.5. IPMI Plugin
Repo: https://github.com/maryamtahhan/collectd
Branch: feat_ipmi_events, feat_ipmi_analog
Dependencies: OpenIPMI library
The IPMI plugin is already implemented in the latest collectd and sensors like temperature, voltage, fanspeed, current are already supported there. The list of supported IPMI sensors has been extended and sensors like flow, power are supported now. Also, a System Event Log (SEL) notification feature has been introduced.
- The feat_ipmi_events branch includes new SEL feature support in collectd IPMI plugin. If this feature is enabled, the collectd IPMI plugin will dispatch notifications about new events in System Event Log.
- The feat_ipmi_analog branch includes the support of extended IPMI sensors in collectd IPMI plugin.
On Ubuntu, install the dependencies:
$ sudo apt-get install libopenipmi-dev
Enable IPMI support in the kernel:
$ sudo modprobe ipmi_devintf
$ sudo modprobe ipmi_si
Note: If HW supports IPMI, the /dev/ipmi0 character device will be
created.
Clone and install the collectd IPMI plugin:
$ git clone  https://github.com/maryamtahhan/collectd
$ cd collectd
$ git checkout $BRANCH
$ ./build.sh
$ ./configure --enable-syslog --enable-logfile --enable-debug
$ make
$ sudo make install
Where $BRANCH is feat_ipmi_events or feat_ipmi_analog.
This will install collectd to default folder /opt/collectd. The collectd
configuration file (collectd.conf) can be found at /opt/collectd/etc. To
configure the IPMI plugin you need to modify the file to include:
LoadPlugin ipmi
<Plugin ipmi>
   SELEnabled true # only feat_ipmi_events branch supports this
</Plugin>
Note: By default, IPMI plugin will read all available analog sensor values, dispatch the values to collectd and send SEL notifications.
For more information on the IPMI plugin parameters and SEL feature configuration, please see:
https://github.com/maryamtahhan/collectd/blob/feat_ipmi_events/src/collectd.conf.pod
Extended analog sensors support doesn’t require addition configuration. The usual collectd IPMI documentation can be used.
https://collectd.org/wiki/index.php/Plugin:IPMI https://collectd.org/documentation/manpages/collectd.conf.5.shtml#plugin_ipmi
IPMI documentation:
https://www.kernel.org/doc/Documentation/IPMI.txt http://www.intel.com/content/www/us/en/servers/ipmi/ipmi-second-gen-interface-spec-v2-rev1-1.html
2.2.6. Mcelog Plugin:
Repo: https://github.com/collectd/collectd
Branch: master
Dependencies: mcelog
Start by installing mcelog. Note: The kernel has to have CONFIG_X86_MCE enabled. For 32bit kernels you need at least a 2.6,30 kernel.
On ubuntu:
$ apt-get update && apt-get install mcelog
Or build from source
$ git clone git://git.kernel.org/pub/scm/utils/cpu/mce/mcelog.git
$ cd mcelog
$ make
... become root ...
$ make install
$ cp mcelog.service /etc/systemd/system/
$ systemctl enable mcelog.service
$ systemctl start mcelog.service
Verify you got a /dev/mcelog. You can verify the daemon is running completely by running:
$ mcelog --client
This should query the information in the running daemon. If it prints nothing that is fine (no errors logged yet). More info @ http://www.mcelog.org/installation.html
Modify the mcelog configuration file “/etc/mcelog/mcelog.conf” to include or enable:
socket-path = /var/run/mcelog-client
Clone and install the collectd mcelog plugin:
$ git clone  https://github.com/maryamtahhan/collectd
$ cd collectd
$ git checkout feat_ras
$ ./build.sh
$ ./configure --enable-syslog --enable-logfile --enable-debug
$ make
$ sudo make install
This will install collectd to /opt/collectd The collectd configuration file can be found at /opt/collectd/etc To configure the mcelog plugin you need to modify the configuration file to include:
<LoadPlugin mcelog>
  Interval 1
</LoadPlugin>
<Plugin "mcelog">
   McelogClientSocket "/var/run/mcelog-client"
</Plugin>
For more information on the plugin parameters, please see: https://github.com/maryamtahhan/collectd/blob/feat_ras/src/collectd.conf.pod
Simulating a Machine Check Exception can be done in one of 3 ways:
- Running $make test in the mcelog cloned directory - mcelog test suite
- using mce-inject
- using mce-test
mcelog test suite:
It is always a good idea to test an error handling mechanism before it is really needed. mcelog includes a test suite. The test suite relies on mce-inject which needs to be installed and in $PATH.
You also need the mce-inject kernel module configured (with CONFIG_X86_MCE_INJECT=y), compiled, installed and loaded:
$ modprobe mce-inject
Then you can run the mcelog test suite with
$ make test
This will inject different classes of errors and check that the mcelog triggers runs. There will be some kernel messages about page offlining attempts. The test will also lose a few pages of memory in your system (not significant) Note this test will kill any running mcelog, which needs to be restarted manually afterwards.
mce-inject:
A utility to inject corrected, uncorrected and fatal machine check exceptions
$ git clone https://git.kernel.org/pub/scm/utils/cpu/mce/mce-inject.git
$ cd mce-inject
$ make
$ modprobe mce-inject
Modify the test/corrected script to include the following:
CPU 0 BANK 0
STATUS 0xcc00008000010090
ADDR 0x0010FFFFFFF
Inject the error: .. code:: bash
$ ./mce-inject < test/corrected
Note: the uncorrected and fatal scripts under test will cause a platform reset. Only the fatal script generates the memory errors. In order to quickly emulate uncorrected memory errors and avoid host reboot following test errors from mce-test suite can be injected:
$ mce-inject mce-test/cases/coverage/soft-inj/recoverable_ucr/data/srao_mem_scrub
mce-test:
In addition an more in-depth test of the Linux kernel machine check facilities can be done with the mce-test test suite. mce-test supports testing uncorrected error handling, real error injection, handling of different soft offlining cases, and other tests.
Corrected memory error injection:
To inject corrected memory errors:
- Remove sb_edac and edac_core kernel modules: rmmod sb_edac rmmod edac_core
- Insert einj module: modprobe einj param_extension=1
- Inject an error by specifying details (last command should be repeated at least two times):
$ APEI_IF=/sys/kernel/debug/apei/einj
$ echo 0x8 > $APEI_IF/error_type
$ echo 0x01f5591000 > $APEI_IF/param1
$ echo 0xfffffffffffff000 > $APEI_IF/param2
$ echo 1 > $APEI_IF/notrigger
$ echo 1 > $APEI_IF/error_inject
- Check the MCE statistic: mcelog –client. Check the mcelog log for injected error details: less /var/log/mcelog.
2.2.7. Open vSwitch Plugins
OvS Events Repo: https://github.com/collectd/collectd
OvS Stats Repo: https://github.com/maryamtahhan/collectd
OvS Events Branch: master
OvS Stats Branch:feat_ovs_stats
Dependencies: Open vSwitch, libyajl
On Ubuntu, install the dependencies:
$ sudo apt-get install libyajl-dev openvswitch-switch
Start the Open vSwitch service:
$ sudo service openvswitch-switch start
configure the ovsdb-server manager:
$ sudo ovs-vsctl set-manager ptcp:6640
Clone and install the collectd ovs plugin:
$ git clone $REPO
$ cd collectd
$ git checkout $BRANCH
$ ./build.sh
$ ./configure --enable-syslog --enable-logfile --enable-debug
$ make
$ sudo make install
where $REPO is one of the repos listed at the top of this section.
Where $BRANCH is master or feat_ovs_stats.
This will install collectd to /opt/collectd. The collectd configuration file can be found at /opt/collectd/etc. To configure the OVS events plugin you need to modify the configuration file to include:
<LoadPlugin ovs_events>
   Interval 1
</LoadPlugin>
<Plugin "ovs_events">
   Port 6640
   Socket "/var/run/openvswitch/db.sock"
   Interfaces "br0" "veth0"
   SendNotification false
</Plugin>
To configure the OVS stats plugin you need to modify the configuration file to include:
<LoadPlugin ovs_stats>
   Interval 1
</LoadPlugin>
<Plugin ovs_stats>
   Port "6640"
   Address "127.0.0.1"
   Socket "/var/run/openvswitch/db.sock"
   Bridges "br0" "br_ext"
</Plugin>
For more information on the plugin parameters, please see: https://github.com/collectd/collectd/blob/master/src/collectd.conf.pod and https://github.com/maryamtahhan/collectd/blob/feat_ovs_stats/src/collectd.conf.pod
2.2.8. SNMP Agent Plugin:
Repo: https://github.com/maryamtahhan/collectd/
Branch: feat_snmp
Dependencies: NET-SNMP library
Start by installing net-snmp and dependencies.
On ubuntu:
$ apt-get install snmp snmp-mibs-downloader snmpd libsnmp-dev
$ systemctl start snmpd.service
Or build from source
Become root to install net-snmp dependencies
$ apt-get install libperl-dev
Clone and build net-snmp
$ git clone https://github.com/haad/net-snmp.git
$ cd net-snmp
$ ./configure --with-persistent-directory="/var/net-snmp" --with-systemd --enable-shared --prefix=/usr
$ make
Become root
$ make install
Copy default configuration to persistent folder
$ cp EXAMPLE.conf /usr/share/snmp/snmpd.conf
Set library path and default MIB configuration
$ cd ~/
$ echo export LD_LIBRARY_PATH=/usr/lib >> .bashrc
$ net-snmp-config --default-mibdirs
$ net-snmp-config --snmpconfpath
Configure snmpd as a service
$ cd net-snmp
$ cp ./dist/snmpd.service /etc/systemd/system/
$ systemctl enable snmpd.service
$ systemctl start snmpd.service
Add the following line to snmpd.conf configuration file “/usr/share/snmp/snmpd.conf” to make all OID tree visible for SNMP clients:
view systemonly included .1
To verify that SNMP is working you can get IF-MIB table using SNMP client to view the list of Linux interfaces:
$ snmpwalk -v 2c -c public localhost IF-MIB::interfaces
Clone and install the collectd snmp_agent plugin:
$ git clone  https://github.com/maryamtahhan/collectd
$ cd collectd
$ git checkout feat_snmp
$ ./build.sh
$ ./configure --enable-syslog --enable-logfile --enable-debug --enable-snmp --with-libnetsnmp
$ make
$ sudo make install
This will install collectd to /opt/collectd The collectd configuration file can be found at /opt/collectd/etc SNMP Agent plugin is a generic plugin and cannot work without configuration. To configure the snmp_agent plugin you need to modify the configuration file to include OIDs mapped to collectd types. The following example maps scalar memAvailReal OID to value represented as free memory type of memory plugin:
LoadPlugin snmp_agent
<Plugin "snmp_agent">
  <Data "memAvailReal">
    Plugin "memory"
    Type "memory"
    TypeInstance "free"
    OIDs "1.3.6.1.4.1.2021.4.6.0"
  </Data>
</Plugin>
For more information on the plugin parameters, please see: https://github.com/maryamtahhan/collectd/blob/feat_snmp/src/collectd.conf.pod
For more details on AgentX subagent, please see: http://www.net-snmp.org/tutorial/tutorial-5/toolkit/demon/
2.2.9. Installing collectd as a service
Collectd service scripts are available in the collectd/contrib directory. To install collectd as a service:
$ sudo cp contrib/systemd.collectd.service /etc/systemd/system/
$ cd /etc/systemd/system/
$ sudo mv systemd.collectd.service collectd.service
$ sudo chmod +x collectd.service
Modify collectd.service
[Service]
ExecStart=/opt/collectd/sbin/collectd
EnvironmentFile=-/opt/collectd/etc/
EnvironmentFile=-/opt/collectd/etc/
CapabilityBoundingSet=CAP_SETUID CAP_SETGID
Reload
$ sudo systemctl daemon-reload
$ sudo systemctl start collectd.service
$ sudo systemctl status collectd.service should show success
2.2.10. Additional useful plugins
2.2.10.1. Exec Plugin
Can be used to show you when notifications are being generated by calling a bash script that dumps notifications to file. (handy for debug). Modify /opt/collectd/etc/collectd.conf:
LoadPlugin exec
<Plugin exec>
#   Exec "user:group" "/path/to/exec"
   NotificationExec "user" "<path to barometer>/barometer/src/collectd/collectd_sample_configs/write_notification.sh"
</Plugin>
write_notification.sh (just writes the notification passed from exec through STDIN to a file (/tmp/notifications)):
#!/bin/bash
rm -f /tmp/notifications
while read x y
do
  echo $x$y >> /tmp/notifications
done
output to /tmp/notifications should look like:
Severity:WARNING
Time:1479991318.806
Host:localhost
Plugin:ovs_events
PluginInstance:br-ex
Type:gauge
TypeInstance:link_status
uuid:f2aafeec-fa98-4e76-aec5-18ae9fc74589

linkstate of "br-ex" interface has been changed to "DOWN"
2.2.10.2. logfile plugin
Can be used to log collectd activity. Modify /opt/collectd/etc/collectd.conf to include:
LoadPlugin logfile
<Plugin logfile>
    LogLevel info
    File "/var/log/collectd.log"
    Timestamp true
    PrintSeverity false
</Plugin>
2.2.11. Monitoring Interfaces and Openstack Support
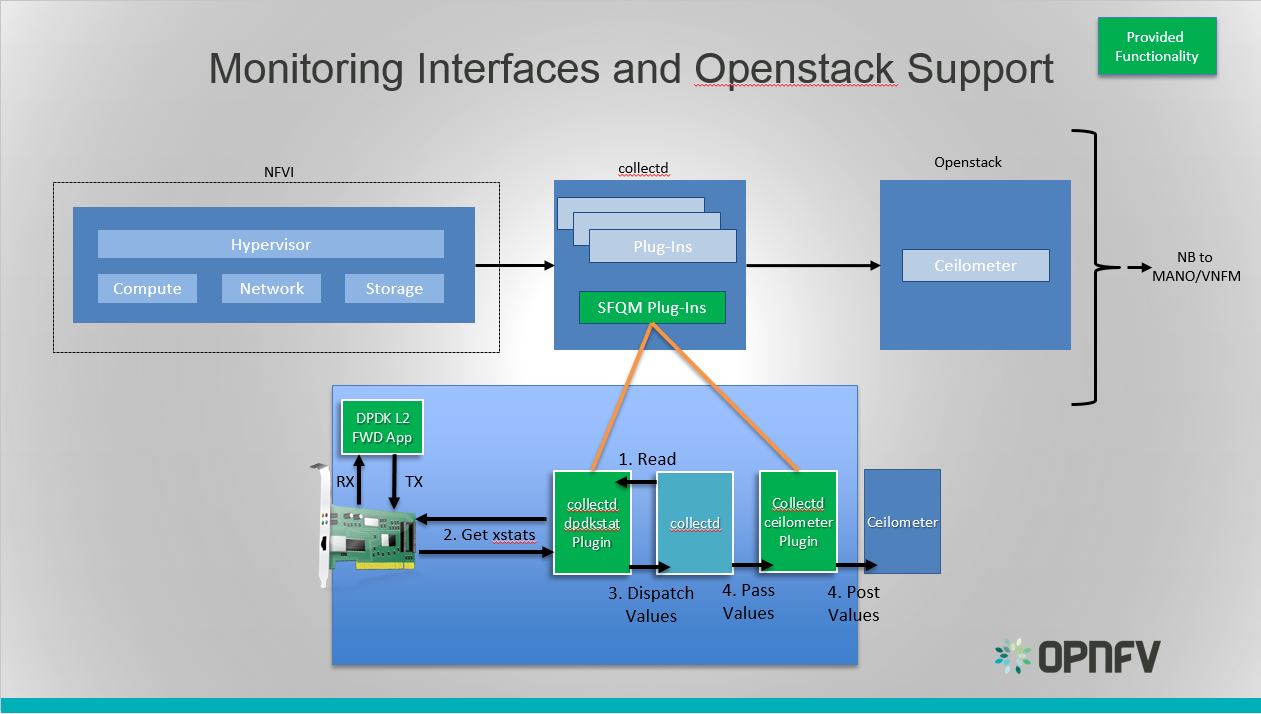
Monitoring Interfaces and Openstack Support
The figure above shows the DPDK L2 forwarding application running on a compute node, sending and receiving traffic. collectd is also running on this compute node retrieving the stats periodically from DPDK through the dpdkstat plugin and publishing the retrieved stats to Ceilometer through the ceilometer plugin.
To see this demo in action please checkout: Barometer OPNFV Summit demo
2.2.12. References
| [1] | https://collectd.org/wiki/index.php/Naming_schema |
| [2] | https://github.com/collectd/collectd/blob/master/src/daemon/plugin.h |
| [3] | https://collectd.org/wiki/index.php/Value_list_t |
| [4] | https://collectd.org/wiki/index.php/Data_set |
| [5] | https://collectd.org/documentation/manpages/types.db.5.shtml |
| [6] | https://collectd.org/wiki/index.php/Data_source |
| [7] | https://collectd.org/wiki/index.php/Meta_Data_Interface |
2.3. collectd VES plugin
The Barometer repository contains a python based write plugin for VES.
The plugin currently supports pushing platform relevant metrics through the additional measurements field for VES.
Please note: Hardcoded configuration values will be modified so that they are configurable through the configuration file.
2.3.1. Installation Instructions:
- Clone this repo
- Install collectd
$ sudo apt-get install collectd
- Modify the collectd configuration script: /etc/collectd/collectd.conf
<LoadPlugin python>
  Globals true
</LoadPlugin>

<Plugin python>
  ModulePath "/path/to/your/python/modules"
  LogTraces true
  Interactive false
  Import "ves_plugin"
<Module ves_plugin>
# VES plugin configuration (see next section below)
</Module>
</Plugin>
where “/path/to/your/python/modules” is the path to where you cloned this repo
2.3.2. VES python plugin configuration description:
Note Details of the Vendor Event Listener REST service
REST resources are defined with respect to a ServerRoot:
ServerRoot = https://{Domain}:{Port}/{optionalRoutingPath}
REST resources are of the form:
{ServerRoot}/eventListener/v{apiVersion}`
{ServerRoot}/eventListener/v{apiVersion}/{topicName}`
{ServerRoot}/eventListener/v{apiVersion}/eventBatch`
Domain “host” * VES domain name. It can be IP address or hostname of VES collector (default: 127.0.0.1)
Port port * VES port (default: 30000)
Path “path” * Used as the “optionalRoutingPath” element in the REST path (default: empty)
Topic “path” * Used as the “topicName” element in the REST path (default: empty)
UseHttps true|false * Allow plugin to use HTTPS instead of HTTP (default: false)
Username “username” * VES collector user name (default: empty)
Password “passwd” * VES collector password (default: empty)
FunctionalRole “role” * Used as the ‘functionalRole’ field of ‘commonEventHeader’ event (default: Collectd VES Agent)
GuestRunning true|false * This option is used if the collectd is running on a guest machine, e.g this option should be set to true in this case. Defaults to false.
2.3.3. Other collectd.conf configurations
Please ensure that FQDNLookup is set to false
FQDNLookup false
Please ensure that the virt plugin is enabled and configured as follows. This configuration is is required only on a host side (‘GuestRunning’ = false).
LoadPlugin virt

<Plugin virt>
        Connection "qemu:///system"
        RefreshInterval 60
        HostnameFormat uuid
</Plugin>
Please ensure that the cpu plugin is enabled and configured as follows
LoadPlugin cpu

<Plugin cpu>
    ReportByCpu false
    ValuesPercentage true
</Plugin>
Please ensure that the aggregation plugin is enabled and configured as follows
LoadPlugin aggregation

<Plugin aggregation>
    <Aggregation>
            Plugin "cpu"
            Type "percent"
            GroupBy "Host"
            GroupBy "TypeInstance"
            SetPlugin "cpu-aggregation"
            CalculateAverage true
    </Aggregation>
</Plugin>
If plugin is running on a guest side, it is important to enable uuid plugin too. In this case the hostname in event message will be represented as UUID instead of system host name.
LoadPlugin uuid
If custom UUID needs to be provided, the following configuration is required in collectd.conf file:
<Plugin uuid>
    UUIDFile "/etc/uuid"
</Plugin>
Where “/etc/uuid” is a file containing custom UUID.
Please also ensure that the following plugins are enabled:
LoadPlugin disk
LoadPlugin interface
LoadPlugin memory
2.3.4. VES plugin notification example
A good example of collectD notification is monitoring of CPU load on a host or guest using ‘threshold’ plugin. The following configuration will setup VES plugin to send ‘Fault’ event every time a CPU idle value is out of range (e.g.: WARNING: CPU-IDLE < 50%, CRITICAL: CPU-IDLE < 30%) and send ‘Fault’ NORMAL event if CPU idle value is back to normal.
LoadPlugin threshold

<Plugin "threshold">
     <Plugin "cpu-aggregation">
        <Type "percent">
          WarningMin    50.0
          WarningMax   100.0
          FailureMin    30.0
          FailureMax   100.0
          Instance "idle"
          Hits 1
        </Type>
    </Plugin>
</Plugin>
More detailed information on how to configure collectD thresholds(memory, cpu etc.) can be found here at https://collectd.org/documentation/manpages/collectd-threshold.5.shtml
3. Barometer configuration Guide in OPNFV
3.1. Installing Collectd Ceilometer Fuel Plugin
- On the Fuel UI, create a new environment.
- In Settings > OpenStack Services
- Enable “Install Ceilometer and Aodh”
- In Settings > Other
- Enable “Deploy Collectd Ceilometer Plugin”
- Continue with environment configuration and deployment as normal.
3.1.1. Upgrading the plugin
From time to time new versions of the plugin may become available.
The plugin cannot be upgraded if an active environment is using the plugin.
In order to upgrade the plugin:
- Copy the updated plugin file to the fuel-master.
- On the Fuel UI, reset the environment.
- On the Fuel CLI “fuel plugins –update <fuel-plugin-file>”
- On the Fuel UI, re-deploy the environment.
4. Barometer Release Notes
4.1. Features to Date
This section provides a summary of the features implemented to date and their relevant upstream projects.
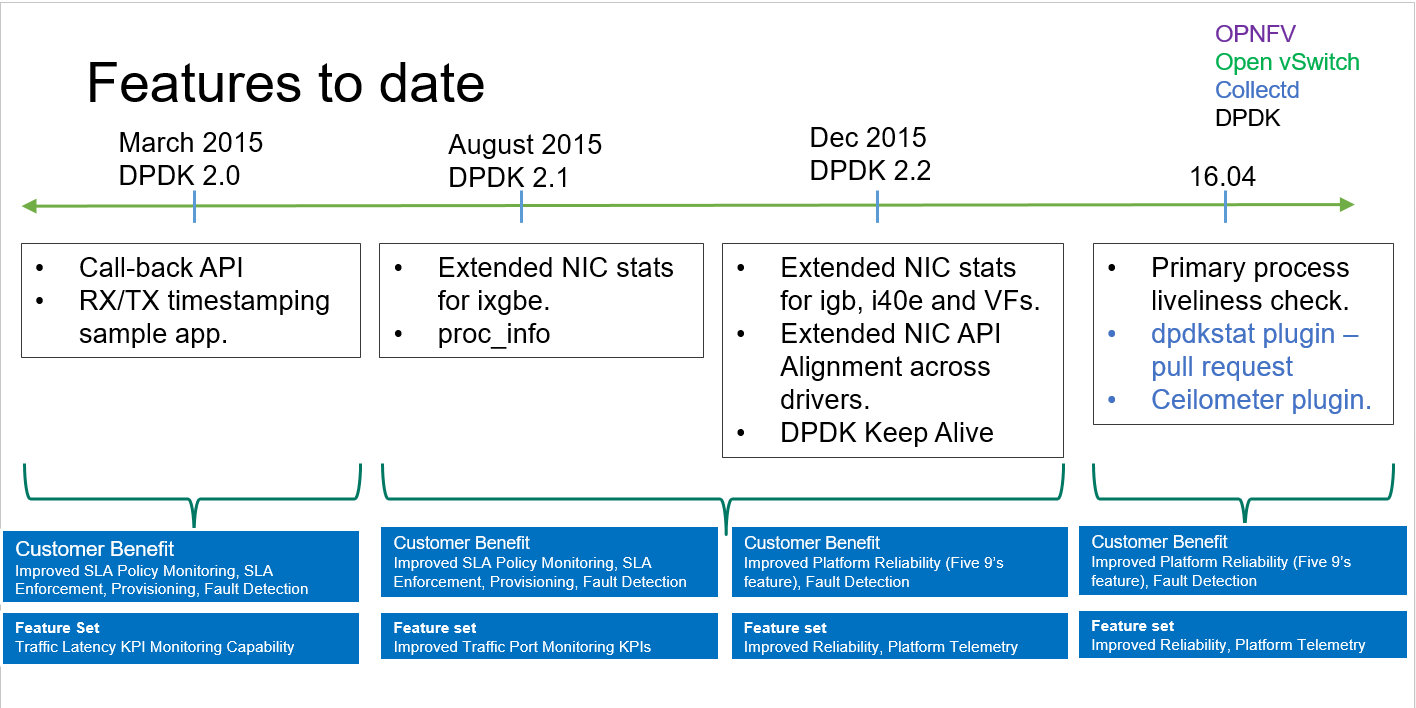
Barometer features to date
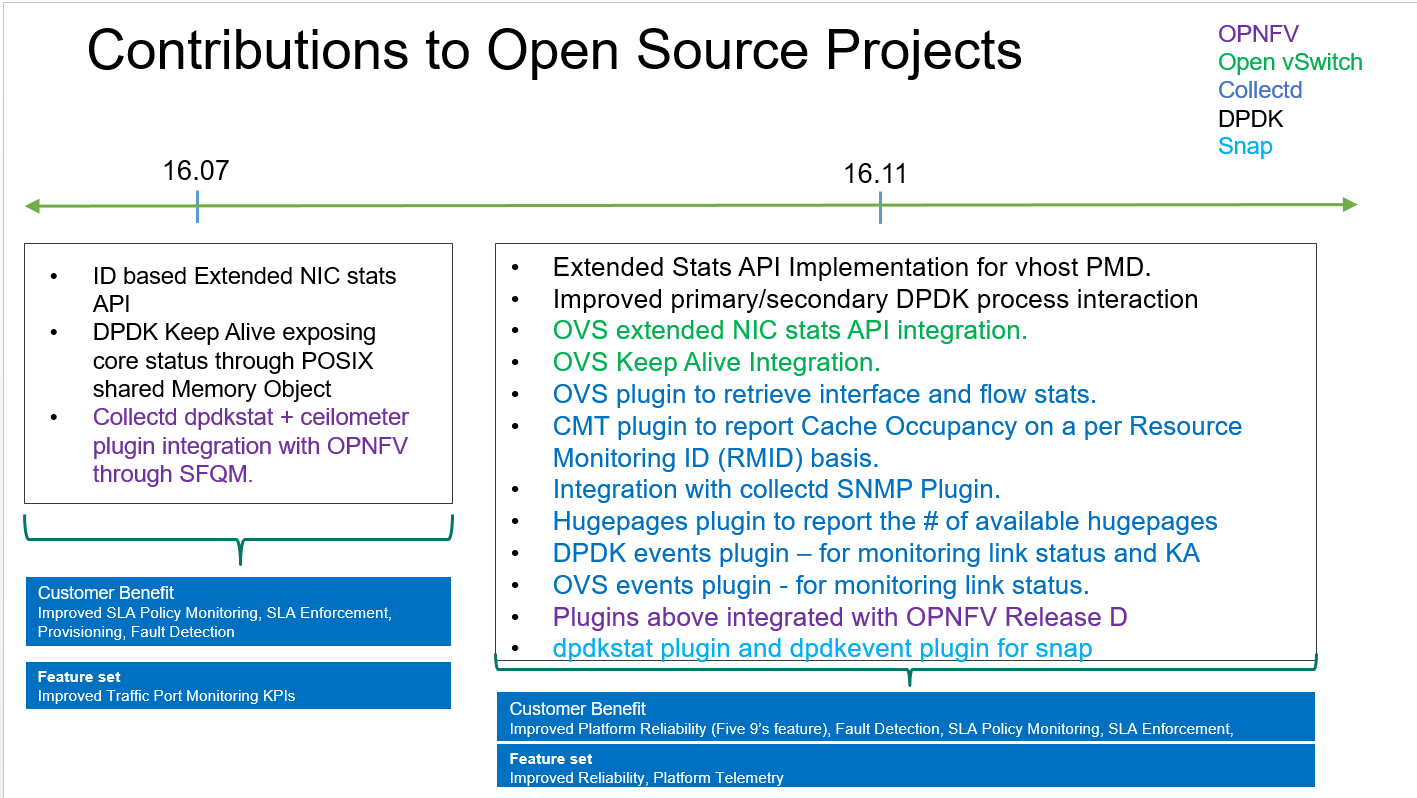
Barometer features to date cont.
Please note the timeline denotes DPDK releases.
4.2. Release B
The features implemented for OPNFV release B (as part of SFQM) in DPDK include:
- Callback API to enable TX/RX timestamping to measure latency through DPDK.
- Extended NIC statistics API for 1GB, 10GB and 40GB NICs to expose detailed statistics for DPDK interfaces in addition to the overall aggregate statistics.
- DPDK Keep Alive.
4.3. Release C
The features implemented for OPNFV release C (as part of SFQM) include:
- DPDK extended NIC stats API improvement; migrate from key value pairs to using id value pairs.
- DPDK Keep Alive improvement, so that core status is exposed through a posix shared memory object.
- collectd dpdkstat plugin that can retrieve DPDK interface statistics.
- collectd ceilometer plugin that can publish any statistics collected by collectd to ceilometer.
- Fuel plugin support for the collectd ceilometer plugin for OPNFV.