9. Infrastructure Operations and Lifecycle Management
9.1. Introduction
The purpose of this chapter is to define the capabilities required of the infrastructure to ensure it is effectively supported, maintained and otherwise lifecycle-managed by Operations teams. This includes requirements relating to the need to be able to maintain infrastructure services “in-service” without impacting the applications and workloads, whilst minimising human labour. It shall also capture any exceptions and related assumptions.
There are three main business operating frameworks that are commonly known and used across the Telecommunications industry related to the topics in this chapter:
FCAPS (ISO model for network management)
eTOM (TM Forum Business Process Framework (eTOM))
ITIL (ITIL 4.0 attempts to adapt IT Service Management practices to the cloud environment needs)
The chapters below roughly map to these frameworks as follows:
Chapter Name |
FCAPS |
eTOM |
ITIL |
|---|---|---|---|
Configuration and Lifecycle Management |
Configuration |
Fulfilment |
Configuration, Release, Change |
Assurance |
Performance, Fault |
Assurance |
Event, Incident |
Capacity Management |
Configuration |
Fulfilment |
Capacity Management |
Table 9-1: Operating Frameworks
Note: The above mapping is provided for the general orientation purpose only. Detailed mapping of the required Cloud Infrastructure Lifecycle Management capabilities to any of these frameworks is beyond the scope of this document.
9.2. Configuration and Lifecycle Management
Configuration management is concerned with defining the configuration of infrastructure and its components, and tracking (observing) the running configuration of that infrastructure, and any changes that take place. Modern configuration management practices such as desired state configuration management also mean that any changes from the desired state that are observed (aka the delta) are rectified by an orchestration / fulfilment component of the configuration management system. This “closed loop” mitigates against configuration drift in the infrastructure and its components. Our recommendation is to keep these closed loops as small as possible to reduce complexity and risk of error. Figure 9.1 shows the configuration management “loop” and how this relates to lifecycle management.
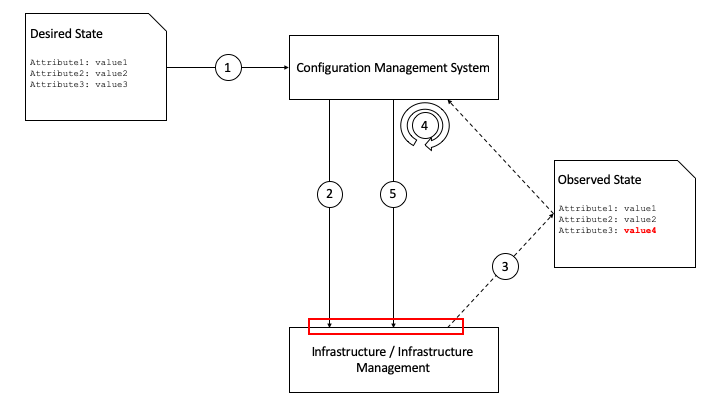
Figure 9.1 Configuration and Lifecycle Management
The initial desired state might be for 10 hosts with a particular set of configuration attributes, including the version of the hypervisor and any management agents. The configuration management system will take that as input (1) and configure the infrastructure as required (2). It will then observe the current state periodically over time (3) and in the case of a difference between the desired state and the observed state it will calculate the delta (4) and re-configure the infrastructure (5). For each lifecycle stage (create, update, delete) this loop takes place - for example if an update to the hypervisor version is defined in the desired state, the configuration management system will calculate the delta (e.g. v1 –> v2) and re-configure the infrastructure as required.
However, the key requirements for the infrastructure and infrastructure management are those interfaces and reference points in the red box - where configuration is set, and where it is observed. Table 9-2 lists the main components and capabilities required in order to manage the configuration and lifecycle of those components.
Component |
set / observe |
Capability |
Example |
|---|---|---|---|
Cloud Infrastructure Management Software |
Set |
Target software / firmware version |
Software: v1.2.1 |
Desired configuration attribute |
dhcp_lease_time: 86400 |
||
Desired component quantities |
# hypervisor hosts: 10 |
||
Observe |
Observed software / firmware version |
Software: v1.2.1 |
|
Observed configuration attribute |
dhcp_lease_time: 86400 |
||
Observed component quantities |
# hypervisor hosts: 10 |
||
Cloud Infrastructure Software |
Set |
Target software version |
Hypervisor software: v3.4.1 |
Desired configuration attribute |
management_int: eth0 |
||
Desired component quantities |
# NICs for data: 6 |
||
Observe |
Observed software / firmware version |
Hypervisor software: v3.4.1 |
|
Observed configuration attribute |
management_int: eth0 |
||
Observed component quantities |
# NICs for data: 6 |
||
Infrastructure Hardware |
Set |
Target software / firmware version |
Storage controller firmware: v10.3.4 |
Desired configuration attribute |
Virtual disk 1: RAID1 [HDD1,HDD2] |
||
Observe |
Observed software / firmware version |
Storage controller firmware: v10.3.4 |
|
Observed configuration attribute |
Virtual disk 1: RAID1 [HDD1,HDD2] |
Table 9-2: Configuration and Lifecycle Management Capabilities
This leads to the following table (Table 9-3) which defines the standard interfaces that should be made available by the infrastructure and Cloud Infrastructure Management components to allow for successful Configuration Management.
Component |
Interface Standard |
Link |
|---|---|---|
Infrastructure Management |
Defined in RA specifications |
RA-1, RA-2 |
Infrastructure Software |
Defined in RA specifications |
RA-1, RA-2 |
Infrastructure Hardware |
Redfish API |
DMTF RedFish specification [11] |
Table 9-3: Interface Standards for Configuration Management
9.3. Assurance
Assurance is concerned with:
The proactive and reactive maintenance activities that are required to ensure infrastructure services are available as per defined performance and availability levels.
Continuous monitoring of the status and performance of individual components and of the service as a whole.
Collection and analysis of performance data, which is used to identify potential issues including the ability to resolve the issue with no customer impact.
There are the following requirement types:
Data collection from all components, e.g.
The ability to collect data relating to events (transactions, security events, physical interface up/down events, warning events, error events, etc.)
The ability to collect data relating to component status (up/down, physical temperature, disk speed, etc.)
The ability to collect data relating to component performance (used CPU resources, storage throughput, network bandwidth in/out, API transactions, transaction response times, etc.)
Capabilities of the Infrastructure Management Software to allow for in-service maintenance of the Infrastructure Software and Hardware under its management, e.g.
The ability to mark a physical compute node as being in some sort of “maintenance mode” and for the Infrastructure Management Software to ensure all running workloads are moved off or rescheduled on to other available nodes (after checking that there is sufficient capacity) before marking the node as being ready for whatever maintenance activity needs to be performed
The ability to co-ordinate, automate, and allow the declarative input of in-service software component upgrades - such as internal orchestration and scheduler components in the Infrastructure Management Software
Note that the above only refers to components - it is expected that any “service” level assurance doesn’t add any further requirements onto the infrastructure, but rather takes the data extracted and builds service models based on the knowledge it has of the services being offered.
9.4. Capacity Management
Capacity Management is a potentially wide ranging process that includes taking demand across lines of business, analysing data about the infrastructure that is running, and calculating when additional infrastructure might be required, or when infrastructure might need to be decommissioned.
As such the requirements for Capacity Management on the infrastructure are covered by the Assurance and Configuration and Lifecycle Management sections above. The Assurance section deals with the collection of data - there is no reason to consider that this would be done by a different mechanism for Capacity Management as it is for Assurance - and the Configuration and Lifecycle Management section deals with the changes being made to the infrastructure hardware, software, and management components (e.g. changing of number of hypervisor hosts from 10 to 12).
9.5. Automation
9.5.1. Infrastructure LCM Automation
9.5.1.1. Introduction
In a typical telecom operator environment, infrastructure Life Cycle Management is highly complex and error-prone. The environment, with its multiple vendors and products, is maintenance expensive (both in terms of time and costs) because of the need for complex planning, testing, and the out-of-business-hours execution required to perform disruptive maintenance (e.g., upgrades) and to mitigate outages to mission-critical applications. Processes and tooling for infrastructure management across hybrid environments create additional complexity due to the different levels of access to infrastructure: hands-on access to the on-premise infrastructure but only restricted access to consumable services offered by public clouds.
Life cycle operations, such as software or hardware upgrades (including complex and risky firmware updates), typically involve time-consuming manual research and substantive testing to ensure that an upgrade is available, required, or needed, and does not conflict with the current versions of other components. In a complex and at-scale Hybrid Multi-Cloud environment, consisting of multiple on-premise and public clouds, such a manual process is ineffective and, in many cases, impossible to execute in a controlled manner. Hence, the need for automation.
The goals of LCM are to provide a reliable administration of a system from its provisioning, through its operational stage, to its final retirement.
Key functions of Infrastructure LCM are:
Hybrid, Multi-Cloud support, that is, LCM works across physical, virtual, and cloud environments, supporting on-premise, cloud, and distributed environments
Complete system life cycle control (Plan/Design, Build, Provision, Operate/Manage, Retire, Recycle/Scrap)
Enablement for automation of most system maintenance tasks
Key benefits of the Infrastructure LCM Automation are:
Agility: standardisation of the LCM process by writing and running IaaC allows to quickly and easily develop, stage, and produce environments
Operational Consistency: automation of lifecycle results in consistently maintaining desired state, reduces the possibility of errors and decreases the chances of incompatibility issues within the infrastructure
Human related Risks Mitigation: automation reduces risks related to human errors, rogue activities, and safeguards the institutional knowledge from leakage in case any employee leaves the organization
Higher Efficiency: achieved by minimizing human inaccuracies and eliminating the lack of knowledge about infrastructure installed base and its configuration, using the CI/CD techniques adapted to infrastructure
Cost/time Saving: engineers save up on time and cost which can be wisely invested in performing higher-value jobs; additional cost savings on cloud more optimal use of cloud resources using LCM Automation
9.5.1.2. Infrastructure LCM Automation Framework
The following diagrams provide mapping between different stages of the lifecycle automation across all layers of the stack, to owners of infrastructure and cloud and the tenant as the consumer of the cloud services, in three very different scenarios: applications running as containers within virtual machines (CaaS on IaaS scenario), application running as containers on bare metal (CaaS on BM scenario) and a more traditional view of applications running as VNFs within virtual machines (IaaS scenario). The diagrams define the scope of the Infrastructure LCM Automation for each of these scenarios. The dotted lines symbolise the interactions between the layers of each of the model.
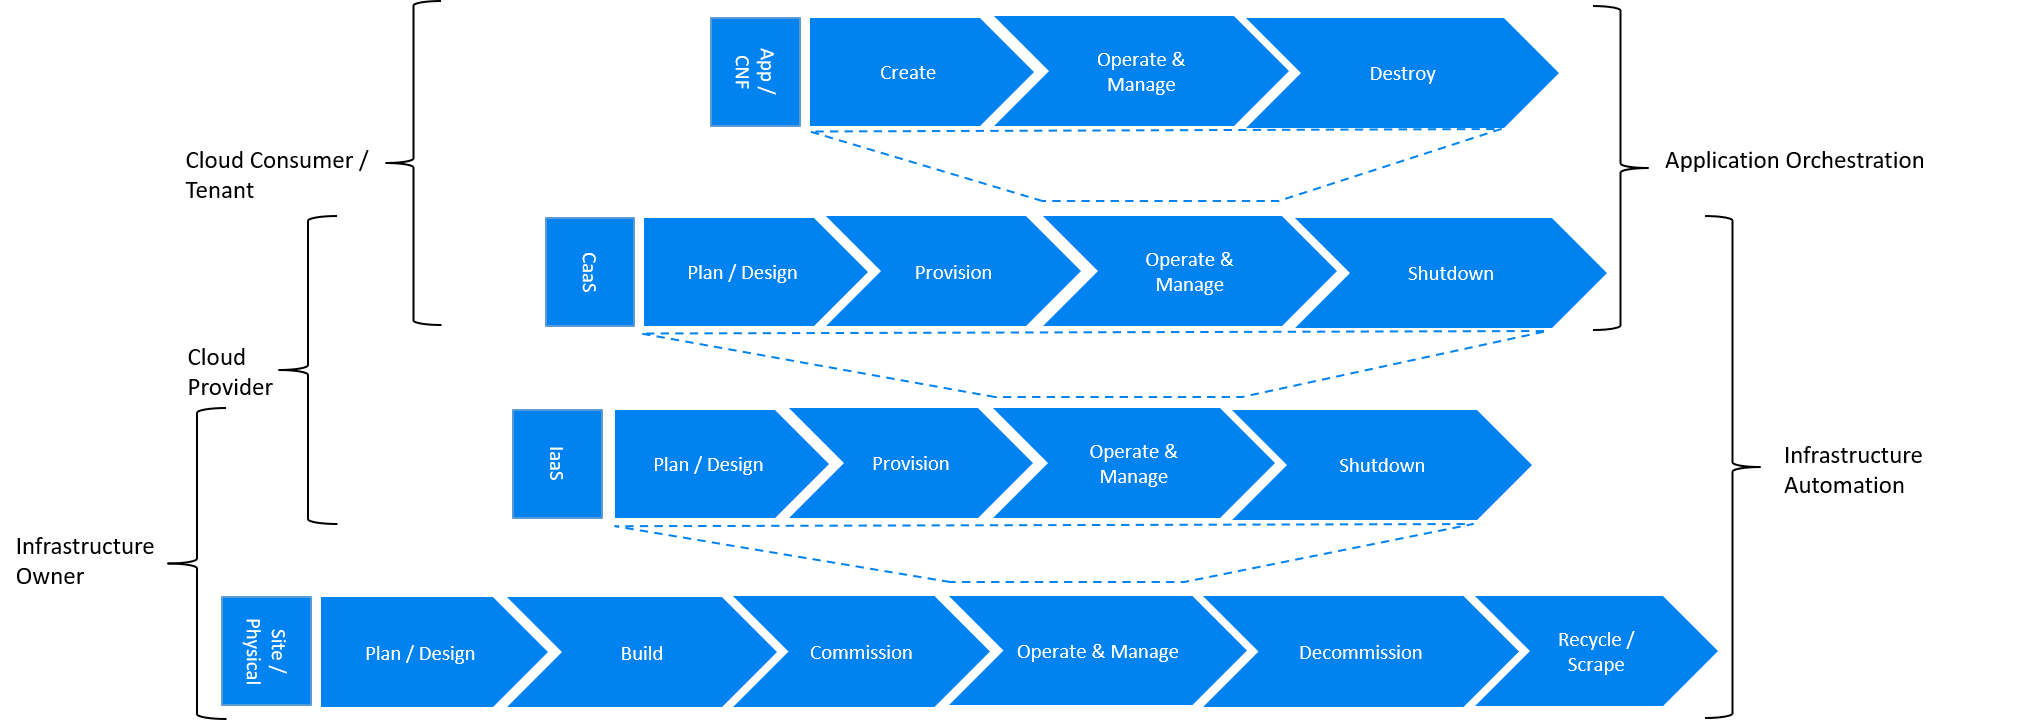
Figure 9.2 Infrastructure Automation in CaaS on IaaS scenario
In the CaaS on IaaS scenario, the Infrastructure Automation scope covers the Site/Physical layer, IaaS layer and CaaS layer. From the lifecycle perspective (the left hand side of the diagram), Site/Physical layer is entirely owned by the Infrastructure Owner, the virtualised infrastructure layer (IaaS) is shared between the Infrastructure Owner and the Cloud Provider. Similarly, the container orchestration layer (CaaS) is shared between the Cloud Provider and the Cloud Consumer / Tenant. These relationships can be illustrated by a situation, where a telecom operator owns the physical infrastructure on which an external cloud provider runs the virtualisation software (hypervisor). Sharing CaaS layer between the Cloud Provider and the Cloud Consumer reflects the fact that the container management/orchestration software like Kubernetes is lifecycled by the Cloud Provider (for instance when scaling out containers) but also by the Cloud Consumer because of the very close lifecycle relationship between an application and a container in this model. For instance, destroying an application means also destroying related containers, Hence CaaS can be also considered as a part of the Application Orchestration layer.
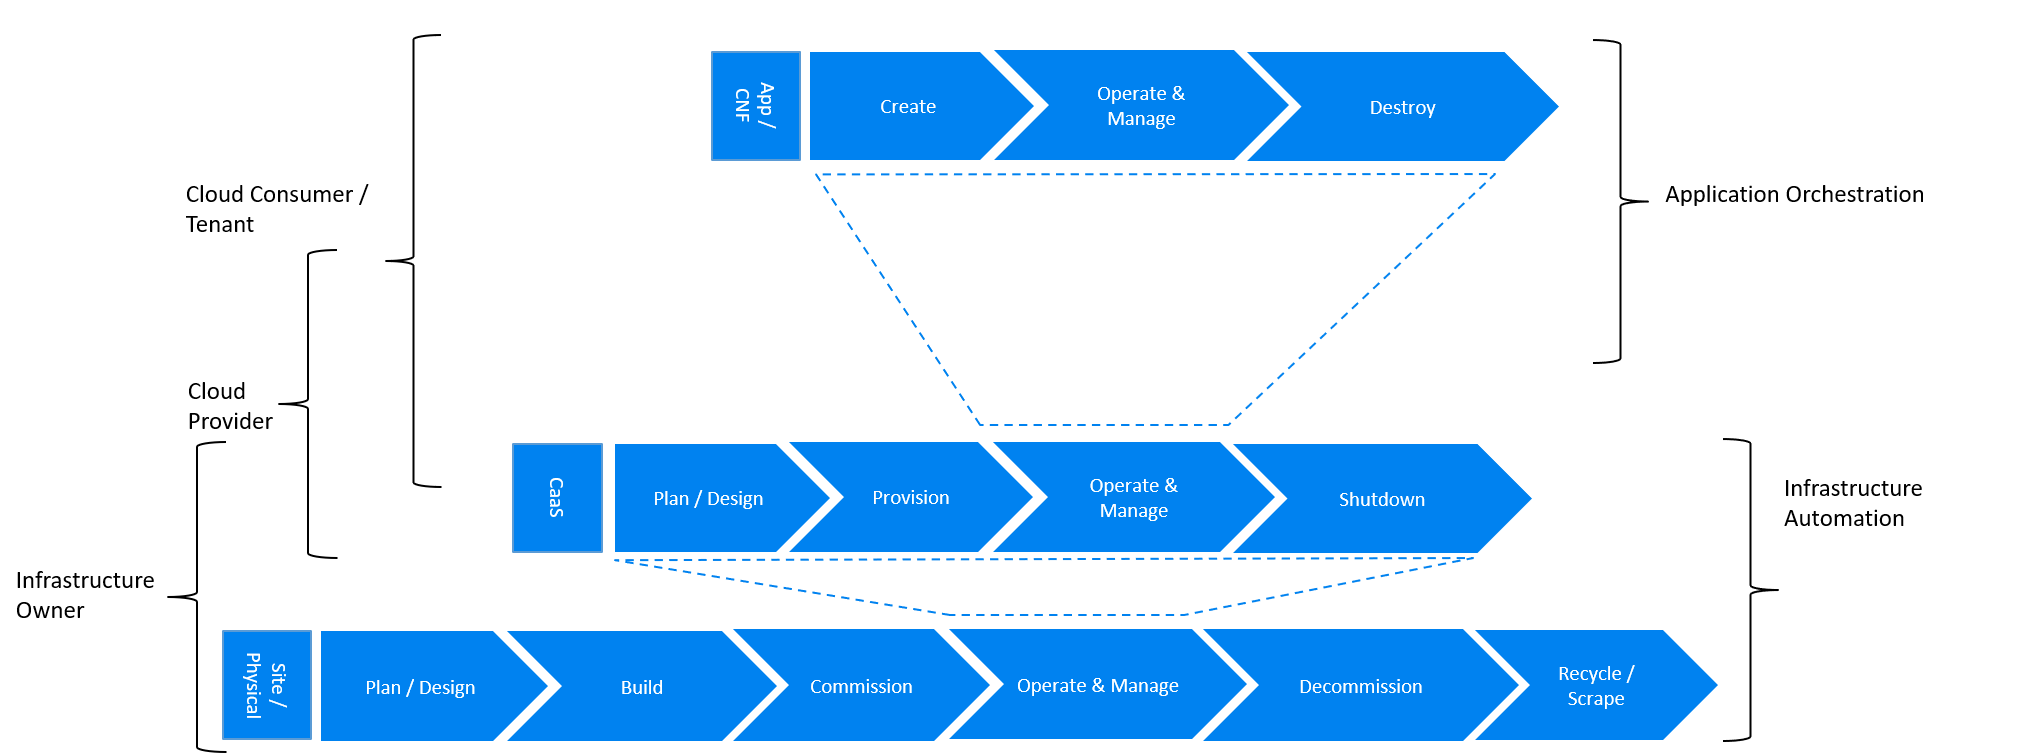
Figure 9.3 Infrastructure Automation in CaaS on BM scenario
The main and obvious difference in the Caas on BM scenario is lack of the IaaS layer, and hence the scope of the Infrastructure Automation is limited to only two layers: Site/Physical and CaaS. From the lifecycle ownership perspective, the CaaS layer is now shared not only between the Cloud Provider and the Cloud Consumer (for the same reasons as in the CaaS on IaaS scenario) but also with the Infrastructure Owner. The latter observation is related to the fact that in the bare metal deployments lacking the hypervisor separation, the CaaS layer is much more dependent on the underlying physical infrastructure.
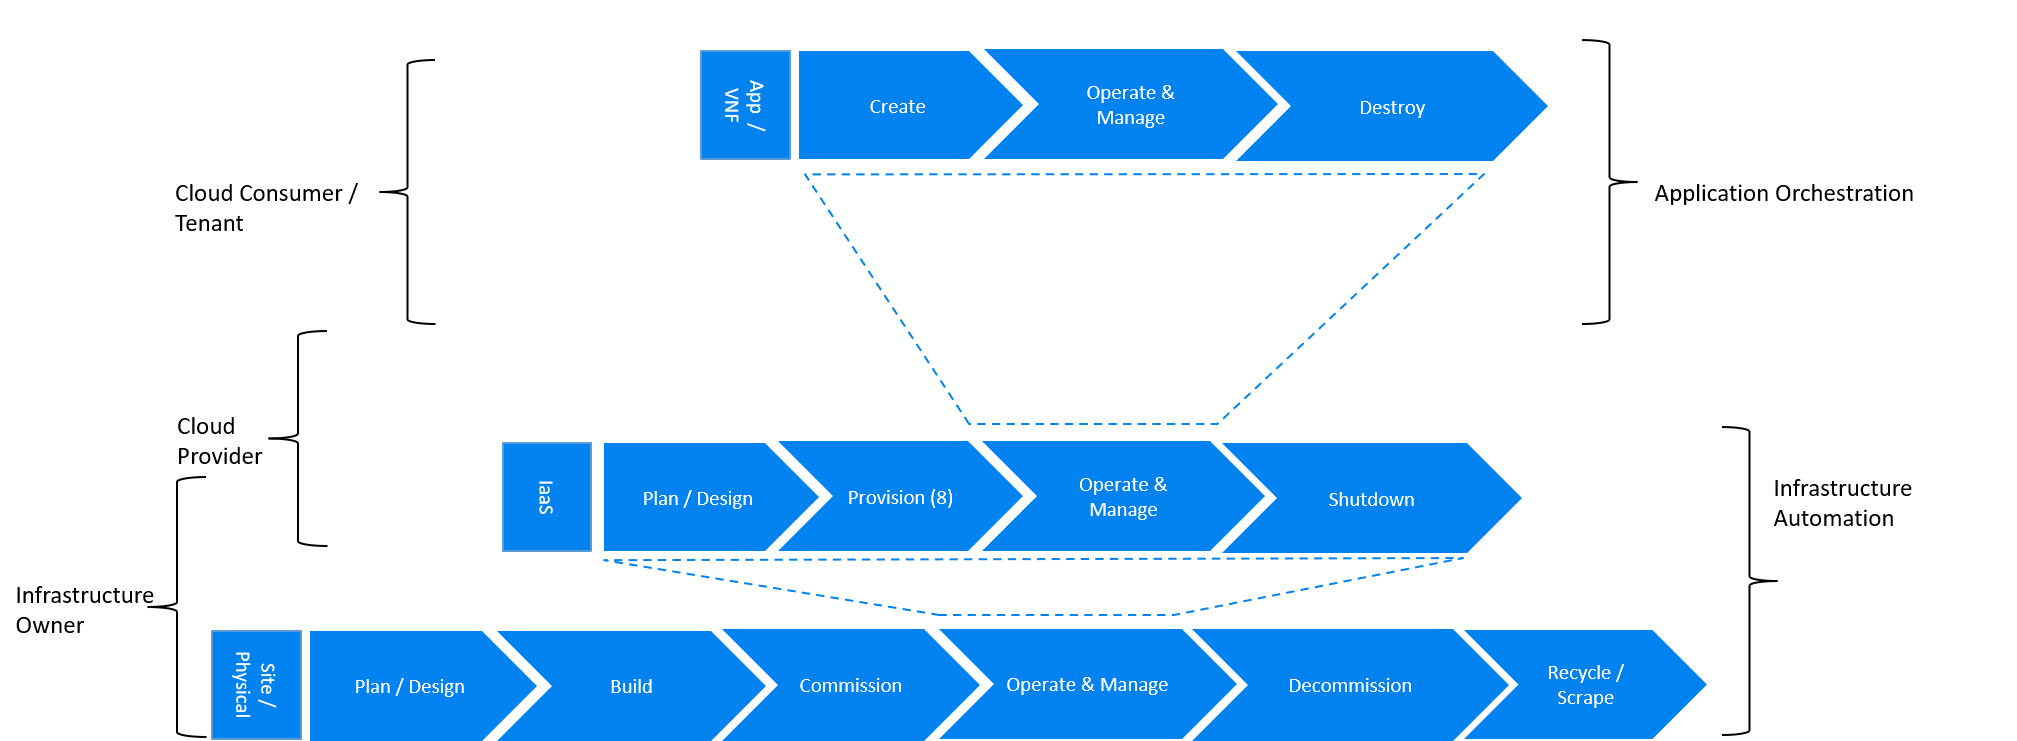
Figure 9.4 Infrastructure Automation in IaaS scenario
In this “classical” scenario the scope of the Infrastructure Automation is defined by the Site/Physical and IaaS layers. From the lifecycle perspective the ownership of IaaS is shared between the Infrastructure Owner and the Cloud Provider. This scenario is characterised by a clear separation between the lifecycle (and hence its automation) of infrastructure and the application lifecycle owned by the Cloud Consumer / Tenant in the role of the Application Owner.
Essential foundation functional blocks for Infrastructure LCM automation:
Representation Model
Repository functions
Available Software Versions and Dependencies
Orchestration Engine
Automated LCM uses Representation Model to:
abstract various automation technologies
promote evolution from automation understood as automation of human tasks to autonomous systems using intent-based, declarative automation, supported by evolving AI/ML technologies
Automated LCM uses Repository functions to:
store and manage configuration data
store and manage metrics related data such as event data, alert data, and performance data
maintain currency of data by the use of discovery of current versions of software modules
track and account for all systems, assets, subscriptions (monitoring)
provide an inventory of all virtual and physical assets
provide a topological view of interconnected resources
support network design function
Automated LCM uses available IAC Software Versions and Dependencies component to:
store information about available software versions, software patches and dependency expectations
determine the recommended version of a software item (such as firmware) and dependencies on other items in the node to ensure compliance and maintain the system integrity
determine the recommended versions of foundation software running on the cluster
Automated LCM uses Orchestration Engine to:
dynamically remediate dependencies during the change process to optimise outcome
ensure that the system is consistent across its life cycle by maintaining it in accordance with the intent templates
9.5.1.3. LCM Automation Principles / Best Practice
The following principles should guide best practice in the area of the Infrastructure LCM Automation:
Everything Codified: use explicit coding to configure files not only for initial provisioning but also as a single source of truth for the whole infrastructure lifecycle, to ensure consistency with the intent configuration templates and to eliminate configuration drift
Version Controlled: use stringent version control for the infrastructure code to allow proper lifecycle automation
Self-Documentation: code itself represents the updated documentation of the infrastructure, to minimise the documentation maintenance burden and to ensure the documentation currency
Code Modularisation: apply to IaaC principles of the microservices architecture where the modular units of code can be independently deployed and lifecycled in an automated fashion
Immutability: IT infrastructure components are required to be replaced for each deployment during the system lifecycle to be consistent with immutable infrastructure to avoid configuration drift and to restrict the impact of undocumented changes in the stack
Automated Testing: is the key for the error-free post-deployment lifecycle processes and to eliminate lengthy manual testing processes
Unified Automation: use the same Infrastructure LCM Automation templates, toolsets and procedures across different environments such as Dev, Test, QA and Prod, to ensure consistency of the lifecycle results and to reduce operational costs
Security Automation: security of infrastructure is critical for the overall security, dictating to use consistent automated security procedures for the threat detection, investigation and remediation through all infrastructure lifecyle stages and all environments
9.5.2. Software Onboarding Automation and CI/CD Requirements
9.5.2.1. Software Onboarding Automation
For software deployment, as far as Cloud Infrastructure services or workloads are concerned, automation is the core of DevOps concept. Automation allows to eliminate manual processes, reducing human errors and speeding software deployments. The prerequisite is to install CI/CD tools chain to:
Build, package, test application/software
Store environment’s parameters and configurations
Automate the delivery and deployment
The CI/CD pipeline is used to deploy, test and update the Cloud Infrastructure services, and also to onboard workloads hosted on the infrastructure. Typically, this business process consists of the following key phases:
Tenant Engagement and Software Evaluation:
In this phase the request from the tenant to host a workload on the Cloud Infrastructure platform is assessed and a decision made on whether to proceed with the hosting request.
If the Cloud infrastructure software needs to be updated or installed, an evaluation is made of the impacts (including to tenants) and if it is OK to proceed
This phase may also involve the tenant accessing a pre-staging environment to perform their own evaluation and/or pre-staging activities in preparation for later onboarding phases.
Software Packaging:
The main outcome of this phase is to produce the software deployable image and the deployment manifests (such as TOSCA blueprints or HEAT templates or Helm charts) that will define the Cloud Infrastructure service attributes.
The software packaging can be automated or performed by designated personnel, through self-service capabilities (for tenants) or by the Cloud Infrastructure Operations team.
Software Validation and Certification:
In this phase the software is deployed and tested to validate it against the service design and other Operator specific acceptance criteria, as required.
Software validation and certification should be automated using CI/CD toolsets / pipelines and Test as a Service (TaaS) capabilities.
Publish Software:
Tenant Workloads: After the software is certified the final onboarding process phase is for it to be published to the Cloud Infrastructure production catalogue from where it can be instantiated on the Cloud Infrastructure platform by the tenant.
Cloud Infrastructure software: After the software is certified, it is scheduled for deployment in concurrence with the user community.
All phases described above can be automated using technology specific toolsets and procedures. Hence, details of such automation are left for the technology specific Reference Architecture and Reference Implementation specifications.
9.5.2.2. Software CI/CD Requirements
The requirements including for CI/CD for ensuring software security scans, image integrity checks, OS version checks, etc. prior to deployment, are listed in the Table 9-4 (below). Please note that the tenant processes for application LCM (such as updates) are out of scope. For the purpose of these requirements, CI includes Continuous Delivery, and CD refers to Continuous Deployment.
Ref # |
Description |
Comments/Notes |
|---|---|---|
auto.cicd.001 |
The CI/CD pipeline must support deployment on any cloud and cloud infrastructures including different hardware accelerators. |
CI/CD pipelines automate CI/CD best practices into repeatable workflows for integrating code and configurations into builds, testing builds including validation against design and operator specific criteria, and delivery of the product onto a runtime environment. Example of an open-source cloud native CI/CD framework is the Tekton project (https://tekton.dev/) |
auto.cicd.002 |
The CI/CD pipelines must use event-driven task automation |
|
auto.cicd.003 |
The CI/CD pipelines should avoid scheduling tasks |
|
auto.cicd.004 |
The CI/CD pipeline is triggered by a new or updated software release being loaded into a repository |
The software release cane be source code files, configuration files, images, manifests. Operators may support a single or multiple repositories and may, thus, specify which repository is to be used for these release. An example, of an open source repository is the CNCF Harbor (https://goharbor.io/) |
auto.cicd.005 |
The CI pipeline must scan source code and manifests to validate for compliance with design and coding best practices. |
|
auto.cicd.006 |
The CI pipeline must support build and packaging of images and deployment manifests from source code and configuration files. |
|
auto.cicd.007 |
The CI pipeline must scan images and manifests to validate for compliance with security requirements. |
See section 7.9 ( Consolidated Security Requirements). Examples of such security requirements include only ingesting images, source code, configuration files, etc. only form trusted sources. |
auto.cicd.008 |
The CI pipeline must validate images and manifests |
Example, different tests |
auto.cicd.009 |
The CI pipeline must validate with all hardware offload permutations and without hardware offload |
|
auto.cicd.010 |
The CI pipeline must promote validated images and manifests to be deployable. |
Example, promote from a development repository to a production repository |
auto.cicd.011 |
The CD pipeline must verify and validate the tenant request |
Example, RBAC, request is within quota limits, affinity/anti-affinity, … |
auto.cicd.012 |
The CD pipeline after all validations must turn over control to orchestration of the software |
|
auto.cicd.013 |
The CD pipeline must be able to deploy into Development, Test and Production environments |
|
auto.cicd.014 |
The CD pipeline must be able to automatically promote software from Development to Test and Production environments |
|
auto.cicd.015 |
The CI pipeline must run all relevant Reference Conformance test suites |
|
auto.cicd.016 |
The CD pipeline must run all relevant Reference Conformance test suites |
Table 9-4: Automation CI/CD
9.5.2.3. CI/CD Design Requirements
A couple of CI/CD pipeline properties and rules must be agreed between the different actors to allow smoothly deploy and test the cloud infrastructures and the hosted network functions whatever if the jobs operate open-source or proprietary software. They all prevent that specific deployment or testing operations force a particular CI/CD design or even worse ask to deploy a full dedicated CI/CD toolchain for a particular network service.
At first glance, the deployment and test job must not basically ask for a specific CI/CD tools such as Jenkins or Gitlab CI/CD. But they are many other ways where deployment and test jobs can constraint the end users from the build servers to the artefact management. Any manual operation is discouraged whatever it’s about the deployment or the test resources.
The following requirements also aims at deploying smoothly and easily all CI/CD toolchains via simple playbooks as targeted by the Reference Conformance suites currently leveraging XtestingCI.
Ref # |
Description |
Comments/Notes |
|---|---|---|
design.cicd.001 |
The pipeline must allow chaining of independent CI/CD jobs |
For example, all deployment and test operations from baremetal to Kubernetes, OpenStack, to the network services |
design.cicd.002 |
The pipeline jobs should be modular |
This allows execution of jobs independently of others, for example, start with an existing OpenStack deployment |
design.cicd.003 |
The pipeline must decouple the deployment and the test steps |
|
design.cicd.004 |
The pipeline should leverage the job artefacts specified by the operator provided CI/CD tools |
|
design.cicd.005 |
The pipeline must execute all relevant Reference Conformance suites without modification |
|
design.cicd.006 |
Software vendors/providers must utilise operator provided CI/CD tools |
|
design.cicd.007 |
All jobs must be packaged as containers |
|
design.cicd.008 |
All jobs must leverage a common execution to allow templating all deployment and test steps |
|
design.cicd.009 |
The deployment jobs must publish all outputs as artefacts in a specified format |
For example, OpenStack RC, kubeconfig, yaml, etc. Anuket shall specify formats in RC |
design.cicd.010 |
The test jobs must pull all inputs as artefacts in a specified format |
For example, OpenStack RC, kubeconfig, yaml, etc. Anuket shall specify formats in RC |
design.cicd.011 |
The test jobs must conform with the Reference Conformance test case integration requirements |
Table 9-5: CI/CD Design
9.5.3. Tenant Creation Automation
9.5.3.1. Pre-tenant Creation Requirements
Topics include:
Tenant Approval – use, capacity, data centres, etc.
Validate that the Tenant’s (see Operational and Administrative Terminology) planned use meets the Operators Cloud Use policies
Validate that the capacity available within the requests cloud site(s) can satisfy the Tenant requested quota for vCPU, RAM, Disk, Network Bandwidth
Validate that the Cloud Infrastructure can meet Tenant’s performance requirements (e.g. I/O, latency, jitter, etc.)
Validate that the Cloud Infrastructure can meet Tenant’s resilience requirements
For environments that support Profiles and Workload Flavours:
Verify that any requested private flavours have been created
Verify that the metadata for these private flavours have been created
Verify that the tenant has permissions to use the requested private flavours
Validate that host aggregates are available for specified flavours (public and private)
Verify that the metadata matches for the requested new flavours and host aggregates
Tenant Networks
Verify that the networks requested by the tenant exist
Verify that the security policies are correctly configured to only approved ingress and egress
Tenant Admin, Tenant Member and other Tenant Role approvals for user by role
Add all Tenant Members and configure their assigned roles in the Enterprise Identity and Access management system (e.g., LDAP)
Verify that these roles have been created for the Tenant
Tenant Images and manifests approvals
Verify and Validate Tenant Images and manifests: virus scan, correct OS version and patch, etc. (Please note that Tenants may also add other images or replace existing images after their environments are created and will also be subjected to image security measures.)
Create, Verify and Validate Tenant
Create Tenant
Using a proto- or Tenant provided HEAT-template/Helm-chart for a NF and perform sanity test (e.g., using scripts test creation of VM/container, ping test, etc.)
9.6. Telemetry and Observability
Operating complex distributed systems, such as a Telco network, is a demanding and challenging task that is continuously being increased as the network complexity and the production excellence requirements grow. There are multiple reasons why it is so, but they originate in the nature of the system concept. To reach the ability of providing Telco services, a complex system is decomposed into multiple different functional blocks, called network functions. Internal communication between the diverse network functions of a distributed system is based on message exchange. To formalize this communication, clearly defined interfaces are introduced, and protocols designed. Even though the architecture of a Telco network is systematically formalized on the worldwide level, heterogeneity of services, functions, interfaces, and protocols cannot be avoided. By adding the multi-vendor approach in implementation of Telco networks, the outcome is indeed a system with remarkably high level of complexity which requires significant efforts for managing and operating it.
To ensure proper support and flawless work in the large ecosystem of end user services, a formalized approach directed towards high reliability and scalability of systems is required. The discipline which applies well known practices of software engineering to operations is called Site Reliability Engineering. It was conceived at Google, as a means to overcome limitations of the common DevOps approach.
Common supporting system (OSS – Operation Support System, BSS – Business Support System) requirements are redefined, driven by introduction of new technologies in computing infrastructure and modern data centres with abstraction of resources – known as virtualization and cloud computing. This brings many advantages – such as easy scaling, error recovery, reaching a high level of operational autonomy etc., but also many new challenges in the Telecom network management space. Those novel challenges are mostly directed towards the dynamical nature of the system, orientation towards microservices instead of a silo approach, and huge amounts of data which have to be processed in order to understand the internal status of the system. Hence the need of improved ways to monitor systems - observability.
9.6.1. Why Observability
Knowing the status of all services and functions at all levels in a cloud based service offering is essential to act fast, ideally pro-actively before users notice and, most importantly, before they call the help desk.
Common approach to understand the aforementioned Telco network status in conventional non-cloud environments is referred to as monitoring. Usually it would include metric information related to resources, such as CPU, memory, HDD, Network I/O, but also business related technical key performance indicators (KPIs) such as number of active users, number of registrations, etc. This monitoring data are represented as a time series, retrieved in regular intervals, usually with granulation of 5 to 30 minutes. In addition, asynchronous messages such as alarms and notifications are exposed by the monitored systems in order to provide information about foreseen situations. It is worth noting that metric data provide approximation of the health of the system, while the alarms and notifications try to bring more information about the problem. In general, they provide information about known unknowns - anticipated situations occurring at random time. However, this would very rarely be sufficient information for understanding the problem (RCA - root cause analysis), therefore it is necessary to retrieve more data related to the problem - logs and network signalization. Logs are application output information to get more granular information about the code execution. Network packet captures/traces are useful since telecommunication networks are distributed systems where components communicate utilizing various protocols, and the communication can be examined to get details of the problem.
As the transition towards cloud environments takes place simultaneously with the introduction of DevOps mindset, the conventional monitoring approach becomes suboptimal. Cloud environments allow greater flexibility as the microservice architecture is embraced to bring improvements in operability, therefore the automation can be utilized to a higher extent than ever before. Automation in telecom networks usually supposes actions based on decisions derived from system output data (system observation). In order to derive useful decisions, data with rich context are necessary. Obviously, the conventional monitoring approach has to be improved in order to retrieve sufficient data, not only from the wider context, but also without delays - as soon as data are produced or available. The new, enhanced approach was introduced as a concept of observability, borrowed from the control theory which states that it is possible to make conclusions about a system’s internal state based on external outputs.
This requires the collection of alarms and telemetry data from the physical layer (wires), the cloud infrastructure up to the network, applications and services (virtualized network functions (VNF)) running on top of the cloud infrastructure, typically isolated by tenants.
Long term trending data are essential for capacity planning purposes and typically collected, aggregated and kept over the full lifespan. To keep the amount of data collected manageable, automatic data reduction algorithms are typically used, e.g. by merging data points from the smallest intervals to more granular intervals.
The telco cloud infrastructure typically consists of one or more regional data centres, central offices, and edge sites. These are managed from redundant central management sites, each hosted in their own data centres.
The network services and applications deployed on a Telco Cloud, and the Telco Cloud infrastructure are usually managed by separate teams, and, thus, the monitoring solution must be capable of keeping the access to the monitoring data isolated between tenants and Cloud Infrastructure operations. Some monitoring data from the Cloud Infrastructure layer must selectively be available to tenant monitoring applications in order to correlate, say, the Network Functions/Services data with the underlying cloud infrastructure data.
9.6.1.1. What to observe
Typically, when it comes to data collection, three questions arise:
What data to collect?
Where to send the data?
Which protocol/interface/format to use?
9.6.1.2. What data to collect
Assessment on what data to collect should start by iterating over the physical and virtual infrastructure components:
Network Services across sites and tenants
Virtualized functions per site and tenant
Individual Virtual Machines and Containers
Virtualization infrastructure components
Physical servers (compute) and network elements
Tool servers with their applications (DNS, Identity Management, Zero Touch Provisioning, etc.)
Cabling
9.6.1.3. Data categories
There are four main observability categories: metrics, events, logs and traces:
Metrics or telemetry report counters and gauge levels and can either be pulled periodically e.g. via SNMP or REST, or pushed as streams using gRPC, NETCONF, which receivers registered for certain sensors, or by registering as a publisher to a message broker. These messages must be structured in order to get parsed successfully.
Events indicate state variance beyond some specified threshold, are categorized by severity, often with a description of what just happened. Most common transport protocol is SNMP with its trap and inform messages). These messages are generated by network elements (physical and logical). In addition, the messages can also be generated by monitoring applications with statically configured thresholds or dynamically by Machine Learning (ML) algorithms - generally, they are describing anomalies.
Logs are a record messages generated by software for most devices (compute and network) and virtual applications and transported over SYSLOG and tend to come in high volumes.
Traces are end-to-end signalling messages (events) created to fulfil execution of requests on the distributed system services. OTHER WORDS: Traces are all action points executed in order to provide response to the request set to the distributed system service. Even the call can be thought of as a request which starts by INVITE message of the SIP protocol.
9.6.1.4. Where to send the data
If the observability data have to be sent from their sources (or producers) to specific destinations (or consumers), then this creates high degree of dependency between producers and consumers, and is extremely prone to errors, especially in case of configuration changes. Ideally, the data producers must not be impacted with any change in the data consumers and vice versa. This is achieved by decoupling data producers from data consumers through the use of Brokers. The Producers always send their data to the same endpoint - the Broker. While the Consumers register with the Broker for data that is of interest to them and always receive their data from the Broker.
9.6.1.5. Which protocol, interface, and format to use
While protocols and interfaces are dictated by the selection of the message broker (common data bus) system, data format is usually customizable according to the needs of users. The concept of Schema Registry mechanism, well known in the world of big data, is helpful here to make sure that message structures and formats are consistently used.
9.6.2. The Architecture
In geographically dispersed large cloud deployments, a given telco cloud may have several cloud infrastructure components as well a large set of virtualized workloads (VNF/CNFs). It is important to monitor all of these workloads and infrastructure components. Furthermore, it is even more important to be able to correlate between the metrics provided by these entities to determine the performance and/or issues in such deployments.
The cloud deployment tends to shrink and expand based upon the customer demand. Therefore, an architecture is required that can scale on demand and does not force a strong tie between various entities. This means, the workloads and cloud infrastructure components that provide telemetry and performance metrics must not be burdened to discover each other. The capacity (e.g. speed, storage) of one component must not force overrun or underrun situations that would cause critical data to be lost or delayed to a point to render them useless.
Operators in charge of the cloud infrastructure (physical infra plus virtualization platform) require very detailed alarms and metrics to efficiently run their platform. While they need indicators about how well or poorly individual virtual machines and containers run, they don’t need a view inside these workloads. In fact, what and how workloads do should not be accessible to NFVI operators. The architecture must allow for different consumers to grant or deny access to available resources.
Multiple workloads or network services can be deployed onto one or more sites. These workloads require logical separation so that their metrics don’t mix by accident or simply based on security and privacy requirements. This is achieved by deploying these workloads within their own tenant space. All virtualization platforms offer such isolation down to virtual networks per tenant.
9.6.2.1. Push vs. Pull
Two widely deployed models for providing telemetry data are pull and push.
9.6.2.1.1. Pull Model
Typical characteristics of a pull model are:
The consumers are required to discover the producers of the data
Once the producers are identified, there should be a tight relationship (synchronization) between the producer and consumer. This makes the systems very complex in terms of configuration and management. For example, if a producer moves to a different location or reboots/restarts, the consumer must re-discover the producer and bind their relationship again.
Data are pulled explicitly by the consumer. The consumer must have appropriate bandwidth, compute power, and storage to deal with this data - example SNMP pull/walks
A problem with Pull is that both consumers and producers have to have means for load/performance regulation in cases where the set of consumers overload the pull request serving capabilities of the producer.
9.6.2.1.2. Push Model
Typical characteristics of a push model are:
Declarative definition of destination - The producers of data know explicitly where to stream/push their data
A “well known” data broker is utilized - all consumers and producers know about it through declarative definition. The data broker can be a bus such as RabitMQ, Apache Kafka, Apache Pulsar
No restrictions on the bandwidth or data storage constraints on producers or consumers. Producers produce the data and stream/push it to the broker and consumers pull the data from the broker. No explicit sync is required between producers and consumers.
LCM (Life Cycle Management) events, such as moves, reboot/restarts, of consumers or producers have no impact on others.
Producers and consumers can be added/removed at will. No impact on the system. This makes this model very flexible and scalable and better suited for large (or small) geographically dispersed telco clouds.
Example of push model are gRPC, SNMP traps, syslogs
9.6.2.2. Producers, Consumers, and Message broker
In an ideal case, observability data will be sent directly to the message broker in agreed format, so that consumers can take and “understand“ the data without additional logic. Message brokers do not limit on the data types:
Enforcing correct message structures (carrying the data) is performed using Schema Registry concepts. Even though it is not necessary to use a Schema Registry, it is highly recommended.
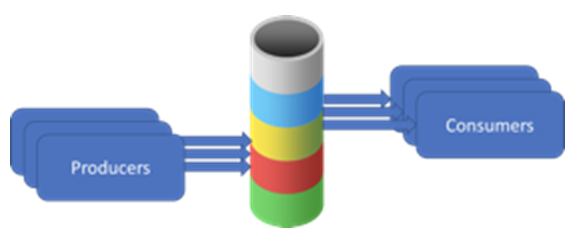
Figure 9.5 Producers and Consumers
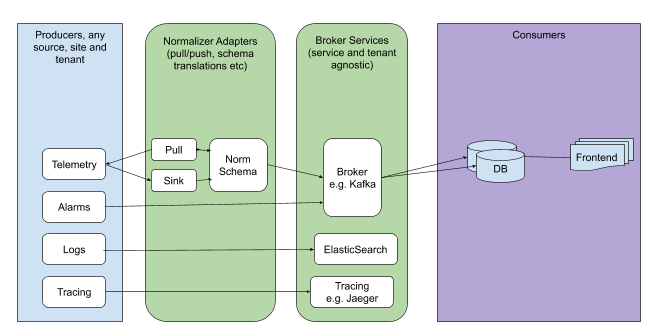
Figure 9.6 Broker Services