5. Measuring Telco Traffic and Performance KPIs
This section will discuss the SFQM features that enable Measuring Telco Traffic and Performance KPIs.

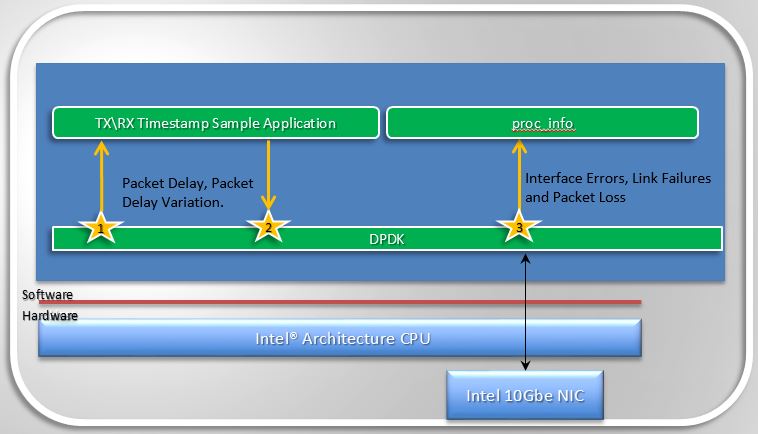
Fig. 5.1 Measuring Telco Traffic and Performance KPIs
- The very first thing SFQM enabled was a call-back API in DPDK and an associated application that used the API to demonstrate how to timestamp packets and measure packet latency in DPDK (the sample app is called rxtx_callbacks). This was upstreamed to DPDK 2.0 and is represented by the interfaces 1 and 2 in Figure 1.2.
- The second thing SFQM implemented in DPDK is the extended NIC statistics API,
which exposes NIC stats including error stats to the DPDK user by reading the
registers on the NIC. This is represented by interface 3 in Figure 1.2.
- For DPDK 2.1 this API was only implemented for the ixgbe (10Gb) NIC driver, in association with a sample application that runs as a DPDK secondary process and retrieves the extended NIC stats.
- For DPDK 2.2 the API was implemented for igb, i40e and all the Virtual Functions (VFs) for all drivers.
- For DPDK 16.07 the API migrated from using string value pairs to using id value pairs, improving the overall performance of the API.
6. Monitoring DPDK interfaces
With the features SFQM enabled in DPDK to enable measuring Telco traffic and performance KPIs, we can now retrieve NIC statistics including error stats and relay them to a DPDK user. The next step is to enable monitoring of the DPDK interfaces based on the stats that we are retrieving from the NICs, by relaying the information to a higher level Fault Management entity. To enable this SFQM has been enabling a number of plugins for collectd.
6.1. collectd
collectd is a daemon which collects system performance statistics periodically and provides a variety of mechanisms to publish the collected metrics. It supports more than 90 different input and output plugins. Input plugins retrieve metrics and publish them to the collectd deamon, while output plugins publish the data they receive to an end point. collectd also has infrastructure to support thresholding and notification.
6.1.1. Statistics and Notifications
Within collectd notifications and performance data are dispatched in the same way. There are producer plugins (plugins that create notifications/metrics), and consumer plugins (plugins that receive notifications/metrics and do something with them).
Statistics in collectd consist of a value list. A value list includes:
- Values, can be one of:
- Derive: used for values where a change in the value since it’s last been read is of interest. Can be used to calculate and store a rate.
- Counter: similar to derive values, but take the possibility of a counter wrap around into consideration.
- Gauge: used for values that are stored as is.
- Absolute: used for counters that are reset after reading.
- Value length: the number of values in the data set.
- Time: timestamp at which the value was collected.
- Interval: interval at which to expect a new value.
- Host: used to identify the host.
- Plugin: used to identify the plugin.
- Plugin instance (optional): used to group a set of values together. For e.g. values belonging to a DPDK interface.
- Type: unit used to measure a value. In other words used to refer to a data set.
- Type instance (optional): used to distinguish between values that have an identical type.
- meta data: an opaque data structure that enables the passing of additional information about a value list. “Meta data in the global cache can be used to store arbitrary information about an identifier” [7].
Host, plugin, plugin instance, type and type instance uniquely identify a collectd value.
Values lists are often accompanied by data sets that describe the values in more detail. Data sets consist of:
- A type: a name which uniquely identifies a data set.
- One or more data sources (entries in a data set) which include:
- The name of the data source. If there is only a single data source this is set to “value”.
- The type of the data source, one of: counter, gauge, absolute or derive.
- A min and a max value.
Types in collectd are defined in types.db. Examples of types in types.db:
bitrate    value:GAUGE:0:4294967295
counter    value:COUNTER:U:U
if_octets  rx:COUNTER:0:4294967295, tx:COUNTER:0:4294967295
In the example above if_octets has two data sources: tx and rx.
Notifications in collectd are generic messages containing:
- An associated severity, which can be one of OKAY, WARNING, and FAILURE.
- A time.
- A Message
- A host.
- A plugin.
- A plugin instance (optional).
- A type.
- A types instance (optional).
- Meta-data.
6.2. collectd plugins
SFQM has enabled three collectd plugins to date:
- dpdkstat plugin: A read plugin that retrieve stats from the DPDK extended
NIC stats API.
ceilometer plugin: A write plugin that pushes the retrieved stats to Ceilometer. It’s capable of pushing any stats read through collectd to Ceilometer, not just the DPDK stats.
hugepages plugin: A read plugin that retrieves the number of available and free hugepages on a platform as well as what is available in terms of hugepages per socket.
Other plugins in progress:
- dpdkevents: A read plugin that retrieves DPDK link status and DPDK forwarding cores liveliness status (DPDK Keep Alive).
- Open vSwitch stats Plugin: A read plugin that retrieve flow and interface stats from OVS.
- Open vSwitch events Plugin: A read plugin that retrieves events from OVS.
6.3. Monitoring Interfaces and Openstack Support

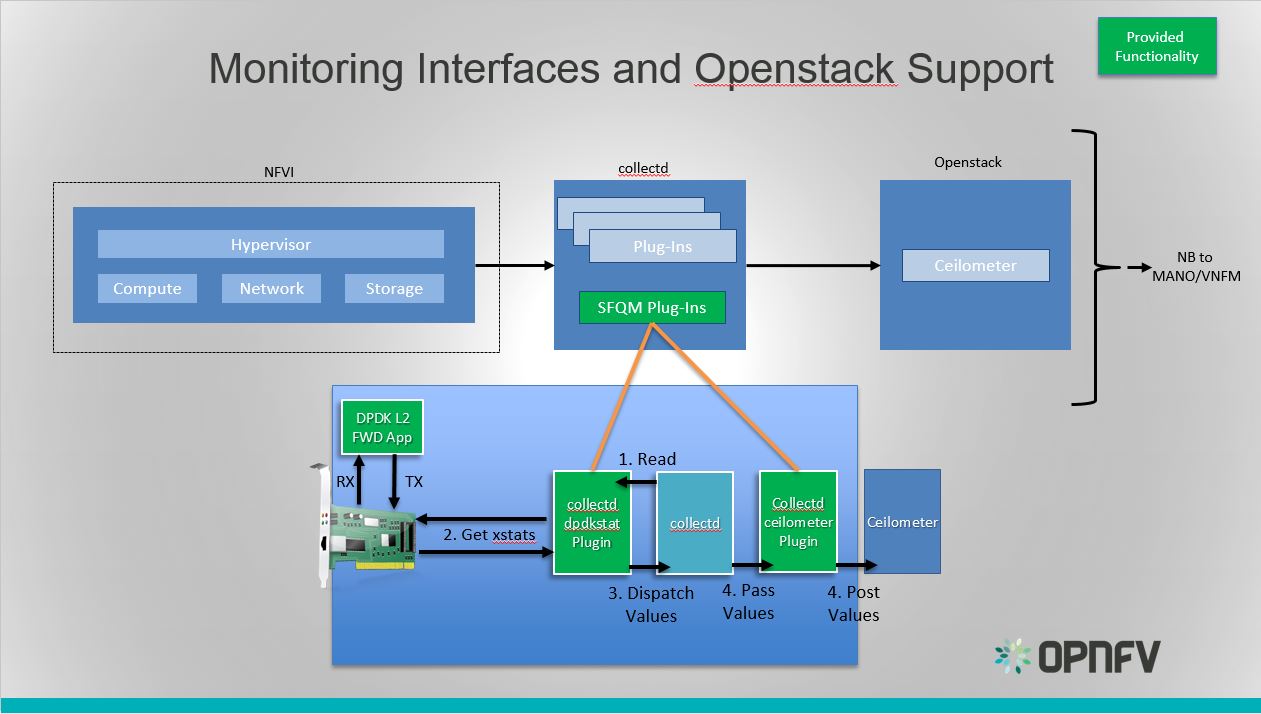
Fig. 6.1 Monitoring Interfaces and Openstack Support
The figure above shows the DPDK L2 forwarding application running on a compute node, sending and receiving traffic. collectd is also running on this compute node retrieving the stats periodically from DPDK through the dpdkstat plugin and publishing the retrieved stats to Ceilometer through the ceilometer plugin.
To see this demo in action please checkout: SFQM OPNFV Summit demo
6.4. References
[1] https://collectd.org/wiki/index.php/Naming_schema [2] https://github.com/collectd/collectd/blob/master/src/daemon/plugin.h [3] https://collectd.org/wiki/index.php/Value_list_t [4] https://collectd.org/wiki/index.php/Data_set [5] https://collectd.org/documentation/manpages/types.db.5.shtml [6] https://collectd.org/wiki/index.php/Data_source [7] https://collectd.org/wiki/index.php/Meta_Data_Interface
