5. Measuring Telco Traffic and Performance KPIs
This section will look at what SFQM has done to enable Measuring Telco Traffic and Performance KPIs.
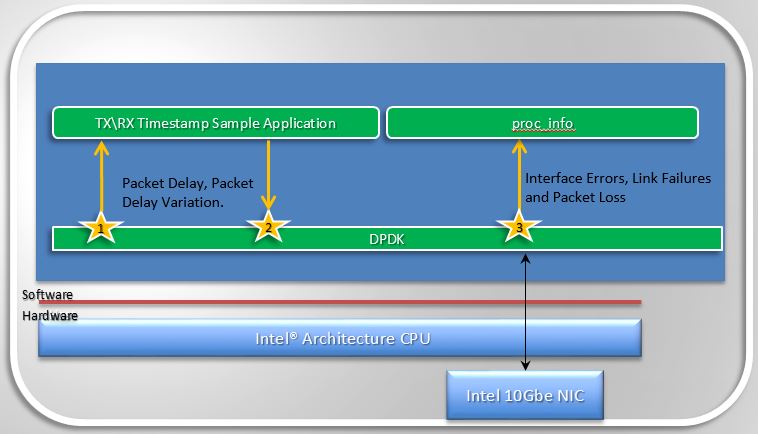
Fig. 5.1 Measuring Telco Traffic and Performance KPIs
- The very first thing SFQM enabled was a call-back API in DPDK and an associated application that used the API to demonstrate how to timestamp packets and measure packet latency in DPDK (the sample app is called rxtx_callbacks). This was upstreamed to DPDK 2.0 and is represented by the interfaces 1 and 2 in Figure 1.2.
- The second thing SFQM implemented in DPDK is the extended NIC statistics API,
which exposes NIC stats including error stats to the DPDK user by reading the
registers on the NIC. This is represented by interface 3 in Figure 1.2.
- For DPDK 2.1 this API was only implemented for the ixgbe (10Gb) NIC driver, in association with a sample application that runs as a DPDK secondary process and retrieves the extended NIC stats.
- For DPDK 2.2 the API was implemented for igb, i40e and all the Virtual Functions (VFs) for all drivers.
6. Monitoring DPDK interfaces
With the features SFQM enabled in DPDK to enable measuring Telco traffic and performance KPIs, we can now retrieve NIC statistics including error stats and relay them to a DPDK user. The next step is to enable monitoring of the DPDK interfaces based on the stats that we are retrieving from the NICs, and relay the information to a higher level Fault Management entity. To enable this SFQM has been enabling a number of plugins for collectd.
collectd is is a daemon which collects system performance statistics periodically and provides mechanisms to store the values in a variety of ways. It supports more than 90 different plugins to retrieve platform information, such as CPU utilization, and is capable of publishing/writing the information is gathers to a number of endpoints through its write plugins.
SFQM has been enabling two collectd plugins to collect DPDK NIC statistics and push the stats to Ceilometer:
- dpdkstat plugin: A read plugin that retrieve stats from the DPDK extended NIC stats API.
- ceilometer plugin: A write plugin that pushes the retrieved stats to Ceilometer. It’s capable of pushing any stats read through collectd to Ceilometer, not just the DPDK stats.
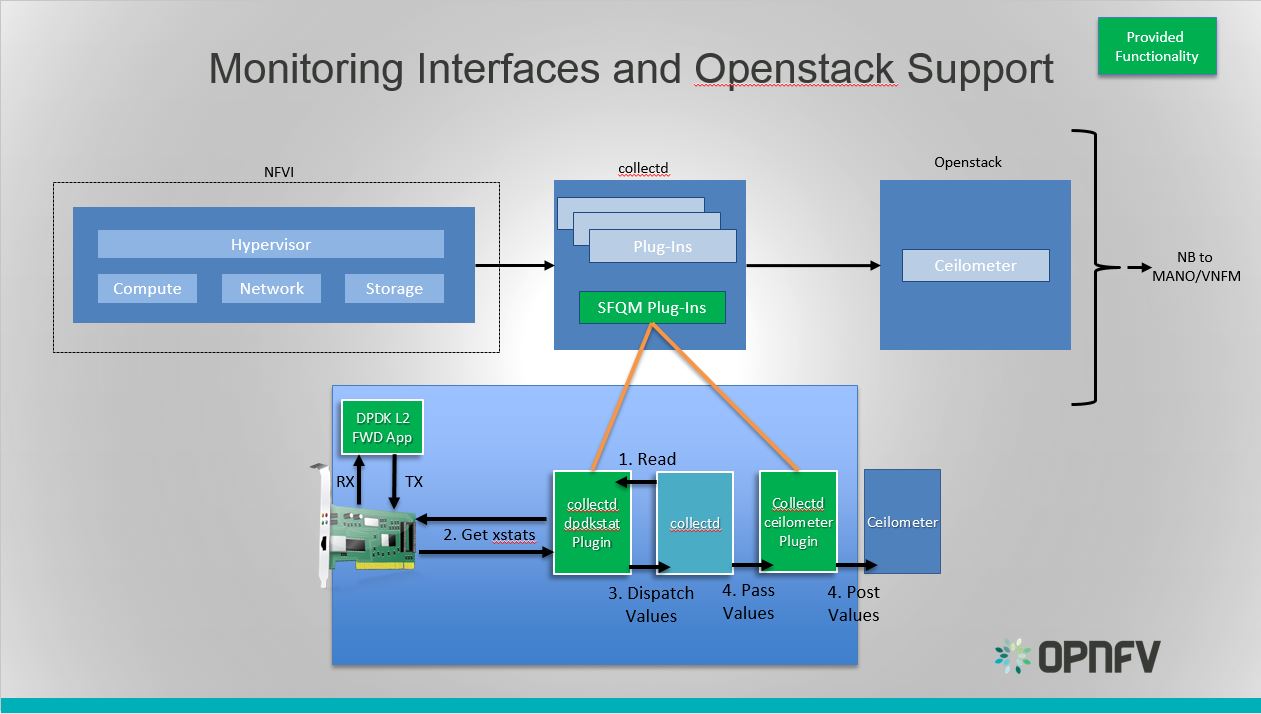
Fig. 6.1 Monitoring Interfaces and Openstack Support
The figure above shows the DPDK L2 forwarding application running on a compute node, sending and receiving traffic. collectd is also running on this compute node retrieving the stats periodically from DPDK through the dpdkstat plugin and publishing the retrieved stats to Ceilometer through the ceilometer plugin.
To see this demo in action please checkout: SFQM OPNFV Summit demo
Future enahancements to the DPDK stats plugin include:
- Integration of DPDK Keep Alive functionality.
- Implementation of the ability to retrieve link status.